Article

Energy and Environmental Life Cycle Assessment of Sustainable Pavement Materials and Technologies for Urban Roads

by
Filippo G. Praticò
1,
Marinella Giunta
2,*,
Marina Mistretta
3 and
Teresa Maria Gulotta
4
1
Department of Information, Infrastructure and Sustainable Energy (DIIES), Via Graziella, Feo di Vito, University Mediterranea of Reggio Calabria, 89214 Reggio Calabria, Italy
2
Department of Civil, Energy, Environmental and Material Engineering (DICEAM), via Graziella, Feo di Vito, University Mediterranea of Reggio Calabria, 89100 Reggio Calabria, Italy
3
Department of Heritage, Architecture, Urbanism (PAU), Via dell’Università, 25, University Mediterranea of Reggio Calabria, 89124 Reggio Calabria, Italy
4
Department of Engineering, Viale delle Scienze, University of Palermo, 90128 Palermo, Italy
*
Author to whom correspondence should be addressed.
Sustainability 2020, 12(2), 704; https://0-doi-org.brum.beds.ac.uk/10.3390/su12020704
Submission received: 18 December 2019 / Revised: 8 January 2020 / Accepted: 16 January 2020 / Published: 18 January 2020
(This article belongs to the Special Issue Towards Sustainable Engineering: New Technologies and Methodologies)

Abstract

:
Recycled and low-temperature materials are promising solutions to reduce the environmental burden deriving from hot mix asphalts. Despite this, there is lack of studies focusing on the assessment of the life-cycle impacts of these promising technologies. Consequently, this study deals with the life cycle assessment (LCA) of different classes of pavement technologies, based on the use of bituminous mixes (hot mix asphalt and warm mix asphalt) with recycled materials (reclaimed asphalt pavements, crumb rubber, and waste plastics), in the pursuit of assessing energy and environmental impacts. Analysis is developed based on the ISO 14040 series. Different scenarios of pavement production, construction, and maintenance are assessed and compared to a reference case involving the use of common paving materials. For all the considered scenarios, the influence of each life-cycle phase on the overall impacts is assessed to the purpose of identifying the phases and processes which produce the greatest impacts. Results show that material production involves the highest contribution (about 60–70%) in all the examined impact categories. Further, the combined use of warm mix asphalts and recycled materials in bituminous mixtures entails lower energy consumption and environmental impacts due to a reduction of virgin bitumen and aggregate consumption, which involves a decrease in the consumption of primary energy and raw materials, and reduced impacts for disposal. LCA results demonstrate that this methodology is able to help set up strategies for eco-design in the pavement sector.

1. Introduction

Nowadays, sustainability is a great concern in pavement construction and management. Reducing carbon footprint and energy consumption requires materials and technologies aiming at improving the practices for construction and maintenance and at minimizing environmental burdens.
In fact, traditionally, flexible pavements are built using hot mix asphalt (HMA), a mixture of bitumen and virgin aggregates produced at temperatures in the range of 150–170 °C. Virgin aggregates require a consumption of natural resources, while high temperatures imply large quantities of energy, waste gasses, particulate matters, volatile organic compounds (VOC), Sulphur dioxide, nitrogen oxides, carbon monoxide, and carbon dioxide [1,2].
In this view, recycling and producing bituminous mixtures at lower temperatures are promising solutions to reduce the environmental burden due to the production of HMA. In the pursuit of reducing the consumption of natural resources and the use of landfills, there has been a growing interest in the following solutions: recycled materials, such as reclaimed asphalt pavement (RAP) [3,4], crumb rubber (CR) from end-of-life tires (ELTS) [5,6,7], solid waste and by-product (W) [8,9]. At the same time pavement technologies such as warm mix asphalt (WMA) [10,11], half warm mix asphalt (HWMA) [2] and in-place recycling [12,13] have been developed with the purpose of reducing energy consumption. In this paper, attention is focused on WMA, RAP, CR and plastic waste.
The term warm-mix asphalts (WMAs) refers to the asphalt mixtures produced, transported and compacted at temperatures 20 to 30 °C lower than the traditional HMAs [1]. WMAs lead to cleaner production processes, with significant environmental and technical benefits. The environmental benefits derive from lower temperatures that produce a reduction of the energy consumption required (burning fuels to heat mixture components) and a decrease of greenhouse gases and carbon footprint. Benefits could refer also to (i) the enhanced compaction of layers, (ii) the possibility to haul the mixtures to greater distances and (iii) the possibility to pave for a longer period of the year [14].
Furthermore, WMAs are also safer for construction workers in asphalt plants and on site, due to less odors and fumes.
The basic principle of WMAs is to have a suitable viscosity of bitumen so that mixtures can be mixed and compacted at a relatively lower temperature, without drawbacks for the performance and the durability of pavement layers that should remain at least the same, but could be even greater than the ones of traditional HMAs. A better behavior in service is expected due to (i) reduced aging of the binder during production with positive effect for durability and (ii) easier compaction and improved density.
Three main technologies have been developed and used in Europe to produce WMA [2], namely:
  • Foaming process, where the addition of additives (usually synthetic zeolite) during mixing at the plant creates pockets of gas in the asphalt binder. This is a water–related process in which the dosage of additive is 0.3–1% by total weight of the mix, while the dosage of water by the mass of bitumen is 1–2%.
  • Addition of additives made up of organic components (i.e., wax from Fischer-Tropsch processes, amides composed of a fatty acid and of another component—amine and lignite—or Montan wax), with a percentage from 1% to 4% by the weight of bitumen.
  • Addition of other additives (for example, emulsification agents or polymers) in a percentage of 0.3–0.5% by the mass of bitumen.
The use of some additives (i.e., Montan wax) requires additional mixing time, with detrimental effects on energy saving.
As for WMAs contras, even if specific drawbacks can be associated to the different technologies, it is possible to point out several weaknesses [15]: rutting, probably caused by the lower ageing of the binder due to the lower temperatures during production; moisture susceptibility, which may result in rutting phenomena of the pavement surface [16]; cost effectiveness, due the higher initial costs for the additives [17].
Warm technology is successful applied to the production of dense-graded and open-graded (porous) asphalt concretes [18].
The environmental benefits of WMAs can be amplified blending this technology with the use of RAP. This new construction practice aims at superposing the environmental and economic values of the two technologies, although concerns about WMA and high RAP percentages remain.
From a technical standpoint, WMA with a high RAP percentage can be helpful in two ways: viscosity reduction and lessened aging of the binder (because of the lower temperatures) [14]. Previous studies demonstrate the feasibility of the combined application of WMA and very high RAP percentages [19]. However, WMA can present good mechanical properties when RAP is applied properly, because high percentages of RAP enhance the rutting resistance but result in higher moisture susceptibility [20,21].
Sustainability demands that porous asphalts (an increasingly widespread type of asphalt for better storm water and noise management) are produced at lower production temperatures and using high quantities of reclaimed materials [18,22].
In a comprehensive evaluation of the performance of WMA-RAP mixtures, the following aspects should be considered: (i) the influence of different WMA technologies, (ii) the pavement layer where mixture is placed, (iii) the different percentages of fractionated RAP from the same source, (iv) the rutting resistance and the moisture susceptibility connected to the use of WMA and (v) the cracking and fatigue resistance for the presence of high-RAP contents [21].
Waste plastic (WP) usage in pavement construction is becoming an interesting subject for sustainable development. In fact, with plastics being non-biodegradable products, they remain on site and cause environmental pollution [23].
WP can be added to the bitumen (e.g., in the proportion of 1–8% by bitumen weight), to modify binder properties (i.e., increase the softening point, wet process), or blended with aggregates before adding bitumen to the mix (dry process). When these WPs are mixed with bitumen, the mixture is found to give higher strength, durability and better water proofing properties. To coat the aggregates, plastic chips are first shredded usually to a size ranging from 2 to 5 mm and spread uniformly over preheated aggregates. The quantity of plastics can vary from 0% to 10% (by weight of bitumen). Coating affects the physical parameters of aggregates: reduced percentage of voids and higher hardness and toughness of stones can be observed [24]. WP improves the viscoelastic properties, Marshall Quotient, binding, and stripping properties of the mixture. Roads containing plastic waste perform satisfactorily in terms of skid resistance, texture depth, resistance against cracking and rutting.
The use of crumb rubber (CR) from ELTS (end-of-life tires), as a bitumen modifier or as an additive or an aggregate [25] in the mixture, is a practice that has become increasingly consolidated, because it improves the sustainability and the durability of asphalt mixtures. From an environmental standpoint, the consideration of these materials contributes to tackle a significant environmental challenge. In fact, if not recycled, the disposal of tires, by means of landfill or burning, produces disastrous ecological consequences and serious threat for human health. The use of CR, for completely or partially replacing virgin aggregate, reduces the need of exploitation of natural resources. Another significant environmental benefit relies on the reduction of noise pollution.
CRs enhance the technical properties of asphalt mixtures. As a binder modifier, they improve the complex modulus (high temperature) and reduce the stiffness at low temperatures. At high temperatures, this implies an enhancement of rutting resistance, while at low temperatures, cracking resistance is improved [7]. Consequently, this increases the life expectancy of pavements.
The energy and environmental performance of the abovementioned materials and technologies calls for the consideration of many classes of impacts and for methods able to perform sound analyses [26,27,28]. In such a context, life cycle assessment (LCA) is a suitable procedure able to assess the environmental burdens associated with road pavements from initial construction [29], to outline the eco-profile of a road [30], and to provide knowledge-based comparative statements [31,32].
In this paper, the energy and environmental performance of several bituminous mixtures for road pavement are evaluated by means of a life-cycle method that complies with ISO 14040 and 14044 [33,34]. Evaluations are performed for an Italian urban road. Different pavement technologies and scenarios are considered (hot mix asphalt, warm mix asphalt, reclaimed asphalt pavements, crumb rubber, waste plastics). The goal is to recognize the best scenario from the standpoint of energy consumption and environmental impact. Each step of pavement life is analyzed and the pertaining impacts are quantified, taking into account production, transport, construction, maintenance and end-of-life of road pavements, in order to identify the relevant hotspots during the whole life cycle.

2. Materials and Methods

2.1. Goal and Scope Definition

LCA was applied in order to assess the energy and environmental impacts of bituminous mixtures used in a pavement of an urban, two-lane, single carriageway, 1 km long and 9.5 m wide. Five different types of bituminous mixtures were defined for the pavements under analysis. Consequently, a contribution analysis was performed in order to estimate the share of the total impacts of each examined life cycle step and to identify the best pavement technologies in terms of energy and environmental performances.
Impact assessment was carried out according to the ILCD midpoint 2011 method, where ILCD stands for International Life Cycle Data System [35]. The following impact categories were selected:
  • Global energy requirement (GER);
  • Climate change (CC);
  • Ozone depletion (OD);
  • Human toxicity—cancer effects (HTc);
  • Human toxicity—non-cancer effects (HTnc);
  • Particulate matter (PM);
  • Ionizing radiation HH (IRhh);
  • Ionizing radiation E (interim) (IRe);
  • Photochemical ozone formation (POFP);
  • Acidification (AP);
  • Terrestrial eutrophication (EUT);
  • Freshwater eutrophication (EFw);
  • Marine eutrophication (ME);
  • Freshwater ecotoxicity (Ftox);
  • Land use (LU);
  • Water resource depletion (WRD);
  • Mineral, fossil and resource depletion (MFD).
The global energy requirement (GER) was considered based on the cumulative energy demand method [36], which permits the amount of energy that refers to renewable (for example, wind or solar) and non-renewable (e.g., fossil) sources to be quantified.

2.2. Functional Unit

The study considered 1 m2 of road pavement as a functional unit (FU) [37] and it was developed ‘from cradle to grave’, considering all the processes that include composite material production, construction, maintenance, and end of life.
Material production comprises raw material and energy supply, and manufacturing phase, occurring in asphalt plants. Construction phase includes laydown and compaction. Maintenance includes milling, transportation to landfills, and repaving of wearing courses. Assuming a suitable lifetime of 20 years for road pavements, the milling and reconstruction of the wearing course is considered as half of the lifespan (10 years), as required by product category rules (PCR) [37]. The transportation to production and construction sites is included. This comprises transporting the raw materials extracted to asphalt plants and transporting the bituminous mixture close to the paver. End-of-life stages refer to milling, transportation of discarded materials, and waste treatment. In this study, the use phase was omitted for the following reasons: (1) The alternative pavement scenarios are designed to support the same traffic conditions, thus the use phase impacts are assumed to be the same in the assessed scenarios. To this end, further experiments are needed in the future. (2) Energy consumption due to pavement aging, traffic increase, and air pollution due to road vehicles are not considered, due to lack of comparative research. (3) No difference in surface rolling resistance, which influences the consumption of fuel, is taken into account in the assessed scenarios, under the assumptions of having the same type of friction course and the same evolution of surface characteristics over time.

2.3. Life Cycle Inventory

A life cycle inventory (LCI) was carried out to estimate the main input and output mass and energy flows of the entire life cycle of the assessed asphalt pavement. Data quality and modelling assumptions, related to life cycle steps within the selected system boundaries, are detailed in the following paragraphs.

2.3.1. Description of the Alternative Scenarios for the Examined Asphalt Pavement

The analysis was developed through the comparison of different scenarios of asphalt technologies for road pavements. The authors intended to assess the eco-profile of each scenario through the LCA in the pursuit of selecting the best option in terms of consumption of energy and environmental performance. For each scenario, the pavement has a thickness of 320 mm and is composed of friction course (FC, bituminous layer, 50 mm), binder course (BC, bituminous layer, 70 mm), and unbound base course (UBC, granular layer, 200 mm). The subgrade is located below the base course. The components of the different layers are detailed in Table 1.
In detail, Base Scenario involves the use of common paving materials. It is defined as follows: the friction course (FC) is a porous hot mix asphalt (PA), the BC is a dense-graded mixture (DMA), and the base course is an unbound course (granular base, composed of mineral aggregates of proper graduation).
In Scenario 1 the friction course is made using neat bitumen and waste plastics (WP) from municipal solid wastes and crumb rubber (CR) from end-of-life tires. WP percentage is 10%, as well as the one of CR.
In Scenario 2, the friction course is a porous and warm mix asphalt (PWMA). In addition, the binder course (DWMA) is manufactured using WMA technology and includes the same components of the PWMA, but with a different gradation of mineral aggregates and different asphalt binder percentage.
Scenario 3 includes WMA and the addition of RAP at a percentage of 45% in friction (PWMA) binder course (DWMA) and unbound base layer.
Scenario 4 is similar to Scenario 3, but with a different percentage of RAP in layers: 30% instead of 45%.

2.3.2. Data Quality

Data related to materials, machineries and construction activities are derived from the literature, from interviews with enterprises and experts involved in road works, and from websites. Aggregates (e.g., sand) are derived from Sicilian and Calabrian quarries. For secondary data, reference is made to Blomberg et al. [38] to derive LCIs of bituminous materials. The data that refer to the electricity needed by the pieces of equipment involved in production (quarry- and plant-related) are gathered from local Calabrian contractors. With regard to the use of machines such as pavers and dumpers in pavement maintenance, note that consumption-related data (e.g., fuel, electricity, gas), productivity, and working hours are derived from the literature. The pieces of information that refer to the eco-profile of CR (Scenario 1) are derived from [39]. With regard to the placement of materials at the construction site, the energy and environmental impacts depend on combustion (equipment-related emissions). Diesel consumption for compaction (rollers) is calculated taking into account hourly fuel consumption of construction equipment.
For each scenario, Table 2 reports quantities (kg/FU) and haul distance (km), [40]. The data that refer to energy sources, to the materials used in pavement construction and maintenance (including transportation), and to waste-related processing and treatment are derived from databases [41].

2.4. Results

The LCA results achieved in the analysis are detailed in the following sections, in terms of aggregate data and disaggregated data for the purpose of analyzing underlying trends and insights. The section “Nomenclature” contains the main symbols used.

2.4.1. Life Cycle Impact Assessment: Aggregated Results

The eco-profiles of the assessed scenarios per functional unit are shown in Table 3 (see Nomenclature for symbols). Each indicator of impact presents the same order of magnitude in all the assessed scenarios and generally the lowest burdens refer to Scenario 3 (PWMA with 45% RAP), while the highest ones to Base Scenario (PA).
It can be noted that GER varies from 1535 to 1893 MJ. Base Scenario presents the highest GER, while Scenario 3 involves a reduction of 19% in comparison with Base Scenario, followed by Scenario 4 (PWMA with 30% RAP), which involves a reduction of 15%.
Results highlight a general decrease of the environmental impact indicators in almost all the scenarios, if compared to the Base Scenario, with the exception of HT-ce (human toxicity—cancer effects) and EFW (freshwater eutrophication). HT-ce presents the highest value in Scenario 3, and MFD has the highest value in Scenario 2. The remarkable increase of EFW in Scenario 1, essentially due to the production of CR, is noteworthy. This point calls for further research aiming at assessing the overall impact of waste-added and CR-added mixes in terms of noise and remaining impacts [42,43], including the impacts on their performance deriving from the transition towards e-mobility [44,45,46,47].
The highest reductions occur for HT-ce in Scenario 1 (72%) and for LU in Scenario 3. A significant reduction is displayed also for ODP, IR-hh, and IR-E, where the corresponding contributions of Scenario 3 and 4 are nearly 20% and 15% lower than Base Scenario, respectively. Other remarkable decreases occur for other indicators, such as WRD (14% in Scenario 1, 17% in Scenario 2, 17% in Scenario 3 and 13% in Scenario 4) and PM (8% in Scenario 1, 11% in Scenario 2, 13% in Scenario 3 and 10% in Scenario 4). With regard to CC, it varies from 81.8 kgCO2eq in Base Scenario to 75 kgCO2eq in Scenario 2 and 3, where there is a decrease of 8%. Table 4 shows the percentage variations of the impact indicators in all the considered scenarios compared to Base Scenario.

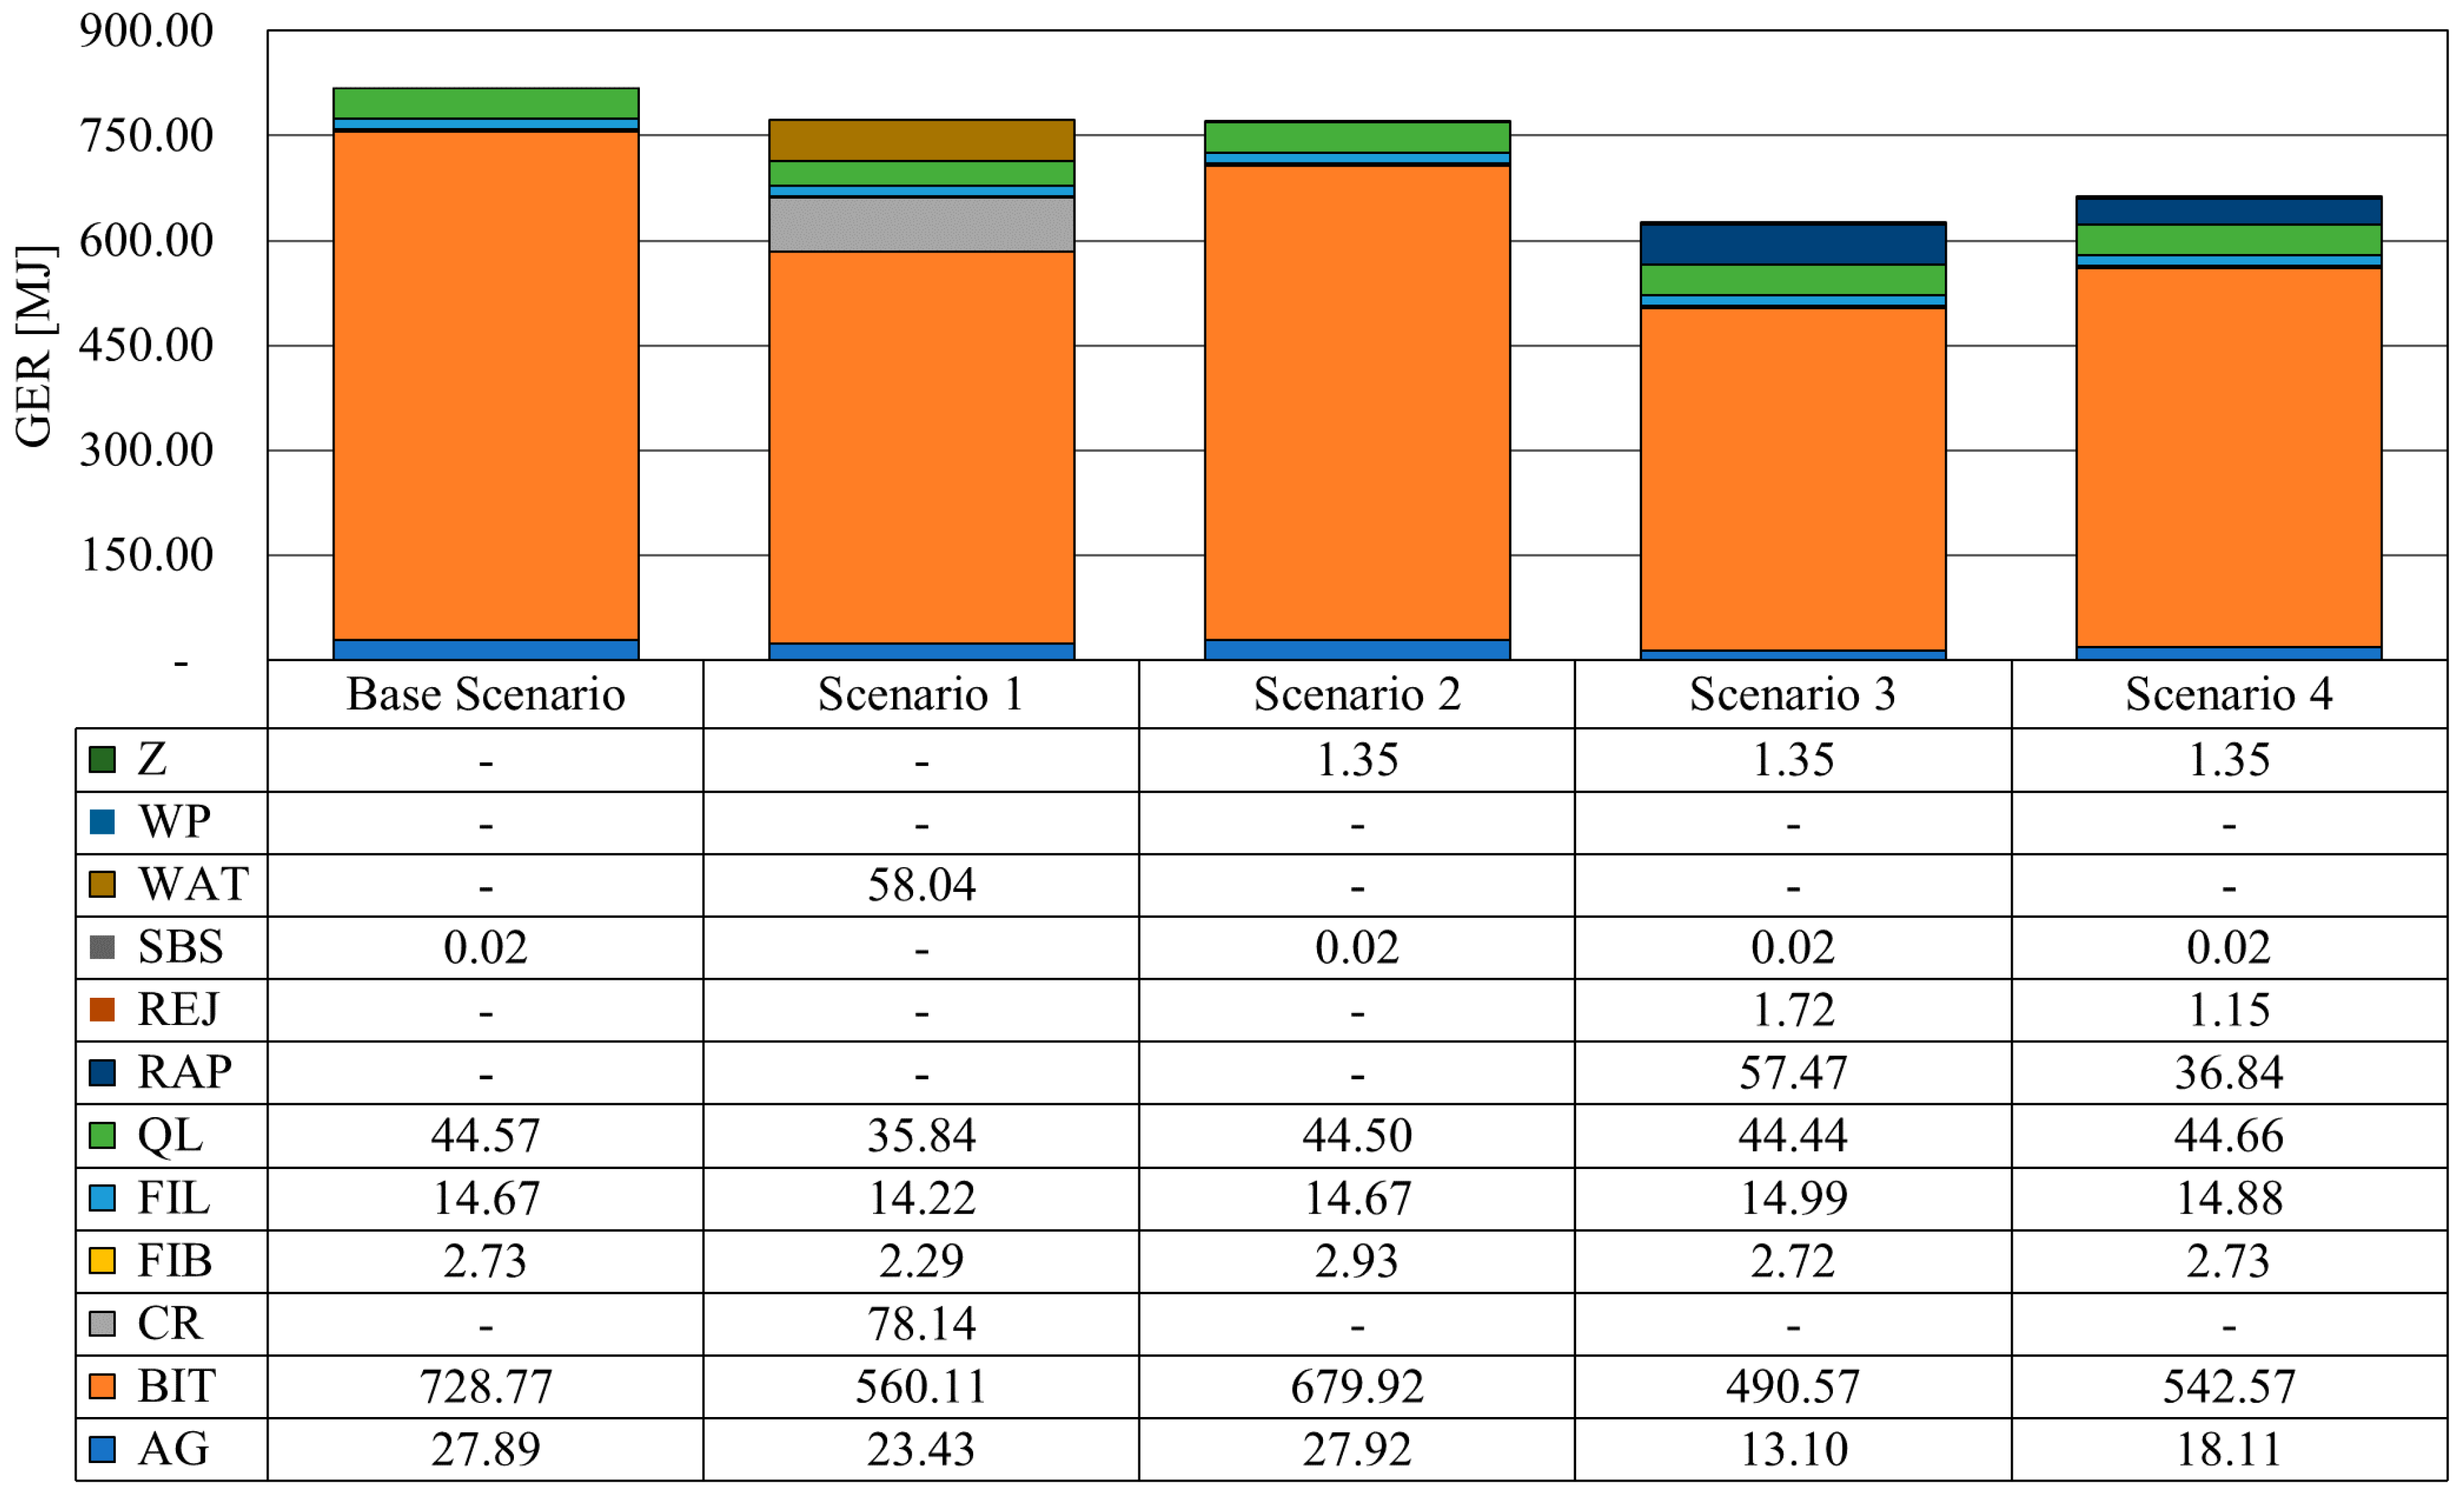
2.4.2. Contribution Analysis Results: Energy

Table 5 shows a breakdown of the energy results, highlighting the contribution of each life cycle step to GER for each scenario and distinguishing between renewable (R) and non-renewable (NR). Note that the highest contribution, which accounts for about 68% of the total GER, refers to asphalt production in all the assessed scenarios. For construction, the highest contribution (about 7 MJ/m2) occurs in scenarios with RAP (Scenario 3 and 4). This result is due to higher energy required for the milling process. The contribution of maintenance step, which considers one replacement of the friction course during pavement lifespan, is around 20% of the total GER in all the scenarios. Furthermore, transport involves a contribution of about 6% in all scenarios. The same share derives from end-of-life. Results show that in all the assessed scenarios about 98% of GER comes from non-renewable energy source consumption.
A detailed analysis of the GER of the material production step is presented in Figure 1. Note that the main contribution comes from virgin bitumen production (BIT), which accounts for 47% in Scenario 1, 3, and 4. Base Scenario and Scenario 2 show contributions higher than 50%. Quicklime (QL) and mineral aggregates (AG) constitute in the range of 2–4% in all scenarios.
In Table 6, the contribution of each pavement layer to life cycle GER is presented in the assessed five scenarios. Friction course presents the highest contribution to the total GER, due to the maintenance phase. For the stages that refer to production, binder course yields a very relevant GER, since this layer has a higher thickness (70 mm, while the friction course is 50 mm thick). In all the scenarios, a reduction of GER in friction and binder course production occurs in comparison with Base Scenario, where the lowest values are seen in Scenario 3.

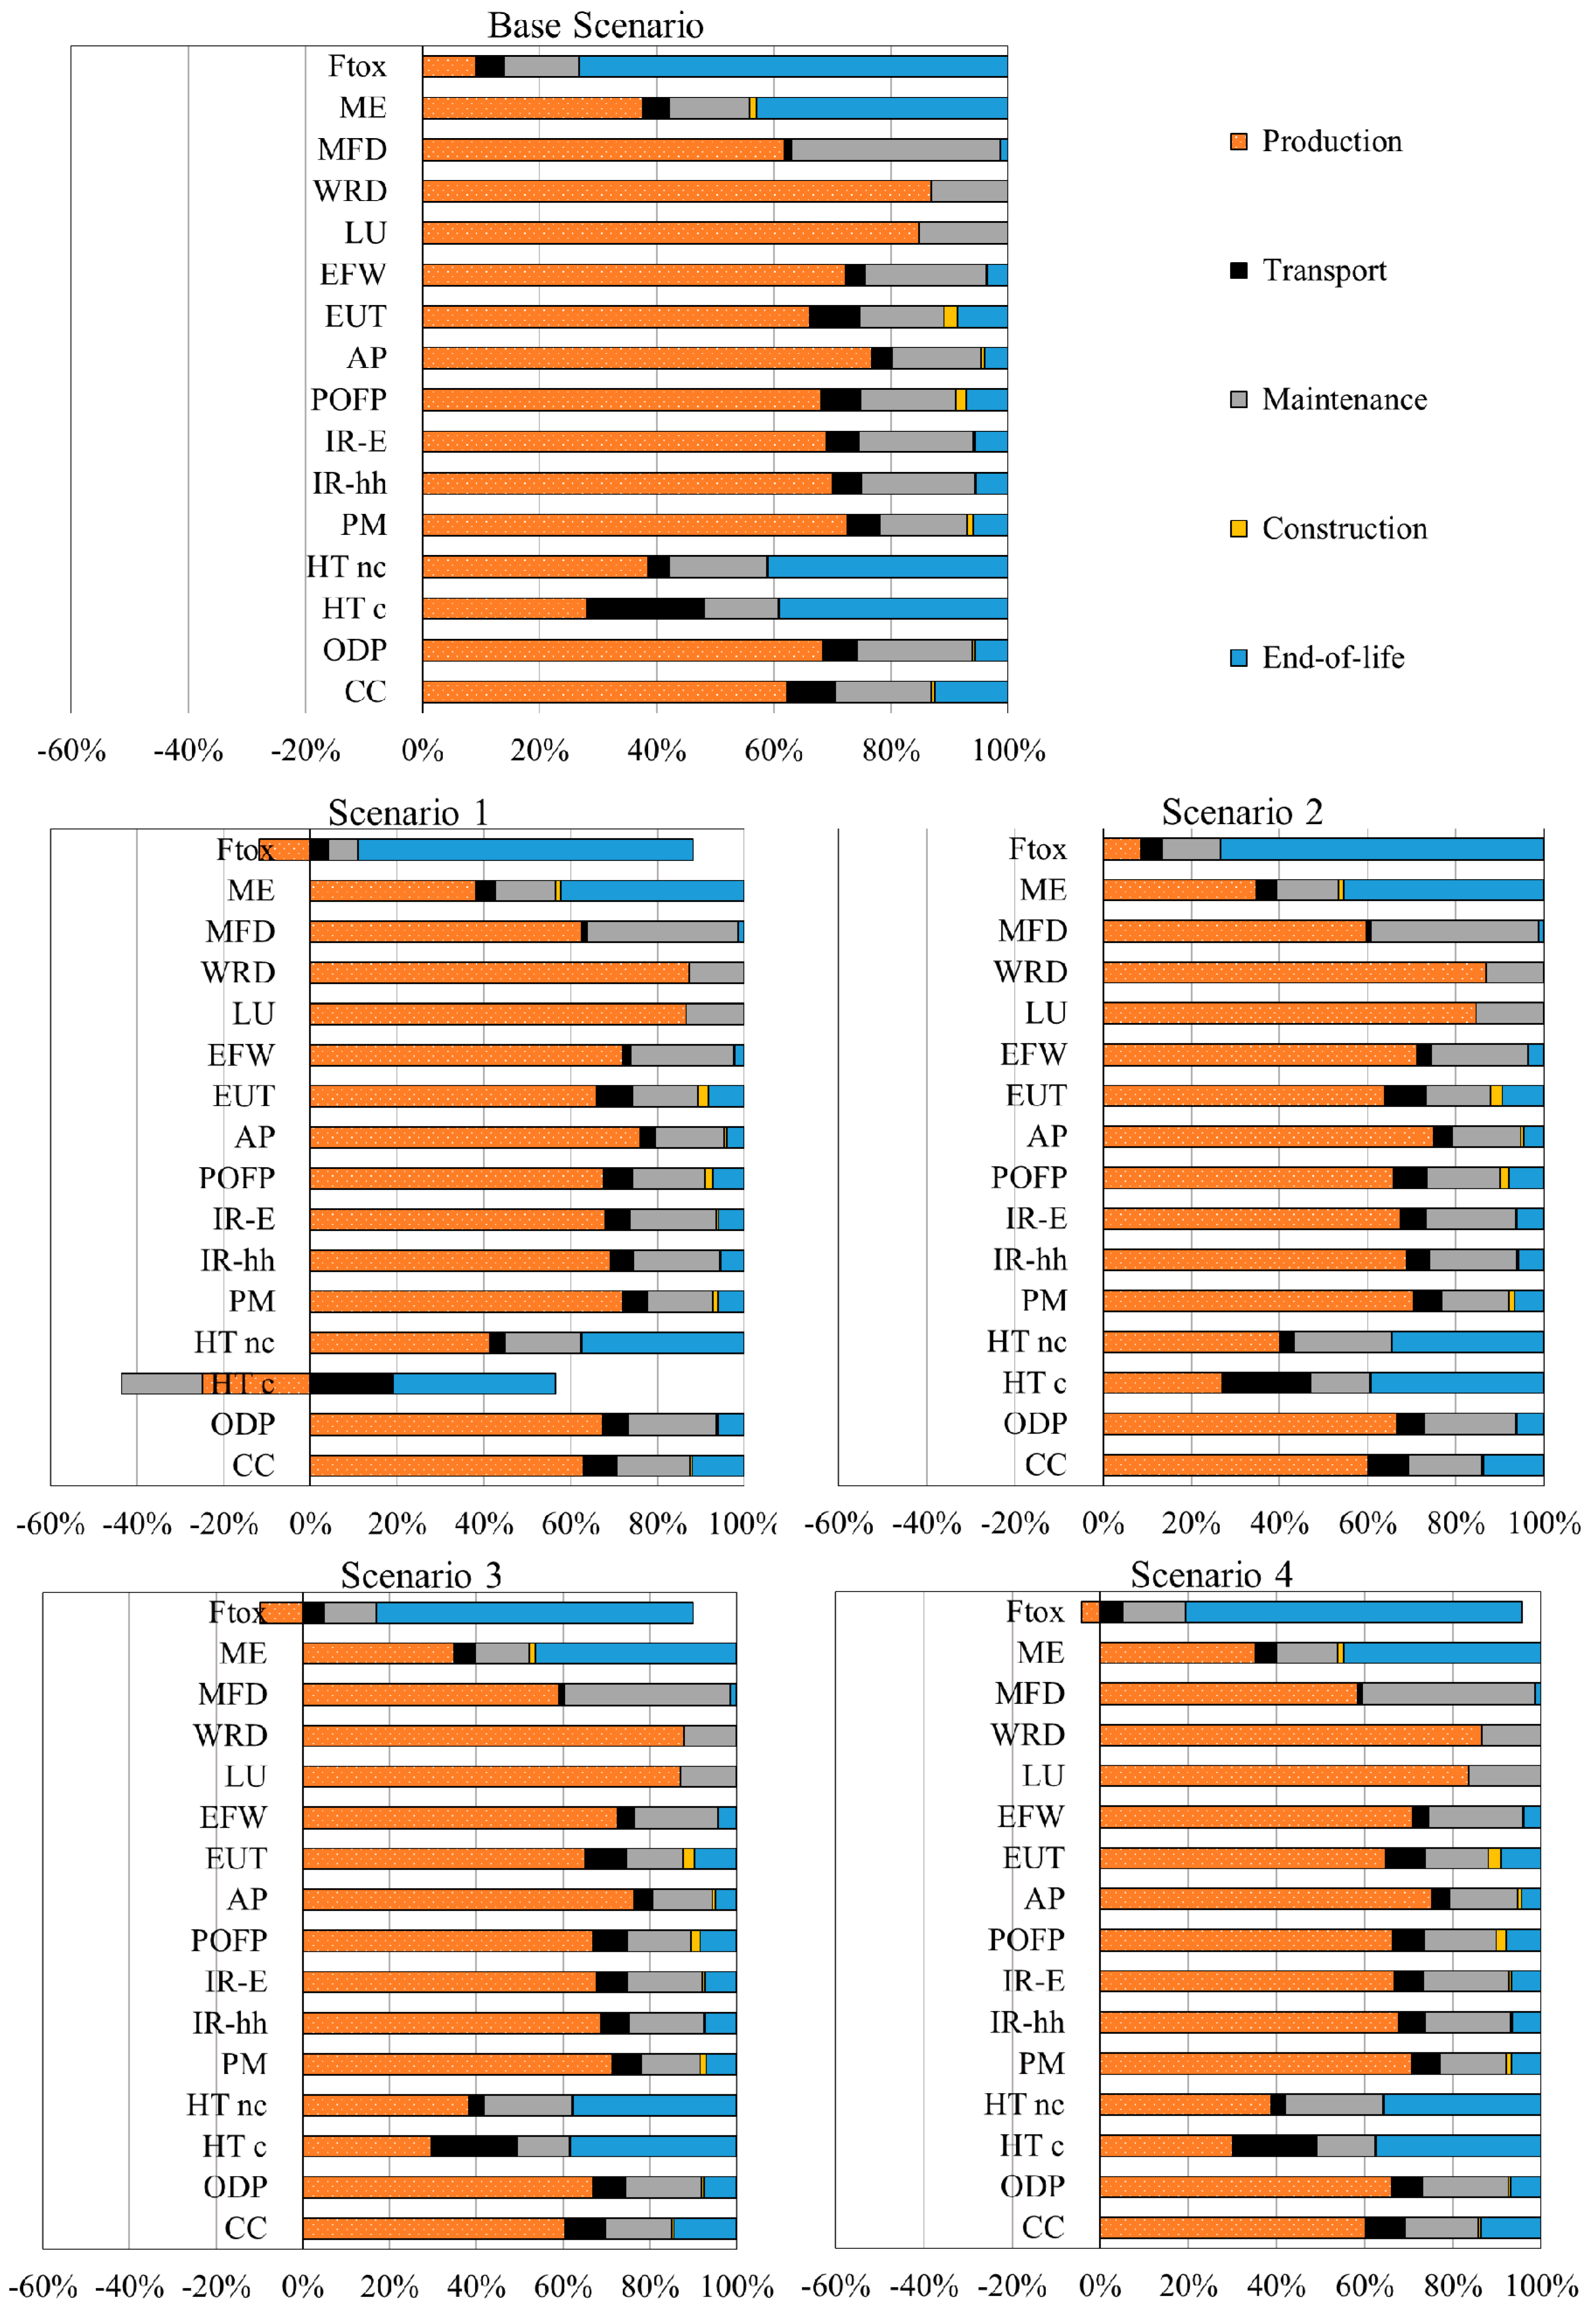
2.4.3. Contribution Analysis Results: Environmental Impacts

The environmental impacts exhibit a trend similar to the one described for GER. Results are reported in Figure 2, which shows a contribution analysis to identify the life cycle steps that involve the most significant shares of environmental impacts.
It can be highlighted that asphalt production is the step that produces the highest impact, since it involves the highest contribution in all the examined impact categories, with a trend that is similar for all the scenarios. In detail, it accounts for more than 60% of the majority of environmental indicators, with the exception of EFw, HT-ce, HT-nce, and ME.
The negative values of Ftox and HT-ce in Scenario 1 (addition of waste plastics in the bituminous mixture) are essentially due to the avoided impacts of virgin plastics.

3. Discussion

Based on the results the following main findings of the study can be summarized.
A common trend among all indicators can be detected in all the assessed scenarios even if there are specific differences due to the nature of the indicators used. The stage that has the most impact is bituminous concrete production. This means that the consideration of this stage is crucial in terms of energy and environmental eco-design actions.
In the assessed eco-profiles, the scenario analysis shows that Base Scenario, characterized by layers of traditional HMA, produces the highest energy and environmental burdens. Scenario 3 is the best one among all the five cases for almost all the indicators. This result relies on the lower consumption of primary energy in WMA production and on the use of reclaimed asphalt concrete, which results in lower quantities of virgin asphalt binder and aggregates.
WMA technology proves to be an ecofriendly solution since it reduces both GER and environmental impacts. When WMA technology is combined with the use of RAP it allows the consumption of virgin bitumen and aggregates to be reduced, and this lowers the raw material requirement and produces a further reduction in primary energy consumption.
The eco-design of production should be investigated more in detail in order to improve the eco-profile of road pavements. The use of ‘greener’ materials in this stage could improve the eco-profile of asphalt technologies.

4. Conclusions

This study focuses on how energy and environment are affected by different road paving technologies, based on the use of bituminous materials (hot mix asphalt and warm mix asphalt) mixed with recycled materials (reclaimed asphalt pavements, crumb rubber, and waste plastics).
Different scenarios are investigated aimed at detecting optimal pavement technologies for energy and the environment. The steps and processes responsible for the highest impacts are identified.
Results highlight that the pavement technologies that use WMA result in lower consumption of energy and environmental impacts with respect to traditional HMA pavements. In addition, combining such a technology with the use of RAP allows the consumption of virgin bitumen and aggregates to be reduced, thus involving less consumption of energy and raw materials and avoiding impacts regarding disposal. Scenario 3 presents the lowest impacts in comparison with the others. Comparable reduction rates occur for Scenario 4. For this last scenario, lower reduction rates in comparison with Scenario 3 are related to the lower RAP percentage (30% vs. 45%).
The results show that construction materials (extraction, supply of resources) are responsible for critical consumption of energy and environmental consequences, mainly related to the production of bitumen. Furthermore, the results highlight that WPs (as a substitute for polymers) and RAP (as a substitute for virgin aggregates and bitumen) are crucial and strategic. At the same time, the benefits (and issues) of WMAs deserve more attention and study, especially when considering new and emerging solutions to additionally lower construction temperatures (mixing, laydown, and compaction, cf. half-warm mix asphalts).
From a methodological point of view, one key issue of the analysis is the selection of secondary data for modelling the life cycle of a number of production materials due to the limited availability of process-specific data for such materials. The data shown and discussed in the paper have been investigated and extrapolated from a wide range of secondary data. However, these data are helpful for further studies and developments. To this purpose, further research activity, by monitoring production, construction laying and use phase, is ongoing with the aim of defining a more reliable life cycle inventory dataset.
Despite the limitations above, LCA proves to be an effective tool to improve the eco-profile of asphalt technologies for urban road pavements. Some improved solutions can be identified, taking into account eco-design strategies, but not forgetting that a pillar for sustainability development is the integration between environmentally friendly production systems and technological feasibility. Thus, the adoption of the life-cycle approach could permit issues that refer to both energy and ecosystems to be addressed. Guidelines, policies, and strategies (which sometimes build only on costs and safety) could benefit from this point of view. Furthermore, this could foster new methodologies and more effective actions to limit energy consumption and to enhance the quality of the environment.

Author Contributions

Conceptualization: F.G.P., M.G., M.M., T.M.G.; data curation F.G.P., M.G., M.M., T.M.G.; methodology: F.G.P., M.G., M.M., T.M.G.; writing (original draft): F.G.P., M.G., M.M., T.M.G., writing—review and editing: F.G.P., M.G., M.M., T.M.G. All authors have read and agreed to the published version of the manuscript.

Funding

The authors would like to thank all who sustained them with this research, especially the European Commission for its financial contribution to the LIFE18 ENV/IT/000201 LIFE E-VIA Project into the LIFE2018 programme.

Conflicts of Interest

The authors declare no conflict of interest.

Nomenclature

AGMineral aggregates
AV Air Voids
AP Acidification [molc H+eq]
BCBinder course
BITBitumen
CC Climate change [kg CO2 eq]
CRCrumb rubber
DMA.Dense-graded mix asphalt
DWMADense-graded and warm mix asphalt
EFW Freshwater eutrophication [kg Peq]
EUT Terrestrial eutrophication [molc Neq]
FCFriction or wearing course
FIBFibers composed of cellulose
FILFiller composed of minerals
Ftox Freshwater ecotoxicity [kg Sbeq]
GER Global energy requirement [MJ]
HMAHot mix asphalt
HT-ce Human toxicity, cancer effects [CTUh]
HT-nce Human toxicity, non-cancer effects [CTUh]
IR-E Ionizing radiation E (interim) [CTUe]
IR-hh Ionizing radiation HH [kBq U235 eq]
LU Land use [kgC deficit]
ME Marine eutrophication [m3 watereq]
MFR Mineral, fossil & renewable resource depletion [kg C deficit]
NRNon-renewable energy [MJ]
RRenewable [MJ]
ODP Ozone depletion [kg CFC-11eq]
PA Porous asphalt concrete
PAWMAPorous and warm mix asphalt
PM Particulate matter [kg PM2.5eq]
POFP Photochemical ozone formation [kg NMVOCeq]
QLCalcium oxide (CaO), commonly termed quick or burnt lime
RAPReclaimed asphalt pavement
REJAgent for rejuvenating the properties of bitumen
SBSPolymer composed of styrene and butadiene
UBCUnbound and granular base course
WMAWarm mix asphalt
WPWaste plastic
WRDWater resource depletion [m3 watereq]
ZSynthetic zeolites
UBCUnbound base course

References

  1. Capitão, S.D.; Picado-Santos, L.G.; Martinho, F. Pavement engineering materials: Review on the use of warm-mix asphalt. Constr. Build. Mater. 2012, 36, 1016–1024. [Google Scholar] [CrossRef]
  2. Del Carmen Rubio, M.; Moreno, F.; Martínez-Echevarría, M.J.; Martínez, G.; Vázquez, J.M. Comparative analysis of emissions from the manufacture and use of hot and half-warm mix asphalt. J. Clean. Prod. 2013, 41, 1–6. [Google Scholar] [CrossRef]
  3. Aurangzeb, Q.; Al-Qadi, I.L.; Ozer, H.; Yang, R. Hybrid life cycle assessment for asphalt mixtures with high RAP content. Resour. Conserv. Recycl. 2014, 83, 77–86. [Google Scholar] [CrossRef]
  4. Lee, J.C.; Edil, T.B.; Tinjum, J.M.; Benson, C.H. Quantitative assessment of environmental and economic benefits of using recycled construction materials in highway construction. Transp. Res. Rec. 2010. [Google Scholar] [CrossRef] [Green Version]
  5. Bressi, S.; Colinas-Armijo, N.; Di Mino, G. Analytical approach for the mix design optimisation of bituminous mixtures with crumb rubber. Mater. Struct. 2018, 51, 26. [Google Scholar] [CrossRef]
  6. Lo Presti, D. Recycled Tyre Rubber Modified Bitumens for road asphalt mixtures: A literature review. Constr. Build. Mater. 2013, 49, 863–881. [Google Scholar] [CrossRef]
  7. Loderer, C.; Partl, M.N.; Poulikakos, L.D. Effect of crumb rubber production technology on performance of modified bitumen. Constr. Build. Mater. 2018, 191, 1159–1171. [Google Scholar] [CrossRef]
  8. Carpenter, A.C.; Gardner, K.H. Use of industrial by-products in urban roadway infrastructure: Argument for increased industrial ecology. J. Ind. Ecol. 2009, 13, 967–977. [Google Scholar] [CrossRef]
  9. Mladenovič, A.; Turk, J.; Kovač, J.; Mauko, A.; Cotič, Z. Environmental evaluation of two scenarios for the selection of materials for asphalt wearing courses. J. Clean. Prod. 2015, 87, 683–691. [Google Scholar] [CrossRef]
  10. Mohammad, L.N.; Hassan, M.M.; Vallabhu, B.; Kabir, M.S. Louisiana’s Experience with WMA Technologies: Mechanistic, Environmental, and Economic Analysis. J. Mater. Civ. Eng. 2015, 27. [Google Scholar] [CrossRef]
  11. Rodríguez-Alloza, A.M.; Malik, A.; Lenzen, M.; Gallego, J. Hybrid input–output life cycle assessment of warm mix asphalt mixtures. J. Clean. Prod. 2015, 90, 171–182. [Google Scholar] [CrossRef]
  12. Robinette, C.; Epps, J. Energy, Emissions, Material Conservation, and Prices Associated with Construction, Rehabilitation, and Material Alternatives for Flexible Pavement. Transp. Res. Rec. J. Transp. Res. Board 2010, 2179, 10–22. [Google Scholar] [CrossRef]
  13. Santos, J.; Bryce, J.; Flintsch, G.; Ferreira, A.; Diefenderfer, B. A life cycle assessment of in-place recycling and conventional pavement construction and maintenance practices. Struct. Infrastruct. Eng. 2015. [Google Scholar] [CrossRef]
  14. D’Angelo, J.; Harm, E.; Bartoszek, J.; Baumgardner, G.; Corrigan, M.; Cowsert, J.; Harman, T.; Jamshidi, M.; Jones, W.; Newcomb, D.; et al. Warm-Mix Asphalt: European Practice; US Department of Transportation: Washington, DC, USA, 2008.
  15. Vaitkus, A.; Čygas, D.; Laurinavičius, A.; Perveneckas, Z. Analysis and evaluation of possibilities for the use of warm mix asphalt in Lithuania. Balt. J. Road Bridge Eng. 2009, 4, 80–86. [Google Scholar] [CrossRef]
  16. Zaumanis, M. Warm Mix Asphalt Investigation. Master’s Thesis, Riga Technical University, Kongens Lyngby, Denmark, 2010. [Google Scholar]
  17. Kristjansdottir, O. Warm Mix Asphalt for Cold Weather Paving. Master’s Thesis, University of Washington, Seattle, WA, USA, 2006. [Google Scholar]
  18. Qiu, J.; Huurman, M.; de Bruin, B.; Demmink, E.W.; Frunt, M.H.T. Towards 90% warm re-use of porous asphalt using foaming technology. J. Clean. Prod. 2018, 190, 251–260. [Google Scholar] [CrossRef]
  19. Mallick, R.; Kandhal, P.; Bradbury, R. Using Warm-Mix Asphalt Technology to Incorporate High Percentage of Reclaimed Asphalt Pavement Material in Asphalt Mixtures. Transp. Res. Rec. J. Transp. Res. Board 2008, 2051, 71–79. [Google Scholar] [CrossRef]
  20. Moghadas Nejad, F.; Vadood, M.; Baeetabar, S. Investigating the mechanical properties of carbon fibre-reinforced asphalt concrete. Road Mater. Pavement Des. 2014, 15, 465–475. [Google Scholar] [CrossRef]
  21. Zhao, S.; Huang, B.; Shu, X.; Woods, M. Comparative evaluation of warm mix asphalt containing high percentages of reclaimed asphalt pavement. Constr. Build. Mater. 2013, 44, 92–100. [Google Scholar] [CrossRef]
  22. Praticò, F.G.; Vaiana, R.; Giunta, M. Recycling Pems Back to Innovative, Silent, Permeable Road Surfaces. In Proceedings of the 8th International Conference on Environment Engineering, Vilnius, Lithuania, 19–20 May 2011; pp. 1186–1192. [Google Scholar]
  23. Bansal, S.; Kumar Misra, A.; Bajpai, P. Evaluation of modified bituminous concrete mix developed using rubber and plastic waste materials. Int. J. Sustain. Built Environ. 2017, 6, 442–448. [Google Scholar] [CrossRef]
  24. Vasudevan, R.; Ramalinga Chandra Sekar, A.; Sundarakannan, B.; Velkennedy, R. A technique to dispose waste plastics in an ecofriendly way—Application in construction of flexible pavements. Constr. Build. Mater. 2012, 28, 311–320. [Google Scholar] [CrossRef]
  25. Gheni, A.A.; Lusher, S.M.; ElGawady, M.A. Retention behavior of crumb rubber as an aggregate in innovative chip seal surfacing. J. Clean. Prod. 2018, 197, 1124–1136. [Google Scholar] [CrossRef]
  26. Bressi, S.; Santos, J.; Giunta, M.; Pistonesi, L.; Lo Presti, D. A comparative life-cycle assessment of asphalt mixtures for railway sub-ballast containing alternative materials. Resour. Conserv. Recycl. 2018, 137, 76–88. [Google Scholar] [CrossRef]
  27. Postorino, M.N.; Praticò, F.G. An application of the Multi-Criteria Decision—Making analysis to a regional multi-airport system. Res. Transp. Bus. Manag. 2012, 4, 44–52. [Google Scholar] [CrossRef]
  28. Praticò, F.G.; Vaiana, R.; Giunta, M. Pavement Sustainability: Permeable Wearing Courses by Recycling Porous European Mixes. J. Archit. Eng. 2013, 19, 186–192. [Google Scholar] [CrossRef]
  29. Matthews, H.; Hendrickson, C.; Matthews, D. Life Cycle Assessment: Quantitative Approaches for Decisions that Matter; 2014. [Google Scholar]
  30. Santero, N.J.; Masanet, E.; Horvath, A. Life-cycle assessment of pavements. Part I: Critical review. Resour. Conserv. Recycl. 2011, 55, 801–809. [Google Scholar] [CrossRef]
  31. Beccali, G.; Cellura, M.; Mistretta, M. New exergy criterion in the “multi-criteria” context: A life cycle assessment of two plaster products. Energy Convers. Manag. 2003, 44, 2821–2838. [Google Scholar] [CrossRef]
  32. Cellura, M.; Guarino, F.; Longo, S.; Mistretta, M. Modeling the energy and environmental life cycle of buildings: A co-simulation approach. Renew. Sustain. Energy Rev. 2017, 80, 733–742. [Google Scholar] [CrossRef]
  33. International Organization for Standardization. ISO 14040-Environmental Management—Life Cycle Assessment—Principles and Framework; ISO: Geneva, Switzerland, 2006. [Google Scholar] [CrossRef]
  34. International Organization for Standardization. ISO 14044:2006 Environmental management—Life cycle assessment—Requirements and guidelines. In Environmental Management—Life Cycle Assessment—Principles and Framework 46; ISO: Geneva, Switzerland, 2006. [Google Scholar] [CrossRef] [Green Version]
  35. European Commission Joint Research Centre. Institute for Environment and Sustainability International Reference Life Cycle Data System (ILCD) Handbook—General Guide for Life Cycle Assessment—Detailed Guidance, Constraints; Publications Office of the European Union: Luxembourg, 2010. [Google Scholar] [CrossRef]
  36. Frischknecht, R.; Jungbluth, N.; Althaus, H.; Bauer, C.; Doka, G.; Dones, R.; Hischier, R.; Hellweg, S.; Köllner, T.; Loerincik, Y.; et al. Implementation of Life Cycle Impact Assessment Methods. Am. Midl. Nat. 2007, 150, 1–139. [Google Scholar]
  37. The International EPD® System. Product Category Rules (PCR) of the Environmental Product Declaration (EPD): “Highways, Streets and Roads (Except Elevated Highways)”; EPD International AB: Stockholm, Sweden, 2013. [Google Scholar]
  38. Blomberg, T.; Bernard, F.F.; Southern, M.; Barnes, J.; Bernard, F.F.; Dewez, P.; Le Clerc, S.; Pfitzmann, M.; Porot, L.; Southern, M.; et al. Life cycle inventory: Bitumen. In Proceedings of the 5th Eurasphalt & Eurobitume Congress, Istanbul, Turkey, 13–15 June 2012. [Google Scholar]
  39. Farina, A.; Zanetti, M.C.; Santagata, E.; Blengini, G.A. Life cycle assessment applied to bituminous mixtures containing recycled materials: Crumb rubber and reclaimed asphalt pavement. Resour. Conserv. Recycl. 2017, 117, 204–212. [Google Scholar] [CrossRef]
  40. Gulotta, T.; Mistretta, M.; Praticò, F.G. Life cycle assessment of roads: Material and process related energy savings. Model. Meas. Control C 2018, 79, 146–153. [Google Scholar] [CrossRef]
  41. Wernet, G.; Bauer, C.; Steubing, B.; Reinhard, J.; Moreno-Ruiz, E.; Weidema, B. The ecoinvent database version 3 (part I): Overview and methodology. Int. J. Life Cycle Assess. 2016, 21, 1218–1230. [Google Scholar] [CrossRef]
  42. Del Pizzo, A.; Teti, L.; Moro, A.; Bianco, F.; Fredianelli, L.; Licitra, G. Influence of texture on tyre road noise spectra in rubberized pavements. Appl. Acoust. 2020, 159, 107080. [Google Scholar] [CrossRef]
  43. Praticò, F.G.; Moro, A.; Ammendola, R. Potential of fire extinguisher powder as a filler in bituminous mixes. J. Hazard. Mater. 2010, 173, 605–613. [Google Scholar] [CrossRef] [PubMed]
  44. Stamp, A.; Lang, D.J.; Wäger, P.A. Environmental impacts of a transition toward e-mobility: The present and future role of lithium carbonate production. J. Clean. Prod. 2012, 23, 104–112. [Google Scholar] [CrossRef]
  45. Sanchez-Alonso, E.; Vega-Zamanillo, A.; Castro-Fresno, D. Effect of type of compaction on mechanical properties in warm-mix asphalts. J. Mater. Civ. Eng. 2012, 24, 1043–1049. [Google Scholar] [CrossRef]
  46. Sanchez-Alonso, E.; Vega-Zamanillo, A.; Calzada-Perez, M.A. Mechanical behavior of asphalt mixtures containing silica gels as warm additives. Mater. Struct. 2018, 51, 82. [Google Scholar] [CrossRef]
  47. Sanchez-Alonso, E.; Vega-Zamanillo, A.; Calzada-Perez, M.A.; Castro-Fresno, D. Effect of warm additives on rutting and fatigue behaviour of asphalt mixtures. Constr. Build. Mater. 2013, 47, 240–244. [Google Scholar] [CrossRef]
Figure 1. GER of materials production in each scenario (MJ/m2).
Sustainability 12 00704 g001
Figure 2. Contribution analysis of life-cycle environmental impacts.
Sustainability 12 00704 g002
Table 1. Scenarios and materials.
Scenarios
Base 1234
FCPA
AV 18%
AG
FIL
Modified
BIT (5% by mix weight) 5% SBS
QL
FIB
PWMA
AV 18%
AG
FIL
BIT (5% by mix weight)
CR (10% by mix weight)
WP (10% by mix weight)
QL
FIB
PWMA
AV 18%
AG
FIL
Modified
BIT (5% by mix weight) 5% SBS
QL
FIB
Z (0.5% by bitumen weight)
PWMA
AV 18%
AG (45% RAP)
FIL
Modified
BIT (5% by mix weight) 5% SBS
QL
FIB
Z (0.5% by bitumen weight)
PWMA
AV 18%
AG (30% RAP)
FIL
Modified BIT (5% by mix weight) 5% SBS
QL
FIB
Z (0.5% by bitumen weight)
BCDMA
AV 6%
AG
BIT (5% by mix weight)
DMA
AV 6%
AG
FIL
BIT (5% by mix weight)
DWMA
AV 6%
AG
FIL
modified BIT (5% by mix weight) 5% SBS
QL
Z (0.5% by bitumen weight)
DWMA
AV 6%
AG (45% RAP)
FIL
modified BIT (5% by mix weight) 5% SBS
QL
Z (0.5% by bitumen weight)
DWMA
AV 6%
AG (30% RAP)
FIL
modified BIT (5% by mix weight) 5% SBS
QL
Z (0.5% by bitumen weight)
UBCAGAGAGAG 45% RAPAG 30% RAP
Symbols (see Nomenclature).
Table 2. Quantities and distances [40].
Materials aBase ScenarioScenario 1Scenario 2Scenario 3Scenario 4
kg/FUkmkg/FUkmkg/FUkmkg/FUkmkg/FUkm
AG548.43196.00460.70196.00549.05196.00364.06196.00339.31196.00
BIT13.54348.0010.41348.0012.63348.009.05348.009.19348.00
CR--20.89100.00------
FIB0.29205.000.25205.000.32205.000.29205.000.29205.00
FIL47.37196.0045.93196.0047.37196.0052.94196.0046.72196.00
QL7.27460.005.85460.007.26460.007.21460.006.67460.00
RAP------228.90100.00191.45100.00
REJ------0.34348.000.21348.00
SBS0.29348.00--0.21348.000.24348.000.25348.00
WP--20.89100.00------
WAT44.00-44.00-44.00-50.20-43.95-
Z----0.02348.000.02348.000.02348.00
a See Nomenclature for abbreviations.
Table 3. Life cycle energy and environmental impacts of the road pavements per Functional Unit (FU).
Impact IndicatorsBase ScenarioScenario 1Scenario 2Scenario 3Scenario 4
GER (MJ)1.89 × 1031.74 × 1031.76 × 1031.53 × 1031.62 × 103
CC (kgCO2eq)8.18 × 1017.90 × 1017.52 × 1017.50 × 1017.67 × 101
ODP (kgCFC-11eq)2.21 × 10−51.93 × 10−52.05 × 10−51.78 × 10−51.88 × 10⁻⁵
HT-ce (CTUh)5.89 × 10−61.66 × 10−65.86 × 10−66.23 × 10−66.10 × 10⁻⁶
HT-nce (CTUh)3.70 × 10−73.68 × 10−74.35 × 10−73.36 × 10−73.49 × 10⁻⁷
PM (kg PM2.5eq)5.21 × 10−24.77 × 10−24.64 × 10−24.55 × 10−24.71 × 10⁻²
IR-hh (kBqU235eq)8.998.308.477.167.64
IR-E (CTUe)5.68 × 10−54.94 × 10−55.29 × 10−54.56 × 10−54.83 × 10⁻⁵
POFP (kgNMVOCeq)3.18 × 10−12.96 × 10−12.90 × 10−12.88 × 10−12.94 × 10⁻¹
AP (molH+eq)6.49 × 10−16.01 × 10−15.70 × 10−15.58 × 10−15.80 × 10⁻¹
EUT (molcNeq)9.21 × 10−18.84 × 10−18.37 × 10−18.69 × 10−18.78 × 10⁻¹
EFW (kgPeq)2.31 × 10−33.42 × 10−32.42 × 10−32.02 × 10−32.13 × 10⁻³
LU (kg C deficit)7.75 × 1016.52 × 1017.75 × 1014.24 × 1015.40 × 101
WRD (m3 watereq)2.392.061.991.982.08
MFD (kgSbeq)1.12 × 10−41.03 × 10−41.30 × 10−49.83 × 10−51.03 × 10⁻⁴
ME (kgNeq)1.39 × 10−11.32 × 10−11.31 × 10−11.33 × 10−11.34 × 10⁻¹
Ftox (CTUe)4.21 × 1022.95 × 1024.21 × 1024.30 × 1024.27 × 102
Table 4. Percentage variations of the life cycle energy and environmental impacts of the assessed scenarios in comparison with Base Scenario.
Impact IndicatorsScenario 1Scenario 2Scenario 3Scenario 4
GER (MJ)−8%−7%−19%−15%
CC (kgCO2eq)−3%−8%−8%−6%
ODP (kgCFC-11eq)−13%−7%−19%−15%
HT-ce (CTUh)−72%−1%6%4%
HT-nce (CTUh)−1%18%−9%−6%
PM (kg PM2.5eq)−8%−11%−13%−10%
IR-hh (kBqU235eq)−8%−6%−20%−15%
IR-E (CTUe)−13%−7%−20%−15%
POFP (kgNMVOCeq)−7%−9%−9%−8%
AP (molH+eq)−7%−12%−14%−11%
EUT (molc Neq)−4%−9%−6%−5%
EFW (kg Peq)48%5%−13%−8%
LU (kg C deficit)−16%0%−45%−30%
WRD (m3 watereq)−14%−17%−17%−13%
MFD (kgSbeq)−8%16%−12%−8%
ME (kgNeq)−5%−6%−4%−4%
Ftox (CTUe)−30%0%2%1%
Table 5. Contribution of life cycle steps to Global Energy Requirement (GER) for each assessed scenario (MJ/m2).
Base ScenarioScenario 1Scenario 2Scenario 3Scenario 4
NRRNRRNRRNRRNRR
Production1271.3430.641144.0636.871152.9630.241016.2924.411071.5926.16
Transport103.440.2495.260.22103.390.24104.800.24104.410.24
Construction6.200.016.200.016.510.017.020.017.020.01
Maintenance366.8010.25347.8313.25353.9610.41268.717.59294.828.35
End of life104.140.3795.900.34104.080.37105.500.37105.110.37
Total1893.421739.941762.171534.951618.08
Table 6. GER shared for layer and step (MJ/m2).
Base ScenarioScenario 1Scenario 2Scenario 3Scenario 4
Friction Course769.73735.23744.35568.15621.98
Production360.81347.34348.10260.05286.81
Transport15.3912.8715.3715.2915.39
Construction0.970.971.021.101.10
Maintenance377.05361.08364.37276.31303.17
End-of-life15.5112.9715.4915.4115.51
Binder Course673.02577.85610.03523.05551.50
Production620.33536.55557.34470.65499.04
Transport25.5719.8925.5325.3325.43
Construction1.361.361.431.541.54
Maintenance----
End-of-life25.7720.0525.7425.5325.49
Unbound Base Course450.67426.87407.78443.75444.02
Production320.85297.04277.76310.00311.90
Transport62.7262.7262.7264.4263.83
Construction3.883.884.084.394.39
Maintenance----
End-of-life63.2263.2263.2264.9363.90

