Monitoring and Analysis of Stress and Deformation Features of Boundary Part of Backfill in Metal Mine

1
Key Laboratory of Shale Gas and Geoengineering, Institute of Geology and Geophysics, Chinese Academy of Science, Beijing 100029, China
2
Deep Mining Laboratory Subsidiary of Shandong Gold Mining Technology Co Ltd., Jinan 250101, China
3
Nuclear Resource Engineering College, University of South China, Hengyang 421001, China
*
Author to whom correspondence should be addressed.
Sustainability 2020, 12(2), 733; https://0-doi-org.brum.beds.ac.uk/10.3390/su12020733
Submission received: 4 January 2020
/
Revised: 15 January 2020
/
Accepted: 16 January 2020
/
Published: 20 January 2020
(This article belongs to the Section Sustainable Engineering and Science)
Abstract
:The backfill mining method is widely used in metal mines. A large and thick backfill body has formed in the No.2 zone of Jinchuan Nickel Mine, and its stability is critical for mining safety. In order to study the mechanical behavior of the boundary part of backfill, ground subsidence monitoring, underground filed monitoring of displacement, and stress and numerical simulation were conducted to analyze stress distribution and deformation of backfill. According to underground monitoring, the bed separated displacement has the consistent trend with ground subsidence in the mine area. Based underground stress monitoring, both horizontal and vertical stress of the internal part of backfill is less than the stress boundary part of the backfill. The characteristic of backfill boundary outline is a step-profile. Contact interaction between the surrounding rock and backfill led to complex stress distribution. According to stress monitoring of the boundary points in a numerical model, the multi-peak value of stress development is the major feature of the boundary part of backfill. The multi-peak stress behavior of the boundary part of backfill was influenced by mining depth. The boundary part of backfill deformation influenced the local stability of mining. This article provided a scientific basis for strength design and the support choice of a metal mine by the method of backfill mining.
1. Introduction
In deep mining engineering, the backfill mining method is widely used in many metal mines all over the world. This method has a vast number of advantages, like occupying space, restricting deformation, bearing load, and realizing the sustainable development of the mining industry [1,2,3,4,5]. Backfill is a composite material with a multiphase consisting of tailing, cement, and a wide variety of micro cracks and micro pore [6,7]. The materials of backfill are adhesive. Durability models of adhesive material using catastrophe theory and analyze the destruction mechanism [8,9,10]. Backfill material has unique properties, and these properties are crucial for backfill mechanical behavior. The backfill properties depend on their composition parameters, such as blinder ratio, grain size, and additions [11,12].
Compared with rock mass, backfill is a solid mass with lower strength. For mining safety, backfill strength and mechanical behavior have drawn the attention of many researchers. An analysis of mechanical action of backfill in deep mining was carried by Ryder [13]. Ercikdi et al. investigated the influence factor of backfill strength [14]. The backfill failure mechanism and the effect of material property were studied by some experimental tests. Finally, some studies have demonstrated that the tensile principal stress has led to backfill failure inducing spalling near the exposed surface [15]. Backfill stability is a crucial factor for mining safety. Proper design is helpful for backfill stability, which was analyzed by a sliding failure model of a confined block [16,17].
Backfill replaces ore body and occupies the mining void. Contact interaction between the surrounding rock and backfill have influenced local stability in mining engineering [18,19,20,21]. The shear behavior of joints formed between concrete or cement grout and soft, weak, or weathered rock was described by experimental analysis [22,23,24,25]. The stress state in a single filled stope was studied in some mines. The difference in stiffness and strength between rock and backfill tends to produce a load transfer along the interfaces due to the downward settlement of the backfill [26,27,28]. The load transferred along the interface was confirmed by some experiments in laboratory and mining operations in mines [29,30,31,32,33,34,35].
Previous research into backfill focused on aspects of material properties, blinder ratio, and mechanisms. The arch effect of the narrow backfill and the surrounding rock are not suitable for this area mine. First, the ratio of width to height of a single stope and single-stope backfill are large. The single-stope backfill is not narrow. Second, the overall size of the single-stope backfill is small, and its exposure time is short. The single-stope backfill goes together with an adjacent layer and stopes backfill. So, in study area, the issue of backfill mechanical behavior is analyzed from whole or local stability. This article studied backfill mechanical behavior and stability based on a field investigation, monitoring data, and numerical simulation. This study could provide suggestions for mining safety and support operation.
2. Background
2.1. Geology
In this article, the major study area is No.2 zone of the Jinchuan Nickel Mine. The Jinchuan Nickel Mine has the largest deposit of nickel in China. The mine is located in the city of Jinchang in northwest of China. The ore deposit is about 6.5 km long, 10s of meters to 570 m in width, and extends to more than 1000 m in depth [36,37,38]. The strike of the ore body is northwest and dips to the southwest, and the dip angle ranges from 40° to 70°. The profile of ore body existence is shown in Figure 1.
2.2. Mining Situation
The mechanized backfill mining technique was adopted at the Jinchuan Mine. In the mining process, once excavation is finished within an access drift, the void is filled using cement paste before the next access drift is excavated. Mining proceeds from top to bottom in a series of horizontal four-meter-high drift slices. Mining panels are approximately 100 m wide and perpendicular to the strike of the ore body [39,40,41]. To increase production, simultaneous mining is carried on two or more sub-levels. The annual output of No.2 zone of the Jinchuan Nickel Mine is over four million tonnes. The mining situation in the study area is shown in Figure 2. The current mining operation carries over 1000 m underground. The field investigation and measurement were extended in a sub-level of 1050 m.
3. Backfill of Study Area
3.1. Backfill Overview in Study Area
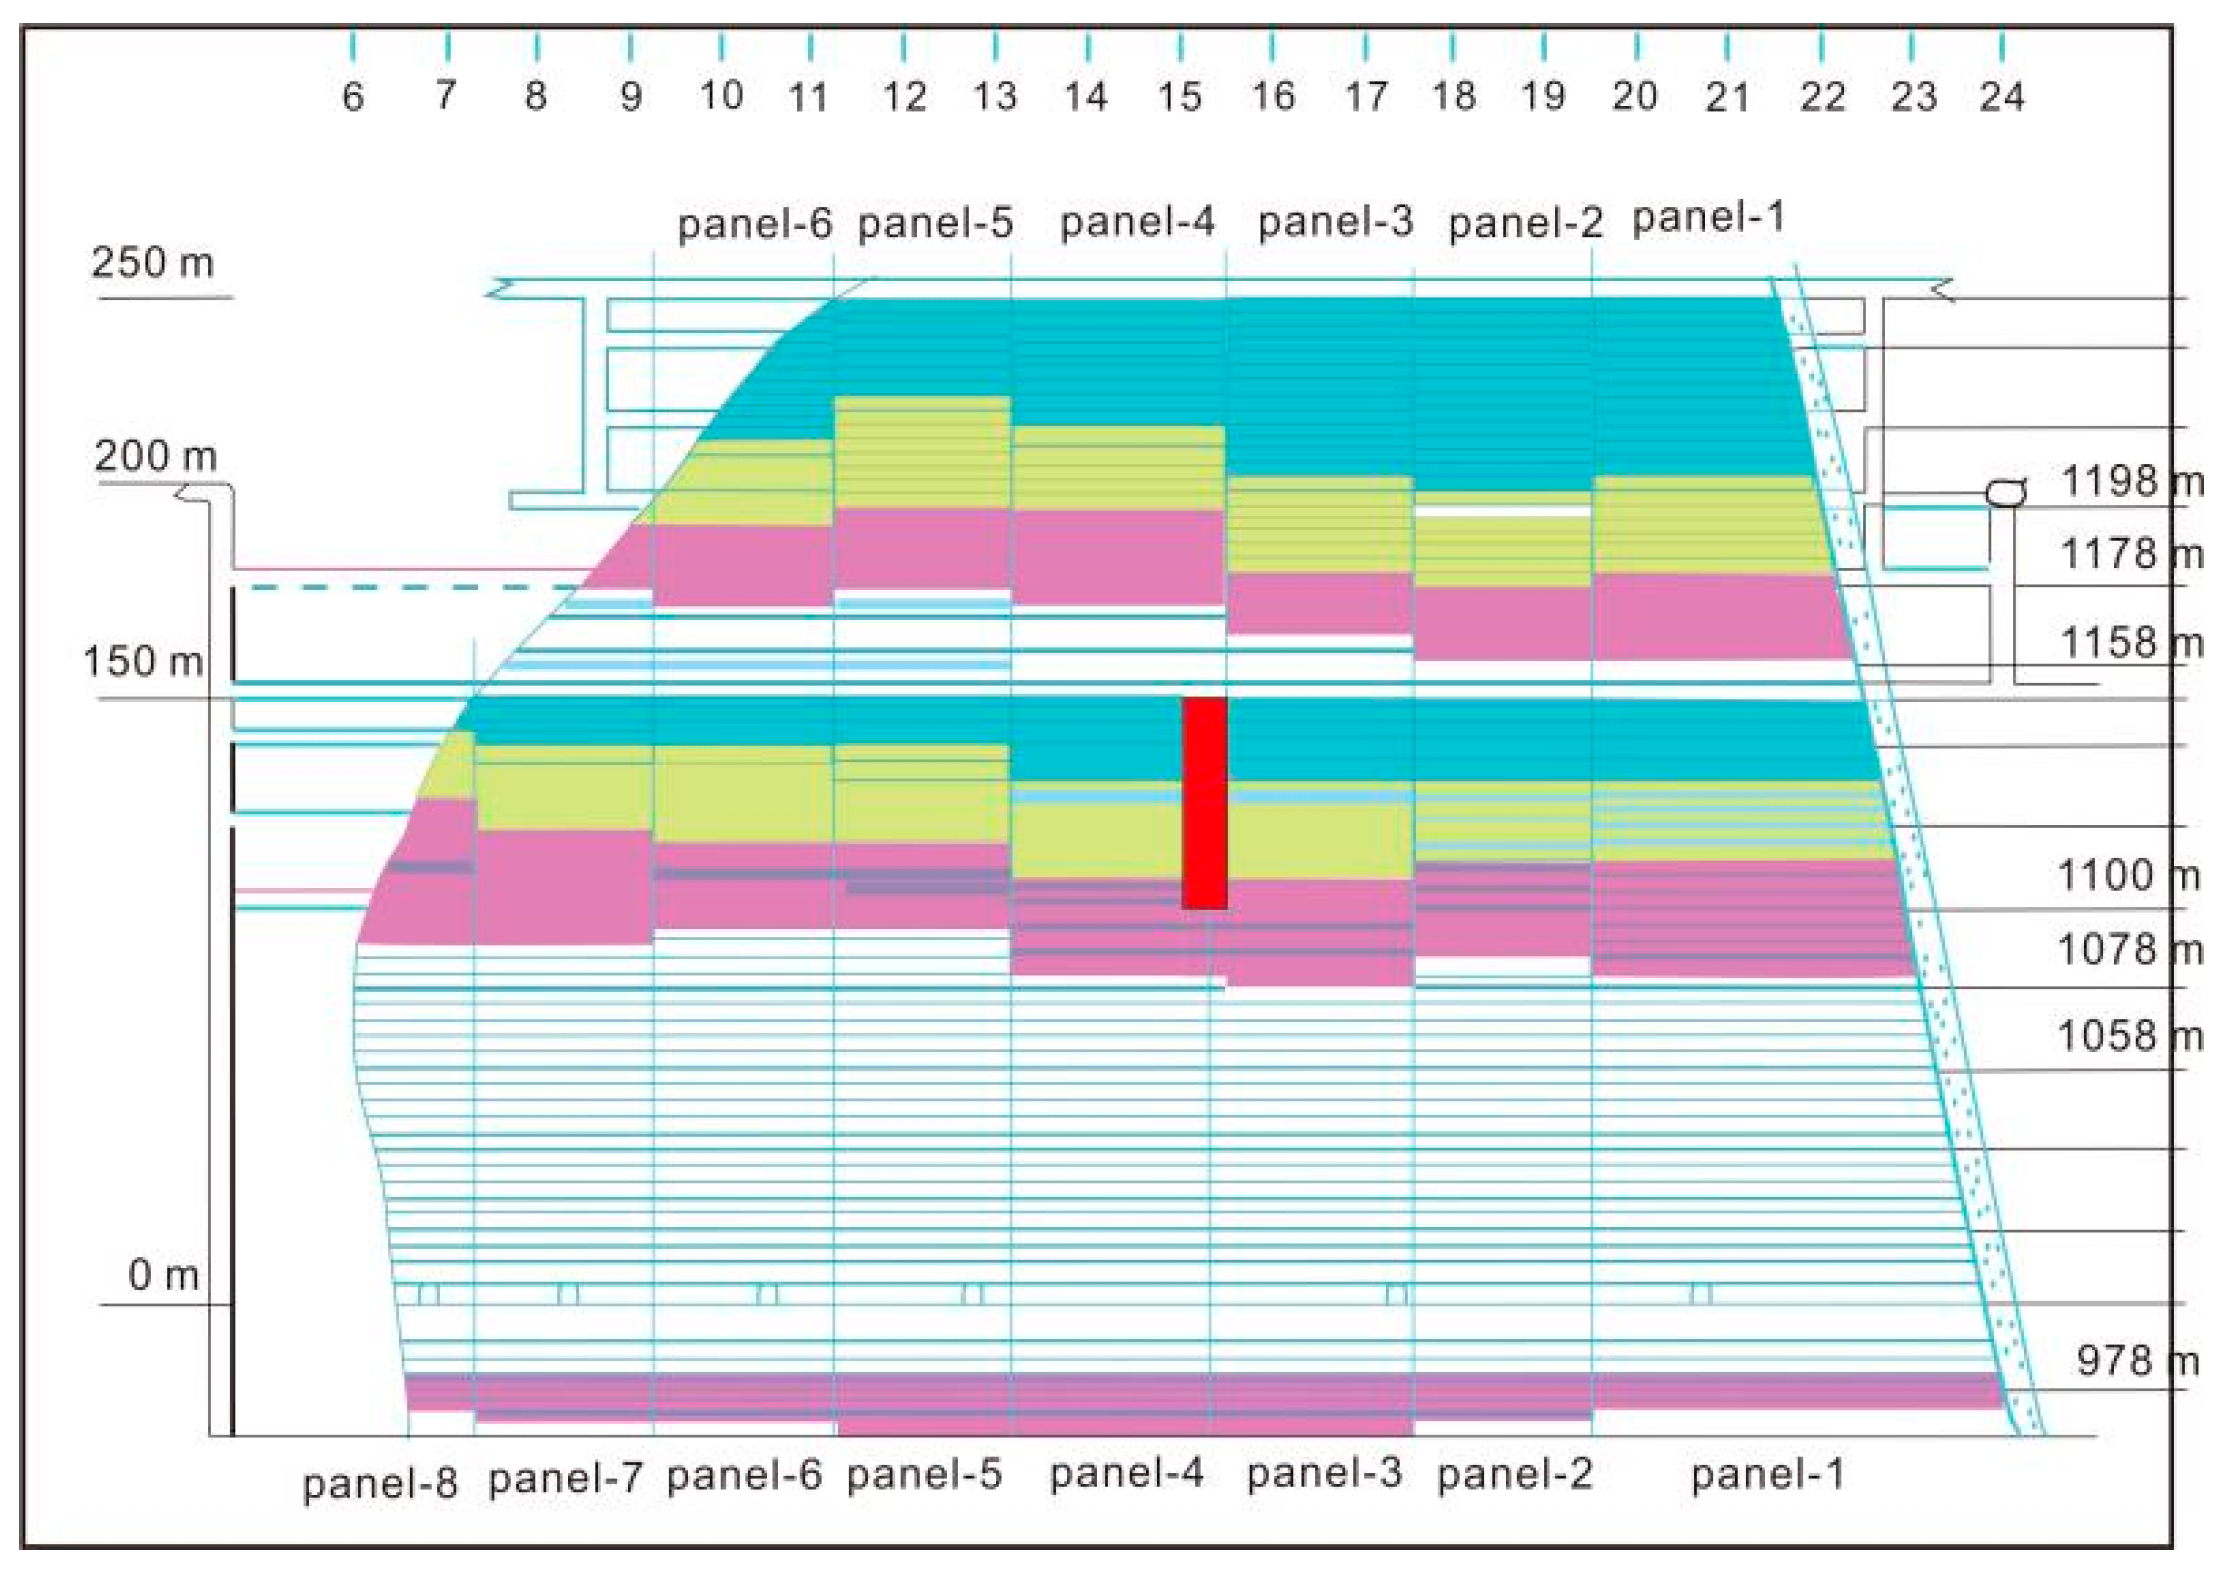
In the No.2 zone of the Jinchuan Nickel Mine, the elevation of the first mining layer is 1334 m, so the top of the backfill starts from this level. A horizontal mining layer is divided into six to eight panels, as shown in Figure 2. The size of each mining panel is about 100 m wide and is perpendicular to the strike of the ore body and backfill, and the void caused by mining is immediately filled. The mining operation is transferred the next layer after each panel of ore body is excavated. A layer of backfill is formed after all panels in same layers are filled. The backfill material is cement paste with tailings and some additives. Generally, the cement:sand ratio of the backfill is 1:4, and the curing time is 28 d. Slurry concentration is greater than 80.8%. The backfill replaces the ore body without pillars, so the upper layer backfill serves as the artificial roof of the next mining layer. Over 30 years of mining, a large and thick backfill body has formed, and its depth is more than 1000 m. The mechanical properties of backfill were obtained by a series of tests. The average uniaxial compression strength of the backfill is 5.09 MPa. The passion ratio of the backfill is 0.146, while the passion ratio of the surrounding rock is 0.261. The average tensile strength is 0.59 MPa.
With an accurate underground measurement and design drawing, we can build the exact boundary of the backfill body in the study area. The boundary provides the geometric basis of the following numerical and mechanical analysis. Because of the mining operation, the measurements were conducted in three sessions, and the three parts of the backfill are shown in Figure 3. The three parts of the backfill are located at 1334–1250 m, 1250–1100 m, and 1100–1050 m, respectively. The length maximum is 1600 m, and the width maximum is 250 m.
3.2. Backfill Deformation and Ground Subsidence
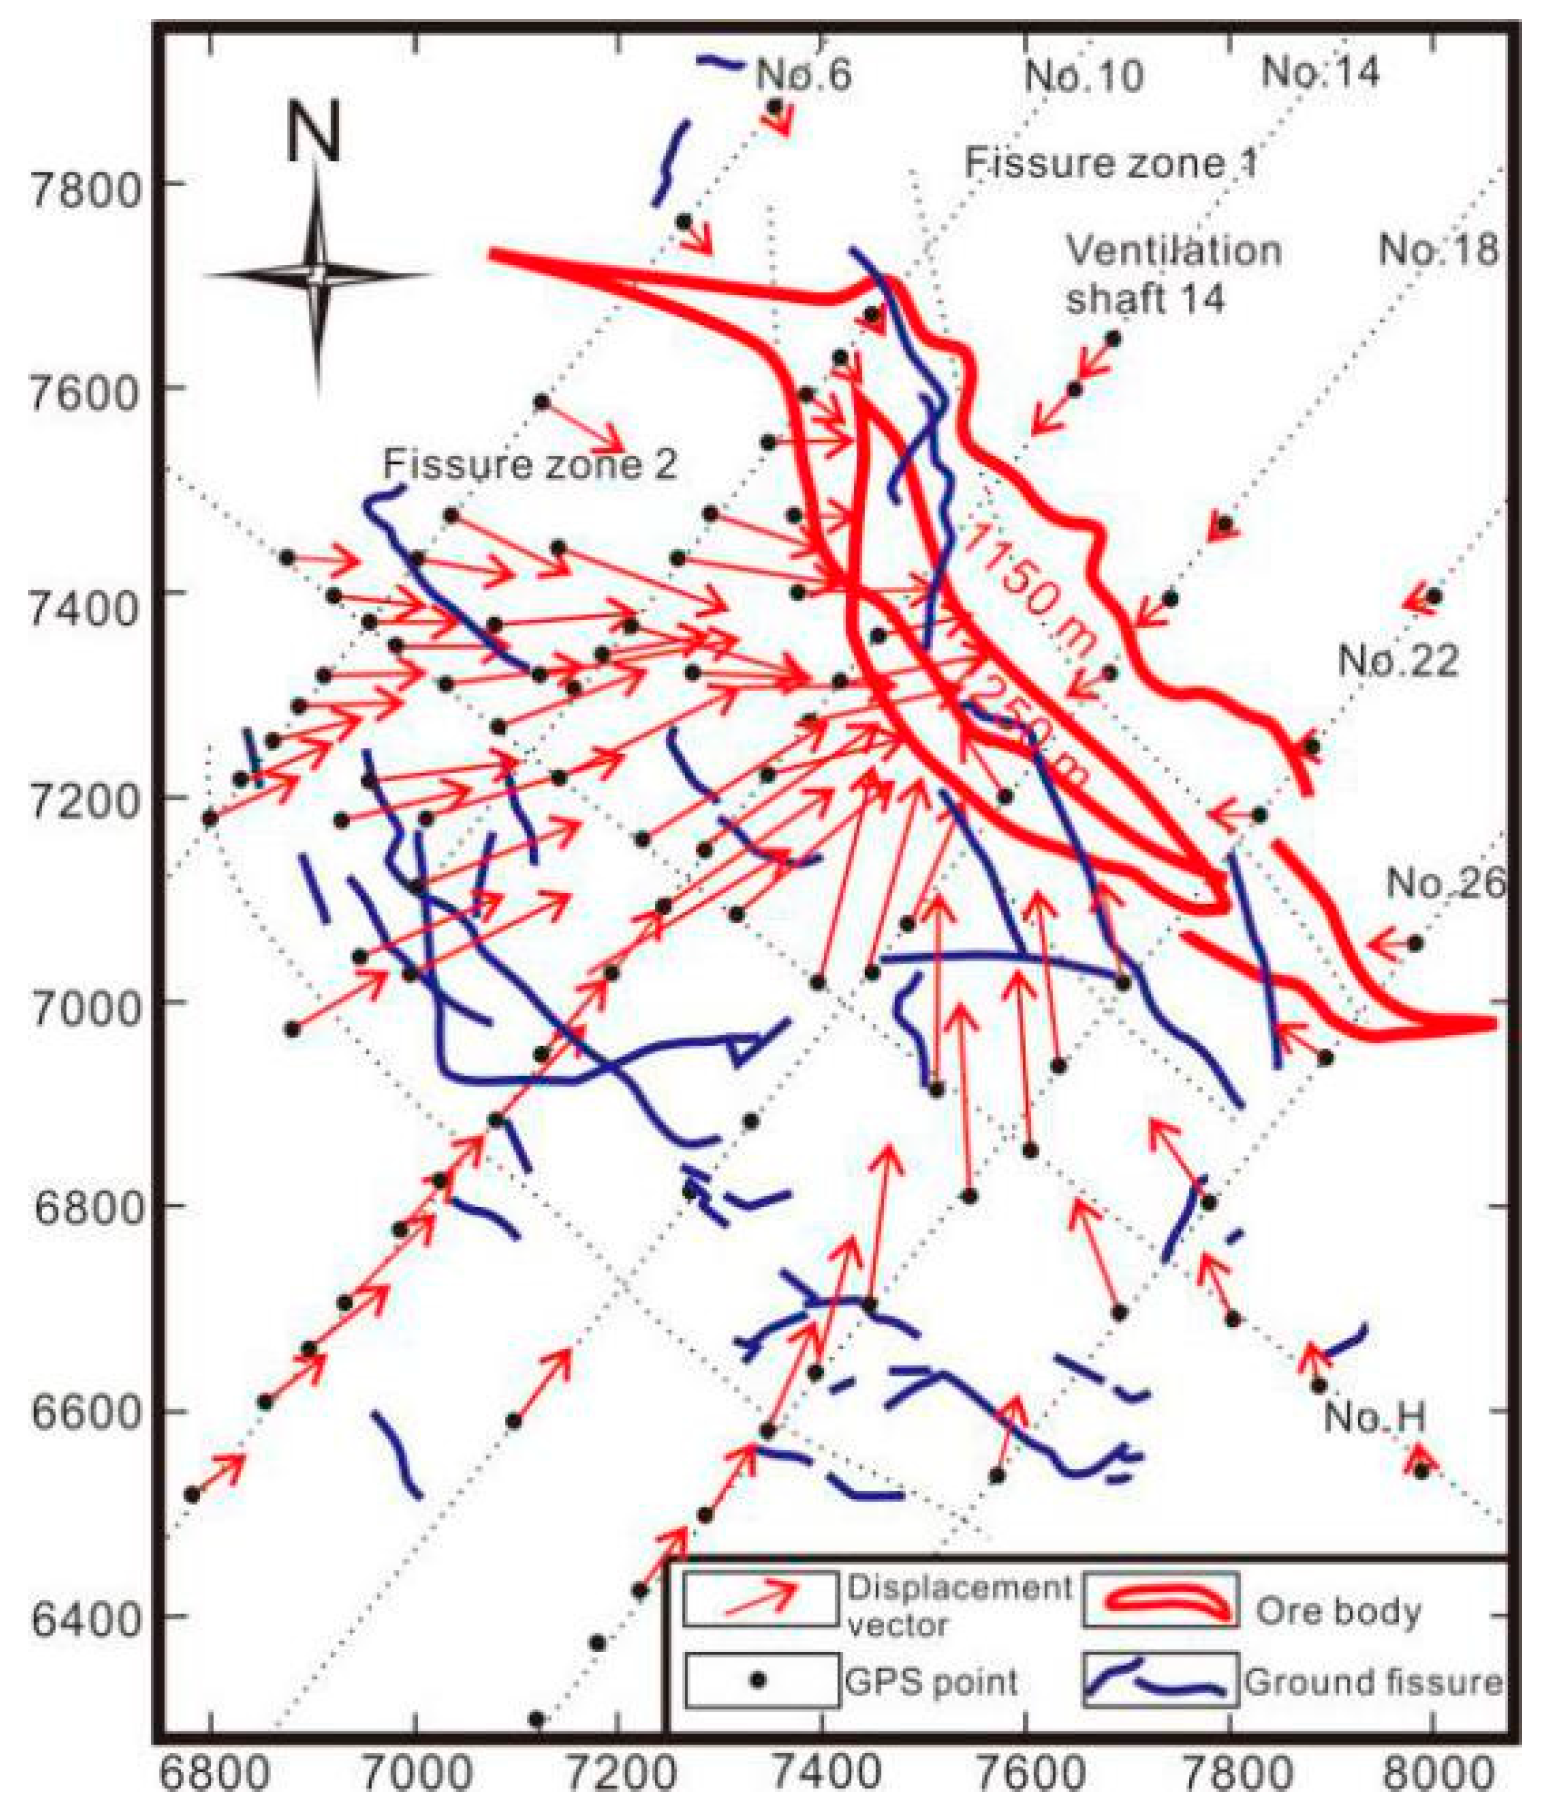
The primary reason for ground movement is backfill deformation. Global Positioning System (GPS) monitoring points were laid out in the Jinchuan No. 2 mine in 2001 in order to study overlying rock mass deformation and ground movement induced by backfill deformation. Surface fissures were also monitored. Field monitoring was carried out every six months, beginning in 2001. Monitoring result show that the ground movement is lagging behind the underground mining and filling.
The displacements of ground monitoring points can reveal the characteristics of backfill deformation to some degree. Figure 4 shows the horizontal displacement vectors of the ground monitoring points. The displacements of the monitoring points in the hanging wall are larger than the points in the foot wall. All horizontal displacement vectors pointed to a centrally located settlement. The settlement center was located on exploration line-14. This phenomenon indicated that the backfill deformation near exploration line-14 is larger than other exploration lines. Horizontal displacement vectors end in the boundary of the backfill in sub-level 1250 m and sub-level 1150 m. The stress distribution of the boundary part of the backfill is more complex.
4. Underground Field Monitoring of Backfill Stress Distribution and Displacement
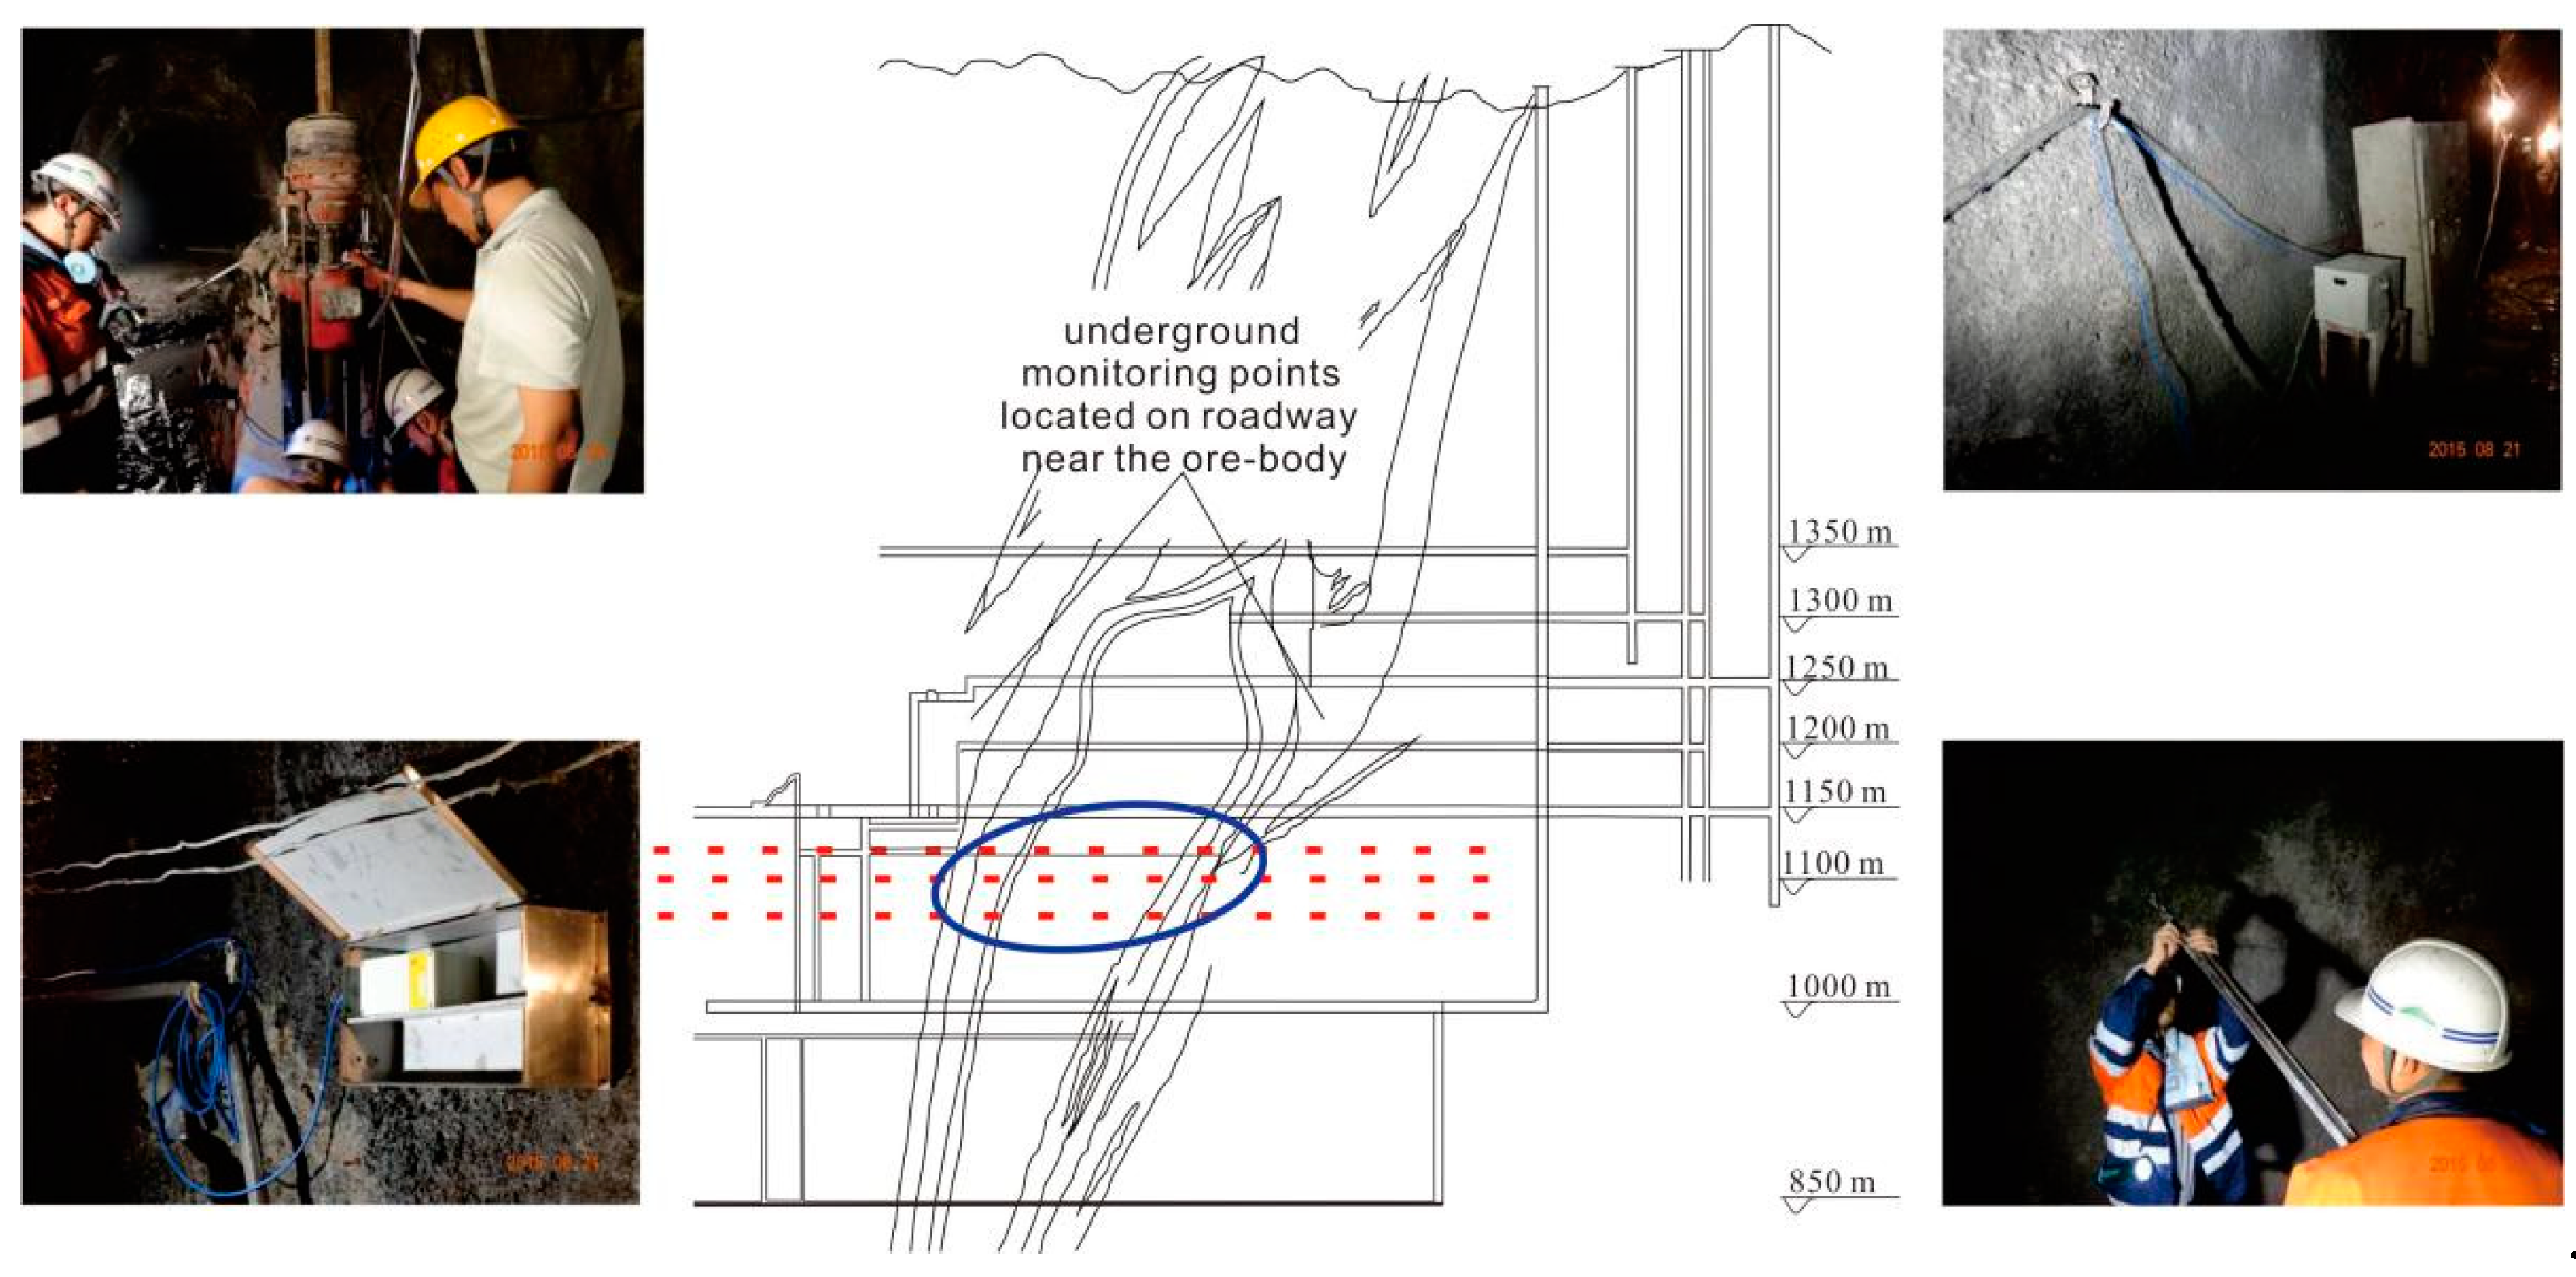
Points of stress and displacement monitoring were laid according to backfill distribution in underground. Monitoring instruments were set in the sublevel 1100 m. The location of the monitoring points are shown in Figure 5.
4.1. Bed Separated Displacement Monitoring of the Backfill
One of critical controlling factors of backfill stability is bed separation displacement. In the study area, mining has proceeded from top to bottom in a series of horizontal four-meter-high drift slices. Once excavation is finished within an access drift, the void is filled using cement paste before the next access drift is excavated. To guarantee output, mining occurs at two sub-levels simultaneously. Backfill in different levels are formed at different times. The bed separation displacement occurred because of the volume shrinkage of the backfill. The bed separation displacements were monitored in sub-level 1100 m, using displacement meters in different depths of backfill.
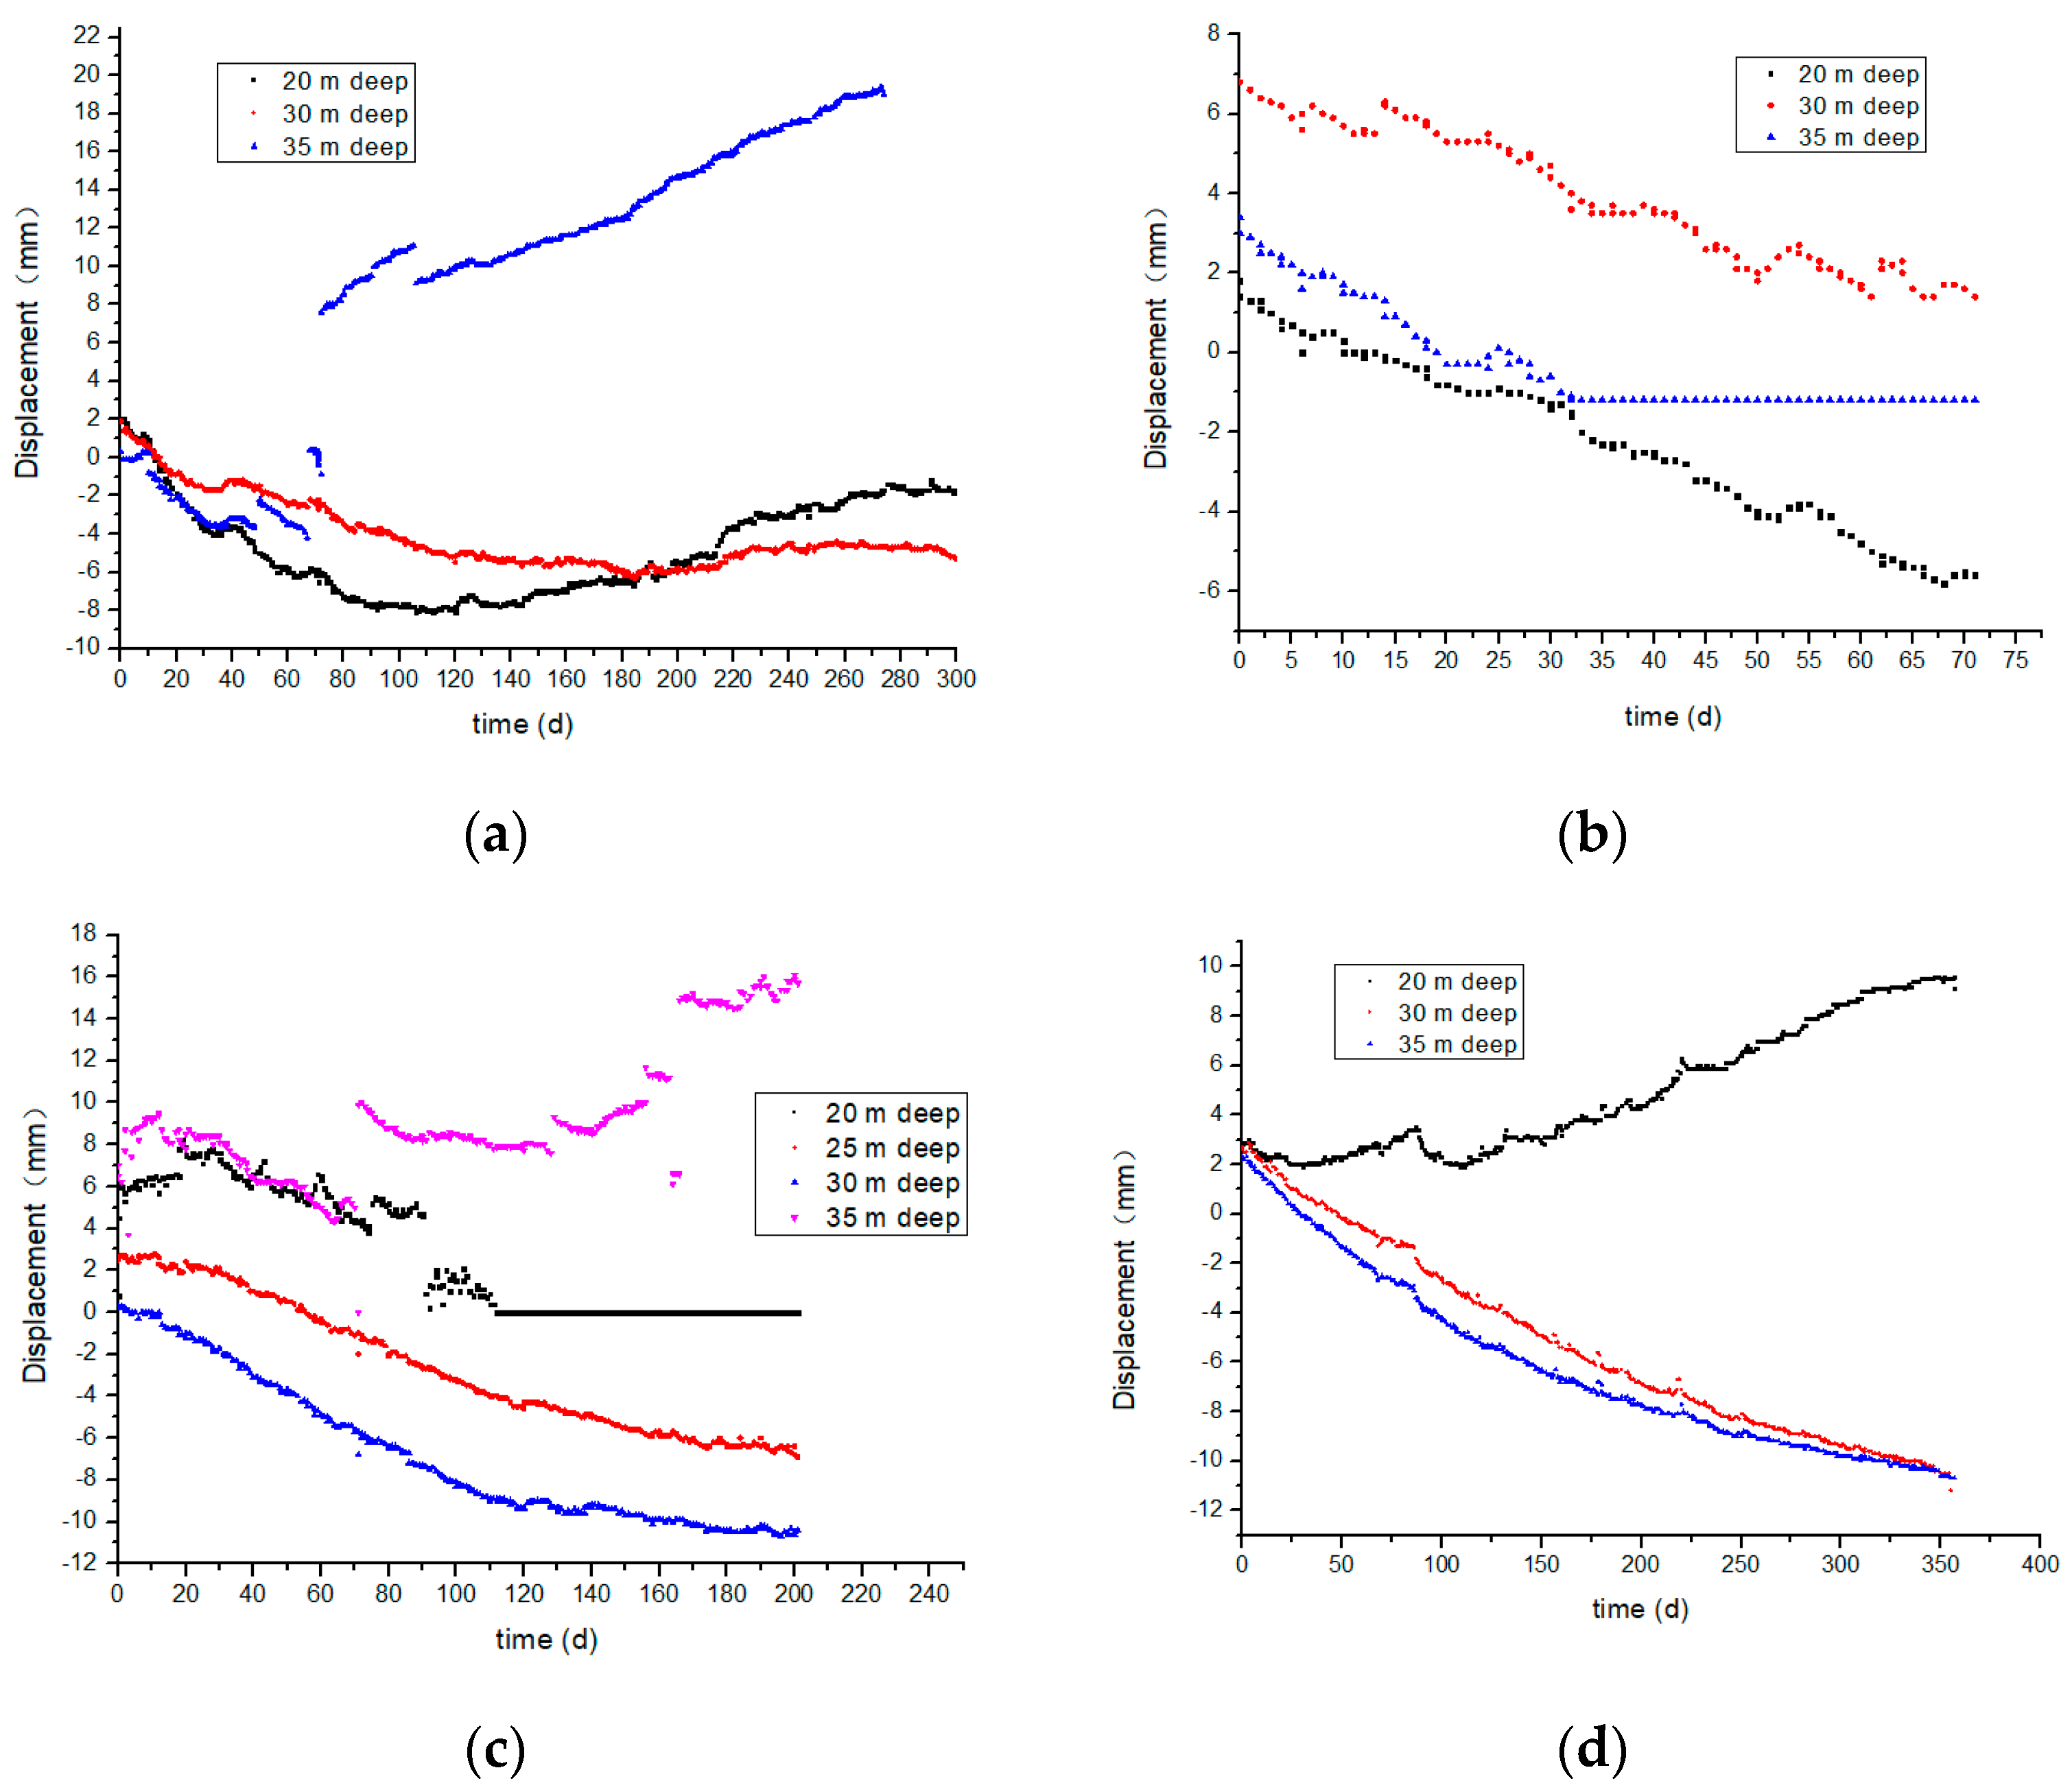
The monitoring meters layout in sub-level 1100 m along four exploration lines, respectively. The monitoring meters were set in exploration line-12, line-14, line-16, and line-17. Bed separation displacement monitoring work was built together in groups of four meters that extend to the following four depths: 20 m, 25 m, 30 m, and 35 m. The duration of monitoring was three months, and the results of the monitoring are showed in Figure 6.
The bed separated displacement monitoring results demonstrated contraction deformation of different parts of the backfill in sub-level 1100 m. All the displacement values were less than 20 mm. Separated displacement of the backfill located exploratory line-12 occurred at the initial stage. However, this displacement tended to reduce as the mining went deeper. The separated deformation was intended to be stable in this part. The trend of bed separated displacement of the backfill located in exploratory line-14 and line-16 was consistent. At the initial stage, the upper displacement (monitored by 20 m deep meter), the middle displacement (monitored by 25 m and 30 m deep meters), and lower displacement (monitored by 35 m deep meter) have the same change. After two months, the separated deformation appeared upper displacement at the upper part of backfill, and the downward displacement appeared in the lower part of the backfill. The bed separated deformation was accelerated at these parts of backfill. Separated displacement of the backfill located at exploratory line-17 was not obvious.
One of factors influencing bed separated displacement is the effect of mining at two levels simultaneously. The monitoring results indicated that separated displacement of the backfill part in exploratory line 14 was larger than in other parts. This characteristic was consistent with the ground movement.
4.2. Stress Distribution of the Backfill in Sublevel-1100 m
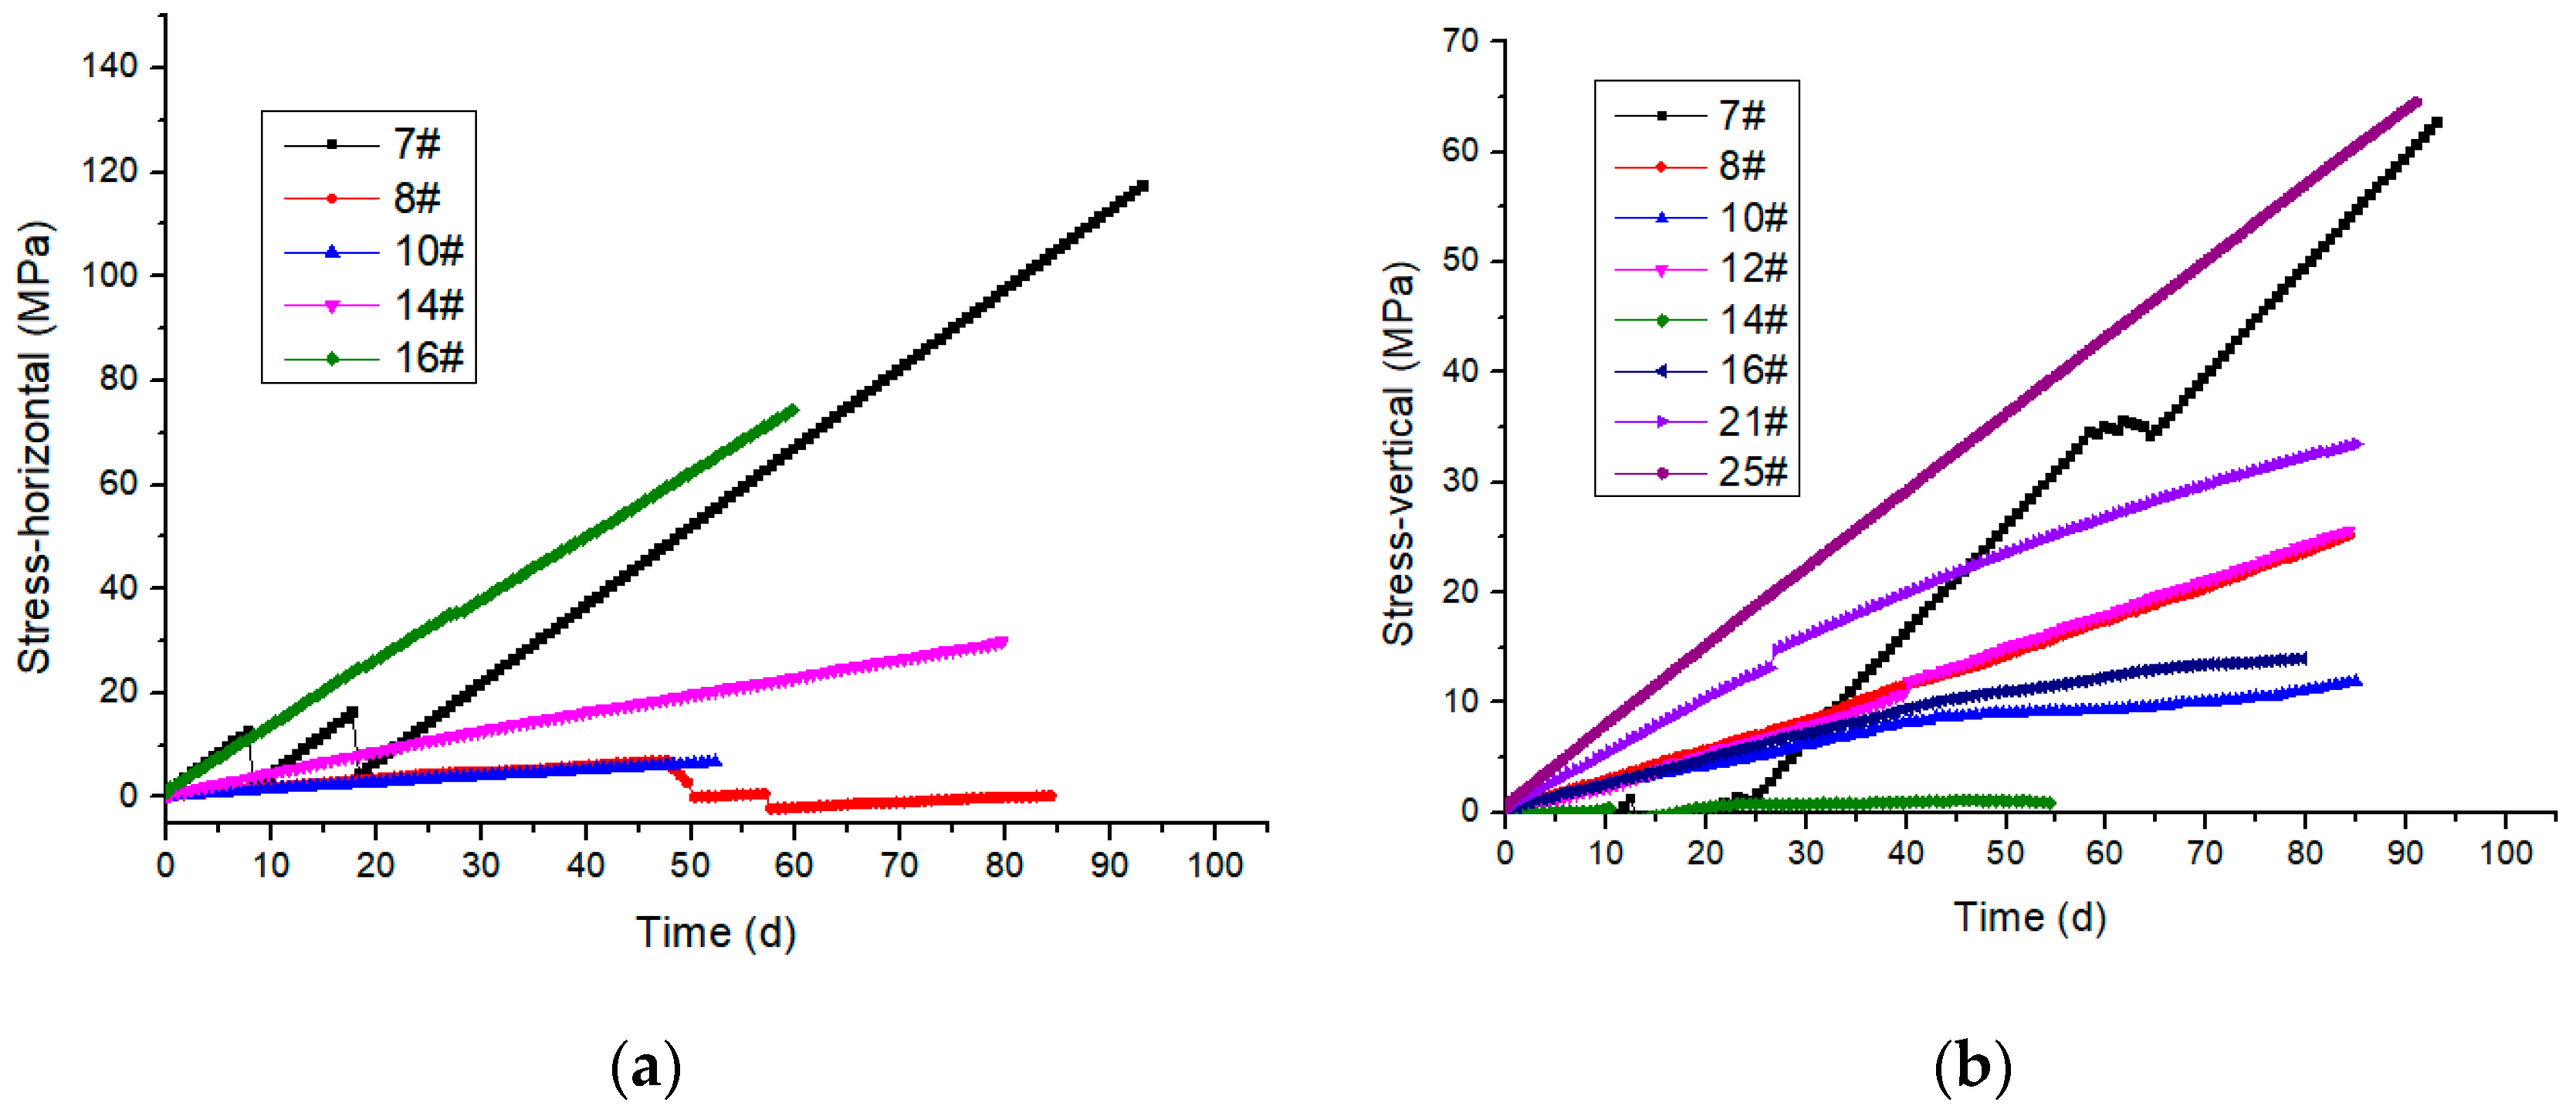
Based on the site conditions, monitoring points were set in several of the exploration lines. The backfill of sublevel-1100 m was distributed between exploration line-7 and line-25. The monitoring points were located in exploration line-7, line-8, line-10, line-12, line-14, line-16, line-21, and line-25, respectively. The monitoring duration was three months. The cumulative horizontal and vertical stresses are shown in Figure 7.
The monitoring results in Figure 7 demonstrate the stress distribution of different parts of backfill in sub-level 1100 m. For most monitoring points, horizontal stress is larger than vertical stress in all parts of the backfill at same time. This was caused by local tectonic stress in the study area. This level of backfill can divided into two parts—the boundary part and the internal part. The backfill in sub-level 1100 m is stretched from exploration line-7 to line-25, and the line-7 and line-25 parts of backfill presented the boundary part, while the other lines parts presented the internal part. The monitoring results showed that the horizontal stress of the backfill part in line-7 is 117.62 MPa and the vertical stress is 62.77 MPa. For the backfill part in line-25, the vertical stress is 64.52 MPa, and the horizontal stress data is missing due to instrument damage.
For the internal part of the backfill, the horizontal stresses in line-8, line-10, line-14, and line-16 are 6.95 MPa, 6.74 MPa, 29.79 MPa, and 74.36 MPa, respectively. The vertical stresses in line-8, line-10, line-12, line-14, line-16, and line-21 are 25.21 MPa, 11.89 MPa, 25.61 MPa, 1.16 MPa, 13.99 MPa, and 33.47 MPa, respectively. Both horizontal and vertical stresses of the internal part of the backfill are much smaller than in the boundary part.
The backfill is a passive support measurement. The exterior load acted on the surrounding rock and then transferred to backfill through the rock material.
The vertical stress of the internal backfill is much less than that of the boundary part of the backfill. The point with the minimum value of stress is located on exploratory line-14. This part of the backfill is the center part of backfill along its strike.
The stress of the internal parts of the backfill was less than that in the boundary parts of the backfill. The backfill located on exploratory line 14 is the internal part, where the stress was only 1.16 MPa. This part of the backfill is the center of the backfill along its strike. Corresponding to the ground movement, the settlement center is also located in exploratory line-14, and several main fissures were concentrated near the settle center in exploratory line-14. It should be noted that the bed separation displacement of the backfill in line-14 increased during the monitoring duration. Combined with the corresponding ground subsidence, the internal part of the backfill located on exploratory line-14 released its accumulated stress. This situation led to the stress of backfill in exploratory line-14 is much lower than other parts of the backfill.
5. Numerical Simulation
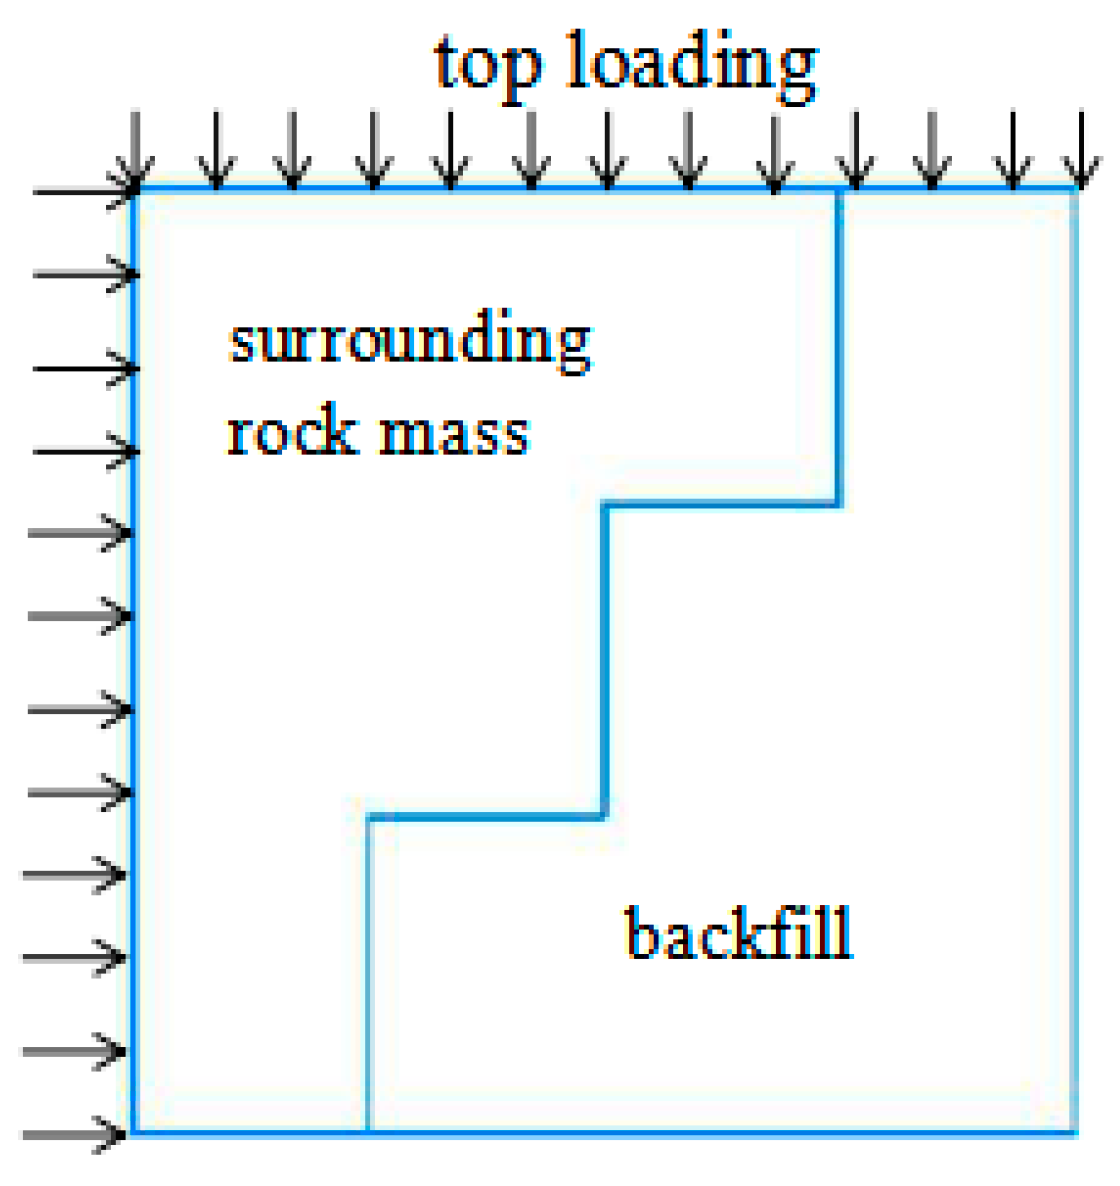
According to the monitoring data analysis, the stress value of the internal backfill is small for both horizontal and vertical stress, while the boundary part of the backfill distributed larger stress than the internal part. Contact between the boundary part of the backfill and the surrounding rock resulted in a complex stress situation. In the contact area between part of surrounding rock and the backfill (the boundary part of the backfill), the difference of stiffness and strength between the surrounding rock mass and the backfill led to different stress transfers and different types of deformation. According to our investigation, the backfill boundary in the study area is irregular. The geometric feature of the backfill boundary is a step-profile. This irregular boundary is beneficial for backfill stability, but this boundary resulted in an even more complex stress distribution and deformation in the contact area of the backfill and the surrounding rock. In this article, the discrete element method was carried out to simulate the backfill and the surrounding rock stress distribution and deformation in the contact area using software of Particle Flow Code-2D (PFC2D, ITASCA consulting Group, Minneapolis, MN, USA) software. A numerical model was built up to analyze the characteristics of stress distribution and deformation influenced by the geometric features of the boundary part of the backfill.
5.1. Introduction to the Numerical Model
For the issue of backfill stability in underground mining, Bloss [42] analyzed deep mining engineering and concluded that one of the main factors of backfill stability is the shear strength of the contact area of the backfill and the surrounding rock. The numerical model simulated the stress distribution of the surrounding rock and the backfill at the point of joint load bearing.
The boundary is a step profile, and the overall size of model is 16 m × 16 m. The single step height is 5.3 m, which is designed according to the mining layer height is 4~5.5 m in practical mining engineering. Particles in the surrounding rock mass have a diameter of 0.5 mm. The backfill part blended two sizes of particles with diameters of 0.6 mm and 0.8 mm as a fine aggregate and a coarse aggregate.
The parameters of the surrounding rock mass and the backfill in the numerical model are as follows: the elastic modulus of the surrounding rock mass is 2 × 10³ MPa, and the elastic modulus of the backfill is 0.3 × 10³ MPa. The normal and shear stiffnesses of the surrounding rock mass are 2 × 10⁹ and 0.5 × 10⁸, respectively.
Geostress measurement showed that horizontal tectonic stress is larger than vertical stress. The horizontal tectonic stress is therefore the major factor. When the mining depth increases, the horizontal and vertical stresses both increase. In the study area, the horizontal stress coefficient—the ratio of horizontal stress and vertical stress—is 1.2~2. According to the practical situation in the study area, the ratio of the horizontal load and vertical load of numerical model is setting two. The sketch of numerical model is shown in Figure 8.
5.2. Stress Transferring in the Boundary Part of the Backfill
Vertical load was set on the top of model, and horizontal load was only acted on the surrounding rock. The horizontal load was transferred to backfill by surrounding rock mass deformation. This loading mode is the feature of backfill as a passive support measurement.
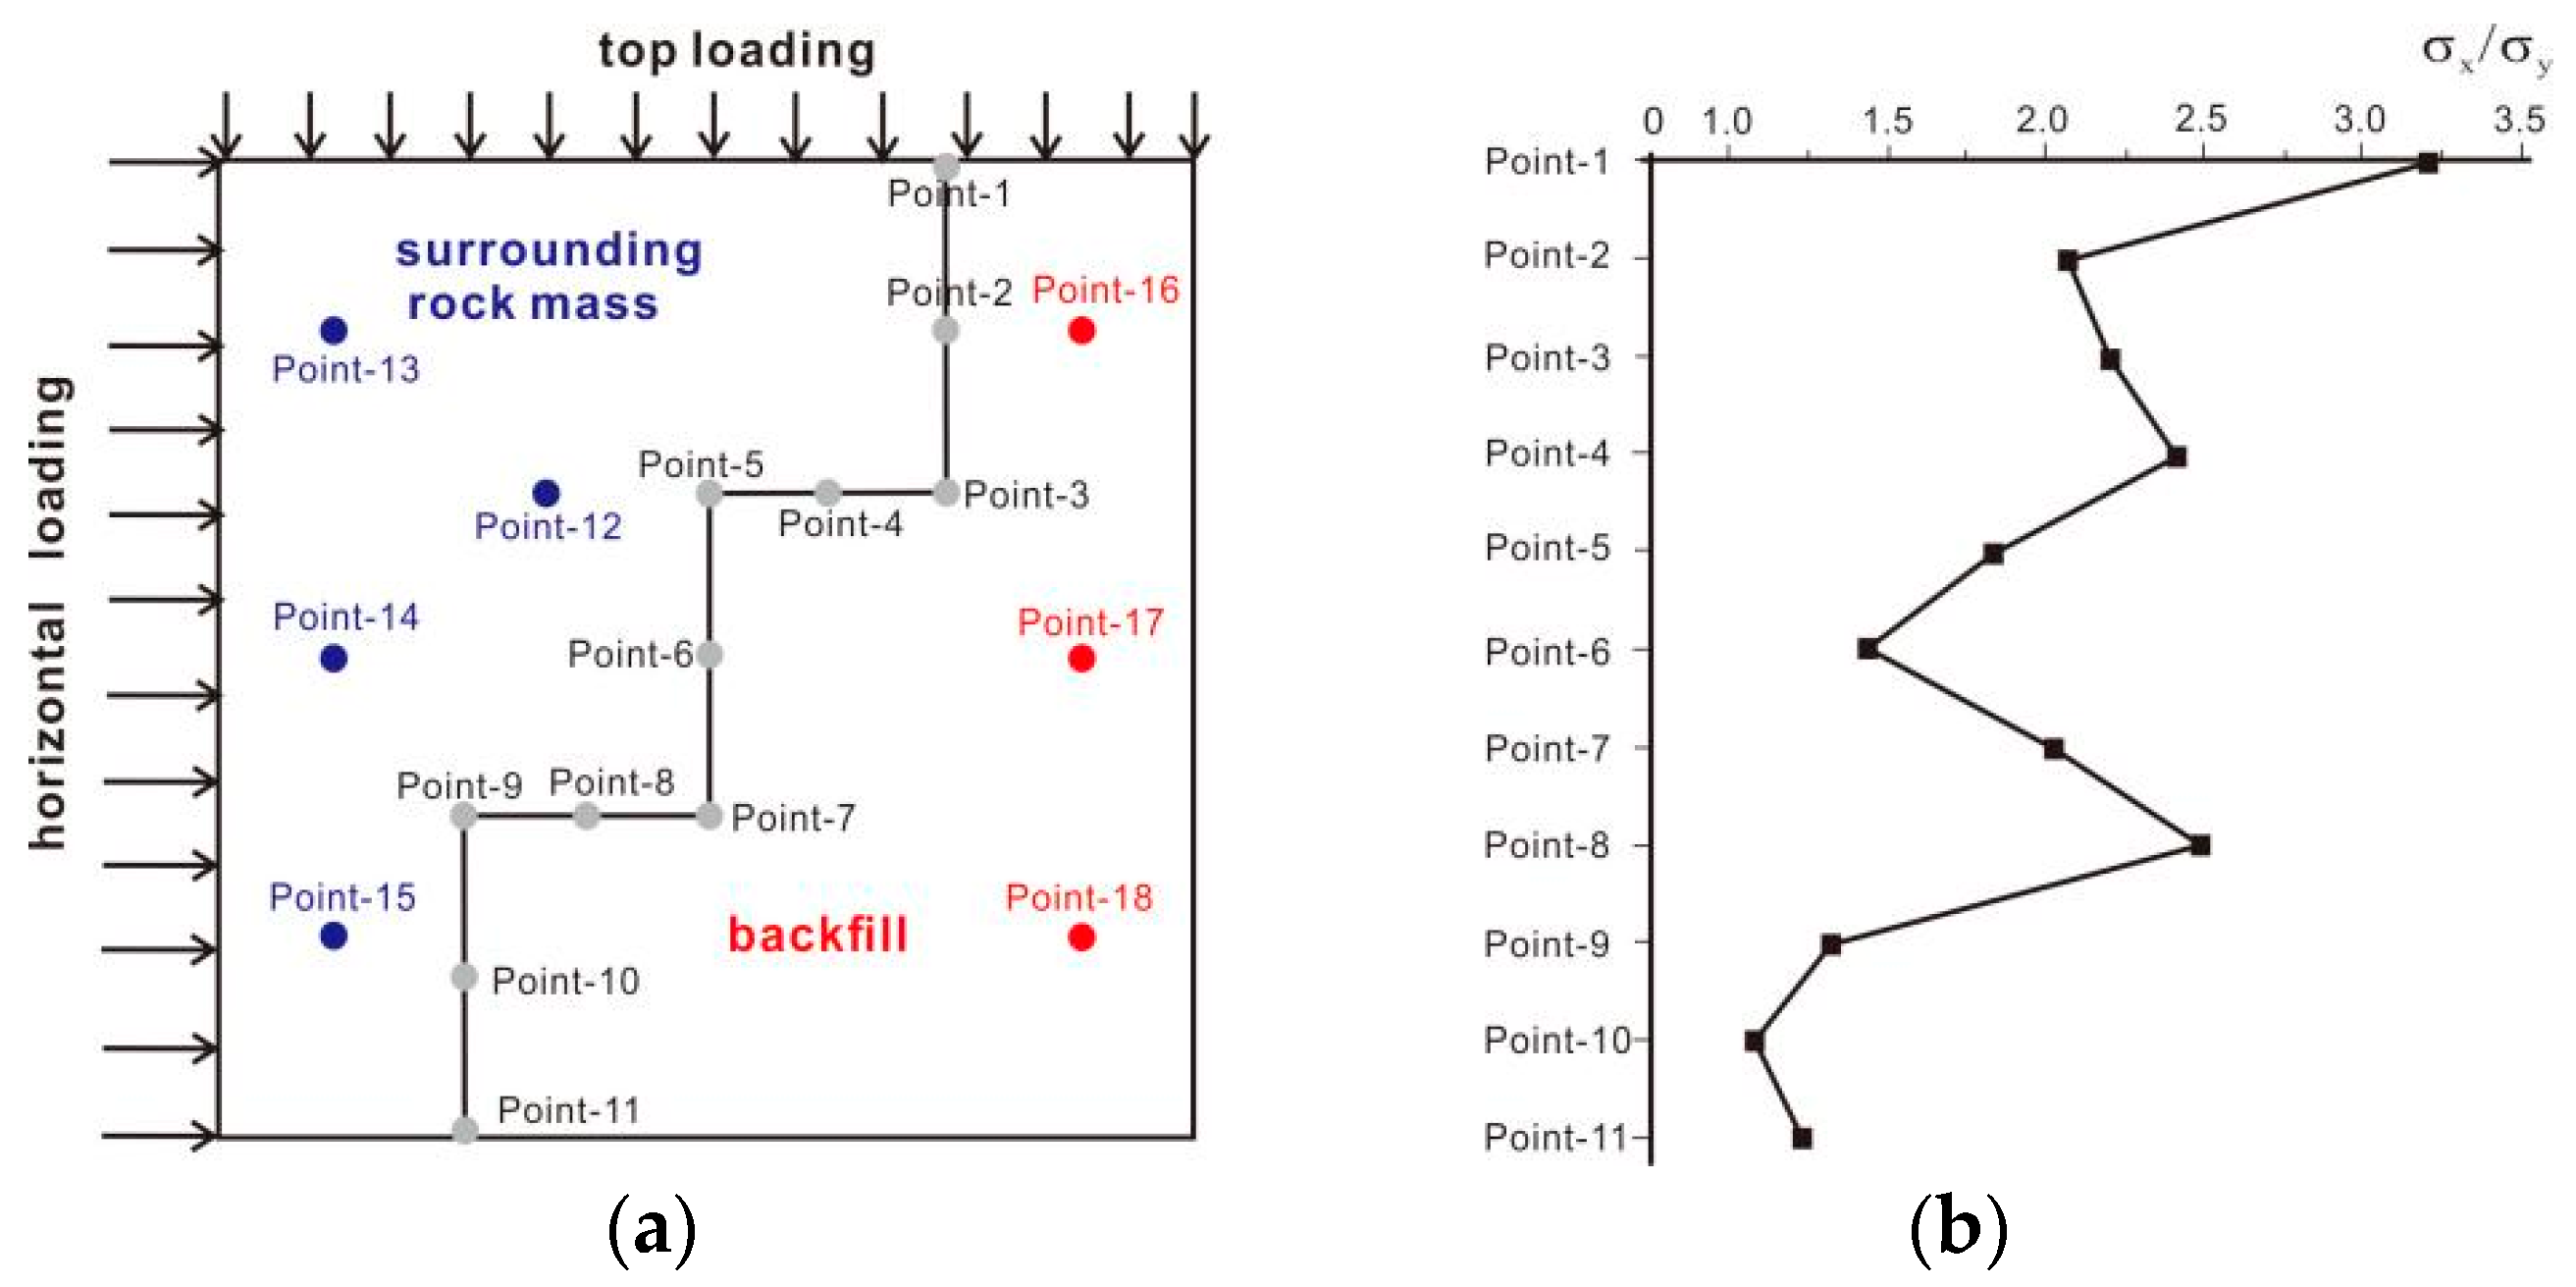
External load is acted on the model, and transferred internal part by surrounding rock mass and backfill material. In numerical model, monitoring points were set along the boundary of backfill to measure stress and displacement. Location of points was shown in Figure 9a. For each point on the boundary part (point 1~point 11), ratio of horizontal stress and vertical stress was shown in Figure 9b. According to geometric features and ratio of horizontal stress and vertical stress of boundary part of backfill, Figure 9, monitoring points could be divided into four types: type one included point 2, point 6 and point 10; type two included point 3 and pint 7; type three included point 4 and point 8; type four included point 5, point 9 and point 11.
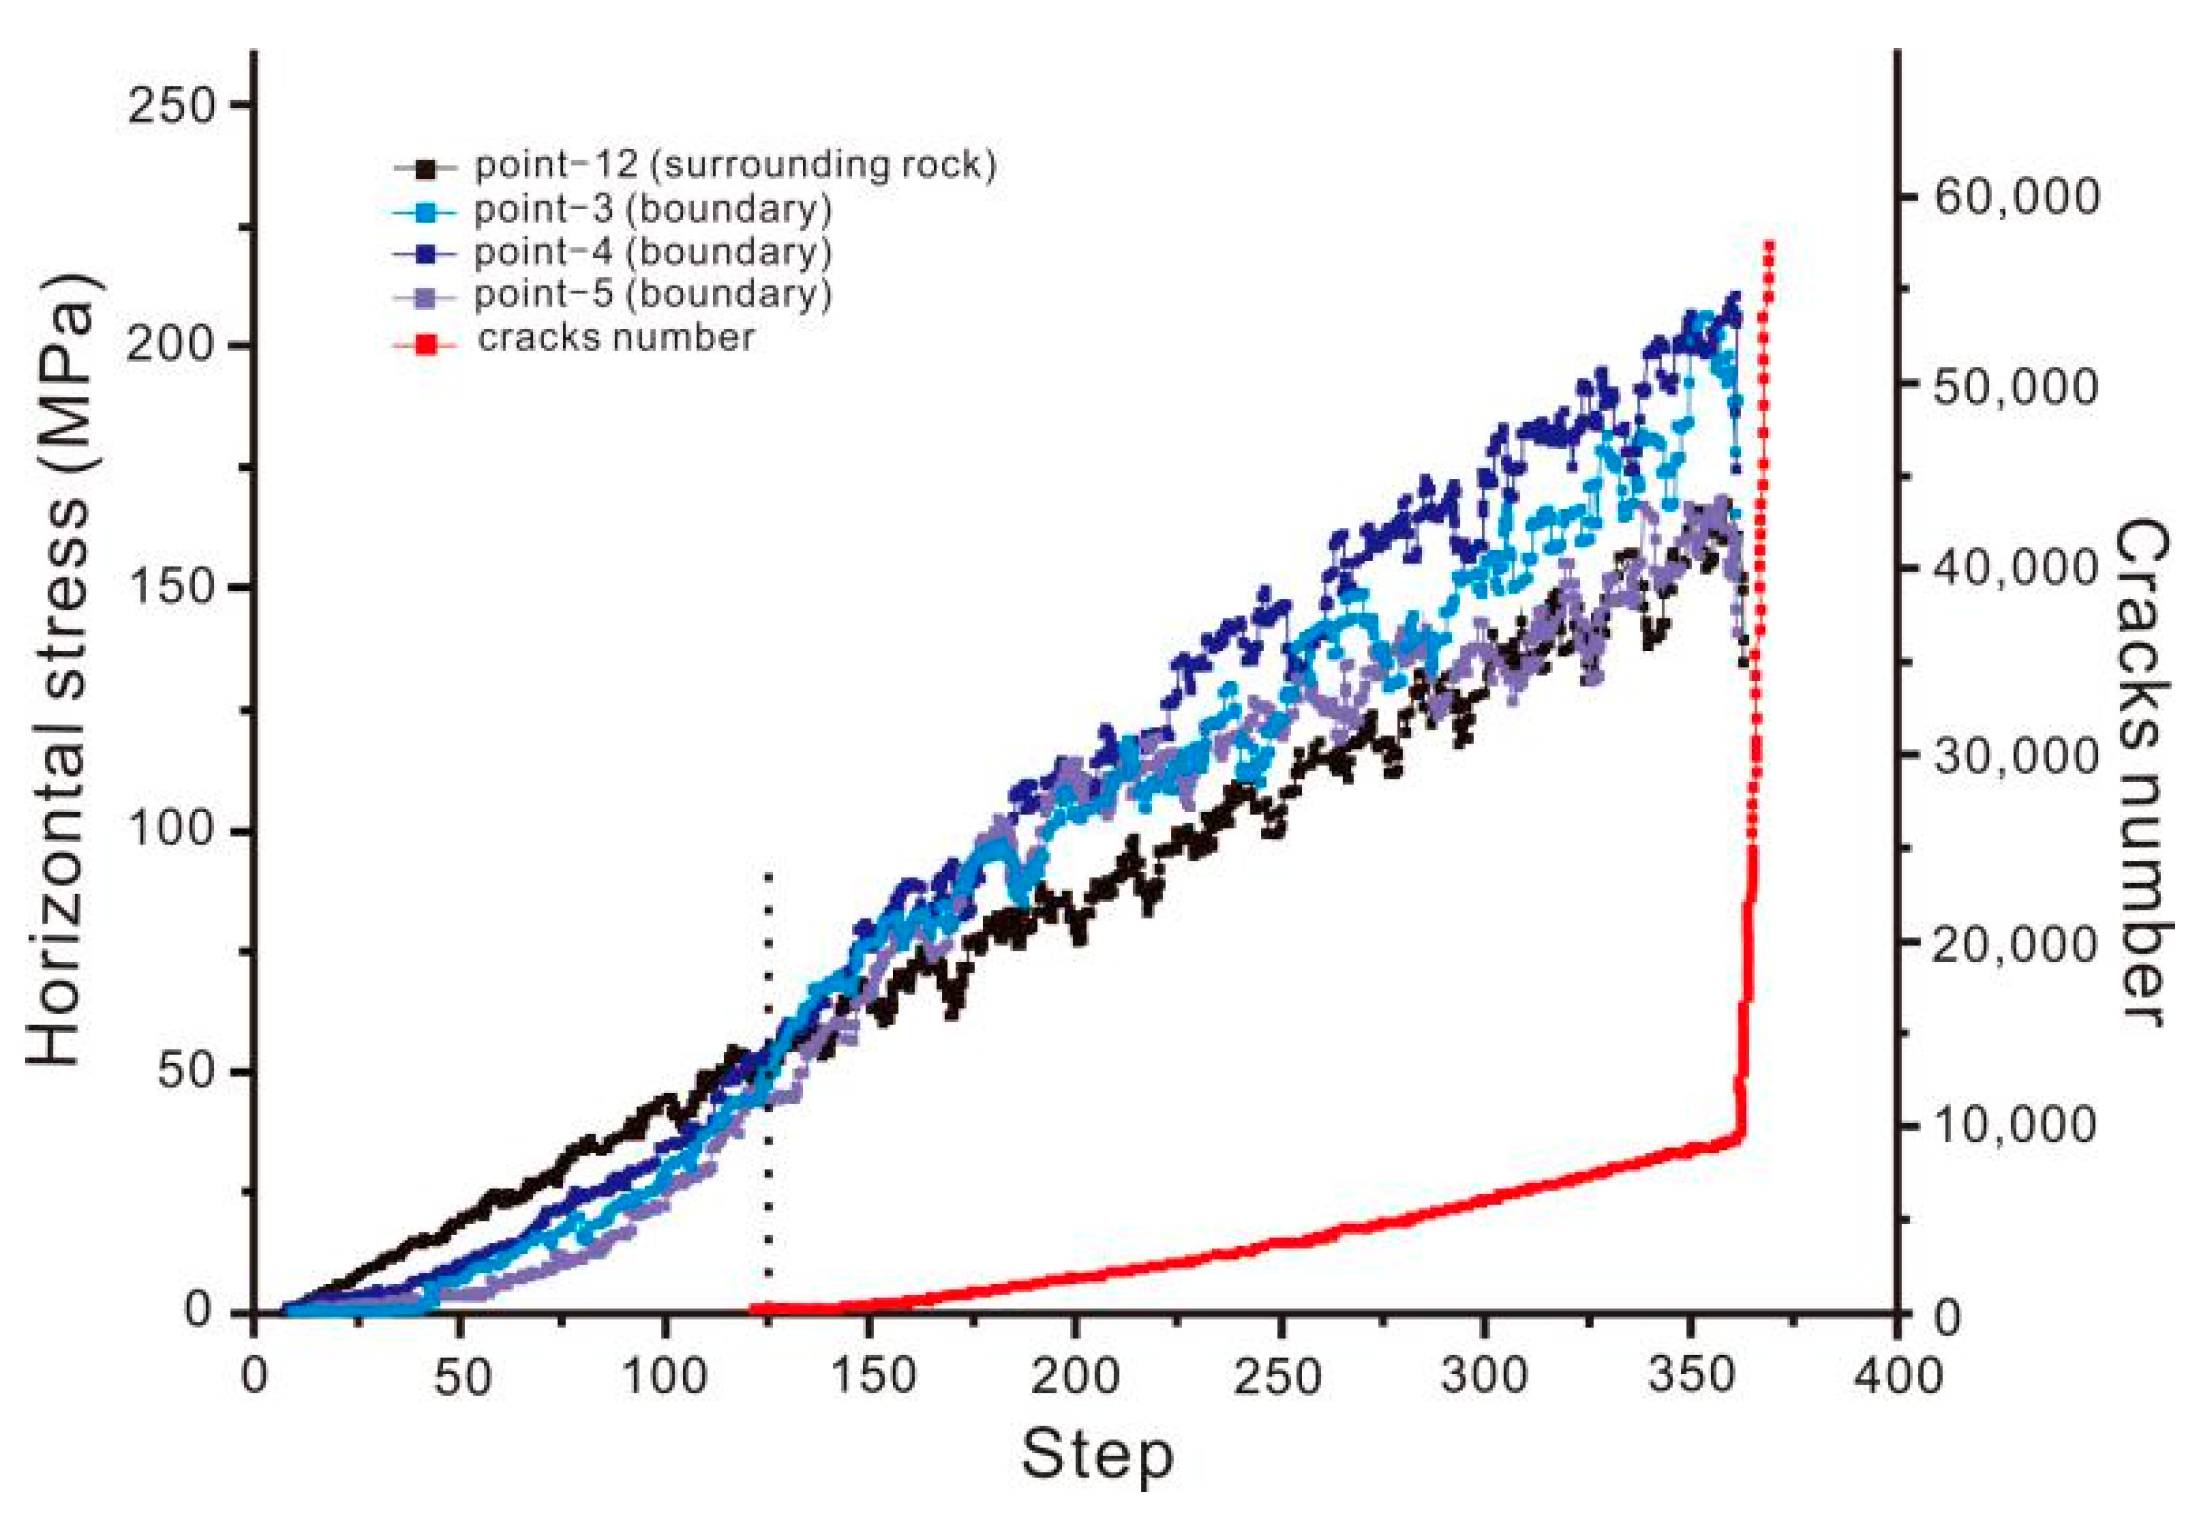
Figure 10 showed the horizontal stress development of surrounding rock and backfill boundary points and these points located at the same level. At initial stage of stress curve, stress of surrounding rock was larger than the stress of the backfill boundary points. Rate of stress increase of surrounding rock remained stable and showed linear tendency. While stress backfill boundary increased slowly at first, then rapidly. This trend was remained until backfill boundary stress was lager than surrounding rock at one time. At this time the crack started initiation compared with crack numbers development (Figure 10).
Displacement monitoring of the model set was done on the adjacent rock point and backfill point on the boundary. After the post-peak stress stage, the displacements of the surrounding rock and the backfill both increased sharply. The increasing failure of the model was more and more obvious as cracks developed. The displacement difference of the surrounding rock and the backfill at the post peak stage occurred suddenly. Uncoordinated deformation emerged on the boundary part of the backfill, which led to cracks and failure.
5.3. Stress Particularity of the Boundary Part of the Backfill
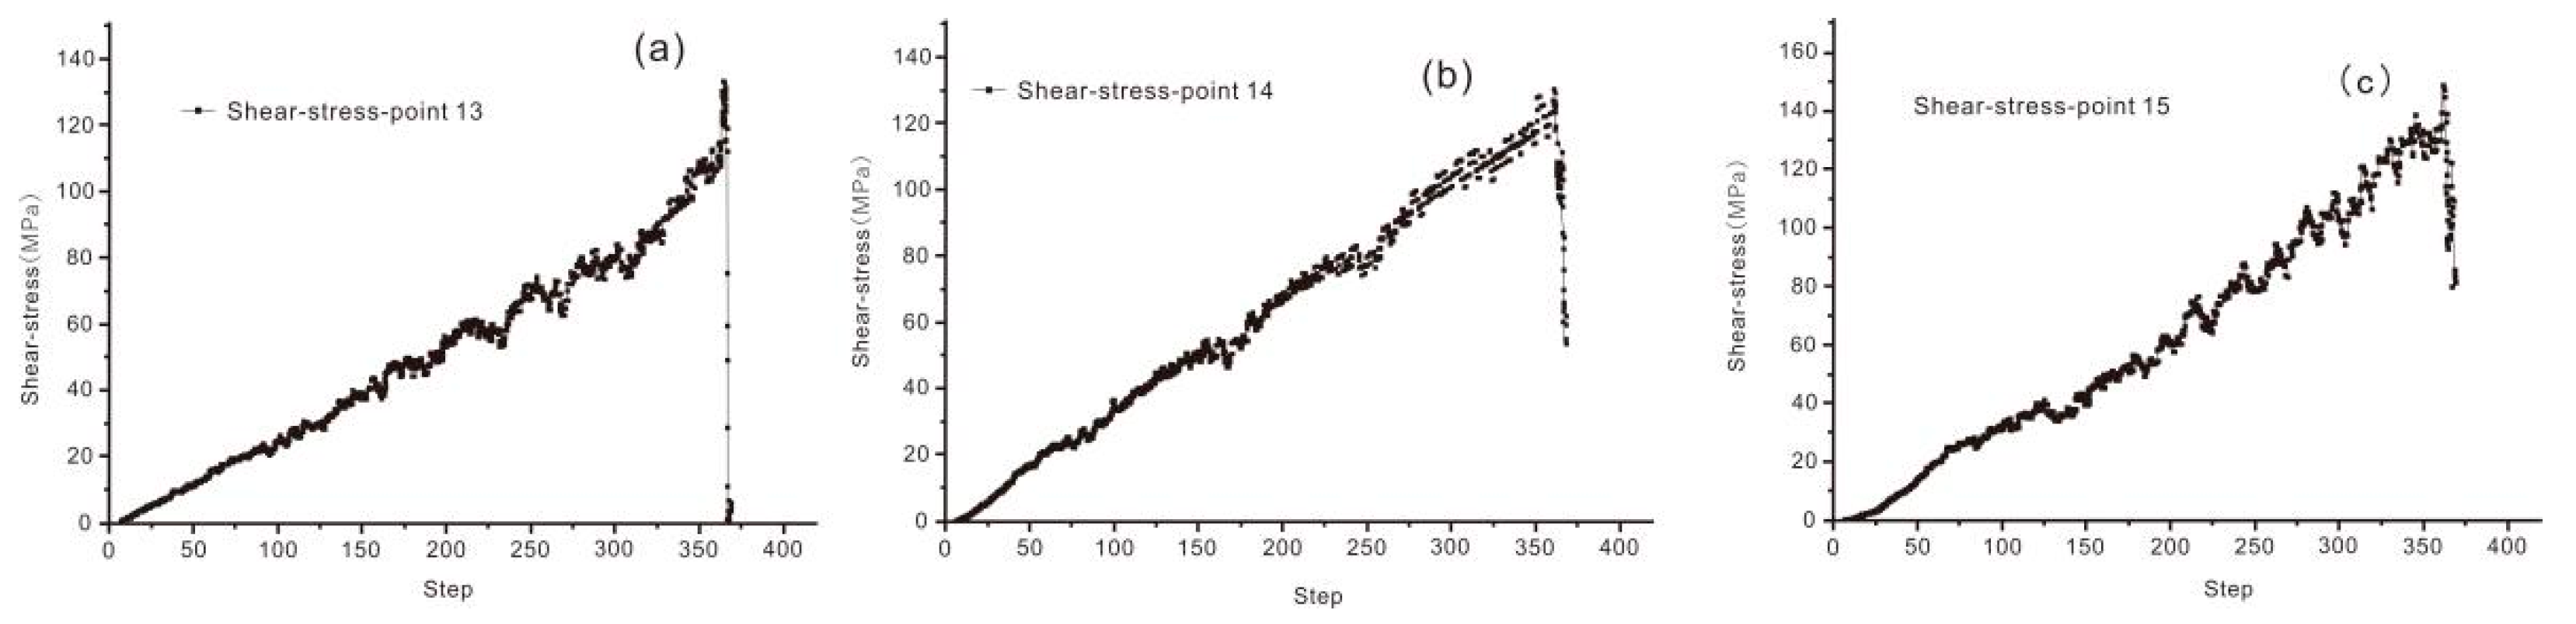
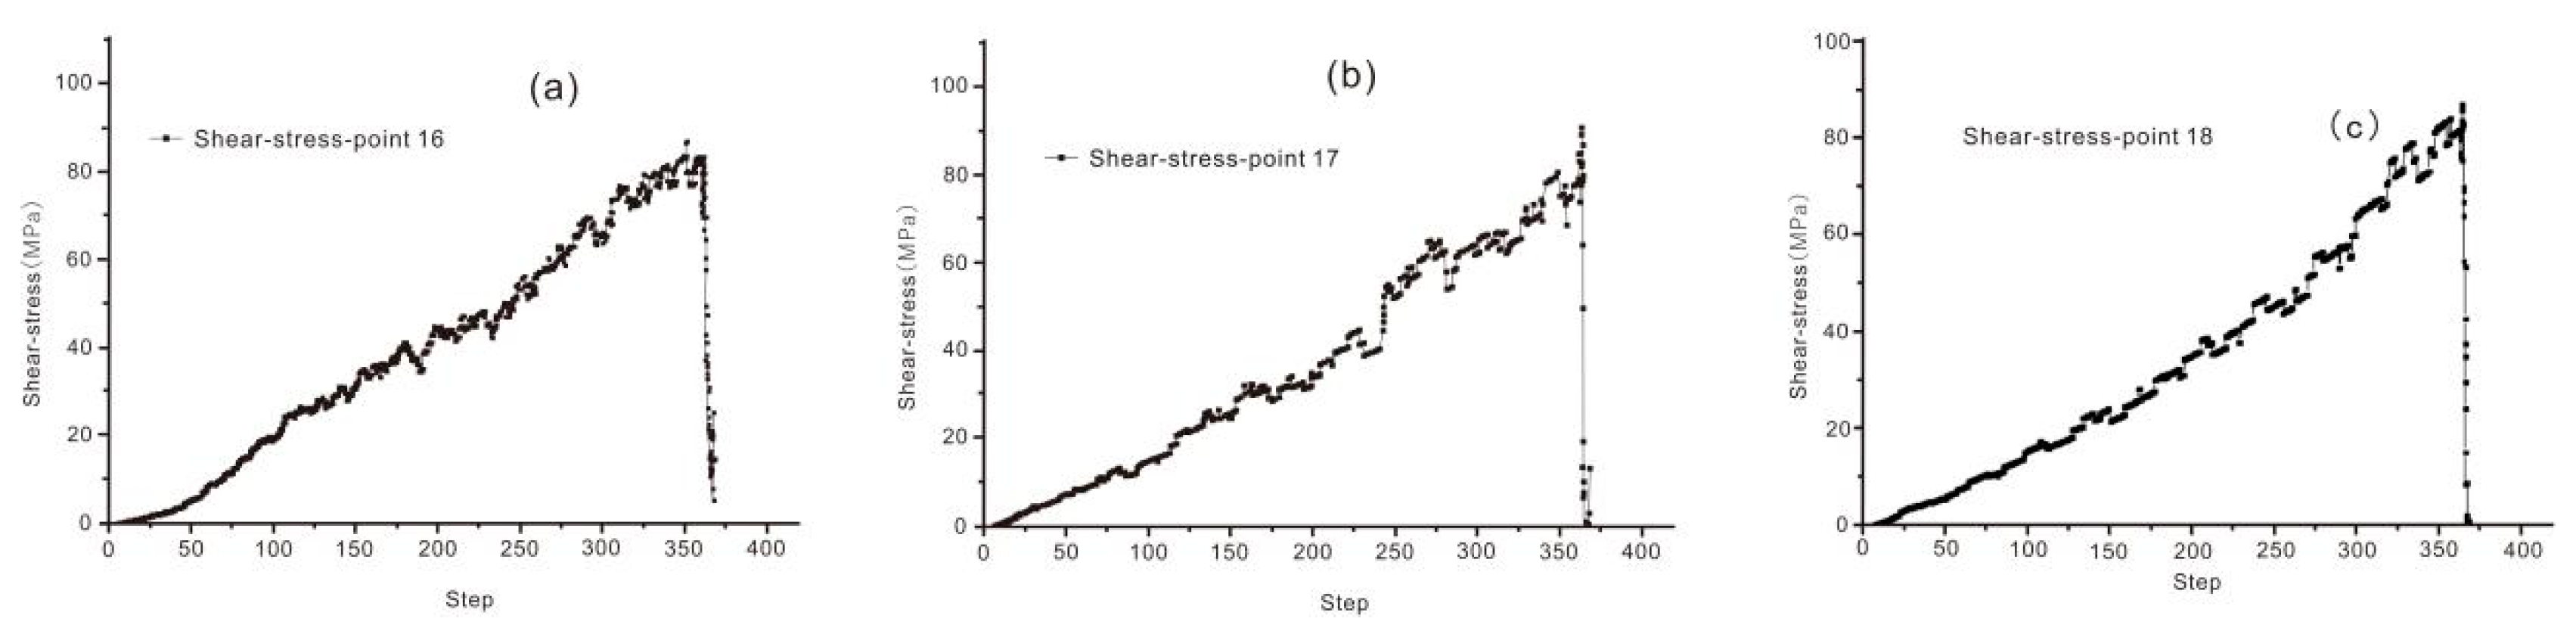
Some researchers have put forward a view that shear stress and the damage caused by shear stress are major factors for the local stability of the boundary part of the backfill. We set up another six monitoring points in the internal surrounding rock mass and the internal backfill, respectively. Combined with upper monitoring points in the boundary parts of the backfill, the results of the shear stress of each point are presented in Figure 11, Figure 12 and Figure 13.
The stress monitoring was carried out in the internal part of the surrounding rock mass, the internal part of the backfill, and the boundary part of the backfill. The stress curves of internal part of the surrounding rock mass are shown in Figure 11a–c. In the upper part of the surrounding rock, the stress increased slowly in initial stage, and the stress increase rate was larger in the later stage. The stress had a sudden rise to its peak value and then collapsed. The rate of stress change remained almost stable. The stress curves of internal part of backfill are shown in Figure 12a–c. In the initial stage, the stress of the backfill increased stably. Micro-cracks were initiated, and their development lead to the unstable changing of the stress of the backfill, which then reached its peakvalue. Compared with the stress change of the surrounding rock, the phenomenon of the sudden rise of stress to its peak value was alleviated. The stress distribution of the backfill is consistent with results of the underground measurements. At the same depth, the stress value of the surrounding rock is larger than the stress of the backfill. After micro-crack initiation, the ratio of stress between the surrounding rock mass and the backfill was 1.3~2. This stress ratio increased as the depth increased. Therefore, the mining depth increase led to the larger difference between the surrounding rock stress and backfill stress.
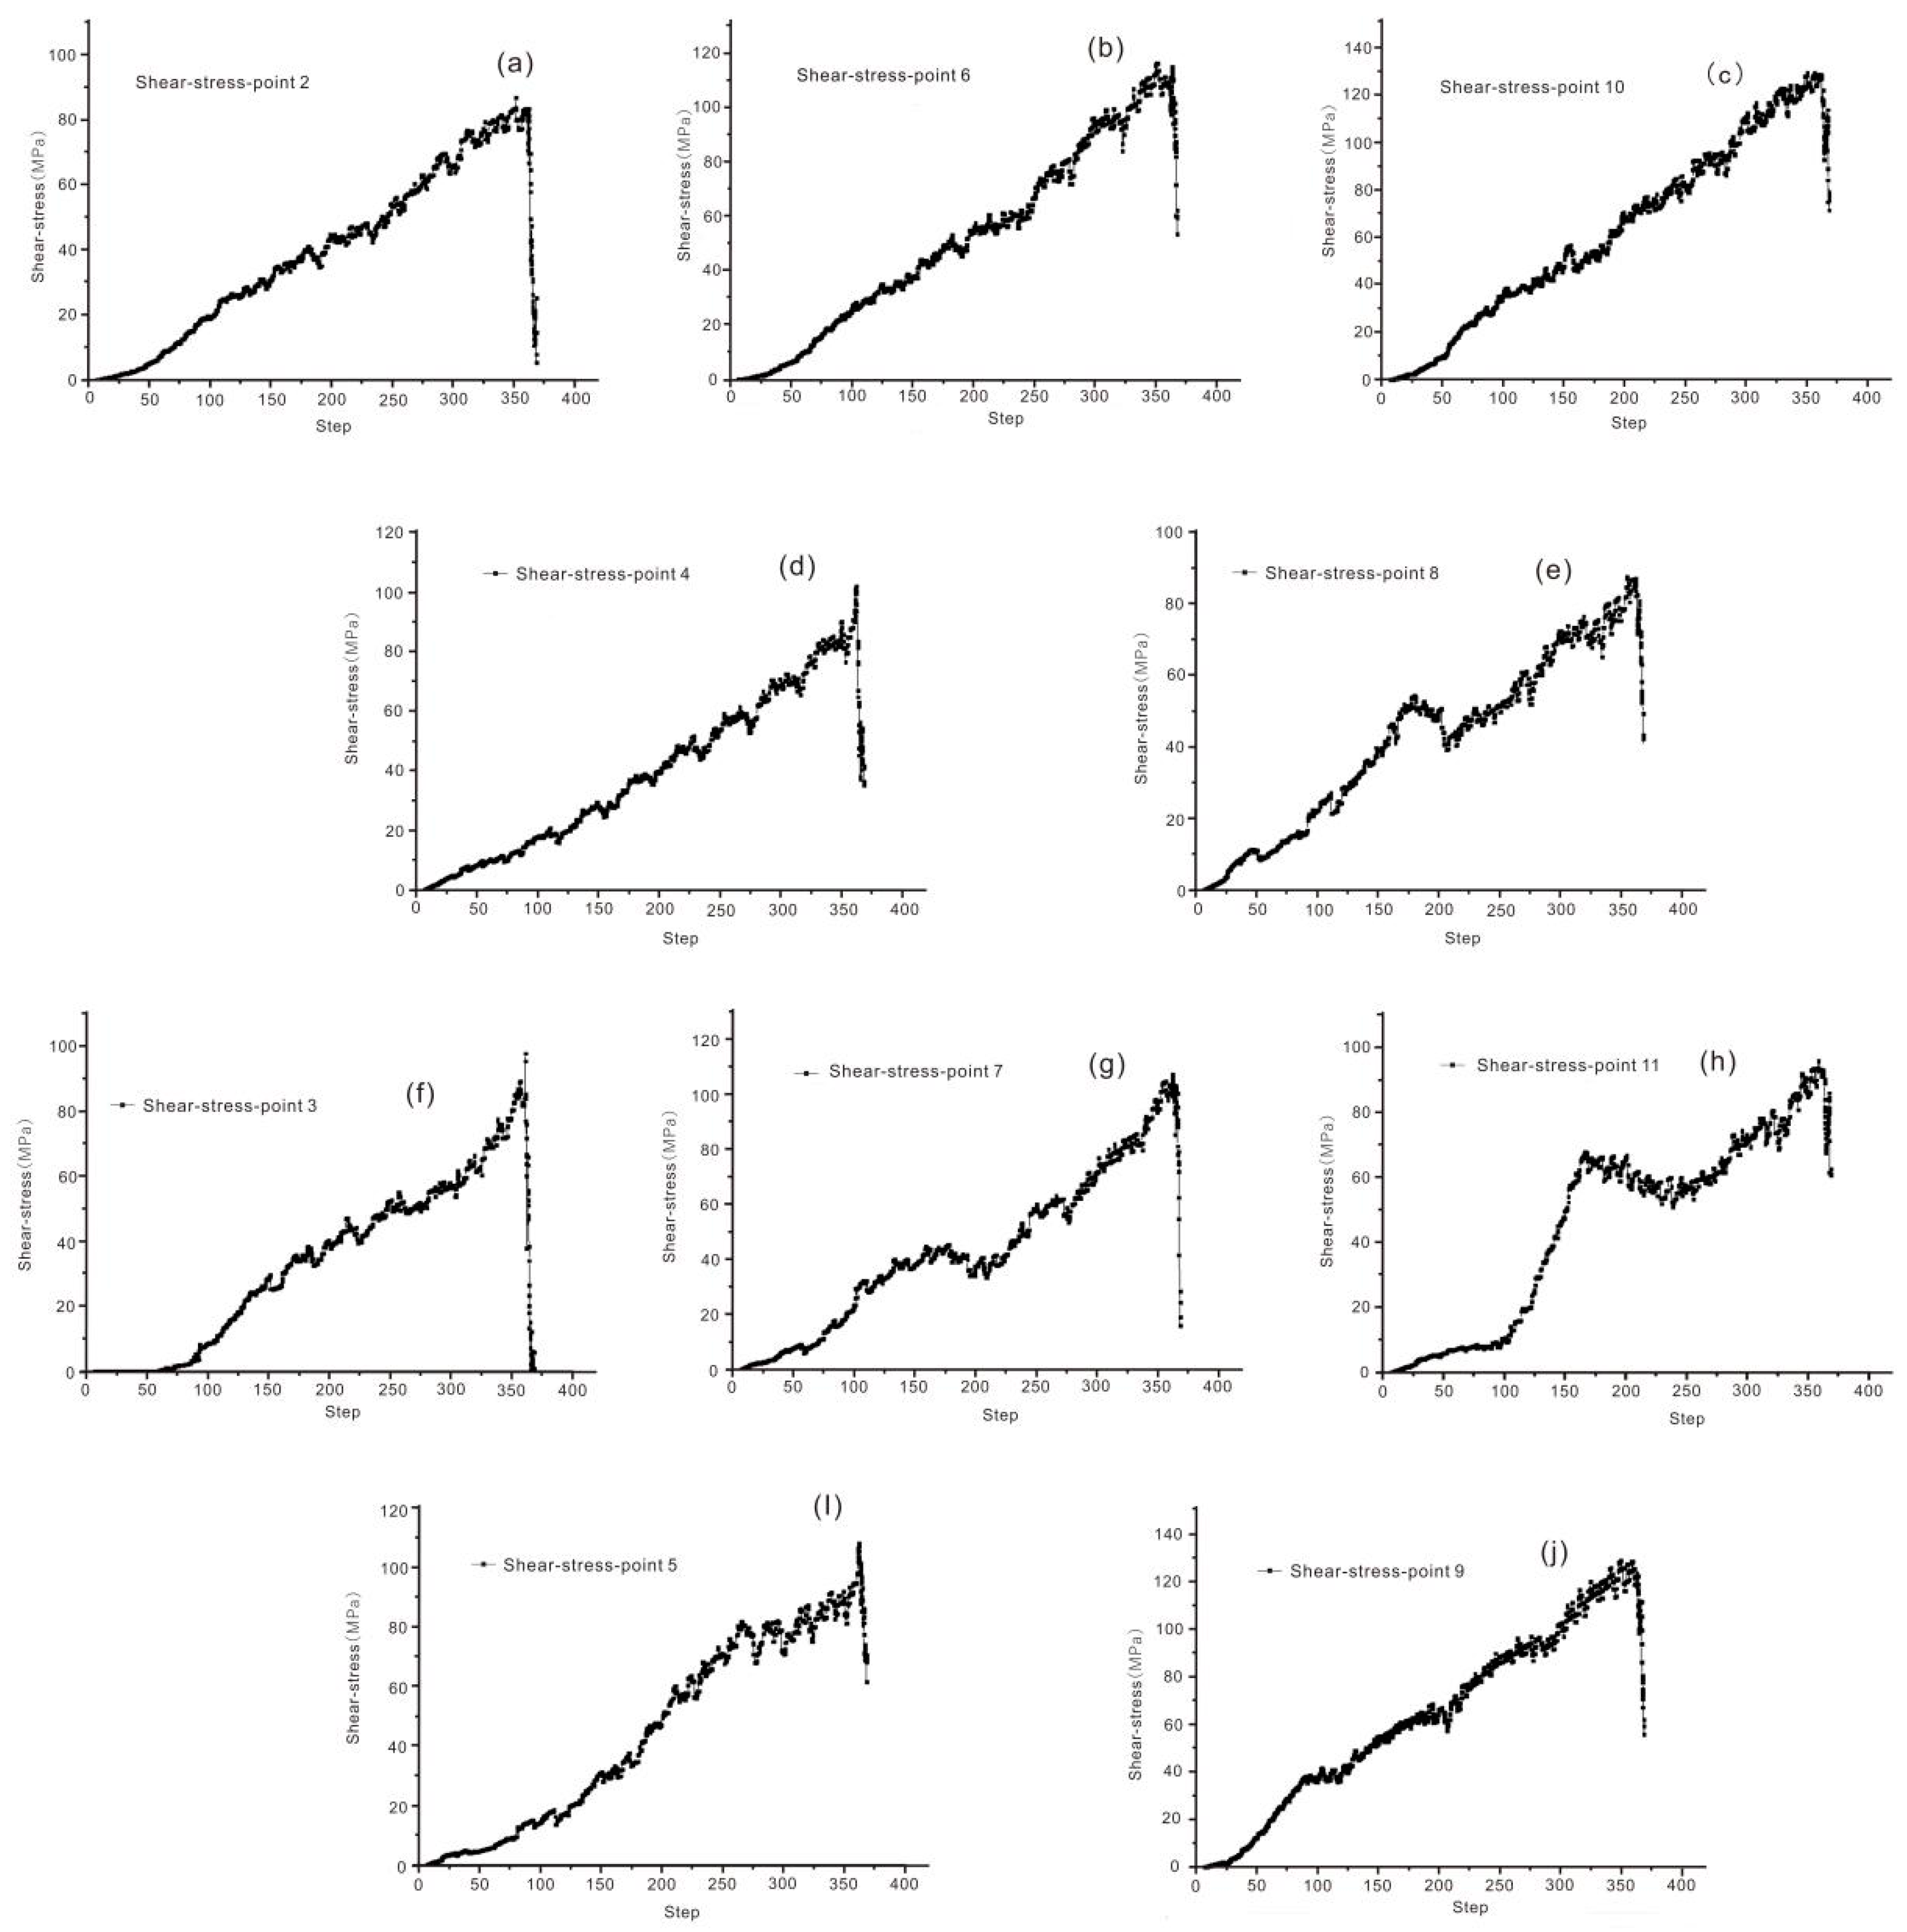
The stress distribution of the boundary part of the backfill is more complex due to the interaction between the backfill and the surrounding rock. Along the step-profile of the boundary, the stress monitoring points were set, as shown in Figure 9 (point-2~point-11). The stress development is shown in Figure 13a–j. The stress value of the boundary part was smaller than the stress value in the internal surrounding rock and lager than the stress value in the internal backfill. The major feature of some boundary stress developments is multi-peak strength—normally, they have two peak values. These two peak stress values divided the stress curve into the following five stages: Stage 1: stress increased linearly and slowly; Stage 2: stress accelerated growth; Stage 3: post first peak stress stage, the stress decreased slightly then increased; Stage 4: stress reached the second peak value; and Stage 5: stress decreased sharply in post second peak stage.
The step-profile boundary had five inflection nodes located at monitoring point-3, point-5, point-7, point-9, and point-11, respectively. The boundary points have been divided into four types. As previously mentioned, multi-peak stress is a major feature of boundary points stress distribution. The multi-peak stress was influenced by the depth and inflection location, and as depth increased, the multi-peak stress became more obvious.
6. Conclusions
This article aimed to study backfill stress distribution and deformation and analyzed its stability. The conclusions of study are as follows:
- (1)
- The settlement of ground subsidence corresponded to the center exploratory line of the backfill. This part of the backfill has the largest bed separated displacement.
- (2)
- Field stress monitoring of the underground backfill showed that both horizontal and vertical stresses of the internal parts of the backfill are smaller than those of the boundary part of the backfill. The stress distribution of the boundary part of the backfill was more complex.
- (3)
- Field measurement provided a precise outline of the backfill boundary. The backfill boundary has a step profile. A numerical model of the step profile boundary part of the backfill was built to conduct a stress transferring analysis.
- (4)
- Contact interaction of the surrounding rock mass and backfill was conducted along the backfill boundary. Stress monitoring of the boundary points showed a multi-peak stress characteristic. The multi-peak stress behavior of the boundary part of the backfill was influenced by mining depth.
Author Contributions
Conceptualization, R.L. and F.M.; Methodology, R.L.; Software, R.L. and F.M.; Formal analysis, R.L.; Investigation, J.Z. and G.L.; Resources, J.W.; Data curation, B.D.; Writing—Original draft preparation, R.L.; Writing—Review and editing, F.M.; Supervision, J.Z.; Project administration, J.Z. and J.W.; Funding acquisition, F.M. All authors have read and agreed to the published version of the manuscript.
Funding
This research was funded by “Research of failure mechanism about vertical shaft deformation in condition of movement in metal mine,” grant number 41831293, 41772341, 41877274.
Acknowledgments
The authors would like to express their sincere gratitude to the Jinchuan Nickel Mine for their data support. In addition, the authors are grateful to the assigned editor and the three anonymous reviewers for their enthusiastic help and valuable comments, which have greatly improved this paper.
Conflicts of Interest
The authors declare no conflict of interest.
References
- Mchaina, D.M.; Januszewski, S.; Hallam, R.L. Development of an environmental impact and mitigation assessment program for a tailings storage facility stability upgrade. Int. J. Surf. Min. Reclam. Environ. 2003, 15, 123–140. [Google Scholar] [CrossRef]
- Meggyes, T.; Niederleithinger, E.; Witt, K.J. Enhancing the safety of tailings management facilities. Soil Sediment Contam. 2008, 17, 323–345. [Google Scholar] [CrossRef]
- Friedrich, L.; Halden, N.M. Determining exposure history of northern pike and walleye to tailings effluence using trace metal uptake in otoliths. Environ. Sci. Technol. 2010, 44, 1551–1558. [Google Scholar] [CrossRef]
- Kang, H.; Zhang, X.; Si, L.; Wu, Y.; Gao, F. In-situ stress measurements and stress distribution characteristics in underground coal mines in China. Eng. Geol. 2010, 116, 333–345. [Google Scholar] [CrossRef]
- Song, X.Y.; Danyushevsky, L.V.; Keays, R.R.; Chen, L.M.; Wang, Y.S.; Tian, Y.L.; Xiao, J.F. Structural, lithological and geochemical constraints on the dynamic magma plumbing system of the Jinchuan Ni-Cu sulfide deposit, NW China. Miner. Depos. 2012, 47, 277–297. [Google Scholar] [CrossRef]
- Mostafa, B.; Tikou, B.; Bruno, B. Chemical factors that influence the performance of mine sulphidic paste backfill. Cem. Concr. Res. 2002, 2, 1133–1144. [Google Scholar]
- Swift, G.M.; Reddish, D.J. Stability problems associated with an abandoned ironstone mine. Bull. Eng. Geol. Environ. 2002, 61, 227–239. [Google Scholar]
- Li, X.; Wang, S.J.; Liu, T.Y.; Ma, F.S. Engineering geology ground surface movement and fissures induced by underground mining in the Jinchuan Nickel Mine. Eng. Geol. 2004, 76, 93–107. [Google Scholar] [CrossRef]
- Baurova, N.I. Durability models of adhesive material using catastrophe theory. Polym. Sci. 2009, 2, 130–132. [Google Scholar] [CrossRef]
- Hua, A.Z. Energy analysis of surrounding rocks in underground engineering. Chin. J. Rock Mech. Eng. 2003, 22, 1054–1059. [Google Scholar]
- Belem, T.; Benzaazoua, M.; Bussiere, B. Mechanical behaviour of cementedpaste backfill. In Proceedings of the 53rd Canadian Geotechnical Conference, Montreal, QC, Canada, 15–18 October 2000; Volume 1, pp. 373–380. [Google Scholar]
- Benzaazoua, M.; Fall, M.; Belem, T. A contribution to understanding the hardening process of cemented pastefill. Miner. Eng. 2004, 17, 141–152. [Google Scholar] [CrossRef]
- Ryder, J.A. Application of numerical stress analyses to the design of deep mine. In Proceedings of the International Conference on Gold; South African Institute of Mining & Metallurgy Publisher: Johannesburg, South African, 1986; pp. 245–253. [Google Scholar]
- Ercikdi, B.; Cihangir, F.; Kesimal, A. Utilization of water-reducing admixtures in cemented paste backfill of sulphide-rich mill tailings. J. Hazard. Mater. 2010, 179, 940–946. [Google Scholar] [CrossRef] [PubMed]
- Zheming, Z. Analysis of Mine Backfill Behaviour and Stability. Ph.D. Thesis, McGill University, Montreal, QC, Canada, 2002. [Google Scholar]
- Nadargjah, N. Backfill Optimization Using Mine Tailings for Improved Ground Stability in Underground Mines. Master’s Thesis, Dalhousie University, Halifax, NS, Canada, 2006. [Google Scholar]
- Julian, P.S.; Chris, M.H. Laboratory testing of concrete-rock joints in constant normal stiffness direct shear. Geotech. Test. J. 2002, 25, 391–404. [Google Scholar]
- Nooshin, F.; Michel, A.; Li, L. Numerical investigation of the geomechanical response of adjacent backfilled stopes. Can. Geotech. J. 2015, 52, 1507–1525. [Google Scholar]
- Alber, M.; Fritschen, R.; Bischoff, M.; Meier, T. Rock mechanical investigations of seismic events in a deep longwall coal mine. Int. J. Rock Mech. Min. Sci. 2009, 46, 408–420. [Google Scholar] [CrossRef]
- Jiang, J.Q.; Wu, Q.L.; Qu, H. Characteristic of mining stress evolution and activation of the reverse fault below the hard-thickstrata. J. China Coal Soc. 2015, 40, 267–277. [Google Scholar]
- Saati, V.; Mortazavi, A. Numerical modeling of in situ stress calculation using borehole slotter test. Tunn. Undergr. Space Technol. 2011, 26, 172–178. [Google Scholar] [CrossRef]
- Nikolic, M.; Ibrahimbegovic, A.; Miscevic, P. Brittle and ductile failure of rocks: Embedded discontinuityapproach for representing mode I and mode II failure mechanisms. Int. J. Numer. Methods Eng. 2015, 102, 1507–1526. [Google Scholar] [CrossRef]
- Park, K.H.; Tonravanich, B.; Lee, J.G. A Simple Procedure for Ground Response Curve of Circular Tunnel in Elastic-Strain Softening Rock Masses. Tunn. Undergr. Space Technol. 2008, 23, 151–159. [Google Scholar] [CrossRef]
- Bell, F.G.; Stacey, T.R.; Genske, D.D. Mining subsidence and its effect on the environment: Some differing examples. Environ. Geol. 2000, 40, 135–152. [Google Scholar] [CrossRef]
- Boler, F.M.; Billington, S.; Zipf, R.K. Seismological and energy balance constraints on the mechanism of a catastrophic bump in the Book Cliffs Coal Mining District, Utah, USA. Int. J. Rock Mech. Min. Sci. 1997, 34, 27–43. [Google Scholar] [CrossRef]
- Wang, W.; Cheng, Y.P.; Wang, H.F.; Li, W.; Wang, L. Coupled disaster-causing mechanisms of strata pressure behavior and abnormal gas emissions in underground coal extraction. Environ. Earth Sci. 2015, 74, 6717–6735. [Google Scholar] [CrossRef]
- Rong, L.; Fengshan, M.; Jie, G.; Haijun, Z. Monitoring and analysis of ground subsidence and backfill stress distribution in Jinchuan Mine, Chian. Curr. Sci. 2018, 115, 1970–1977. [Google Scholar]
- Hofmann, G.H.; Scheepers, L.J. Simulating fault slip areas of mining induced seismic tremors using static boundary element numerical modeling. Trans. Inst. Min. Metall. 2011, 120, 53–64. [Google Scholar]
- Hudson, J.A.; Cooling, C.M. In situ rock stresses and their measurement in the U.K.-Part 1. The current state of knowledge. Int. J. Rock Mech. Min. Sci. Geomech. Abstr. 1998, 25, 363–370. [Google Scholar] [CrossRef]
- Zhu, W.C.; Liu, J.; Tang, C.A.; Zhao, X.D.; Brady, B.H. Simulation of progressive fracturing processes around underground excavations under biax ial compression. Tunn. Undergr. Space Technol. 2005, 20, 231–247. [Google Scholar] [CrossRef]
- Lu, R.; Ma, F.S.; Guo, J.; Zhao, H.J. Analysis and monitoring of roadway deformation me chanisms in nickelmine, China. Concurr. Comput. Pract. Exp. 2018, 30, 350–362. [Google Scholar]
- Li, L.; Aubertin, M.S.R.; Bussiere, B.; Belem, B. Modelling arching effects in narrow backfilled stopes with FLAC. In Proceedings of the 3rd International Symposium on FLAC & FLAC 3D Numerical Modelling in Geomechanics, Sudbury, ON, Canada, 21–24 October 2003; pp. 211–219. [Google Scholar]
- Li, L.; Aubertin, M.; Belem, T. Formulation of a three dimensional analytical solution to evaluate stress in backfilled vertical narrow openings. Can. Geotech. J. 2005, 42, 1705–1717. [Google Scholar] [CrossRef]
- Priapakaran, K. Load-Deformation Characteristic of Minefills with Particular Reference to Arching and Stress Developments. Ph.D. Thesis, James Cook University, Townsville, Australia, 2008. [Google Scholar]
- Thompson, B.D.; Bawden, W.F.; Grabinsky, M.W. In situ measurements of cemented paste backfill at the Cayeli Mine. Can. Geotech. J. 2012, 49, 755–772. [Google Scholar] [CrossRef]
- Ma, F.S.; Zhao, H.J.; Yuan, R.M.; Guo, J. Ground movement resulting from underground backfill mining in a nickel mine (Gansu Province, China). Nat. Hazards 2015, 77, 1475–1490. [Google Scholar] [CrossRef]
- Zhao, H.J.; Ma, F.S.; Zhang, Y.M.; Guo, J. Monitoring and mechanisms of ground deformation and ground fissures induced by cut-and-fill mining in the Jinchuan Mine 2, China. Environ. Earth Sci. 2013, 68, 1903–1911. [Google Scholar] [CrossRef]
- Ma, F.S.; Zhao, H.J.; Zhang, Y.M.; Guo, J.; Wei, A.H.; Wu, Z.Q.; Zhang, Y.L. GPS monitoring and analysis of ground movement and deformation induced by transition from open-pit to underground mining. J. Rock Mech. Geotech. Eng. 2012, 4, 82–87. [Google Scholar] [CrossRef] [Green Version]
- Zhao, H.J.; Ma, F.S.; Xu, J.M.; Guo, J. In situ stress field inversion and its application in mining-induced rock mass movement. Int. J. Rock Mech. Min. Sci. 2012, 53, 120–128. [Google Scholar] [CrossRef]
- Ding, K.; Ma, F.S.; Guo, J.; Zhao, H.J.; Lu, R.; Liu, G. Investigation of the mechanism of roof caving in the Jinchuan Nickel Mine, China. Rock Mech. Rock Eng. 2018, 51, 1215–1226. [Google Scholar] [CrossRef]
- Wang, G.F.; Gong, S.Y.; Li, Z.L.; Dou, L.M.; Cai, W.; Mao, Y. Evolution of stress concentration and energy release before rock bursts: Two case studies from Xingan Coal mine, Hegang, China. Rock Mech. Rock Eng. 2016, 49, 3393–3401. [Google Scholar] [CrossRef]
- Bloss, M.L.; Revell, M. Cannington paste fill system-achieving demand capacity. MassMin 2000, 29, 713–720. [Google Scholar]
Figure 1.
Location and geological map of study area. (a) Location and geological map of the Jinchuan Nickel Mine area, (b) the geological section along the exploratory line No.18 in the Jinchuan Mine 2.
Figure 1.
Location and geological map of study area. (a) Location and geological map of the Jinchuan Nickel Mine area, (b) the geological section along the exploratory line No.18 in the Jinchuan Mine 2.

Figure 2.
The mining situation at the Jinchuan Mine.

Figure 3.
The three parts of backfill in three sessions measurement. (a) Backfill range 1334–1250 m, (b) backfill range 1250–1110 m, (c) backfill range 1100–1050 m.
Figure 3.
The three parts of backfill in three sessions measurement. (a) Backfill range 1334–1250 m, (b) backfill range 1250–1110 m, (c) backfill range 1100–1050 m.

Figure 4.
The horizontal displacement vectors of ground subsidence monitoring.

Figure 5.
The sketch of underground monitoring points of sublevel 1100 m.

Figure 6.
Bed separation displacement of backfill in sub-level 1100 m. (a) Bed separation displacement of exploration line-12; (b) bed separation displacement of exploration line-14; (c) bed separation displacement of exploration line-16; (d) bed separation displacement of exploration line-17.
Figure 6.
Bed separation displacement of backfill in sub-level 1100 m. (a) Bed separation displacement of exploration line-12; (b) bed separation displacement of exploration line-14; (c) bed separation displacement of exploration line-16; (d) bed separation displacement of exploration line-17.

Figure 7.
Curves of horizontal stress and vertical stress of backfill. (a) horizontal stress; (b) vertical stress.
Figure 7.
Curves of horizontal stress and vertical stress of backfill. (a) horizontal stress; (b) vertical stress.

Figure 8.
Sketch of the boundary part of the backfill model.

Figure 9.
Monitoring points of boundary part of backfill in numerical model. (a) monitoring points location; (b) ratio of horizontal stress and vertical stress.
Figure 9.
Monitoring points of boundary part of backfill in numerical model. (a) monitoring points location; (b) ratio of horizontal stress and vertical stress.

Figure 10.
Stress and cracks development of monitoring points.

Figure 11.
Stress development of the rock monitoring points. (a) Shear stress of point 13; (b) Shear stress of point 14; (c) Shear stress of point 15.
Figure 11.
Stress development of the rock monitoring points. (a) Shear stress of point 13; (b) Shear stress of point 14; (c) Shear stress of point 15.

Figure 12.
Stress development of the backfill monitoring points. (a) Shear stress of point 16; (b) Shear stress of point 17; (c) Shear stress of point 18.
Figure 12.
Stress development of the backfill monitoring points. (a) Shear stress of point 16; (b) Shear stress of point 17; (c) Shear stress of point 18.

Figure 13.
Stress development of the monitoring points in the boundary part of the backfill. (a) Shear stress of point 2; (b) Shear stress of point 6; (c) Shear stress of point 10; (d) Shear stress of point 4; (e) Shear stress of point 8; (f) Shear stress of point 3; (g) Shear stress of point 7; (h) Shear stress of point 11; (i) Shear stress of point 5; (j) Shear stress of point 9.

© 2020 by the authors. Licensee MDPI, Basel, Switzerland. This article is an open access article distributed under the terms and conditions of the Creative Commons Attribution (CC BY) license (http://creativecommons.org/licenses/by/4.0/).
Share and Cite
MDPI and ACS Style
Lu, R.; Ma, F.; Zhao, J.; Wang, J.; Li, G.; Dai, B. Monitoring and Analysis of Stress and Deformation Features of Boundary Part of Backfill in Metal Mine. Sustainability 2020, 12, 733. https://0-doi-org.brum.beds.ac.uk/10.3390/su12020733
AMA Style
Lu R, Ma F, Zhao J, Wang J, Li G, Dai B. Monitoring and Analysis of Stress and Deformation Features of Boundary Part of Backfill in Metal Mine. Sustainability. 2020; 12(2):733. https://0-doi-org.brum.beds.ac.uk/10.3390/su12020733
Chicago/Turabian StyleLu, Rong, Fengshan Ma, Jie Zhao, Jianbo Wang, Guilin Li, and Bing Dai. 2020. "Monitoring and Analysis of Stress and Deformation Features of Boundary Part of Backfill in Metal Mine" Sustainability 12, no. 2: 733. https://0-doi-org.brum.beds.ac.uk/10.3390/su12020733
Note that from the first issue of 2016, this journal uses article numbers instead of page numbers. See further details here.