Effect of High Temperature and Inclination Angle on Mechanical Properties and Fracture Behavior of Granite at Low Strain Rate


1
State Key Laboratory for Geomechanics and Deep Underground Engineering, China University of Mining and Technology, Xuzhou 221116, China
2
School of Mechanics and Civil Engineering, China University of Mining & Technology, Xuzhou 221116, China
*
Author to whom correspondence should be addressed.
Sustainability 2020, 12(3), 1255; https://0-doi-org.brum.beds.ac.uk/10.3390/su12031255
Submission received: 27 December 2019
/
Revised: 1 February 2020
/
Accepted: 4 February 2020
/
Published: 10 February 2020
(This article belongs to the Special Issue Sustainability Issues in Civil Engineering and Management)
Abstract
:Comprehensive understanding of the effects of temperature and inclination angle on mechanical properties and fracture modes of rock is essential for the design of rock engineering under complex loads, such as the construction of nuclear waste repository, geothermal energy development and stability assessment of deep pillar. In this paper, a novel inclined uniaxial compression (inclined UCS) test system was introduced to carry out two series of inclined uniaxial compression tests on granite specimens under various inclination angles (0–20°) and treated temperatures (25–800 °C) at 5° inclination. Experimental results revealed that the peak compression stress and elastic modulus gradually decreased, while peak shear stress increased nonlinearly with the increasing inclination angle; the peak compression and shear stress as well as elastic modulus slightly increased from 25 to 200 °C, then gradually decreased onwards with the increasing temperature. The effect of temperature on peak axial strain was the same as that on peak shear displacement. Acoustic emission (AE) results suggested that the relationship between crack initiation stress, inclination angle and treated temperature followed a similar trend as that of the peak compression stress and elastic modulus. Particularly, the crack initiation (CI) stress threshold and shear stress corresponding to CI threshold under 800 °C were only 7.4% of that under 200 °C and revealed a severe heat damage phenomenon, which was consistent with the results of the scanning electron microscopy (SEM) with the appearance of a large number of thermal pores observed only under 800 °C. The failure modes tended to shear failure with the increasing inclination angle, indicating that the shear stress component can accelerate sliding instability of rocks. On the other hand, the failure patterns with different temperatures changed from combined splitting-shear failure (25–400 °C) to single shear failure (600 and 800 °C). The study results can provide an extremely important reference for underground thermal engineering construction under complex loading environment.
1. Introduction
The temperature influence on mechanical behavior of rocks has attracted extensive attention in many geological engineering such as underground coal gasification [1], nuclear waste repositories [2,3] and geothermal energy exploitation [4], etc. In these projects, rock mass frequently experiences temperature in the range of 700–900 °C [5,6]. After such high-temperature treatment, the mechanical properties and fracture behavior of rock masses will dramatically change, which lead to structural instability of underground engineering and then induce major geological disasters [7,8,9,10]. Therefore, it is necessary to study the temperature effect of rock material for thermodynamics engineering design and thermal disaster prevention. Furthermore, in these underground thermal projects, due to the complexity of the stress environment, rocks are often affected by complex loading. Combined compression and shear loading are among the most common forms of rock encounter, such as irregular chamber [11,12,13]. Compared with the pure compressional state, additional shear stress can contribute to the rock failure [14,15]. Once these heat-treated rock masses are exposed to combined compression and shear loading, they may be more prone to instability. Hence, study of the effect of heat treatment on the mechanical and fracture behavior of rock material under combined compression and shear loading is absolutely critical for underground engineering design.
The influence of heat treatment on rock properties is mainly reflected on its physical and mechanical properties, microstructure and macroscopic fracture patterns, which have been widely discussed by many scholars [5,6,7,8,16,17,18]. From previous studies, experimental conditions were always an important factor that affects the physical-mechanical properties and fracture pattern of rocks. Ranjith et al. [5] studied the influence of temperature (25–950 °C) on the mechanical properties and mineral composition of sandstone under uniaxial compression condition, and they found that its compressive strength and elastic modulus obviously increased when temperature was below 500 °C, while said characteristics gradually decreased when temperature exceeded 500 °C with increasing temperature. Ding et al. [6] revealed the mechanical and fracture behaviors of sandstone under the coupling effect of temperature (200–800 °C) and confining pressure (20–40 MPa), which found that the peak strain increases by 75.2% and the elastic modulus and peak strength decrease by 62.5% and 35.8% with increasing temperature from 400 to 800 °C, respectively. Furthermore, ductile deformation was more easily observed at high confining pressures in triaxial compression tests, whereas brittle failure was more pronounced under higher initial confining pressures in the confining pressure unloading test. Yang et al. [18] performed a uniaxial compression test on granite specimens containing a single fissure, which was subjected to the high-temperature treatment (20–900 °C). Results showed that its peak strength and elastic modulus slightly increased from 20 to 150 °C and then gradually decreased from 150 to 900 °C. Nevertheless, the peak strain showed the characteristic of decreasing first and then sharply increasing with the growth temperature environment. The micro-fracture pattern of granite specimens under different heated temperatures and fissure angles was studied by acoustic emission (AE) technique and SEM. Liang et al. [19] studied the mechanical properties of thenardite salt rock under uniaxial compression test, and results indicated that its shear strength and uniaxial compressive strength increased with the increase of temperature from 20 to 240 °C. Xu et al. [20] carried out the triaxial compression tests on the granite specimens in the temperature range of 25–1000 °C considering different confining pressures. The relationships between peak strength and temperature as well as confining pressure were discussed. De Bresser et al. [21] carried out uniaxial compression tests on heat-treated marble at the temperature range of 600–1000 °C with or without addition of 0.4–2.1 wt% water and established a criterion to assess the importance of water in the microstructure development based on the observation results by SEM. Yang and Hu [22] conducted a creep test on the red sandstone subjected to various thermal treatments (25, 300, 700 and 1000 °C) by using the multi-step loading and unloading cycle method considering 25 MPa confining pressure. The influence of temperature, deviatoric stress and loading-unloading history on the deformation and long-term permeability of red sandstone was also analyzed in detail.
From the above analysis, it is clear that the majority of studies have mainly focused on temperature effects of rocks by adjusting the loading mode under pure uniaxial compression and triaxial compression condition. However, only a few researchers have investigated the fracture pattern of rock material subjected to heat treatment under inclined uniaxial compression tests. As mining activities are getting deeper these days, rock constructions that are subjected to combined compression and shear loading is commonly encountered. Baker and Yew [23] developed a new method to study pure shear failure of rock under dynamic loading by using Torsional Split Hopkinson Bar (TSHB) test system. Ogawa [24] revised the TSHB test system which can generate the dynamic compression-shear loading, and applied it to metallic materials. Later, the revised TSHB test system was introduced into rock engineering to study the dynamic tribological and shear fracture behaviors of rock materials [25]. Xu and Dai [26] performed a dynamic impact test using a modified Split Hopkinson Pressure Bar (SHPB) system and studied the dynamic mechanical properties and failure characteristic of brittle rocks under combined compression-shear loading. The results indicated that the elastic modulus, shear modulus and progressive failure process of the specimen were closely related to oblique angle. However, above works were mainly limited to dynamic mechanical investigation by considering the effect of shear stress component at high strain rates. This did not reveal the mechanical and fracture behavior of rock under inclined compression loading at the low strain rate.
Until now, studies on mechanical properties and fracture patterns of rock at low strain rate considering the effect of combined compression and shear loading have been limited. He et al. [14,15] developed a novel combined compression and shear test (C-CAST) system at low strain rate and investigated the inclination effect of the basalt and granite specimen from 0° to 15° inclination. The results presented that the peak strength and elastic modulus of rock mass decreased noticeably with the increasing inclination angle. However, the crack initiation and propagation of rock was not quantitatively analyzed by AE activities in that paper, which would have been important for revealing the progressive fracture process of rock with increasing inclination angle. Meanwhile, the temperature effect was also ignored.
In this work, the influence of temperature and inclination angle on the mechanical response of granite is investigated by using a novel C-CAST system, and a series of experimental results on granite specimens subjected to various temperature treatments ranging from 25 to 800 °C are presented. Meanwhile, the microstructure of granite specimen after heat treatment is observed by using SEM. To enhance the understanding of the thermal and angle influence on fracture initiation and failure modes, acoustic emission (AE) events are also monitored. The study results can provide an extremely important reference for underground thermal engineering construction under complex loading environment. On the other hand, it exerts a positive impact on the sustainable development of nuclear waste storage.
2. Experimental Methods
2.1. Experimental Material and Heating Procedure
The tested granite was collected from the eastern region, Linyi city, of Shandong province, China. The granite—buried at an approximate depth of 3000 m—was located at the cretaceous strata of the Mesozoic (dating back to 110–125 Ma) and belonged to the typical magmatic intrusive rock. The density of the material was 2730 kg/m3, which was mainly composed of labradorite, white mica, quartz, and hornblende. According to the International Society for Rock Mechanics (ISRM), all specimens were prepared as cylinders with a diameter of 50 mm and height of 100 mm [27]. To avoid the influence of anisotropy on the mechanical properties, the granite was drilled along the same direction and then cut into standard specimens. Next, the two ends of the specimen were carefully polished with sandpaper to produce flat parallel surfaces for avoiding the local stress concentration during the loading process [3].
The main purpose of this research was to reveal the temperature influence on the mechanical response of granite specimen under inclined uniaxial compression condition. Hence, both the inclination angle and treatment temperature should be taken as main research variables. However, to simplify the test process, the experiment was divided into two aspects: (1) the inclination angle effect (0°, 5°, 10° and 20°) on granite specimen at room temperature (25 °C); (2) the treatment temperature effect (25, 200, 400, 600 and 800 °C) on granite specimen at 5° inclination. First, the tested granite was divided into eight groups with three specimens of each group to obtain unbiased results. Then, according to experimental requirements, the granite specimens needing to be heat-treated were placed in the furnace and heated with a heating rate of 5 °C/min to the designed temperature. The designed temperature was kept constant for 2 h and then the specimens were left in the furnace to cool down naturally to the normal temperature. Finally, scanning electron microscopy (SEM) was used to study the effect of high temperature on the damage degree of internal structure before test.
Figure 1 showed some color changes of granite specimens after high-temperature treatment. According to Figure 1, with increasing temperature, the surface color of granite gradually changed from light gray to white. When the temperature was less than 400 °C, the specimen surface color changed slightly, mainly in light gray; once the temperature exceeded 400 °C, the specimen surface turned white gradually, especially for 800 °C. This was primarily due to the chemical reaction of mineral components under high temperatures.
Figure 2 displayed the microscopic observations of granite after high-temperature treatments based on SEM. For ensuring the accuracy of the results, three thin sections were respectively prepared and used to obtain the microstructure image of heat-treated granite via SEM. The micro-observations from different sections were very similar, confirming the captures were representative. Figure 2a showed some isolated microcracks with a small size (≤5 µm) at room temperature. When the temperature increased to 200 °C, no obvious pores and cracks were observed. This was closely related to the closure of microcracks due to the thermal expansion of particles [5,10] as displayed in Figure 2b.
When the temperature increased to 400 °C, relatively small thermal cracks started to be observed, as shown in Figure 2c. When the temperature increased to 600 °C, the width and length of the thermal cracks both increased obviously (25–50 µm), but there were no large number of thermal pores, as shown in Figure 2d. Once the temperature increased to 800 °C (see Figure 2e), besides the thermal cracks, a large number of concentrated thermal pores and pore clusters were observed due to the pyrolysis of crystal particles in granite samples and the hot melt evaporation of mineral composition [3,18].
2.2. C-CAST System and Testing Procedure
Originally, the C-CAST system was designed by Suorineni in University of New South Wales, Australia [14]. Then, He et al. [15] modified it in appearance to match the Material Testing System (MTS), but the function of the revised C-CAST system was consistent with the former. Figure 3a,b shows the physical diagram and schematic diagram of the connection between the C-CAST system and the MTS, respectively. According to Figure 3, the revised C-CAST system included upper platen, top adaptor, specimens, bottom adaptor and lower platen, and each adapter was composed of internal and external structural connections which could move and fix each other. The inner structure was engraved with a dial to determine the inclination angle, so that errors caused by manual measurement could be avoided. The external structure also served to fix the top adapter to the upper platform.
MTS adopted in this test was from the China University of Mining and Technology, China. In the test process, the loading was performed at a loading rate of 0.5 MPa/s. The vertical load and deformation were recorded simultaneously via MTS at an interval of 0.1 s until failure occurred. At that stage, the failure morphology of the granite was studied. In addition, the AE activities produced in the fracture process of granite specimens were recorded by a DS5 full-information AE measurement system with an 8-channel transient-recorder for revealing the micro-fracture behavior of granite specimen during loading. The AE system should keep the synchronization of data acquisition with MTS to ensure the accuracy of acoustic emission data.
2.3. Data Processing Method
MTS can exert a vertical load on the revised C-CAST system through upper platen. The load-displacement curve of granite specimen in vertical direction can be obtained automatically by the MTS. Figure 4 indicated the stress and deformation state of granite specimens before and after loading. The traditional UCS test occurred at 0° inclination, and the vertical load applied by the MTS to the end of the specimen surface was parallel to its axial direction. At this state, the axial stress and strain of the specimen during loading were expressed as follows [28,29]:
where and are the axial stress and axial strain of the specimen at 0° inclination. is the axial compressive force of MTS acting on the specimen surface. is the initial cross-sectional area of the specimen; and are respectively the height of the specimen before and after compression deformation.
Equations (1) and (2) were only applicable to the case where the external load on the specimen was parallel to its axial direction. However, as shown in Figure 4, when the specimen was in an inclined condition, the external load acting on the specimen surface was distributed at a certain angle with the axial direction of the specimen, which would generate a shear stress component within the sample. The mechanical properties and deformation behavior of the specimen may be closely related to the shear stress component. Hence, the above equations were no longer applicable. He et al. [14,15] presented a simplified calculation method to obtain the axial stress component, axial strain and shear stress component of the specimens by regrading Equations (1) and (2) under C-CAST system as follows:
where and are axial stress component and shear stress component, respectively. is the axial strain. is the shear displacement. and are respectively the vertical displacement of the upper platen before and after specimen deformation. is the vertical displacement collected by MTS. is specimen inclination angle. When the specimen is under the pure uniaxial compression state ( = ), , and are respectively consistent with , and . According to Equations (3)–(6), the following relationship can be also deduced as:
3. Experimental Results Analysis
3.1. Influence of Specimen Inclination on Mechanical Properties
3.1.1. Influence of Specimen Inclination on Stress-Strain Curve
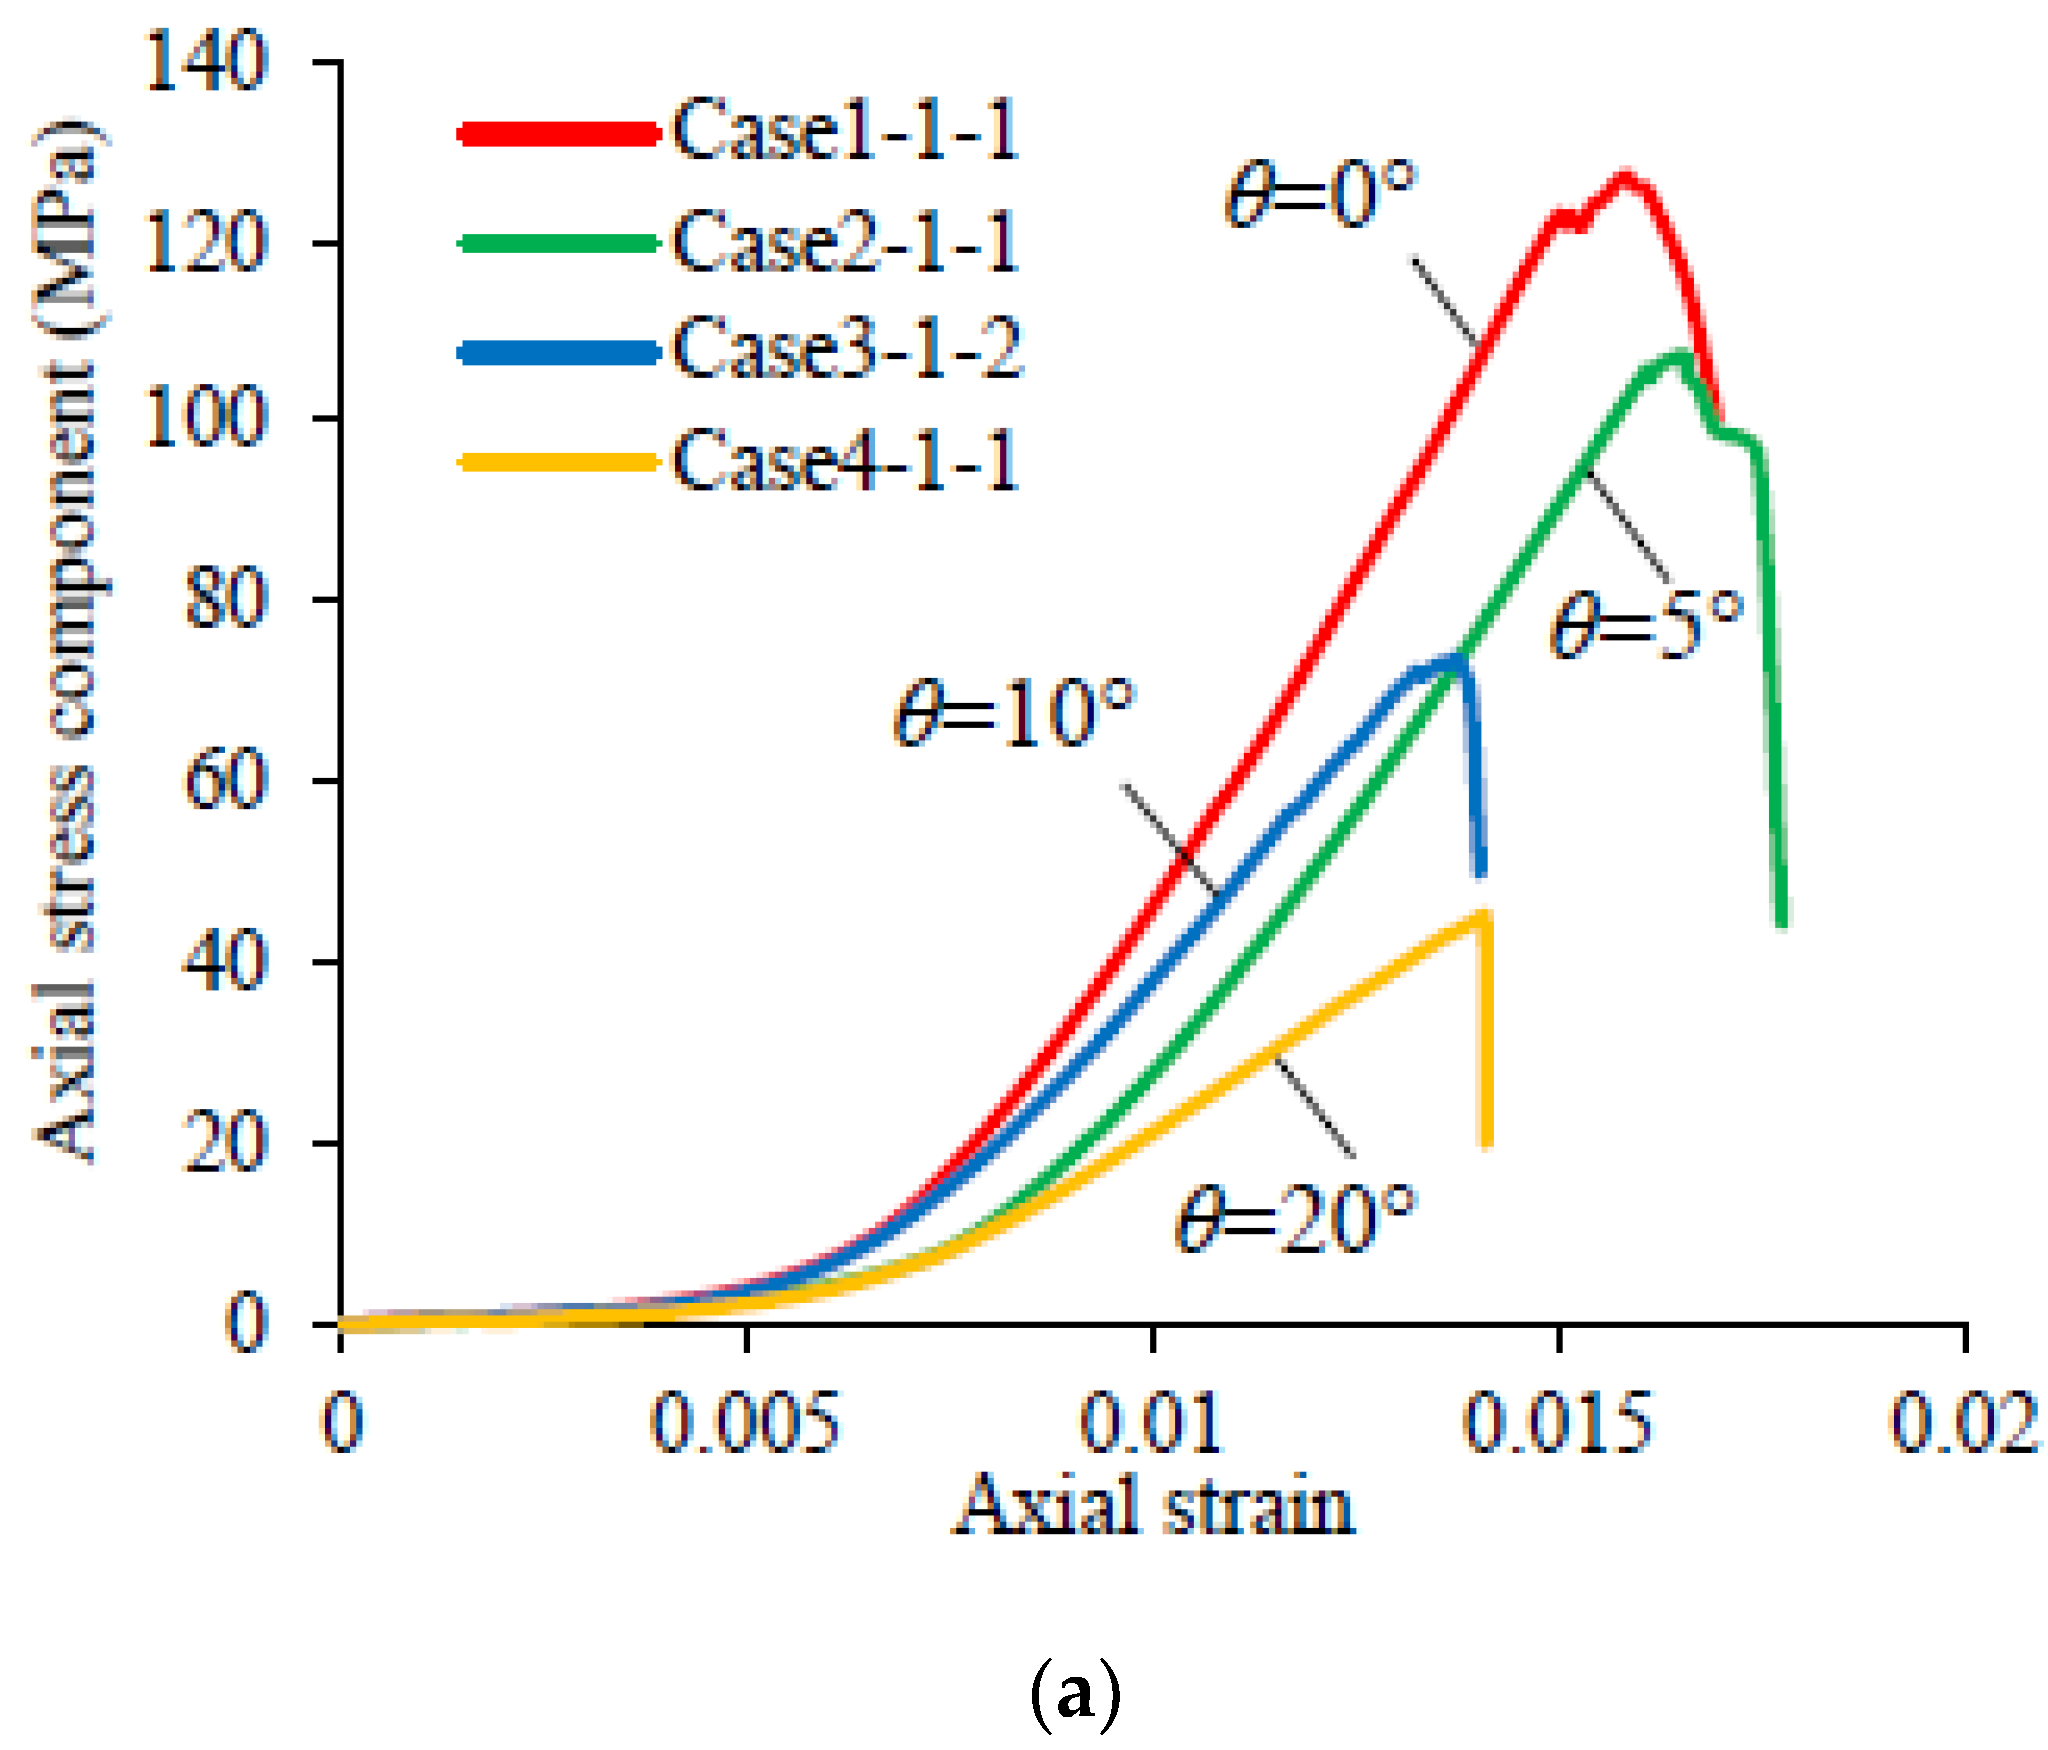
According to the methods in Section 2.3, the axial stress-axial strain and shear stress- displacement curves of typical granite specimens at various inclination angles can be obtained, as shown in Figure 5a,b. From Figure 5, it is found that although granite belongs to hard rock, it still undergoes obvious initial crack compression stage. Then, the curve shows a linear increasing trend before it reaches the peak stress, and the curve is relatively smooth. Once the loading stress exceeds the peak stress of the specimen, the curve shows obvious sudden drop characteristics at any inclination angle, which indicates that the granite belongs to brittle materials at normal temperature, and this property has nothing to do with the change of inclination angle. In addition, with the increasing inclination angle, the peak compression and shear stress components as well as the curve slope of granite specimens change gradually, which indicate that inclination angle has an important influence on the mechanical parameters of the specimens. It should be noted that the shear stress-displacement curve only reflects the change of shear stress component during the loading, and the shear modulus cannot be obtained from this curve.
3.1.2. Influence of Specimen Inclination on Peak Compression Stress
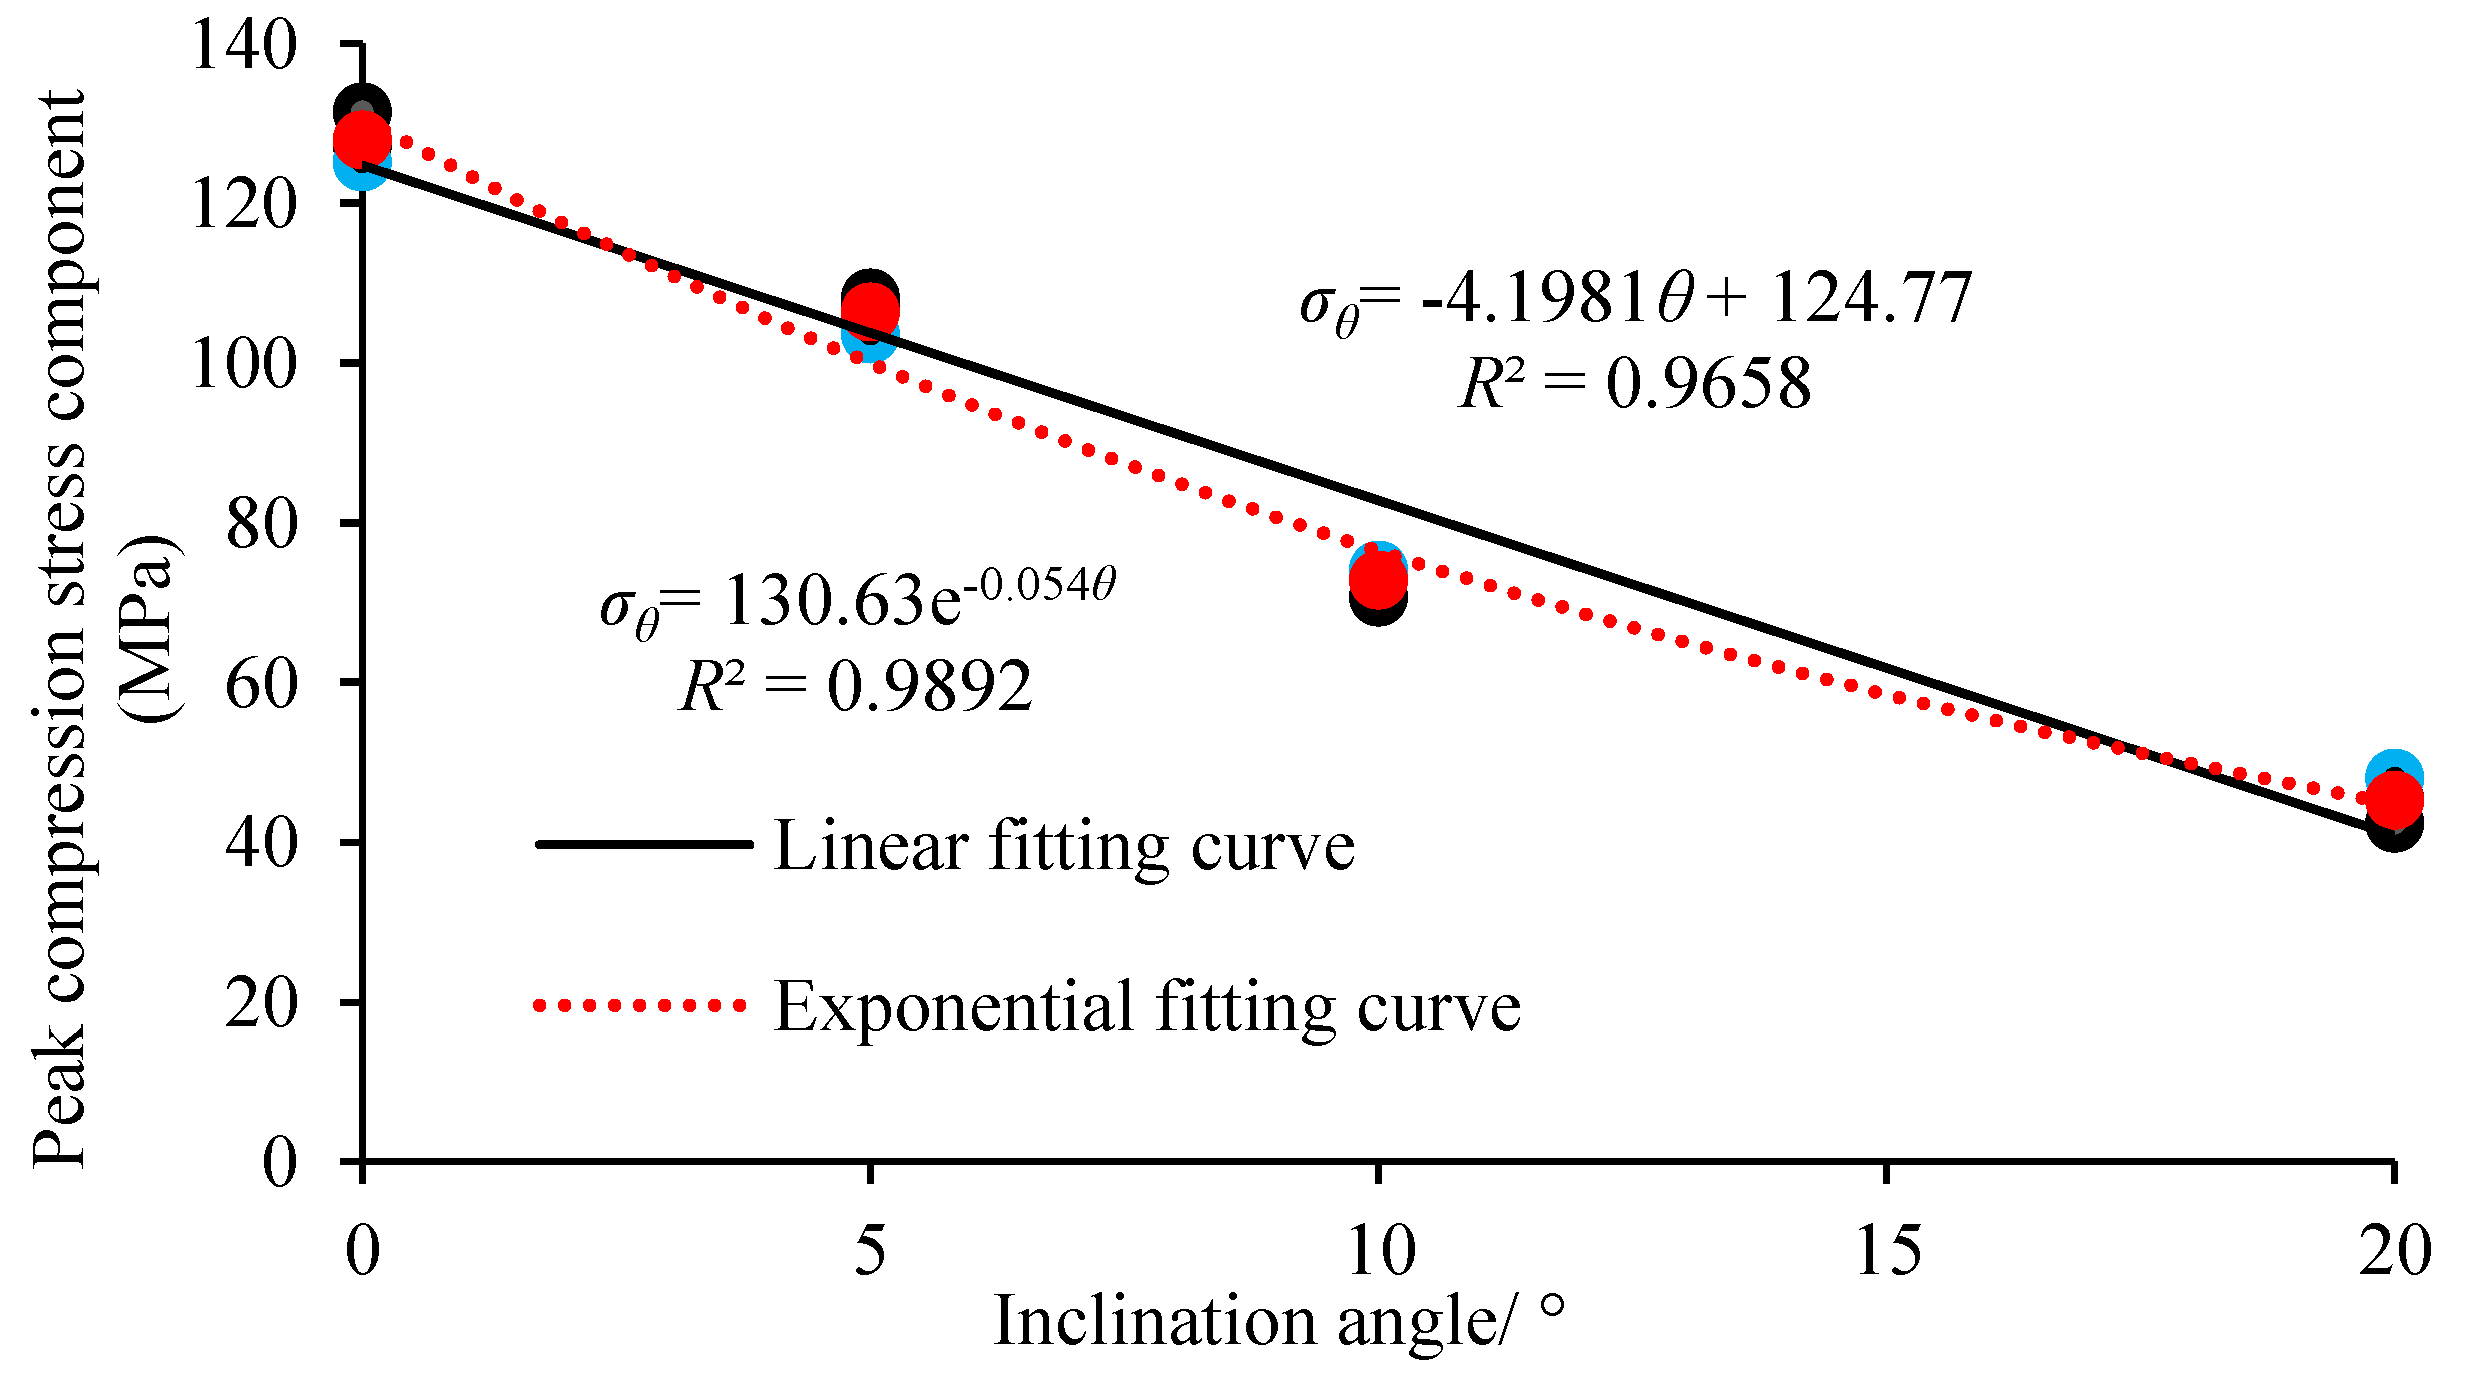
According to Figure 5a, the peak compression stress of granite specimens at different inclination angles can be obtained, as illustrated in Table 1. When the inclination angle is 5°, the average peak compression stress (106.3 MPa) decreases by 16.89% compared with that under pure uniaxial compression (127.9 MPa). When the inclination angle increases to 10° and 20°, the average peak compression stress respectively decreases by 43.16% and 64.66%, indicating that the inclination angle has a substantial influence on the peak compression strength of granite. In Figure 6, the relationship curve between peak compression stress component and inclination angle is plotted, and the average data is also fitted. From Figure 6, the variances (R2) of the two fitting curves are 0.9658 (linear function) and 0.9892 (exponential function), respectively, indicating that the exponential function may better describe the variation trend of peak compression stress with inclination angle. With the increasing inclination angle, the peak compression strength decreases at a certain percentage. This is mainly because the specimen inclination changes the condition of external load on the specimen, which makes it change from uniaxial pure compression state to inclined compression state.
3.1.3. Influence of Specimen Inclination on Elastic Modulus
Table 2 shows the elastic modulus of granite specimens at various inclination angles. In this paper, the slope of straight-line section of the stress-strain curve in Figure 5a is taken as its elastic modulus, which corresponds to 40–60% of the peak compression stress [9]. Figure 7 shows the “inclination angles vs elastic modulus” curve. Linear function and exponential function are also used to fit the average elastic modulus. The results show the variances (R2) of the two fitting curves are 0.955 (linear function) and 0.9539 (exponential function) respectively, indicating that there may be a linear relationship between the elastic modulus and inclination angle. Under pure uniaxial compression, the average elastic modulus of granite is 14.5 GPa. When the inclination angle decreases to 5°, 10° and 20°, the elastic modulus decreases by 23.45%, 26.21% and 57.93%, respectively, indicating that the inclination angle has a significant effect on the elastic modulus of rock material. The elastic modulus decreases approximately linearly with the increase of the inclination angle. Compared with pure uniaxial compression, the specimen under inclined compression loading has a weaker deformation resistance, more likely to produce compression deformation under given axial stress.
3.1.4. Influence of Specimen Inclination on Peak Shear Stress
According to Equations (4), (6) and (7), the peak shear stress of each specimen can be deduced, as shown in Table 3. Figure 8 shows the “inclination angle vs peak shear stress component” curve. As the inclination angle increases, the peak shear stress of the specimen increases nonlinearly. For instance, when the inclination angle increases to 10° and 20°, the average peak shear stress respectively increases by 38.71% and 77.42% compared with that at 5° inclination. It should be noted that the peak shear stress is zero at 0° inclination (pure uniaxial compression state). Under inclined compression condition, the vertical force exerted on the specimen end by MTS is no longer parallel to the axial direction of the specimen, which will generate the shear stress component. Meanwhile, the larger the inclination angle, the larger the shear stress component.
3.1.5. Relationship between Peak Shear Stress and Compression Strength Parameters
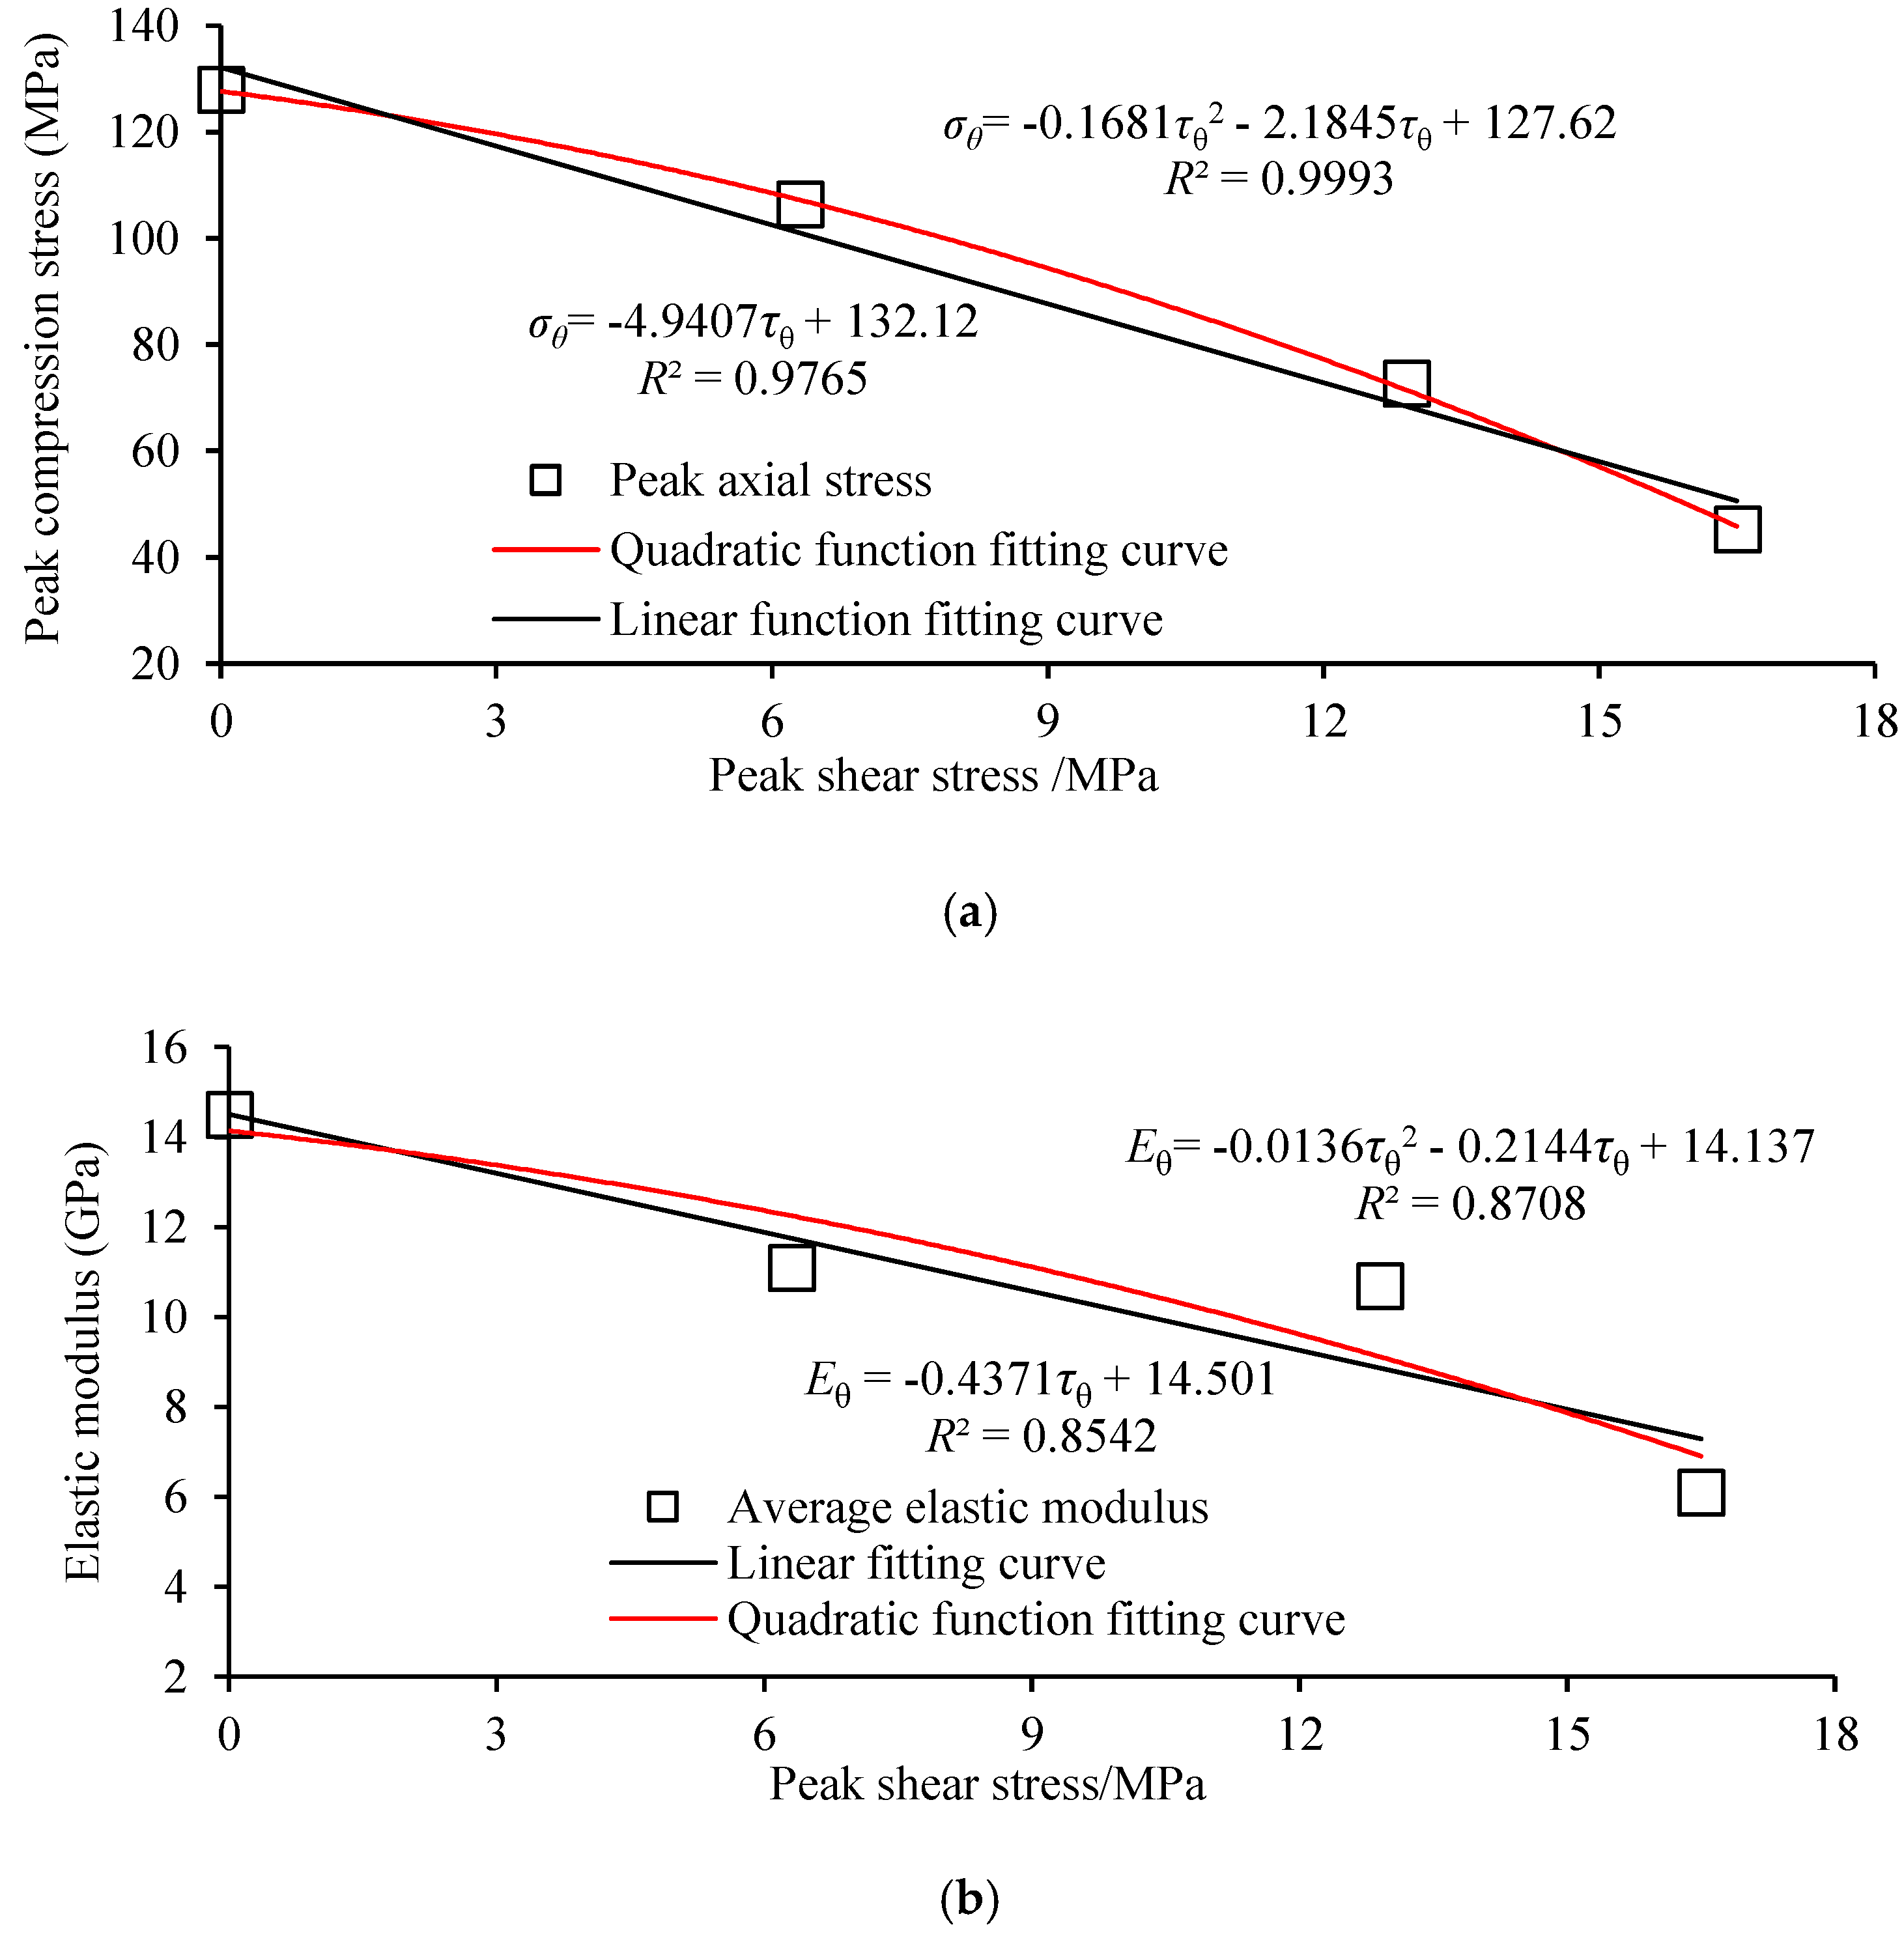
Figure 9a,b shows average peak compression stress and elastic modulus change with the peak shear stress. The quadratic and linear functions are used to fit the average data. From Figure 9, the variances (R2) of quadratic function is slightly larger than that of the linear function. Hence, the nonlinear function may be more appropriate to express their relationship. Furthermore, the average peak compression stress and elastic modulus decrease approximately nonlinearly with the increasing peak shear stress. When the average peak shear stress increases from 0 MPa (θ = 0°) to 12.9 MPa (θ = 10°), the average peak compression stress and elastic modulus decrease by 43.16% and 26.21%, respectively. It indicates that the shear stress component is beneficial to weakening the cohesive and frictional effects among particles within the specimen, and then reduce its peak strength and resistance to deformation [30,31,32].
3.1.6. Comparative Analysis with Previous Studies
He et al. [14,15] also investigated the inclination angle effect on mechanical properties of different rock masses by using C-CAST system. Figure 10 shows the experimental results on the peak compression stress and elastic modulus of different lithology rocks. Results indicated that the peak compression stress and elastic modulus of the basalt and granite gradually decrease with the increasing inclination angle. The mechanical properties of granite are obviously lower than that of basalt. The peak compression stress of tested granite by He et al. [14,15] is close to that of this paper, which indicates that the experiment results of this paper are reliable and reproducible. However, the changes of granite in the elastic modulus, peak shear stress and microcrack initiation stress are not presented in He’s test results. Furthermore, the heat treatment effect on the mechanical response and micro-fracture behavior of the granite under inclined compression condition has not been studied and discussed. This is crucial for the heat-related engineering design under complex loading.
3.2. Influence of Heat Treatment on Mechanical Properties
3.2.1. Influence of Temperatures on Stress-Strain Curve
Figure 11 and Figure 12 indicate typical axial stress-axial strain or shear stress-displacement curves of granite specimens at various temperatures. The curves in Figure 11 and Figure 12 can be obtained by Equations (3)–(6). Some interesting phenomena can be observed in Figure 11 and Figure 12. The two series curves have no obvious microcrack propagation stage before reaching the peak strength at room temperature, 200 and 400 °C. The curve directly enters the post-peak stage after the elastic stage. When the temperature reaches 600 and 800 °C, there is an obvious microcrack propagation stage before the peak strength of the specimens. This stage is amplified with the increasing temperature, which indicate that heat treatment can aggravate the damage degree of the specimens. (2) Although the post-peak stress drop of granite specimens is abrupt, the peak strain dramatically increases after 600 °C, which indicates that high temperature can change the brittleness and ductility of the specimens [8,18]. (3) With the increase of temperature, the curve slope, peak compression stress, peak axial strain, peak shear stress and shear displacement of granite specimens change gradually, which indicates that heat treatment has an important influence on the mechanical parameters of the specimen.
3.2.2. Influence of Temperatures on Peak Compression Stress and Elastic Modulus
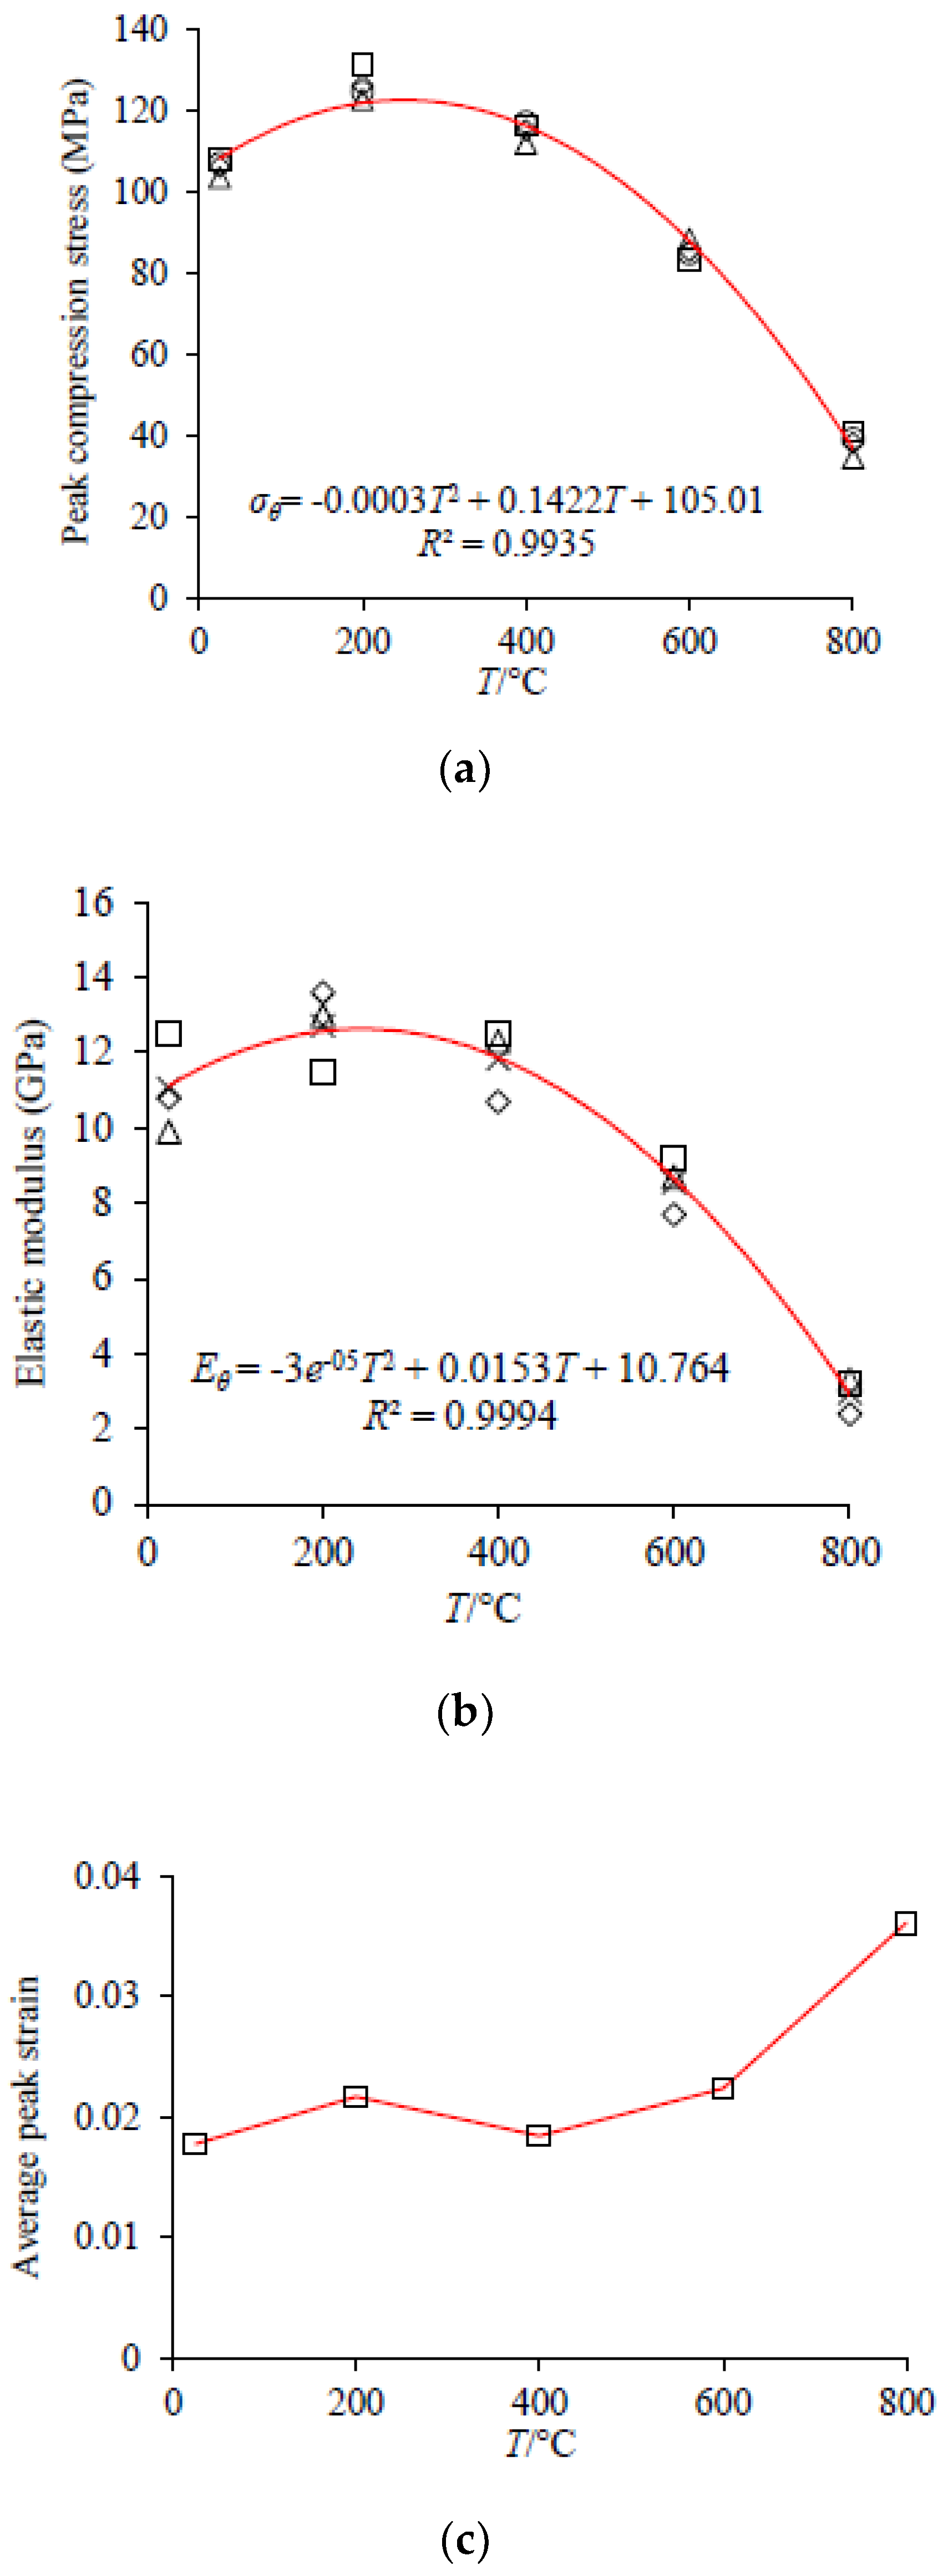
Table 4 and Table 5 indicate the values of peak compression stress and elastic modulus of granite specimens at various temperatures, respectively. The “temperature vs peak compression stress, peak axial strain and elastic modulus” curves are presented in Figure 13. The above three parameters are closely related to temperature. The peak compression stress and elastic modulus increase firstly and then decrease with the increasing temperature and reach the maximum value at 200 °C, while the peak strain firstly increase from 25 to 200 °C, then slightly decrease from 200 to 400 °C and final rapidly increase from 400 to 800 °C with the increasing temperature. Through the above analysis, it can be concluded that the temperature threshold is approximately 200 °C. When the temperature is lower than 200 °C, the microcracks close gradually with the increasing temperature because of the effect of thermal expansion of particles. Meanwhile, the specimen strength and stiffness are enhanced with the decreasing density. It is consistent with the results observed by SEM in Figure 2a,b. However, when the temperature is higher than 200 °C, the degree of thermal damage increases gradually, and the strength and stiffness of granite weaken dramatically. In Figure 2c–e, the damage degree is mainly manifested by the increase of thermal pores and cracks. Especially in 800 °C, many hot melt holes can be observed, indicating that the mechanical properties of granite specimen change significantly at this temperature.
3.2.3. Influence of Temperatures on Shear Parameters
According to Figure 12, the peak shear stress and peak shear displacement of granite specimen at various temperatures can be directly obtained. Table 6 shows the values of peak shear stress of granite specimens. The “temperature vs peak shear stress and peak shear displacement” curves are drawn in Figure 14. From Figure 14, it is clear that the temperatures have an extremely important influence on the above two parameters. The change of peak shear stress and peak shear displacement follows a similar trend as that of peak compression stress and peak axial strain in Figure 13. With the increase of temperature, the peak shear stress also increases firstly, and then decreasees and reaches maximum value at 200 °C, while the peak shear displacement firstly increases from 25 to 200 °C, then slightly decreases from 200 to 400 °C and final rapidly increases from 400 to 800 °C. Since the temperature test is only conducted at 5° inclination, the peak shear stress and peak shear displacement are approximately equal to 0.087 times of peak compression stress and 8.716 times of peak axial strain, according to Equations (7) and (8). This means that the variation of above shear parameters with temperature is the same as that of compression strength parameters in Figure 13. Especially in 800 °C, the temperature also has a most significant effect on the shear parameters of granite specimens.
4. Analysis of AE and Fracture Behavior
4.1. Influence of Inclination Angle on AE and Fracture Behavior
4.1.1. Influence of Inclination Angle on Fracture Behavior
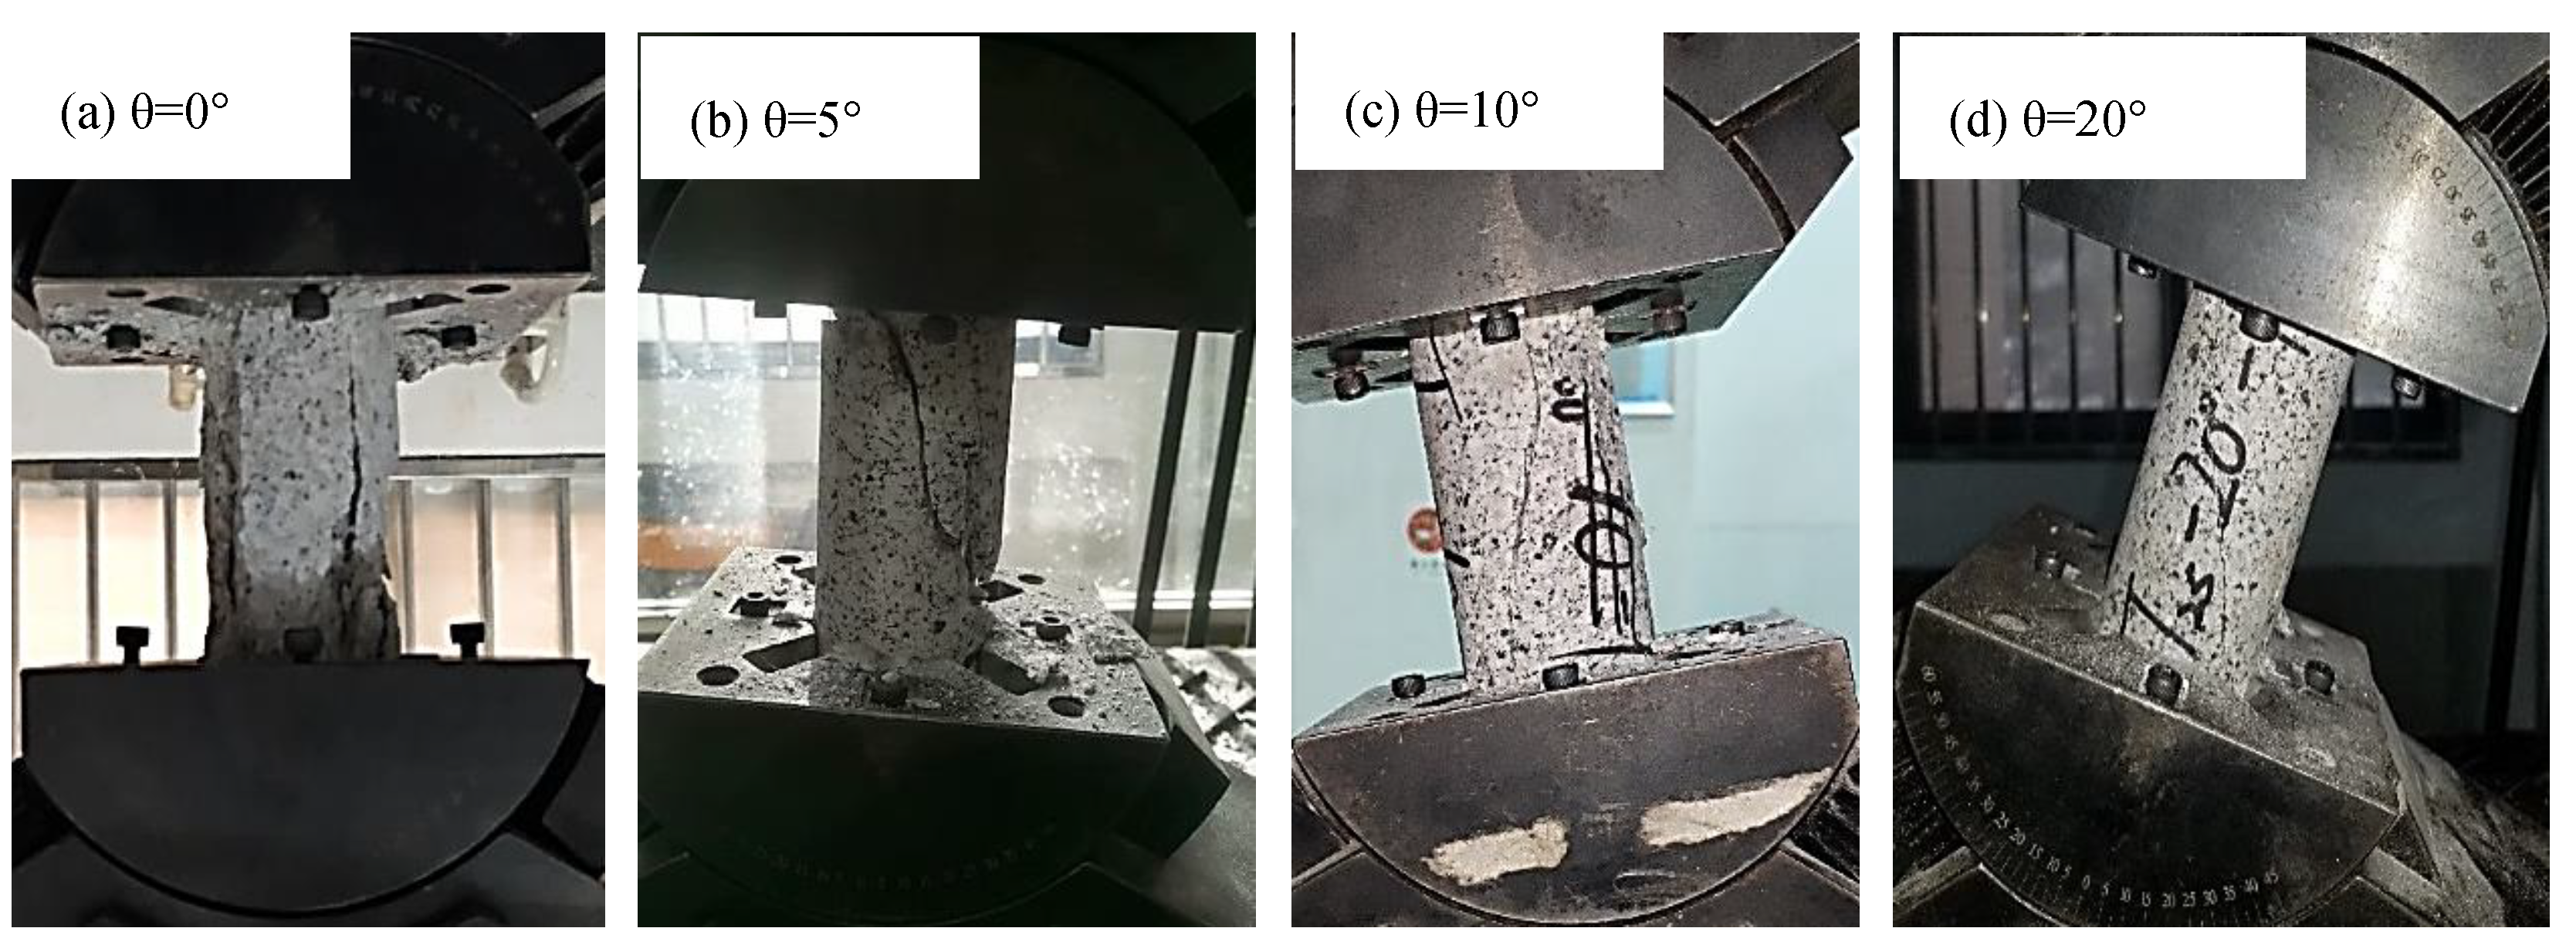
Figure 15 shows the typical failure surface of granite specimens at various inclination angles. It can be seen from Figure 15a that under pure uniaxial compression, the surface cracks of granite develop parallel to the axial direction of the specimen, showing obvious splitting failure, which belongs to the typical hard rock failure mode [33,34,35,36]. When the inclination angle is 5°, the main failure surface of the specimens is distributed at an angle range of 5°–10° along its axis with vertical splitting cracks partly (Figure 15b). It shows that the inclination angle has a certain effect on the failure mode of granite, which gradually changes from splitting failure under pure uniaxial compression to combined splitting-shear failure mode. With the further increase of inclination angle from 10° to 20°, the fracture angle of the specimen's surface increases further, and there is no obvious sign of splitting failure, indicating that the shear failure becomes the main failure mode in the inclination range (Figure 15c,d). In fact, many factors can affect the failure process of rock, such as the distribution form of external loads [30].
Under pure uniaxial compression, the main failure mode of hard rock specimens is splitting failure, while in inclined UCS test, the failure mode of hard rock samples changes from combined shear-splitting to single shear failure mode with the increasing inclination angle. This may be related to the magnitude of the shear stress component acting on the specimens under inclined compression-shear conditions. The above analysis also shows that the splitting failure is not the intrinsic failure mode of granite, and its failure types should take full account of the role of external loads.
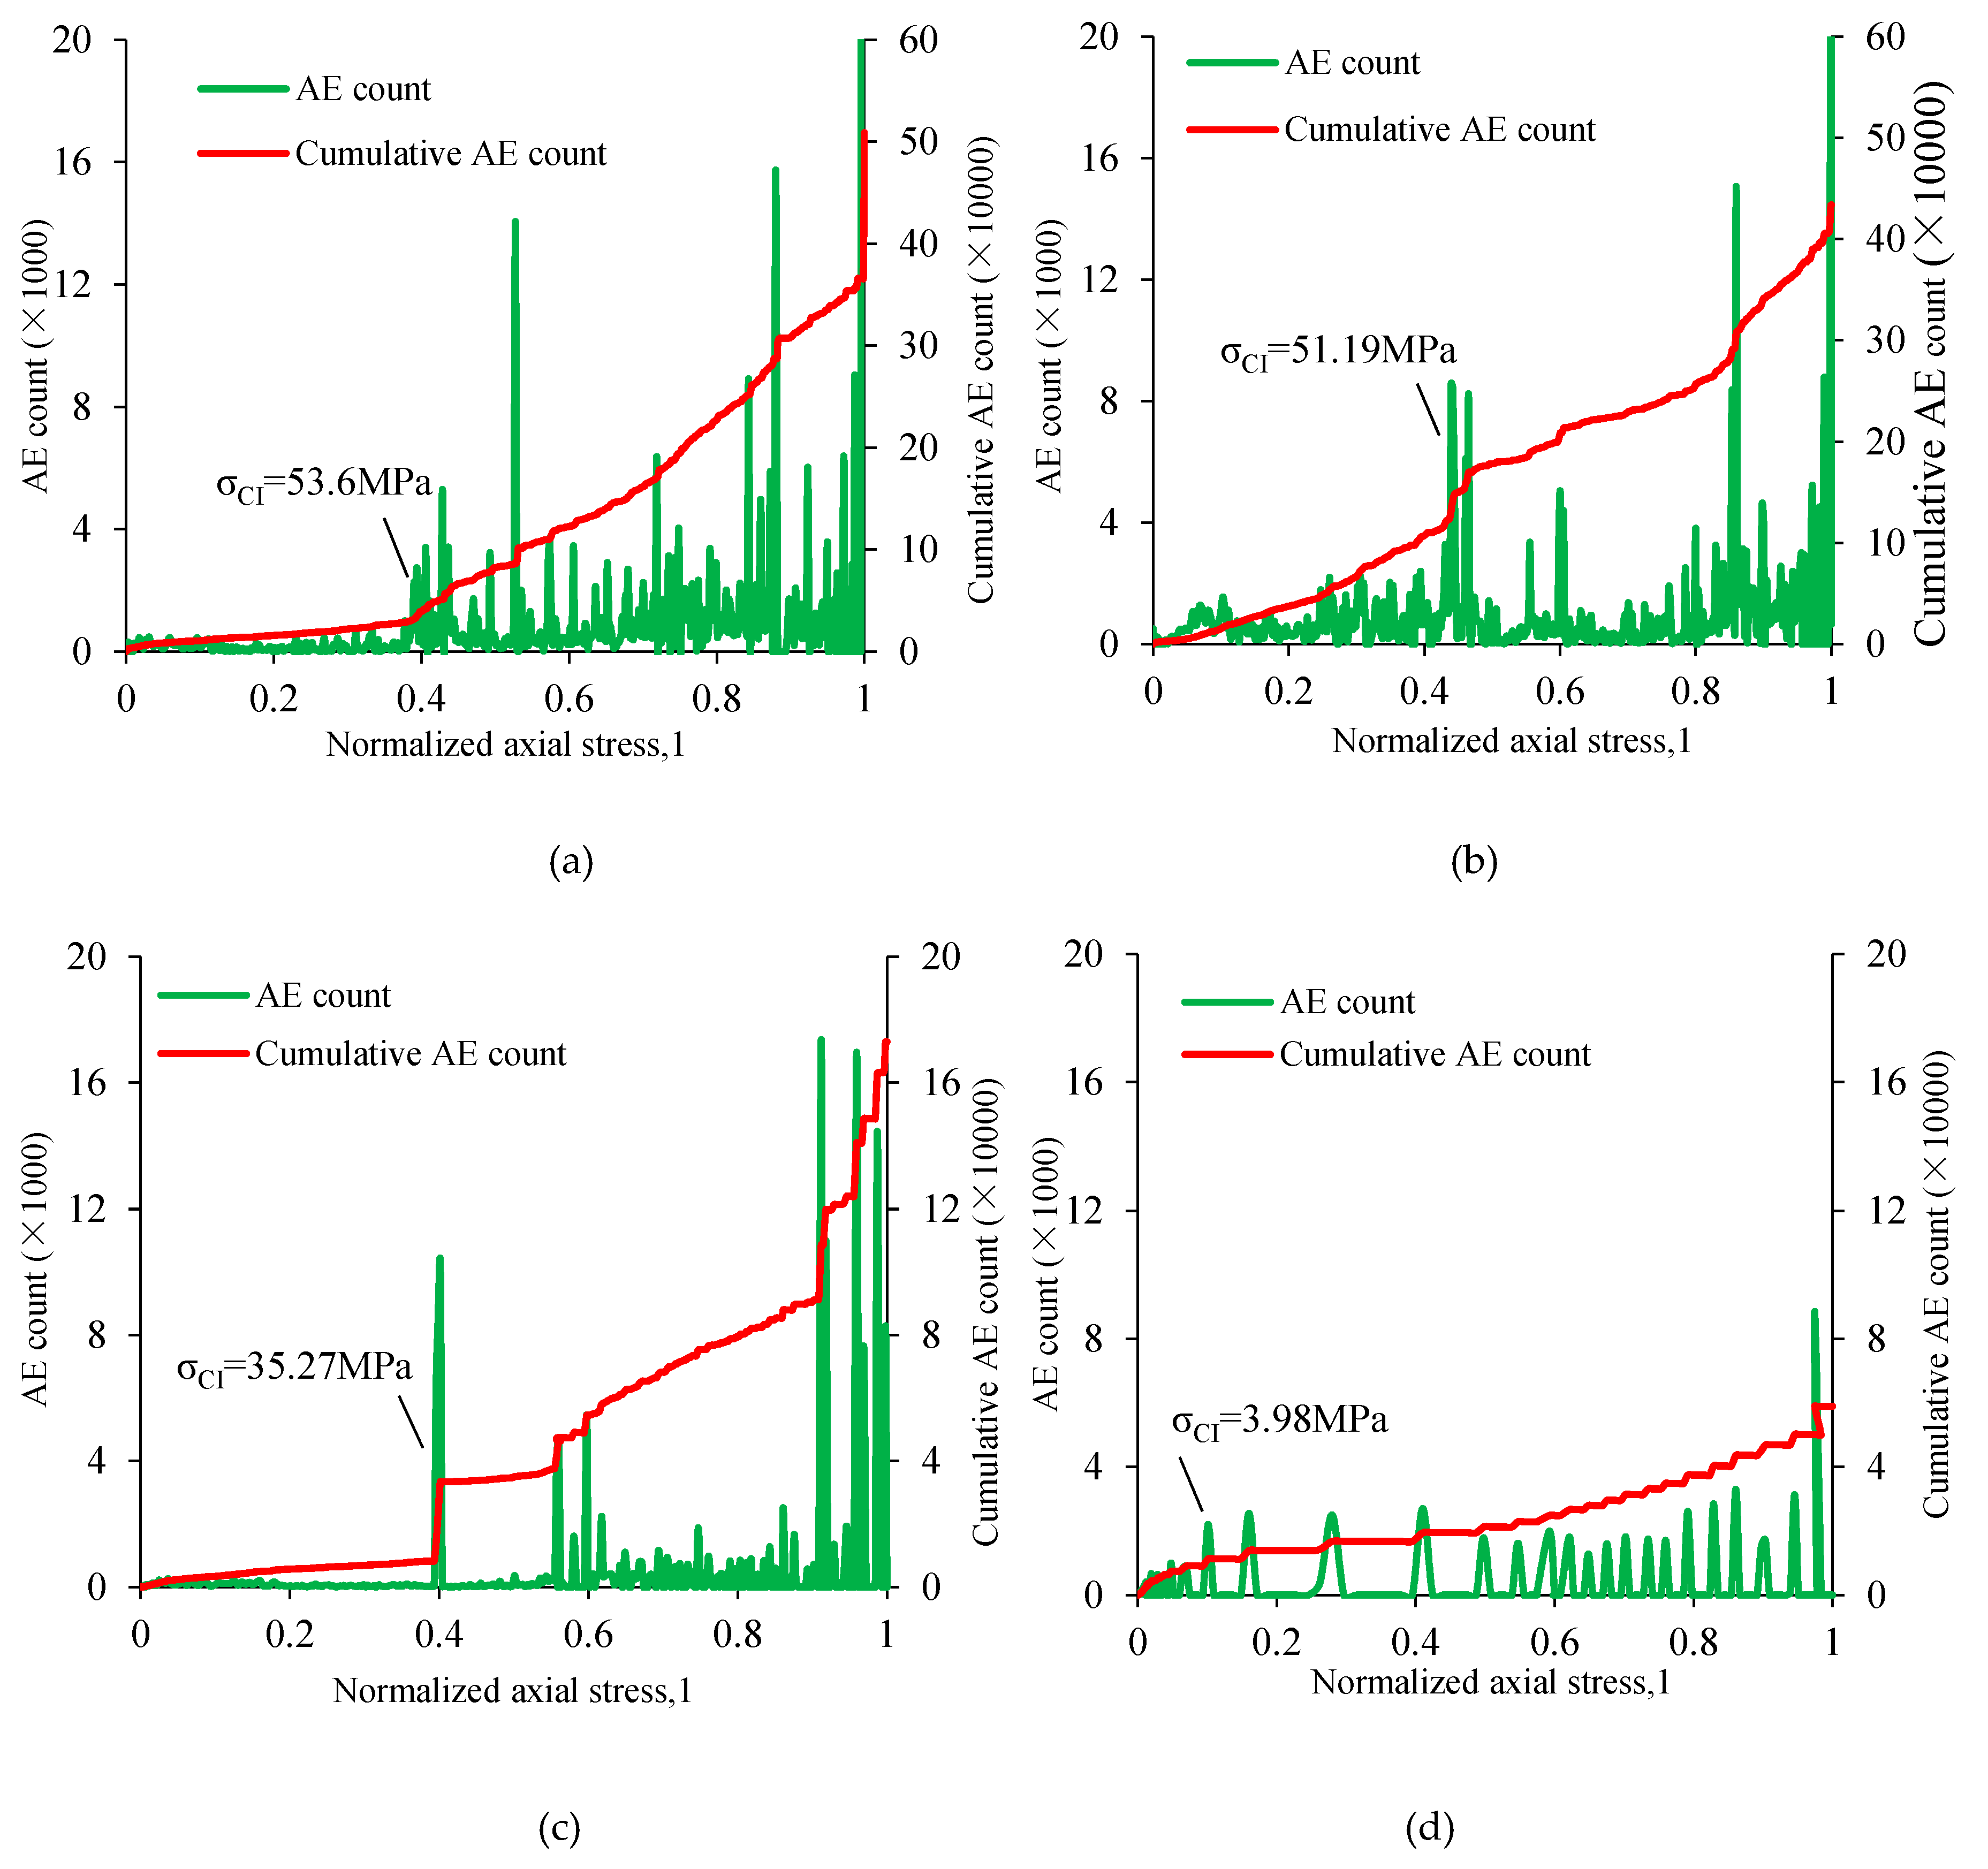
4.1.2. Influence of Inclination Angle on AE Behavior
The cracking initiation and propagation of rock material is usually accompanied by the release of strain energy, of which the signal can be collected by AE system [37]. The stress-AE count curves of granite with various inclination angles are shown in Figure 16. The normalized abscissa value in Figure 16 is the ratio of the stress value of the specimens to its peak compression stress at any time during loading. σCI represents the stress threshold of microcrack initiation during the test. This value can be determined by the initial sharp point of AE count [38]. Table 7 lists the values of σCI, total accumulated AE count and shear stress component at σCI point under various inclination angles. Some meaningful conclusions can be drawn as follows:
- Regardless of the inclination angle, the entire AE count is smaller in the initial stage before 40%-55% of peak compression stress, and the curve slope of the cumulative AE count is obviously lower. This is mainly due to the initial crack closure stage of the specimens, in which it has less elastic energy release. This stage can be called as the quiet period of AE activity.
- When the loading stress reaches the crack initiation stress threshold (σCI), the AE count and the curve slope of the cumulative AE count begin to increase gradually at this position. As the loading level continues to increase, large AE events occur intermittently, and they will increase sharply before the peak compression stress. This indicates that substantial microcracks have developed and propagated during this stage, and finally formed macrocracks through interpenetration.
- Although changes of cumulative AE curves at various inclination angles are similar and show “J” variation, the increase of inclination angle has a greater impact on the value of σCI, total cumulative AE count and shear stress at σCI point, as shown in Table 7. With the increase of inclination angle, both σCI and total cumulative AE count decrease gradually, while the shear stress at σCI point gradually increases. For instance, when the inclination angle is 5°, the value of σCI decreases by 14.77%, while the shear stress at σCI point increases 4.33 MPa compared with that under the pure uniaxial compression state. When the inclination angle increases to 10° and 20°, the value of σCI decreases by 47.37% and 57.13%, while the shear stress at σCI point increases 5.31 MPa and 9.06 MPa, respectively. It means that the shear stress component can facilitate the microcrack initiation and propagation. This will lead to the decrease of σCI and total cumulative AE count. [14,15,39].
4.2. Influence of Temperature on AE and Fracture Behavior
4.2.1. Influence of Temperature on Fracture Behavior
The typical failure modes of heat-treated granite at 5° inclination is shown in Figure 17. With the increasing temperature, the macroscopic failure patterns of granite specimen have changed slightly. When the temperature is lower than 600 °C, the macro-failure surface of the specimens is relatively smooth, and the fractured block is relatively complete. Both the shear crack and splitting crack can be observed clearly in Figure 17a–c. Hence, the failure form of granite should belong to combined splitting-shear failure mode in the temperature range of 25–400 °C. Once the temperature reaches or exceeds 600 °C, the macro-failure surface of the specimens appears more loosely distributed particles and arranged in a certain angle with the axial direction of the specimen. This phenomenon is more obvious especially when the temperature reaches 800 °C (see Figure 17d,e). At this state, the failure patterns of the specimen can be characterized by shear failure. This is mainly because when the temperature reaches 600 °C, the internal damage of the specimens is more severe, the numbers of thermal cracks and pores increase greatly (as shown in Figure 2d,e). This leads to the weaker internal friction and cohesion, so that the shearing slip damage among particles is more likely to occur under the lower action of external load with particles interpenetrate each other. Hence, the degree of fracture is higher under higher temperature treatment.
4.2.2. Influence of Temperature on AE Behavior
The “normalized axial stress vs AE count and cumulative AE count” curve of granite specimens at various temperatures is shown in Figure 18. Table 8 lists the σCI values, total cumulative AE count and the shear stress at σCI point. From Figure 18, we can see that when the temperature does not exceed 400 °C, the variation of AE count and total cumulative AE count are consistent with that of AE reflected in Figure 16. When the temperature reaches 600 °C, the amplitude and frequency of AE count is relatively lower than that 25–400 °C. The curve of cumulative AE count shows obvious three-line segment variation characteristics, which is slightly different from the traditional “J” and “S” curves [40,41,42,43]. This may be due to the redistribution of large size microcracks in granite specimens after high-temperature treatment. When the temperature reaches 800 °C, it can be clearly seen that the value of σCI and shear stress at σCI point decrease sharply compared with that at 600 °C. The curve of AE count shows periodic change, and the curve of cumulative AE count is significantly different from curves at other temperatures. This indicates that the internal structure of the specimens has changed significantly at 800 °C (as shown in Figure 2e) and the change of microcrack propagation and connection is different from those at any other temperature, which is inconsistent with Yang’s research results [18]. The reasons for this phenomenon will be discussed in Section 5 in detail. Meanwhile, with the temperature increases, the σCI, total cumulative AE count and the shear stress at σCI point show the characteristics of firstly increasing and then decreasing and reach the maximum values at 200 °C. For instance, when the temperature is 200 °C, the σCI, total cumulative AE count and shear stress at σCI point increase by 8.28%, 27.3% and 8.55% respectively compared with that at the room temperature; while, the above three parameters respectively decrease by 34.2%, 66.01% and 34.26% for 600 °C compared with that under 200 °C. Particularly, the σCI, total cumulative AE count and shear stress at σCI point under 800 °C is only 7.4%, 11.60% and 7.4% of that under 200 °C respectively. This indicates that the temperature of 200 °C is the threshold which causes the change of micro-fracture of specimens. The temperature threshold is consistent with that the determined in Section 3.2.2.
5. Discussions
Previous studies have shown that peak compression strength and elastic modulus of rock are not inherent attributes, but are closely related to the external loads [42]. The fracture process of rock is influenced by the random distribution of microcracks and the friction resistance among particles [44]. The increase of shear stress component is beneficial to reducing the friction resistance among particles and accelerating the initiation of microcracks. Under pure uniaxial compression, the shear stress component on the surface of microcracks is mainly provided by the redistribution of the local stress state inside the specimens. Therefore, it is necessary to apply higher axial stress to adjust the internal stress state of the specimen to make the shear stress at the tip of microcracks reach its initiation threshold. During the inclined UCS experiment, the inclination of specimens can directly produce shear stress components inside the specimen and accelerate the sliding of microcracks surfaces [14,45,46]. That will then cause microcracks to initiate and propagate of the specimens under lower axial loads, and ultimately form a macro-fracture surface. This explains why the peak strength and elastic modulus decrease with the increasing inclination angle.
In underground engineering, UCS is an important parameter for evaluating the stability of rock construction, such as deep rock pillar, nuclear waste repository, etc. However, the traditional evaluation of pillar strength considers the UCS under pure compression while neglecting the influence of inclination angle [11,13,47,48,49,50,51], which is not appropriate in many cases. Under this method, the strength of pillars may be overestimated, and inappropriate reinforcement plan may be implemented. Therefore, this paper suggests that the inclination angle of pillar should be considered while designing the pillar dimensions.
Temperature is one of the important factors that can affect the mechanical properties of rock. The analysis of the AE activity of heat-treated granite can effectively reveal the thermal effect on their micro-fracture. When the temperature does not exceed 400 °C, the thermal damage inside the specimens is less obvious than that at 600 °C and 800 °C; and the distributions of micropore and microcrack are similar (Figure 2a–c). This can be also reflected on the AE activities in the experimental process. When the temperature reaches 600 °C, many large size thermal cracks begin to appear (Figure 2d), leading to the reduction of internal friction effect among particles greatly (Figure 17d, powder particles). This means that the crack will initiate at a low loading stress, and then the AE activities will also decrease greatly compared with that under 25–400 °C. Once the loading stress is close to the peak strength, the crack penetrates the surface of the specimens and forms macrocracks. At that time, a large amount of elastic energy is released and recorded by AE events, as displayed in Figure 18c. When the temperature reaches 800 °C, a large number of hot melt holes are generated in the specimens (Figure 2e), and the cementation among particles is further weakened, so that the crack initiation threshold is achieved at a smaller loading stress, which is only 7.4% of that under 200 °C. With the increase of loading stress, the frequency of AE activity shows periodic fluctuation, which may be related to micro-fracture form of the specimen. Considerable elastic energy needed to be released during the pore intersection process. However, the distribution of pores was not uniform. Hence, the pores subjected to a high stress state cracked first. By that stage, cracks gradually expanded outward in sequence. This resulted in periodical elastic energy release. When the peak strength was approached, pores intersected and formed macrocracks, with the AE count increasing greatly.
6. Conclusions
A novel C-CAST system is used to study the mechanical response of granite specimens treated by various high temperatures under inclined compression conditions. The influence of high temperature and inclination angle on the mechanical parameters, microcrack initiation and propagation and failure mode of granite is analyzed and discussed in detail by using SEM and AE techniques. Some valuable conclusions are summarized as follows.
- Both the testing temperature and inclination angle have an extremely important effect on the mechanical properties of granite specimens. The peak compression stress and elastic modulus gradually decrease with the increasing inclination angle, while the peak shear stress increases nonlinearly, indicating that the additional shear stress component may lessen friction resistance and accelerate crack initiation and propagation. With the increasing temperature from 25 to 800 °C, the elastic modulus, peak compression stress and peak shear stress first increase slightly and then decrease obviously, while the peak axial strain and peak shear displacement firstly rise from 25 to 200 °C, then drop slightly from 200 to 400 °C and finally increase at a higher rate from 400 to 800 °C, indicating that the temperature has a significant influence on the ductility of granite specimen.
- The AE activities of granite specimens are analyzed by considering the effect of temperature and inclination angle. Considerable AE events are observed before the peak strength for all specimens. Compared with pure uniaxial compression, the total accumulated AE count, crack initiation (CI) stress threshold gradually decreases with the increasing inclination angle, while the shear stress at CI threshold point increases, indicating that the shear stress component contributes to the microcrack initiation. As the temperature increases, the total accumulated AE count, CI threshold and the shear stress at CI threshold point firstly increase and then gradually decrease. Compared with the AE count from 25 to 600 °C, the AE count under 800 °C shows obvious differences and exhibits periodic variation, which is closely related to the penetration and expansion of hot melt holes in the specimens. The hot melt holes can be clearly observed from SEM results.
- The fracture morphologies of granite specimens are highly dependent on both the temperature and inclination angle. Compared with pure uniaxial compression, the failure mode is transferred from splitting failure to combined splitting-shear failure at 5° inclination, while from combined splitting-shear failure to single shear failure with the increasing inclination angle from 5° to 20° inclination. The failure patterns with various treated temperatures change from combined splitting-shear failure (25–400 °C) to single shear failure (600 and 800 °C), which is closely related to the friction resistance and cohesion among particles.
Author Contributions
Methodology, X.M.; data curation and funding acquisition, L.C.; writing—Original draft preparation, P.W. All authors have read and agreed to the published version of the manuscript.
Funding
This research was funded by the Fundamental Research Funds for the Central Universities [2018BSCXB20] and the Postgraduate Research & Practice Innovation Program of Jiangsu Province [KYCX18_1968].
Conflicts of Interest
The authors declare no conflicts of interest.
References
- Kuenzer, C.; Zhang, J.; Jing, L.; Huadong, G.; Dech, S. Thermal Infrared Remote Sensing of Surface and Underground Coal Fires. In Thermal Infrared Remote Sensing; Springer: Dordrecht, The Netherlands, 2013; pp. 429–451. [Google Scholar]
- Homand-Etienne, F.; Houpert, R. Thermally induced microcracking in granites: Characterization and analysis. Int. J. Rock Mech. Min. Sci. Géoméch. Abstr. 1989, 26, 125–134. [Google Scholar] [CrossRef]
- Li, M.; Mao, X.B.; Cao, L.L.; Pu, H.; Mao, R.R.; Lu, A.H. Effects of thermal treatment on the dynamic mechanical properties of coal measures sandstone. Rock Mech. Rock Eng. 2016, 49, 3525–3539. [Google Scholar] [CrossRef]
- Feng, Z.J.; Zhao, Y.S.; Zhou, A.C.; Zhang, N. Development program of hot dry rock geothermal resource in the Yangbajing Basin of China. Renew. Energy 2012, 39, 490–495. [Google Scholar] [CrossRef]
- Ranjith, P.G.; Viete, D.R.; Chen, B.J.; Perera, M.S.A. Transformation plasticity and the effect of temperature on the mechanical behaviour of Hawkesbury sandstone at atmospheric pressure. Eng. Geol. 2012, 151, 120–127. [Google Scholar]
- Ding, Q.L.; Ju, F.; Mao, X.B.; Ma, D.; Yu, B.Y.; Song, S.B. Experimental investigation of the mechanical behavior in unloading conditions of sandstone after high-temperature treatment. Rock Mech. Rock Eng. 2016, 49, 2641–2653. [Google Scholar] [CrossRef]
- Heuze, F. High-temperature mechanical, physical and Thermal properties of granitic rocks—A review. Int. J. Rock Mech. Min. Sci. Géoméch. Abstr. 1983, 20, 3–10. [Google Scholar] [CrossRef]
- Ozguven, A.; Ozcelik, Y. Effects of high temperature on physico-mechanical properties of Turkish natural building stones. Eng. Geol. 2014, 183, 127–136. [Google Scholar] [CrossRef]
- Liu, S.; Xu, J. Effect of strain rate on the dynamic compressive mechanical behaviors of rock material subjected to high temperatures. Mech. Mater. 2015, 82, 28–38. [Google Scholar] [CrossRef]
- Yang, S.Q.; Ranjith, P.G.; Jing, H.W.; Tian, W.L.; Ju, Y. An experimental investigation on thermal damage and failure mechanical behavior of granite after exposure to different high temperature treatments. Geothermics 2017, 65, 180–197. [Google Scholar] [CrossRef]
- Whittaker, B.N.; Singh, R.N. Design and stability of pillar in long wall mining. Min. Eng. 1979, 13, 68–72. [Google Scholar]
- Foroughi, M.H.; Vutukuri, V.S. Estimating elastic pillar stresses in inclined coal seams. Trans. Soc. Min. Metall. Explor. Inc. 1997, 302, 50–54. [Google Scholar]
- Andersson, J.C.; Martin, C.D. The Äspö pillar stability experiment: Part I—Experiment design. Int. J. Rock Mech. Min. Sci. 2009, 46, 865–878. [Google Scholar] [CrossRef]
- He, Q.; Li, Y.; She, S. Mechanical Properties of Basalt Specimens under Combined Compression and Shear Loading at Low Strain Rates. Rock Mech. Rock Eng. 2019, 52, 4101–4112. [Google Scholar] [CrossRef]
- He, Q.; Li, Y.; Xu, J.; Zhang, C. Prediction of Mechanical Properties of Igneous Rocks Under Combined Compression and Shear Loading Through Statistical Analysis. 2019. Available online: https://0-link-springer-com.brum.beds.ac.uk/article/10.1007/s00603-019-01948-9 (accessed on 9 February 2020).
- Somerton, W.H. Thermal Properties and Temperature-Related Behavior of Rock/Fluid Systems; Elsevier: New York, NY, USA, 1992. [Google Scholar]
- Chaki, S.; Takarli, M.; Agbodjan, W.P. Influence of thermal damage on physical properties of a granite rock: Porosity, permeability and ultrasonic wave evolutions. Constr. Build. Mater. 2008, 22, 1456–1461. [Google Scholar] [CrossRef]
- Yang, S.-Q.; Huang, Y.-H.; Tian, W.-L.; Yin, P.-F.; Jing, H.-W. Effect of High Temperature on Deformation Failure Behavior of Granite Specimen Containing a Single Fissure under Uniaxial Compression. Rock Mech. Rock Eng. 2019, 52, 2087–2107. [Google Scholar] [CrossRef]
- Liang, W.G.; Xu, S.G.; Zhao, Y.S. Experimental study of temperature effects on physical and mechanical characteristics of salt rock. Rock Mech. Rock Eng. 2006, 39, 469–482. [Google Scholar] [CrossRef]
- Xu, X.L.; Gao, F.; Zhang, Z.Z. Influence of confining pressure on deformation and strength properties of granite after high temperatures. Chin. J. Geotech. Eng. 2014, 36, 2246–2252. [Google Scholar]
- De Bresser, J.H.P.; Urai, J.L.; Olgaard, D.L. Effect of water on the strength and microstructure of Carrara marble axially compressed at high temperature. J. Struct. Geol. 2005, 27, 265–281. [Google Scholar] [CrossRef]
- Yang, S.Q.; Hu, B. Creep and long-term permeability of a red sandstone subjected to cyclic loading after thermal treatments. Rock Mech. Rock Eng. 2018, 51, 2981–3004. [Google Scholar] [CrossRef]
- Baker, W.E.; Yew, C.H. Strain-rate effects in the propagation of torsional plastic waves. J. Appl. Mech. 1966, 33, 917–923. [Google Scholar] [CrossRef]
- Ogawa, K. Impact friction test method by applying stress wave. Exp. Mech. 1997, 37, 398–402. [Google Scholar] [CrossRef]
- Huang, H.; Feng, R. A study of the dynamic tribological response of closed fracture surface pairs by Kolsky-bar compression-shear experiment. Int. J. Solids Struct. 2004, 41, 2821–2835. [Google Scholar] [CrossRef]
- Xu, Y.; Dai, F. Dynamic response and failure mechanism of brittle rocks under combined compression-shear loading experiments. Rock Mech. Rock Eng. 2018, 51, 747–764. [Google Scholar] [CrossRef]
- Fairhurst, C.E.; Hudson, J.A. Draft ISRM suggested method for the complete stress-strain curve for intact rock in uniaxial compression. Int. J. Rock Mech. Min. Sci. 1999, 36, 279–289. [Google Scholar]
- Shalabi, F.I.; Cording, E.J.; Al-Hattamleh, O.H. Estimation of rock engineering properties using hardness tests. Eng. Geol. 2007, 90, 138–147. [Google Scholar] [CrossRef]
- Mahabadi, O.; Kaifosh, P.; Marschall, P.; Vietor, T. Three-dimensional FDEM numerical simulation of failure processes observed in Opalinus Clay laboratory samples. J. Rock Mech. Geotech. Eng. 2014, 6, 591–606. [Google Scholar] [CrossRef] [Green Version]
- Bieniawski, Z.T. Mechanism of brittle fracture of rock: Part I—Theory of the fracture process. Int. J. Rock Mech. Min. Sci. Geomech. Abstr. Pergamon. 1967, 4, 395–406. [Google Scholar] [CrossRef]
- Moradian, Z. Damage of Rock Joints Using Acoustic Emissions; Rock Mechanics and Engineering Volume 2; CRC Press: London, UK, 2017; pp. 165–188. [Google Scholar]
- Hedayat, A.; Haeri, H.; Hinton, J.; Masoumi, H.; Spagnoli, G. Geophysical Signatures of Shear-Induced Damage and Frictional Processes on Rock Joints. J. Geophys. Res. Solid Earth 2018, 123, 1143–1160. [Google Scholar] [CrossRef]
- Diederichs, M.S.; Kaiser, P.K.; Eberhardt, E. Damage initiation and propagation in hard rock during tunnelling and the influence of near-face stress rotation. Int. J. Rock Mech. Min. Sci. 2004, 41, 785–812. [Google Scholar] [CrossRef]
- Zhao, X.G.; Cai, M. Influence of plastic shear strain and confinement-dependent rock dilation on rock failure and displacement near an excavation boundary. Int. J. Rock Mech. Min. Sci. 2010, 47, 723–738. [Google Scholar] [CrossRef]
- Li, D.; Li, C.; Li, X. Influence of sample height-to-width ratios on failure mode for rectangular prism samples of hard rock loaded in uniaxial compression. Rock Mech. Rock Eng. 2011, 44, 253–267. [Google Scholar] [CrossRef] [Green Version]
- Zhu, W.; Yang, W.; Li, X.; Xiang, L.; Yu, D. Study on splitting failure in rock masses by simulation test, site monitoring and energy model. Tunn. Undergr. Space Technol. 2014, 41, 152–164. [Google Scholar] [CrossRef]
- Hu, X.; Su, G.; Chen, K.; Li, T.; Jiang, Q. Strainburst characteristics under bolt support conditions: An experimental study. Nat. Hazards 2019, 97, 913–933. [Google Scholar] [CrossRef]
- Eberhardt, E.; Stead, D.; Stimpson, B.; Read, R. Changes in acoustic event properties with progressive fracture damage. Int. J. Rock Mech. Min. Sci. 1997, 34, 71.e1–71.e12. [Google Scholar] [CrossRef]
- Nicksiar, M.; Martin, C.D. Factors affecting crack initiation in low porosity crystalline rocks. Rock Mech. Rock Eng. 2014, 47, 1165–1181. [Google Scholar] [CrossRef]
- Zhao, X.; Cai, M.; Wang, J.; Ma, L. Damage stress and acoustic emission characteristics of the Beishan granite. Int. J. Rock Mech. Min. Sci. 2013, 64, 258–269. [Google Scholar] [CrossRef]
- Zhang, C.; Liang, W.; Li, Z.; Xu, S.; Zhao, Y. Observations of acoustic emission of three salt rocks under uniaxial compression. Int. J. Rock Mech. Min. Sci. 2015, 100, 19–26. [Google Scholar] [CrossRef]
- Wen, T.; Tang, H.; Ma, J.; Wang, Y. Evaluation of methods for determining crack initiation stress under compression. Eng. Geol. 2018, 235, 81–97. [Google Scholar] [CrossRef]
- Hudson, J.A. Shape of the complete stress-strain curve for rock. In Proceedings of the 13th Symposium on Rock Mechanics, Urbana, IL, USA, 30 August–1 September 1971; p. 111. [Google Scholar]
- McClintock, F.A. Friction on Griffith cracks in rocks under pressure. ASME 1962, 2, 1015–1022. [Google Scholar]
- He, Q.; Li, Y.; Li, D.; Zhang, C. Microcrack Fracturing of Coal Specimens under Quasi-static Combined Compression and Shear Loading. Int. J. Rock Mech. Geotech. Eng 2020, in press. [Google Scholar]
- Li, Y.; Tang, C.; Li, D.; Wu, C. A new shear strength criterion of three-dimensional rock joints. Rock Mech. Rock Eng. 2019, 1–7. Available online: https://0-doi-org.brum.beds.ac.uk/10.1007/s00603-019-01976-5 (accessed on 9 February 2020).
- Suorineni, F.T.J.; Mgumbwa, J.; Kaiser, P.K.; Thibodeau, D. Mining of orebodies under shear loading Part 2–failure modes and mechanisms. Min. Technol. 2014, 123, 240–249. [Google Scholar] [CrossRef] [Green Version]
- Yang, H.; Cao, S.; Li, Y.; Sun, C.; Guo, P. Soft roof failure mechanism and supporting method for gob-side entry retaining. Minerals 2015, 5, 707–722. [Google Scholar] [CrossRef] [Green Version]
- Sainoki, A.; Mitri, H.S. Numerical investigation into pillar failure induced by time-dependent skin degradation. Int. J. Min. Sci. Technol. 2017, 27, 591–597. [Google Scholar] [CrossRef]
- Wang, X. Analysis of progressive failure of pillar and instability criterion based on gradient-dependent plasticity. J. Cent. South Univ. Technol. 2004, 11, 445–450. [Google Scholar] [CrossRef]
- Zhang, S.; Wang, X.; Fan, G.; Zhang, D.; Jianbin, C. Pillar size optimization design of isolated island panel gob-side entry driving in deep inclined coal seam—Case study of Pingmei No. 6 coal seam. J. Geophys. Eng. 2018, 15, 816–828. [Google Scholar] [CrossRef] [Green Version]
Figure 1.
Granite samples after high-temperature treatment. (a) Temperature for room temperature, 25 °C; (b) Temperature for 200 °C; (c) Temperature for 400 °C; (d) Temperature for 600 °C; (e) Temperature for 800 °C.
Figure 1.
Granite samples after high-temperature treatment. (a) Temperature for room temperature, 25 °C; (b) Temperature for 200 °C; (c) Temperature for 400 °C; (d) Temperature for 600 °C; (e) Temperature for 800 °C.

Figure 2.
Microstructure image of heat-treated granite obtained by SEM. Red arrow indicates the microcrack and micropore.
Figure 2.
Microstructure image of heat-treated granite obtained by SEM. Red arrow indicates the microcrack and micropore.

Figure 3.
Physical and schematic diagram of the C-CAST system. (a) Physical diagram of the C-CAST system; (b) Schematic diagram of the C-CAST system.
Figure 3.
Physical and schematic diagram of the C-CAST system. (a) Physical diagram of the C-CAST system; (b) Schematic diagram of the C-CAST system.

Figure 4.
Calculation method of the stress component of the specimen in the C-CAST system.

Figure 5.
Relationship curve between stress components and deformation. (a) Axial stress component-axial strain curve; (b) Shear stress component-shear displacement curve.
Figure 5.
Relationship curve between stress components and deformation. (a) Axial stress component-axial strain curve; (b) Shear stress component-shear displacement curve.


Figure 6.
Peak compression stress changes with the increasing inclination angle.

Figure 7.
Elastic modulus changes with the increasing inclination angle.

Figure 8.
Relationship curve between inclination angle and peak shear stress component.

Figure 9.
Relationship between peak shear stress and compression strength parameters. (a) Relationship between peak shear stress and peak compression stress; (b) Relationship between peak shear stress and elastic modulus.
Figure 9.
Relationship between peak shear stress and compression strength parameters. (a) Relationship between peak shear stress and peak compression stress; (b) Relationship between peak shear stress and elastic modulus.

Figure 10.
Comparative analysis between current study result and the result by He et al. [14,15]. (a) Comparative analysis on the peak compression stress; (b) Comparative analysis on the elastic modulus.

Figure 11.
Axial stress-strain curves of granite specimen at different temperatures.

Figure 12.
Shear stress-displacement curves of granite specimen at different temperatures.

Figure 13.
Effect of temperatures on specimen mechanical properties. Tread line in (a,b) fit the data when the temperature ranges from 25 °C to 800 °C: (a) effect of temperatures on the peak compression stress. (b) effect of temperatures on elastic moduli. (c) effect of temperatures on average peak strain.

Figure 14.
Effect of temperatures on specimen shear properties. (a) Effect of temperatures on peak shear stress component. (b) Effect of temperatures on shear displacement.
Figure 14.
Effect of temperatures on specimen shear properties. (a) Effect of temperatures on peak shear stress component. (b) Effect of temperatures on shear displacement.

Figure 15.
Effect of inclination angle on specimen fracture pattern.

Figure 16.
Stress-AE count curves of granite specimens with different inclination angle: (a) Uniaxial compression for Case1-1-1; (b) θ = 5° for Case2-2-1; (c) θ = 10° for Case3-1-2; (d) θ = 20° for Case4-1-1. σCI is the CI thresholds of the granite in Test Cases determined by AE count and cumulative AE count. Noted that the curve ignores the effect of the posterior peak.

Figure 17.
Typical failure patterns of granite specimens at 5° inclination considering different Table 25. in Test Case2-1-1; (b) failure pattern of the granite specimen at T = 200 °C in Test Case2-2-2; (c) failure pattern of the granite specimen at T = 400 °C in Test Case2-3-2; (d) failure pattern of the granite specimen at T = 600 °C in Test Case2-4-3; (e) failure pattern of the granite specimen at T = 800 °C in Test Case2-5-1.

Figure 18.
Stress-AE count curves of granite specimens with different temperatures: (a) T = 200 °C for Case2-2-2; (b) T = 400 °C for Case2-3-2; (c) T = 600 °C for Case2-4-3; (d) T = 800 °C for Case2-5-1.
Figure 18.
Stress-AE count curves of granite specimens with different temperatures: (a) T = 200 °C for Case2-2-2; (b) T = 400 °C for Case2-3-2; (c) T = 600 °C for Case2-4-3; (d) T = 800 °C for Case2-5-1.


Table 1.
The value of peak compression stress at room temperature.
| Test Scenario | Test Case | Strength (MPa) | Absolute Deviation (MPa) | Relative Deviation (%) | Mean Value (MPa) | Standard Deviation (MPa) | Coefficient of Variation (%) |
|---|---|---|---|---|---|---|---|
| θ = 0° | Case1-1-1 | 127.2 | 0.7 | 0.5 | 127.9 | 3.2 | 2.5 |
| Case1-1-2 | 131.4 | 3.5 | 2.7 | ||||
| Case1-1-3 | 125.1 | 2.8 | 2.2 | ||||
| θ = 5° | Case2-1-1 | 107.2 | 0.9 | 0.8 | 106.3 | 2.4 | 2.3 |
| Case2-1-2 | 108.1 | 1.8 | 1.7 | ||||
| Case2-1-3 | 103.6 | 2.7 | 2.5 | ||||
| θ = 10° | Case3-1-1 | 70.6 | 2.1 | 2.9 | 72.7 | 1.9 | 2.6 |
| Case3-1-2 | 73.6 | 0.9 | 1.2 | ||||
| Case3-1-3 | 74.0 | 1.3 | 1.8 | ||||
| θ = 20° | Case4-1-1 | 45.3 | 0.1 | 0.2 | 45.2 | 2.9 | 6.4 |
| Case4-1-2 | 42.3 | 2.9 | 6.4 | ||||
| Case4-1-3 | 48.0 | 2.8 | 6.2 |
Table 2.
The value of elastic modulus at room temperature.
| Test Scenario | Test Case | Elastic Modulus (GPa) | Absolute Deviation (GPa) | Mean Value (GPa) | Standard Deviation (GPa) |
|---|---|---|---|---|---|
| θ = 0° | Case1-1-1 | 14.3 | 0.2 | 14.5 | 1.1 |
| Case1-1-2 | 13.5 | 1.0 | |||
| Case1-1-3 | 15.6 | 1.1 | |||
| θ = 5° | Case2-1-1 | 12.5 | 1.4 | 11.1 | 1.3 |
| Case2-1-2 | 9.9 | 1.2 | |||
| Case2-1-3 | 10.8 | 0.3 | |||
| θ = 10° | Case3-1-1 | 10.4 | 0.3 | 10.7 | 0.9 |
| Case3-1-2 | 10.1 | 0.6 | |||
| Case3-1-3 | 11.7 | 1.0 | |||
| θ = 20° | Case4-1-1 | 6.0 | 0.1 | 6.1 | 0.1 |
| Case4-1-2 | 6.2 | 0.1 | |||
| Case4-1-3 | 6.1 | 0.0 |
Table 3.
Peak shear stress component of granite specimens (The value is equal to zero at 0° inclination).
Table 3.
Peak shear stress component of granite specimens (The value is equal to zero at 0° inclination).
| Test Scenario | Test Case | Strength (MPa) | Absolute Deviation (MPa) | Relative Deviation (%) | Mean Value (MPa) | Standard Deviation (MPa) | Coefficient of Variation (%) |
|---|---|---|---|---|---|---|---|
| θ = 5° | Case2-1-1 | 9.4 | 0.1 | 1.1 | 9.3 | 0.2 | 2.2 |
| Case2-1-2 | 9.5 | 0.2 | 2.1 | ||||
| Case2-1-3 | 9.1 | 0.2 | 2.2 | ||||
| θ = 10° | Case3-1-1 | 12.5 | 0.4 | 3.2 | 12.9 | 0.3 | 2.3 |
| Case3-1-2 | 13.0 | 0.1 | 0.8 | ||||
| Case3-1-3 | 13.1 | 0.2 | 1.5 | ||||
| θ = 20° | Case4-1-1 | 16.5 | 0.0 | 0.0 | 16.5 | 1.1 | 6.7 |
| Case4-1-2 | 15.4 | 0.9 | 5.8 | ||||
| Case4-1-3 | 17.5 | 1.0 | 5.7 |
Table 4.
Peak compression stress of granite at different temperatures.
| Temperature (°C) | Test Case | Strength (MPa) | Absolute Deviation (MPa) | Relative Deviation (%) | Mean Value (MPa) | Standard Deviation (MPa) | Coefficient of Variation (%) |
|---|---|---|---|---|---|---|---|
| 25 | Case2-1-1 | 107.2 | 0.9 | 0.8 | 106.3 | 2.4 | 2.3 |
| Case2-1-2 | 108.1 | 1.8 | 1.7 | ||||
| Case2-1-3 | 103.6 | 2.7 | 2.5 | ||||
| 200 | Case2-2-1 | 124.7 | 1.6 | 1.3 | 126.3 | 4.5 | 3.6 |
| Case2-2-2 | 131.4 | 5.1 | 4.0 | ||||
| Case2-2-3 | 122.9 | 3.4 | 2.7 | ||||
| 400 | Case2-3-1 | 117.4 | 2.1 | 1.8 | 115.3 | 2.9 | 2.5 |
| Case2-3-2 | 116.4 | 1.1 | 1.0 | ||||
| Case2-3-3 | 112.0 | 3.3 | 2.9 | ||||
| 600 | Case2-4-1 | 84.8 | 0.8 | 0.9 | 85.6 | 2.6 | 3.0 |
| Case2-4-2 | 83.4 | 2.2 | 2.6 | ||||
| Case2-4-3 | 88.5 | 2.9 | 3.4 | ||||
| 800 | Case2-5-1 | 39.4 | 1.2 | 3.1 | 38.2 | 3.4 | 8.9 |
| Case2-5-2 | 40.9 | 2.7 | 7.1 | ||||
| Case2-5-3 | 34.4 | 3.8 | 9.9 |
Table 5.
Elastic modulus of granite specimens at different temperatures.
| Temperature (°C) | Test Case | Elastic Modulus (GPa) | Absolute Deviation (GPa) | Relative Deviation (%) | Mean Value (GPa) | Standard Deviation (GPa) | Coefficient of Variation (%) |
|---|---|---|---|---|---|---|---|
| 25 | Case2-1-1 | 12.5 | 1.4 | 12.6 | 11.1 | 1.3 | 11.7 |
| Case2-1-2 | 9.9 | 1.2 | 10.8 | ||||
| Case2-1-3 | 10.8 | 0.3 | 2.7 | ||||
| 200 | Case2-2-1 | 11.5 | 1.2 | 9.4 | 12.7 | 1.1 | 8.7 |
| Case2-2-2 | 13.0 | 0.3 | 2.4 | ||||
| Case2-2-3 | 13.6 | 0.9 | 7.1 | ||||
| 400 | Case2-3-1 | 12.5 | 0.7 | 5.9 | 11.8 | 1.0 | 8.5 |
| Case2-3-2 | 12.3 | 0.5 | 4.2 | ||||
| Case2-3-3 | 10.7 | 1.1 | 9.3 | ||||
| 600 | Case2-4-1 | 9.2 | 0.7 | 8.2 | 8.5 | 0.8 | 9.4 |
| Case2-4-2 | 8.7 | 0.2 | 2.4 | ||||
| Case2-4-3 | 7.7 | 0.8 | 9.4 | ||||
| 800 | Case2-5-1 | 3.2 | 0.2 | 6.7 | 3.0 | 0.5 | 16.7 |
| Case2-5-2 | 3.3 | 0.3 | 10.0 | ||||
| Case2-5-3 | 2.4 | 0.6 | 20.0 |
Table 6.
Peak shear stress of granite at different temperatures.
| Temperature ( °C) | Test Case | Strength (MPa) | Absolute Deviation (MPa) | Relative Deviation (%) | Mean Value (MPa) | Standard Deviation (MPa) | Coefficient of Variation (%) |
|---|---|---|---|---|---|---|---|
| 25 | Case2-1-1 | 9.4 | 0.1 | 0.8 | 9.3 | 0.2 | 2.2 |
| Case2-1-2 | 9.5 | 0.2 | 1.7 | ||||
| Case2-1-3 | 9.1 | 0.2 | 2.5 | ||||
| 200 | Case2-2-1 | 10.9 | 0.2 | 1.7 | 11.1 | 0.4 | 3.5 |
| Case2-2-2 | 11.5 | 0.4 | 3.6 | ||||
| Case2-2-3 | 10.8 | 0.3 | 3.1 | ||||
| 400 | Case2-3-1 | 10.3 | 0.2 | 1.7 | 10.1 | 0.3 | 2.5 |
| Case2-3-2 | 10.2 | 0.1 | 0.8 | ||||
| Case2-3-3 | 9.8 | 0.3 | 3.0 | ||||
| 600 | Case2-4-1 | 7.4 | 0.1 | 1.1 | 7.5 | 0.2 | 3.1 |
| Case2-4-2 | 7.3 | 0.2 | 2.7 | ||||
| Case2-4-3 | 7.7 | 0.2 | 3.2 | ||||
| 800 | Case2-5-1 | 3.4 | 0.1 | 4.5 | 3.3 | 0.3 | 8.9 |
| Case2-5-2 | 3.6 | 0.3 | 8.4 | ||||
| Case2-5-3 | 3.0 | 0.3 | 8.8 |
Table 7.
σCI and total cumulative AE count at T = 25 °C considering different inclination angles.
| Inclination angle (°) | 0 | 5 | 10 | 20 |
|---|---|---|---|---|
| σCI (MPa) | 58.08 | 49.5 | 30.57 | 24.9 |
| Total cumulative AE count (×10,000) | 48.87 | 39.96 | 18.94 | 13.93 |
| Shear stress at σCI point (MPa) | 0 | 4.33 | 5.31 | 9.06 |
Table 8.
σCI and total cumulative AE count at T = 5° inclination considering different temperatures.
Table 8.
σCI and total cumulative AE count at T = 5° inclination considering different temperatures.
| Temperature (°C) | 200 | 400 | 600 | 800 |
|---|---|---|---|---|
| σCI (MPa) | 53.60 | 51.19 | 35.27 | 3.98 |
| Total cumulative AE count (×10,000) | 50.87 | 43.39 | 17.29 | 5.90 |
| Shear stress at σCI point (MPa) | 4.70 | 4.48 | 3.09 | 0.35 |
© 2020 by the authors. Licensee MDPI, Basel, Switzerland. This article is an open access article distributed under the terms and conditions of the Creative Commons Attribution (CC BY) license (http://creativecommons.org/licenses/by/4.0/).
Share and Cite
MDPI and ACS Style
Chen, L.; Mao, X.; Wu, P. Effect of High Temperature and Inclination Angle on Mechanical Properties and Fracture Behavior of Granite at Low Strain Rate. Sustainability 2020, 12, 1255. https://0-doi-org.brum.beds.ac.uk/10.3390/su12031255
AMA Style
Chen L, Mao X, Wu P. Effect of High Temperature and Inclination Angle on Mechanical Properties and Fracture Behavior of Granite at Low Strain Rate. Sustainability. 2020; 12(3):1255. https://0-doi-org.brum.beds.ac.uk/10.3390/su12031255
Chicago/Turabian StyleChen, Liang, Xianbiao Mao, and Peng Wu. 2020. "Effect of High Temperature and Inclination Angle on Mechanical Properties and Fracture Behavior of Granite at Low Strain Rate" Sustainability 12, no. 3: 1255. https://0-doi-org.brum.beds.ac.uk/10.3390/su12031255
Note that from the first issue of 2016, this journal uses article numbers instead of page numbers. See further details here.