Simultaneous Removal of Residual Sulfate and Heavy Metals from Spent Electrolyte of Lead-Acid Battery after Precipitation and Carbonation


Abstract
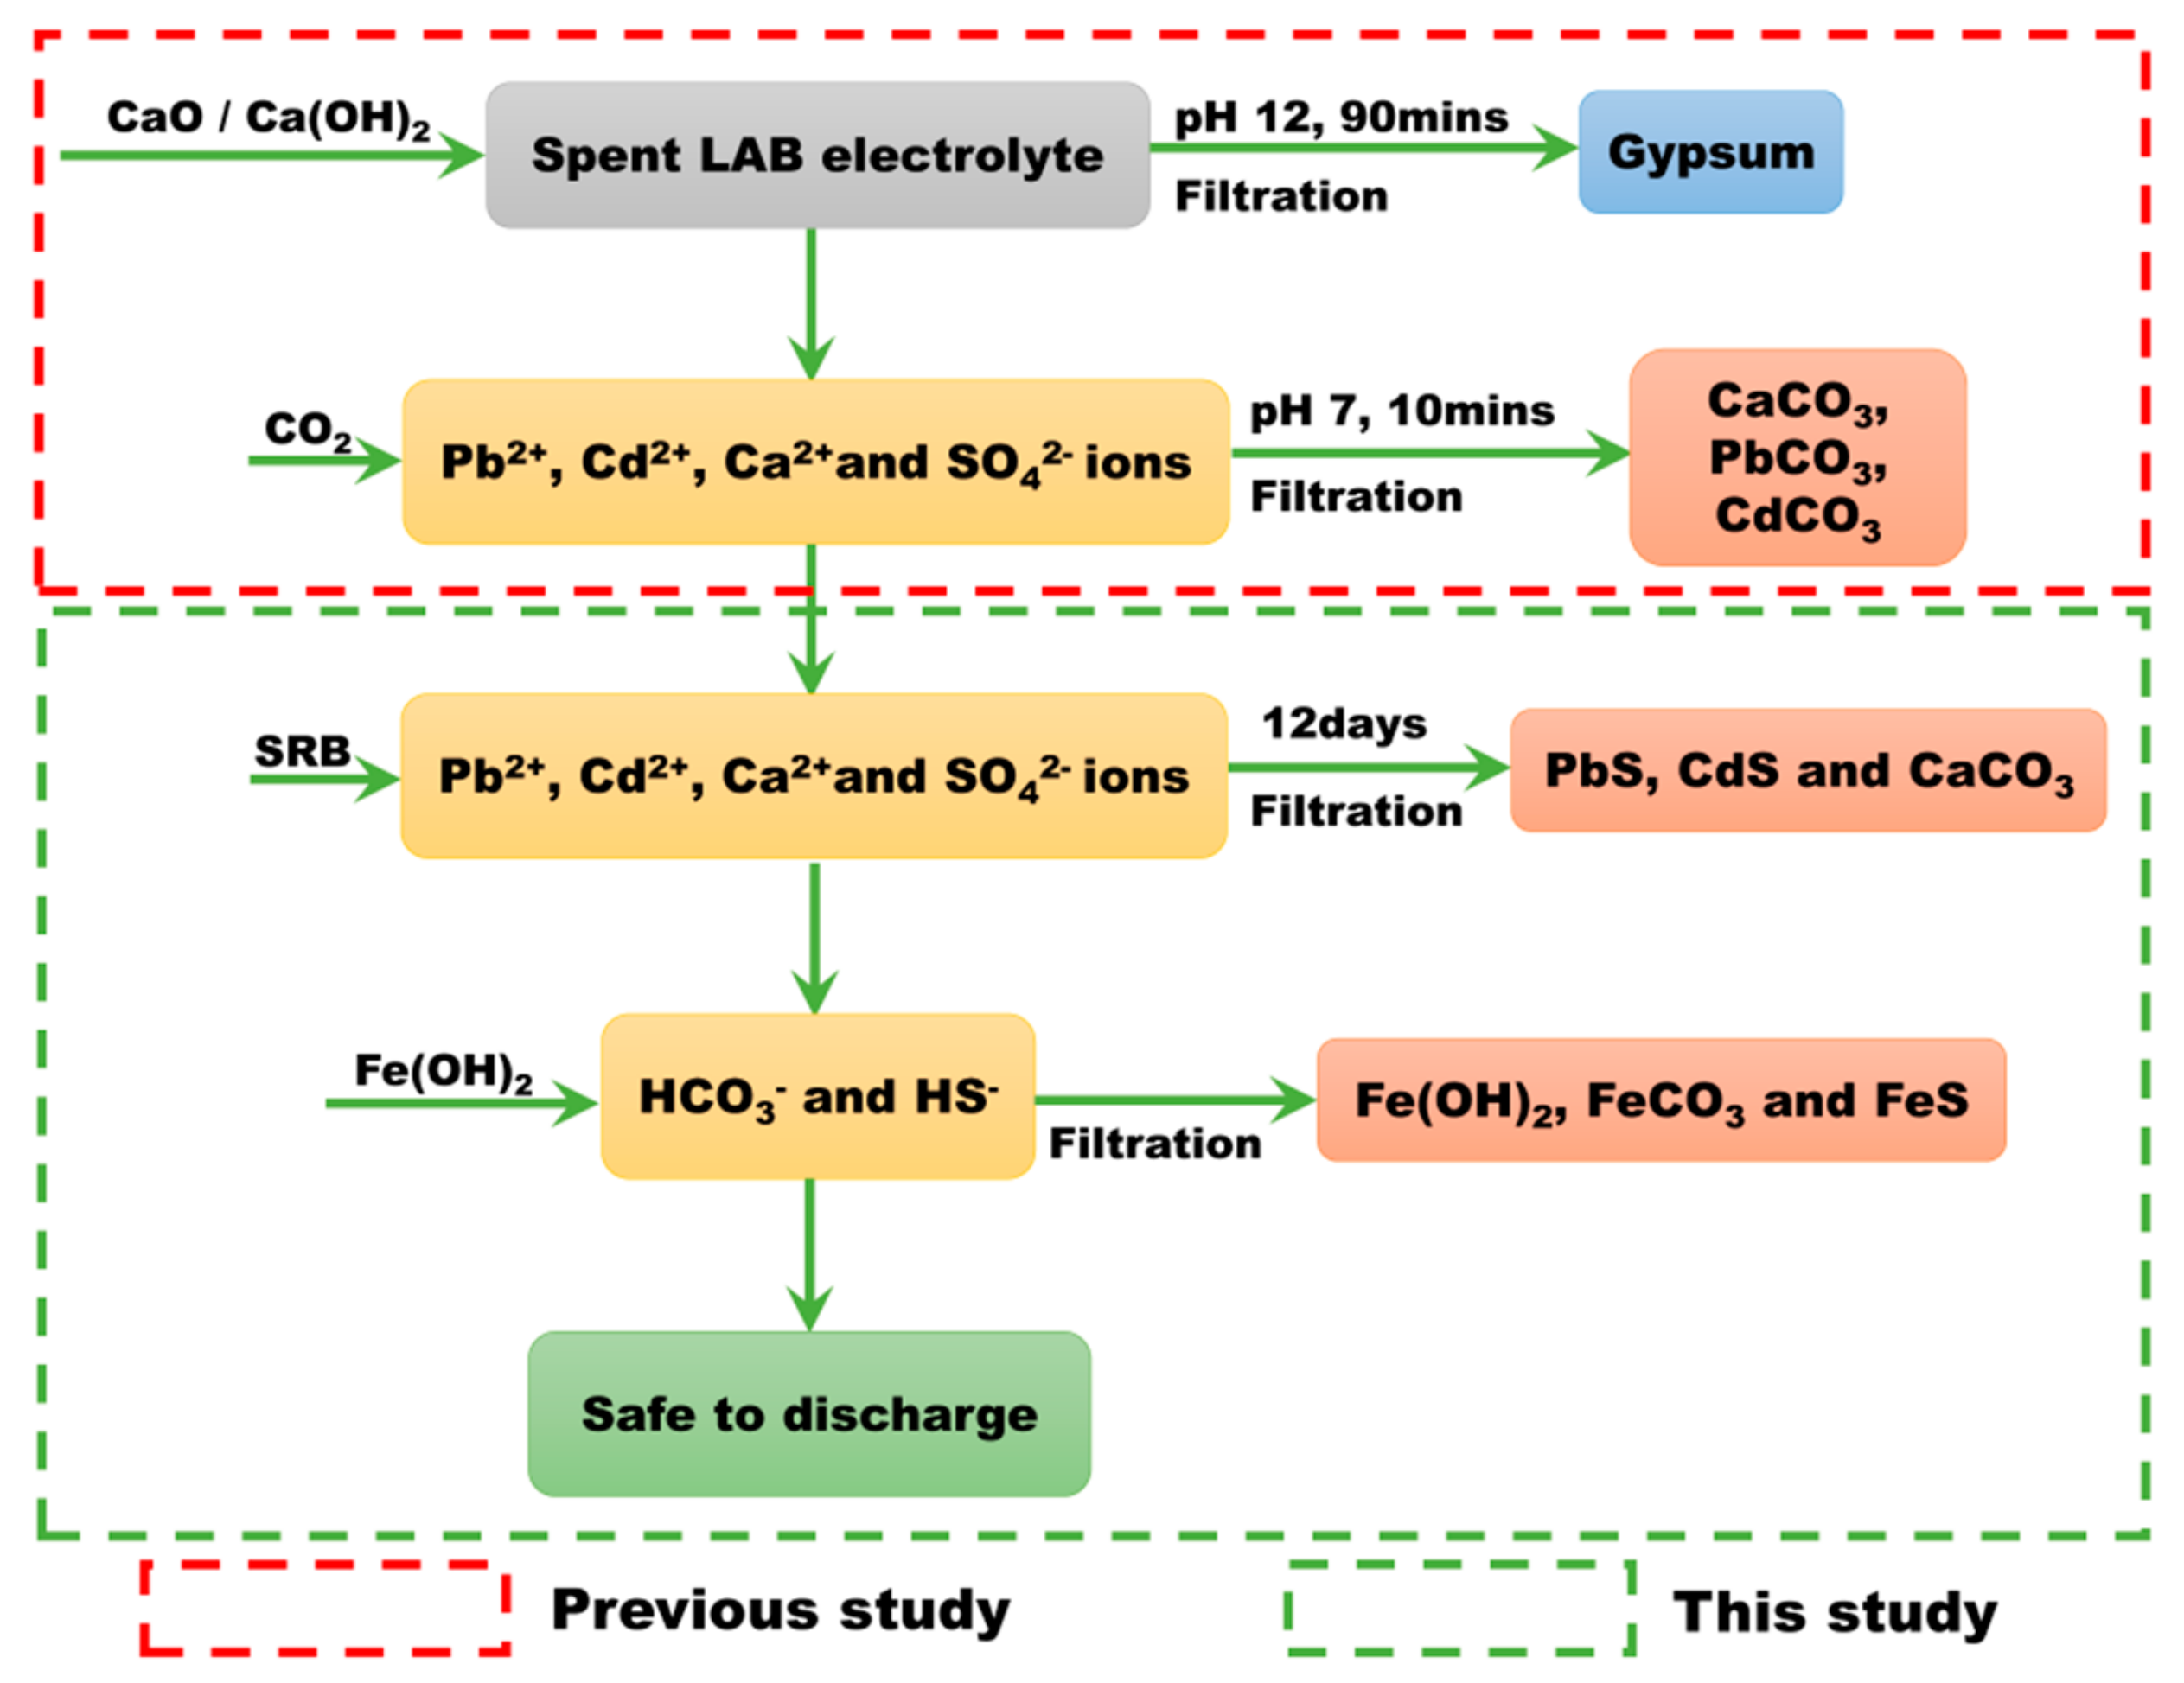
:1. Introduction
2. Materials and Methods
2.1. Materials
2.2. Methods
3. Results and Discussion
3.1. Sulfate Reduction and Heavy Metal Removal
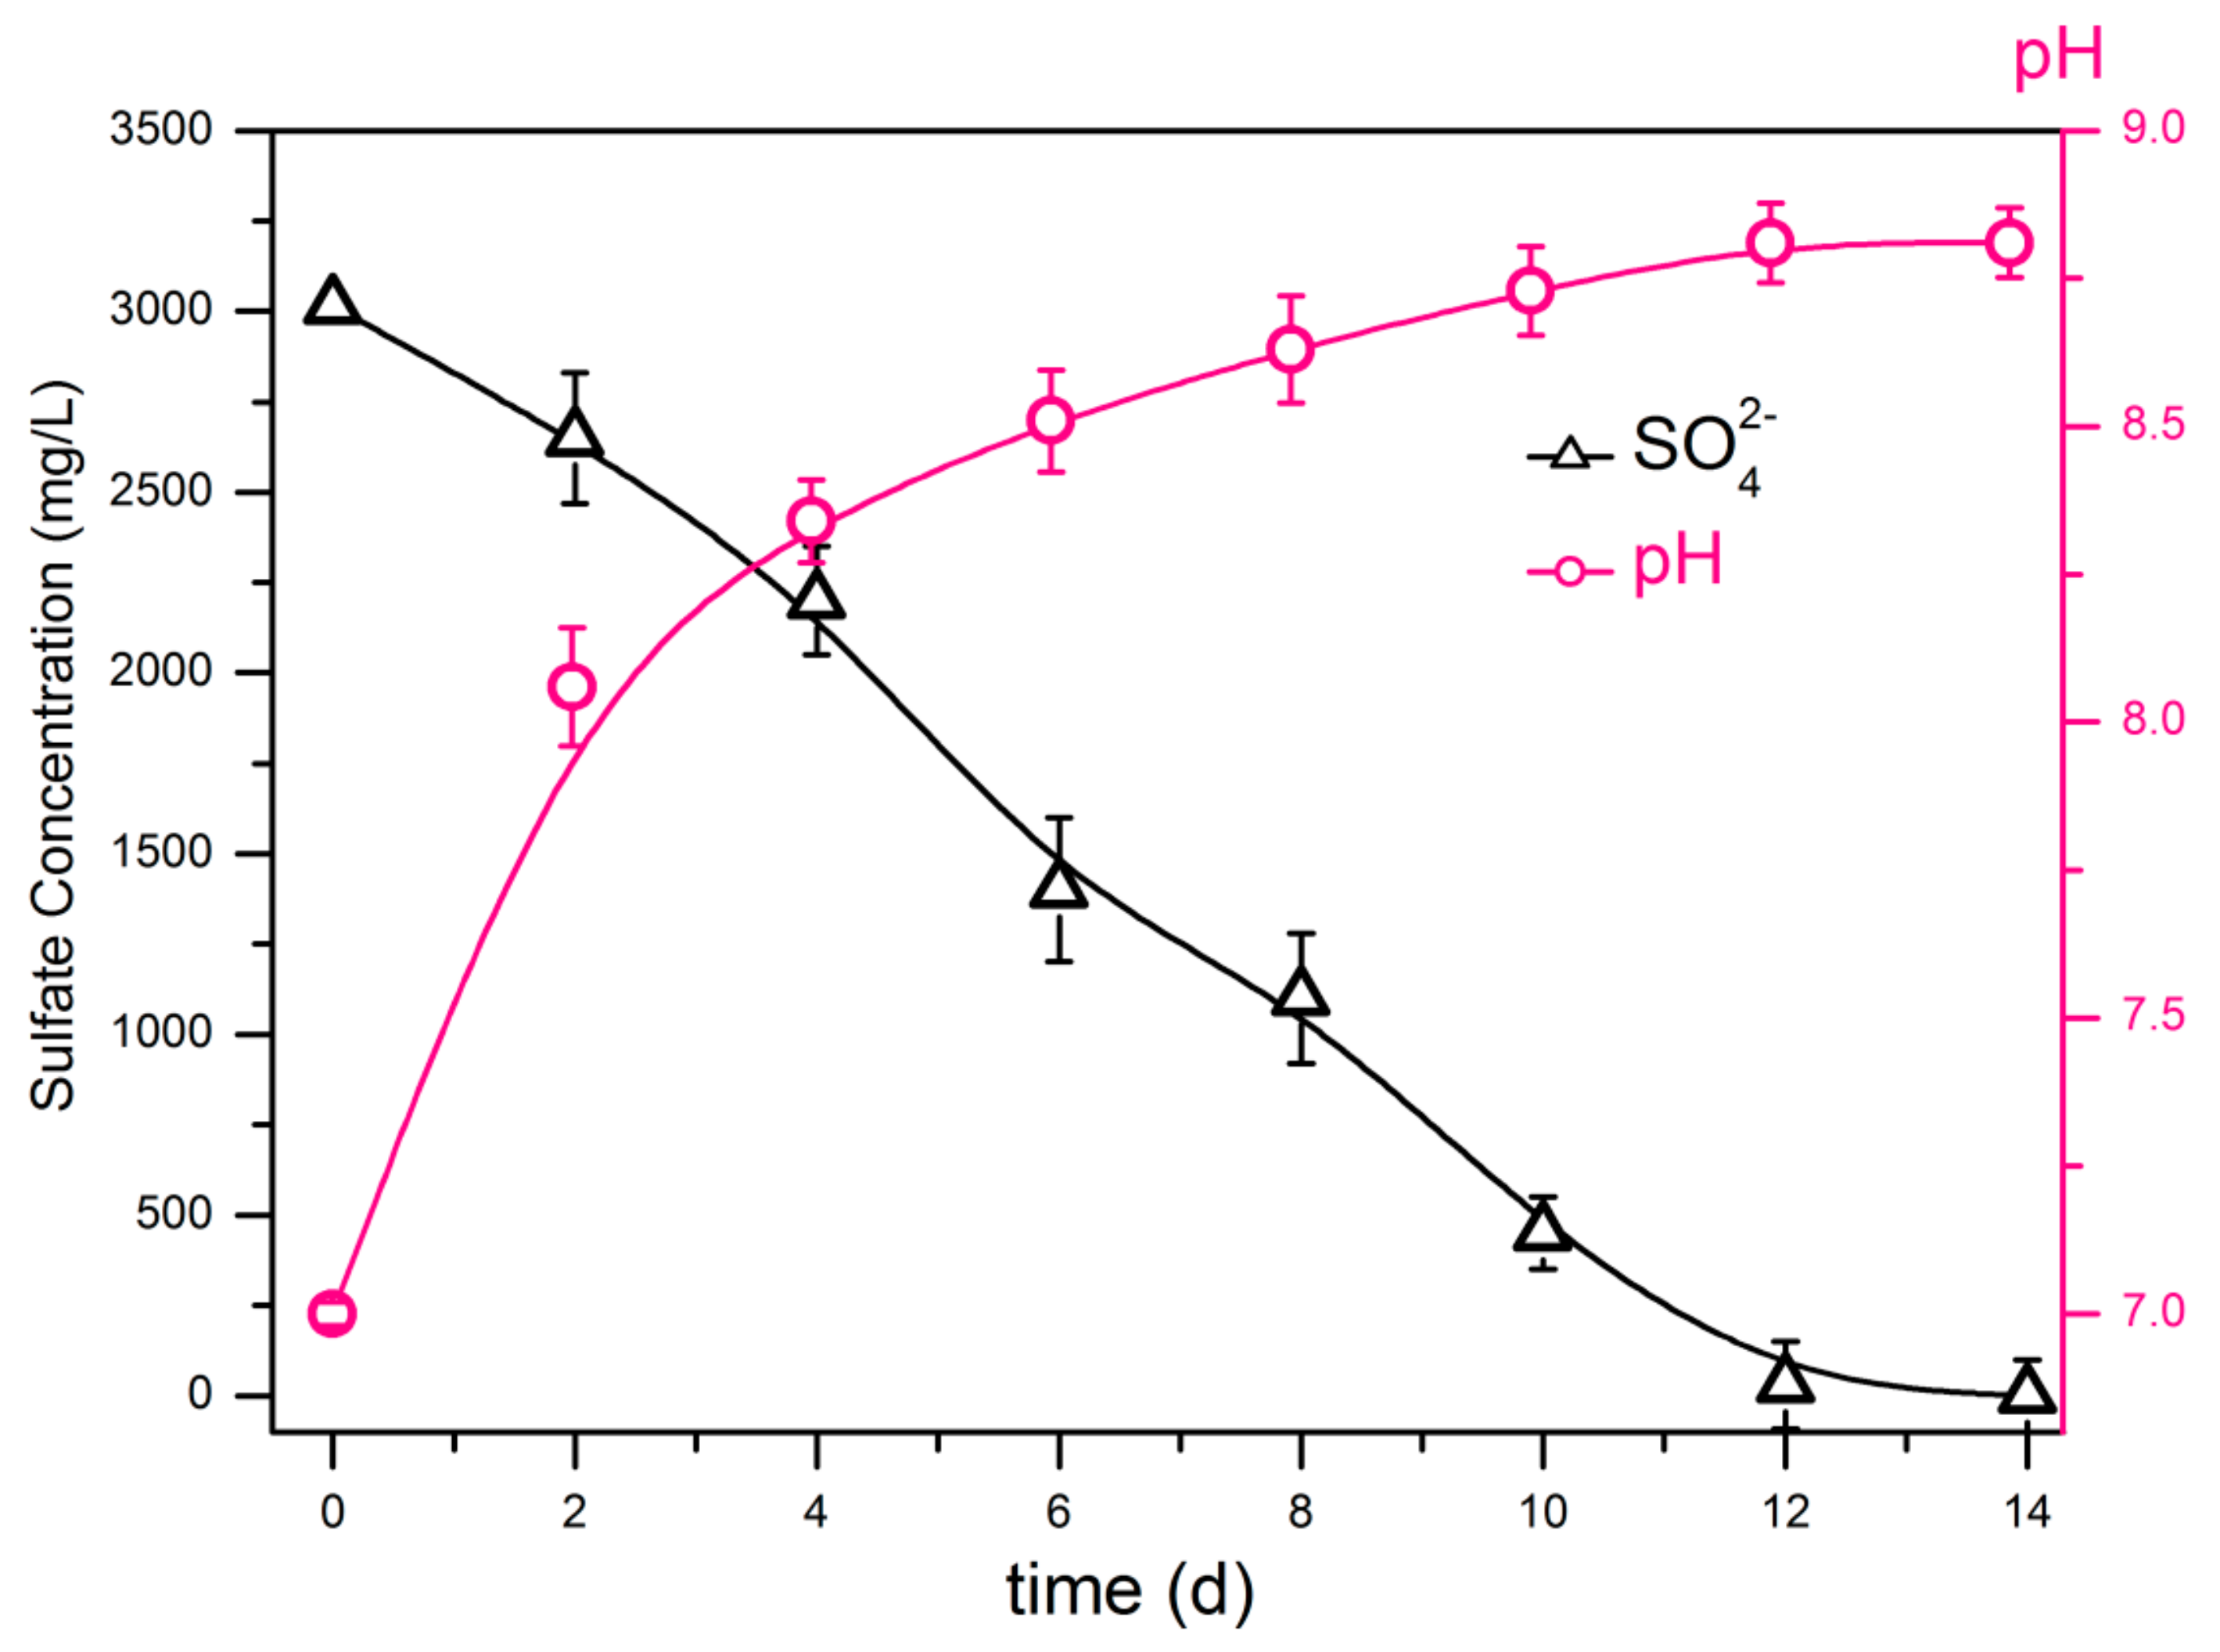
3.1.1. Sulfate Reduction with SRB
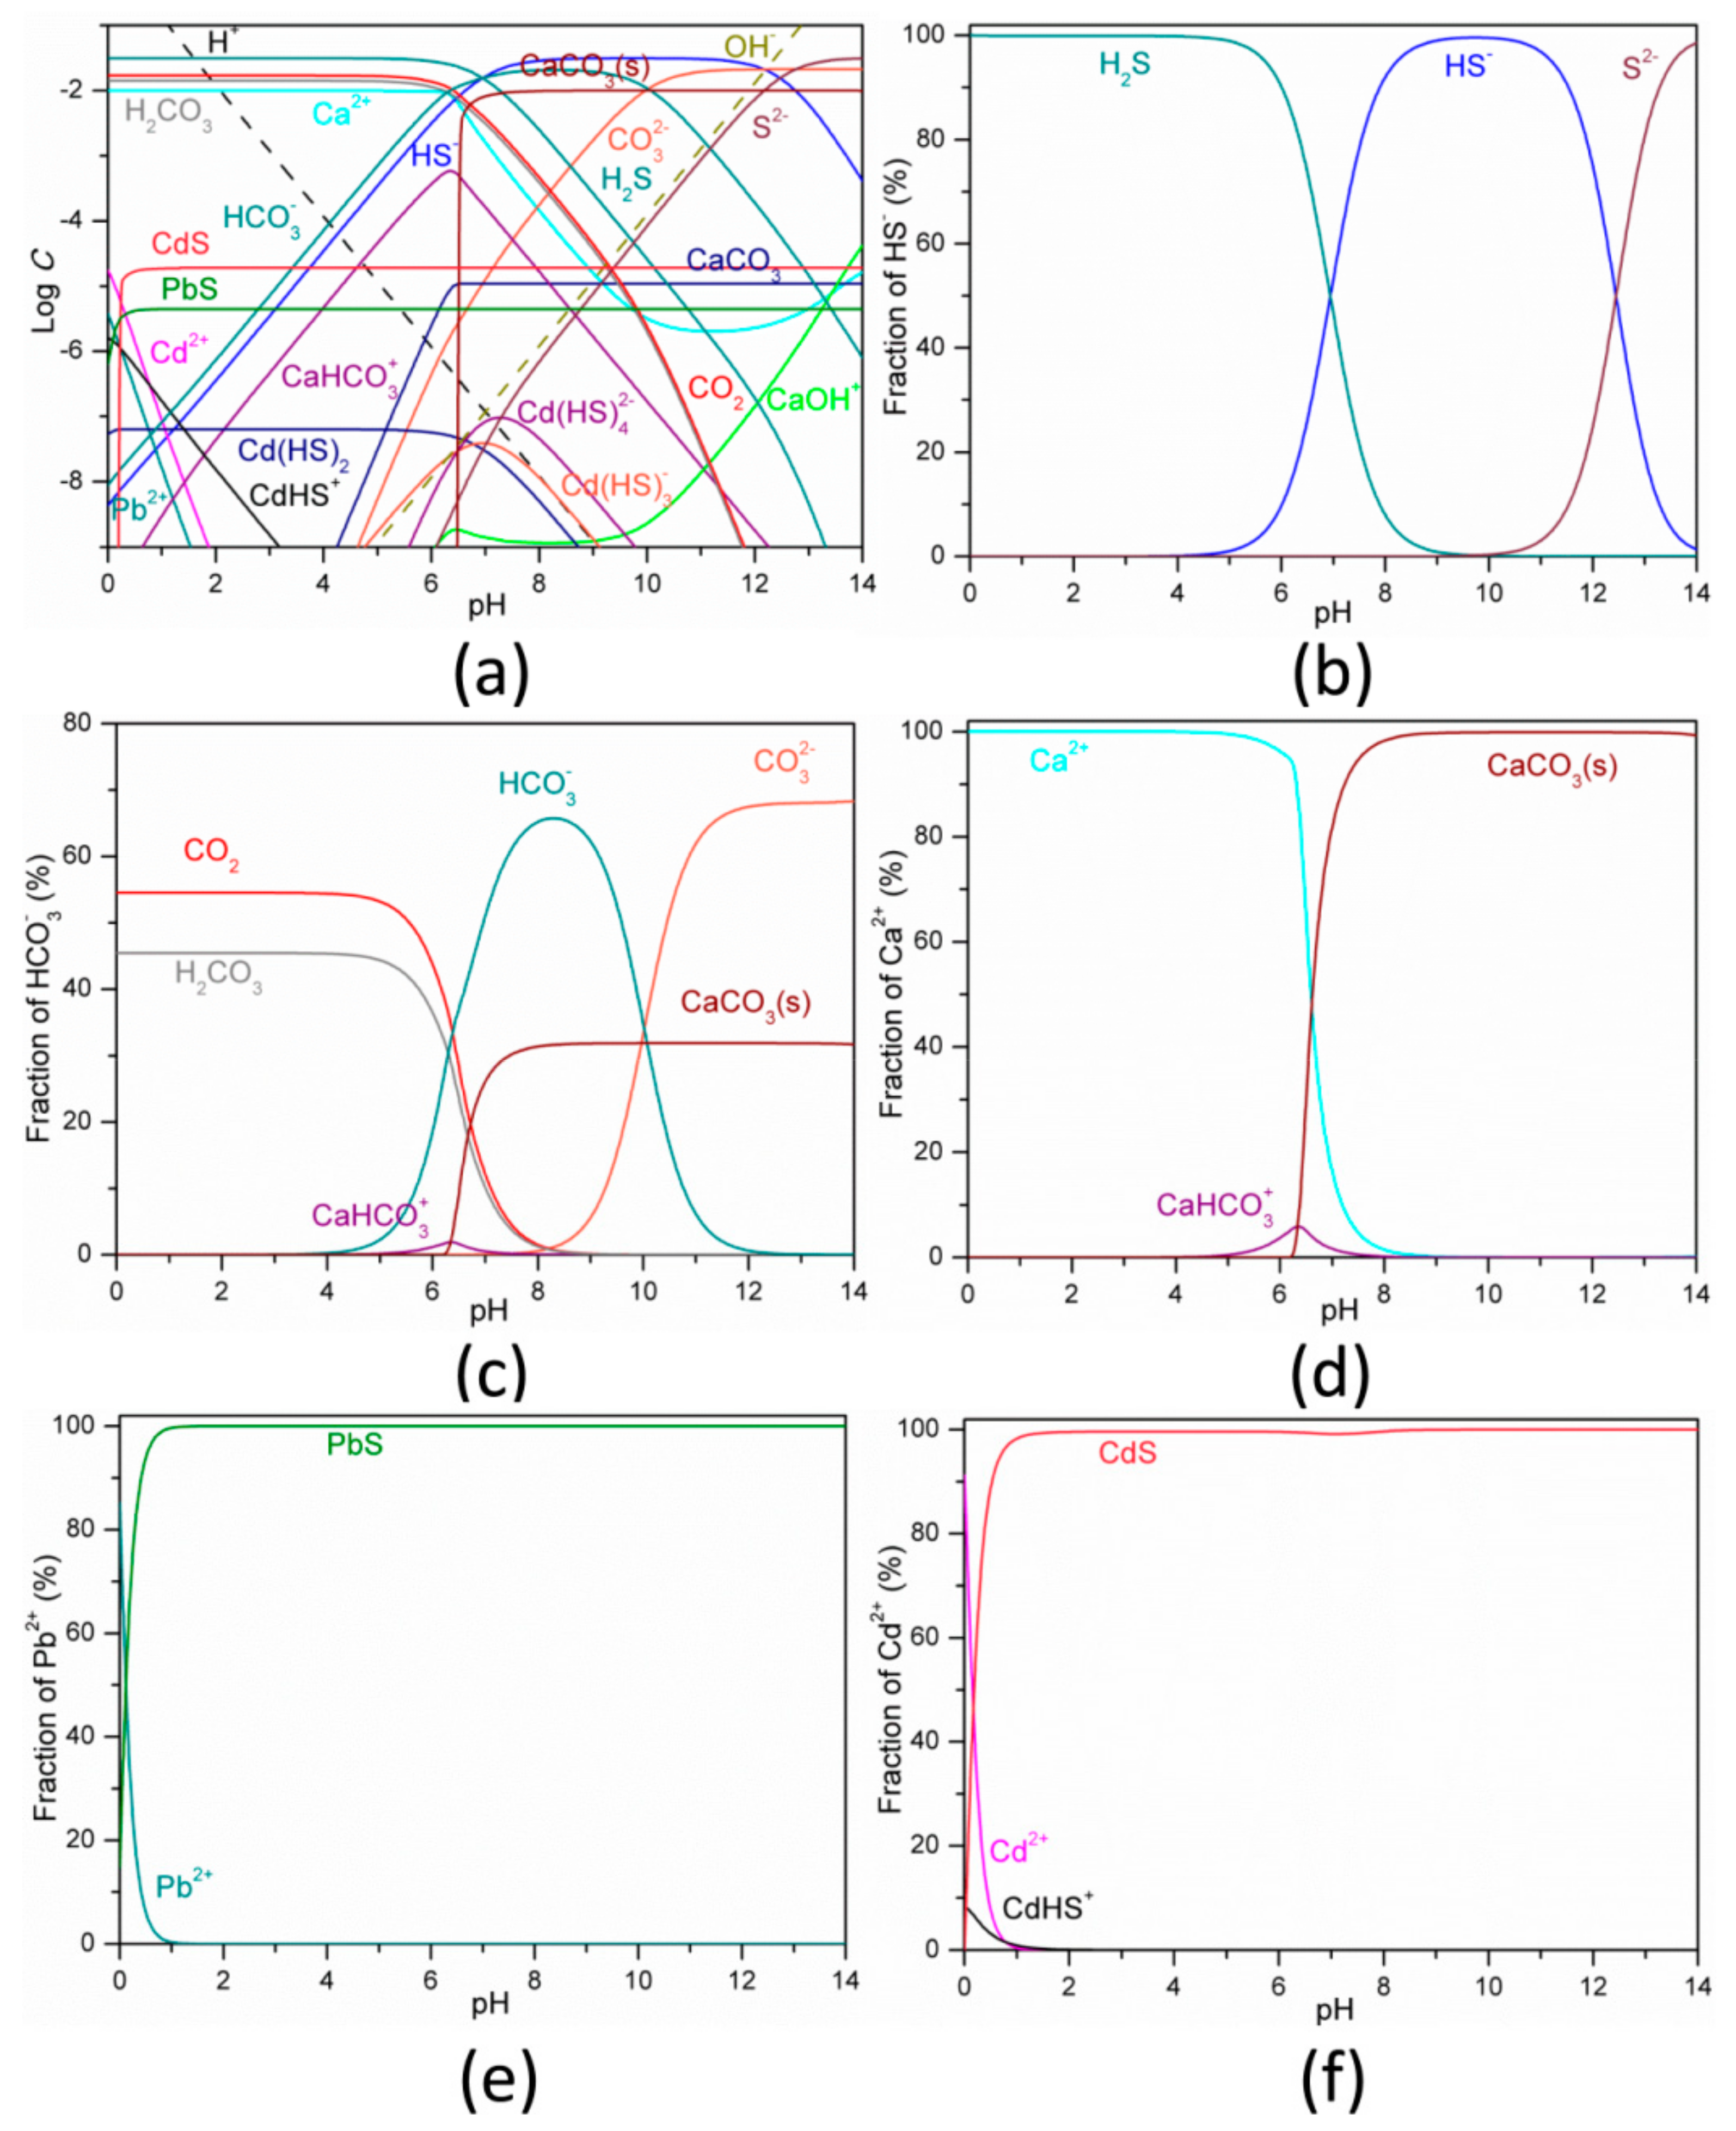
3.1.2. Pd2+, Cd2+ and Ca2+ Removal
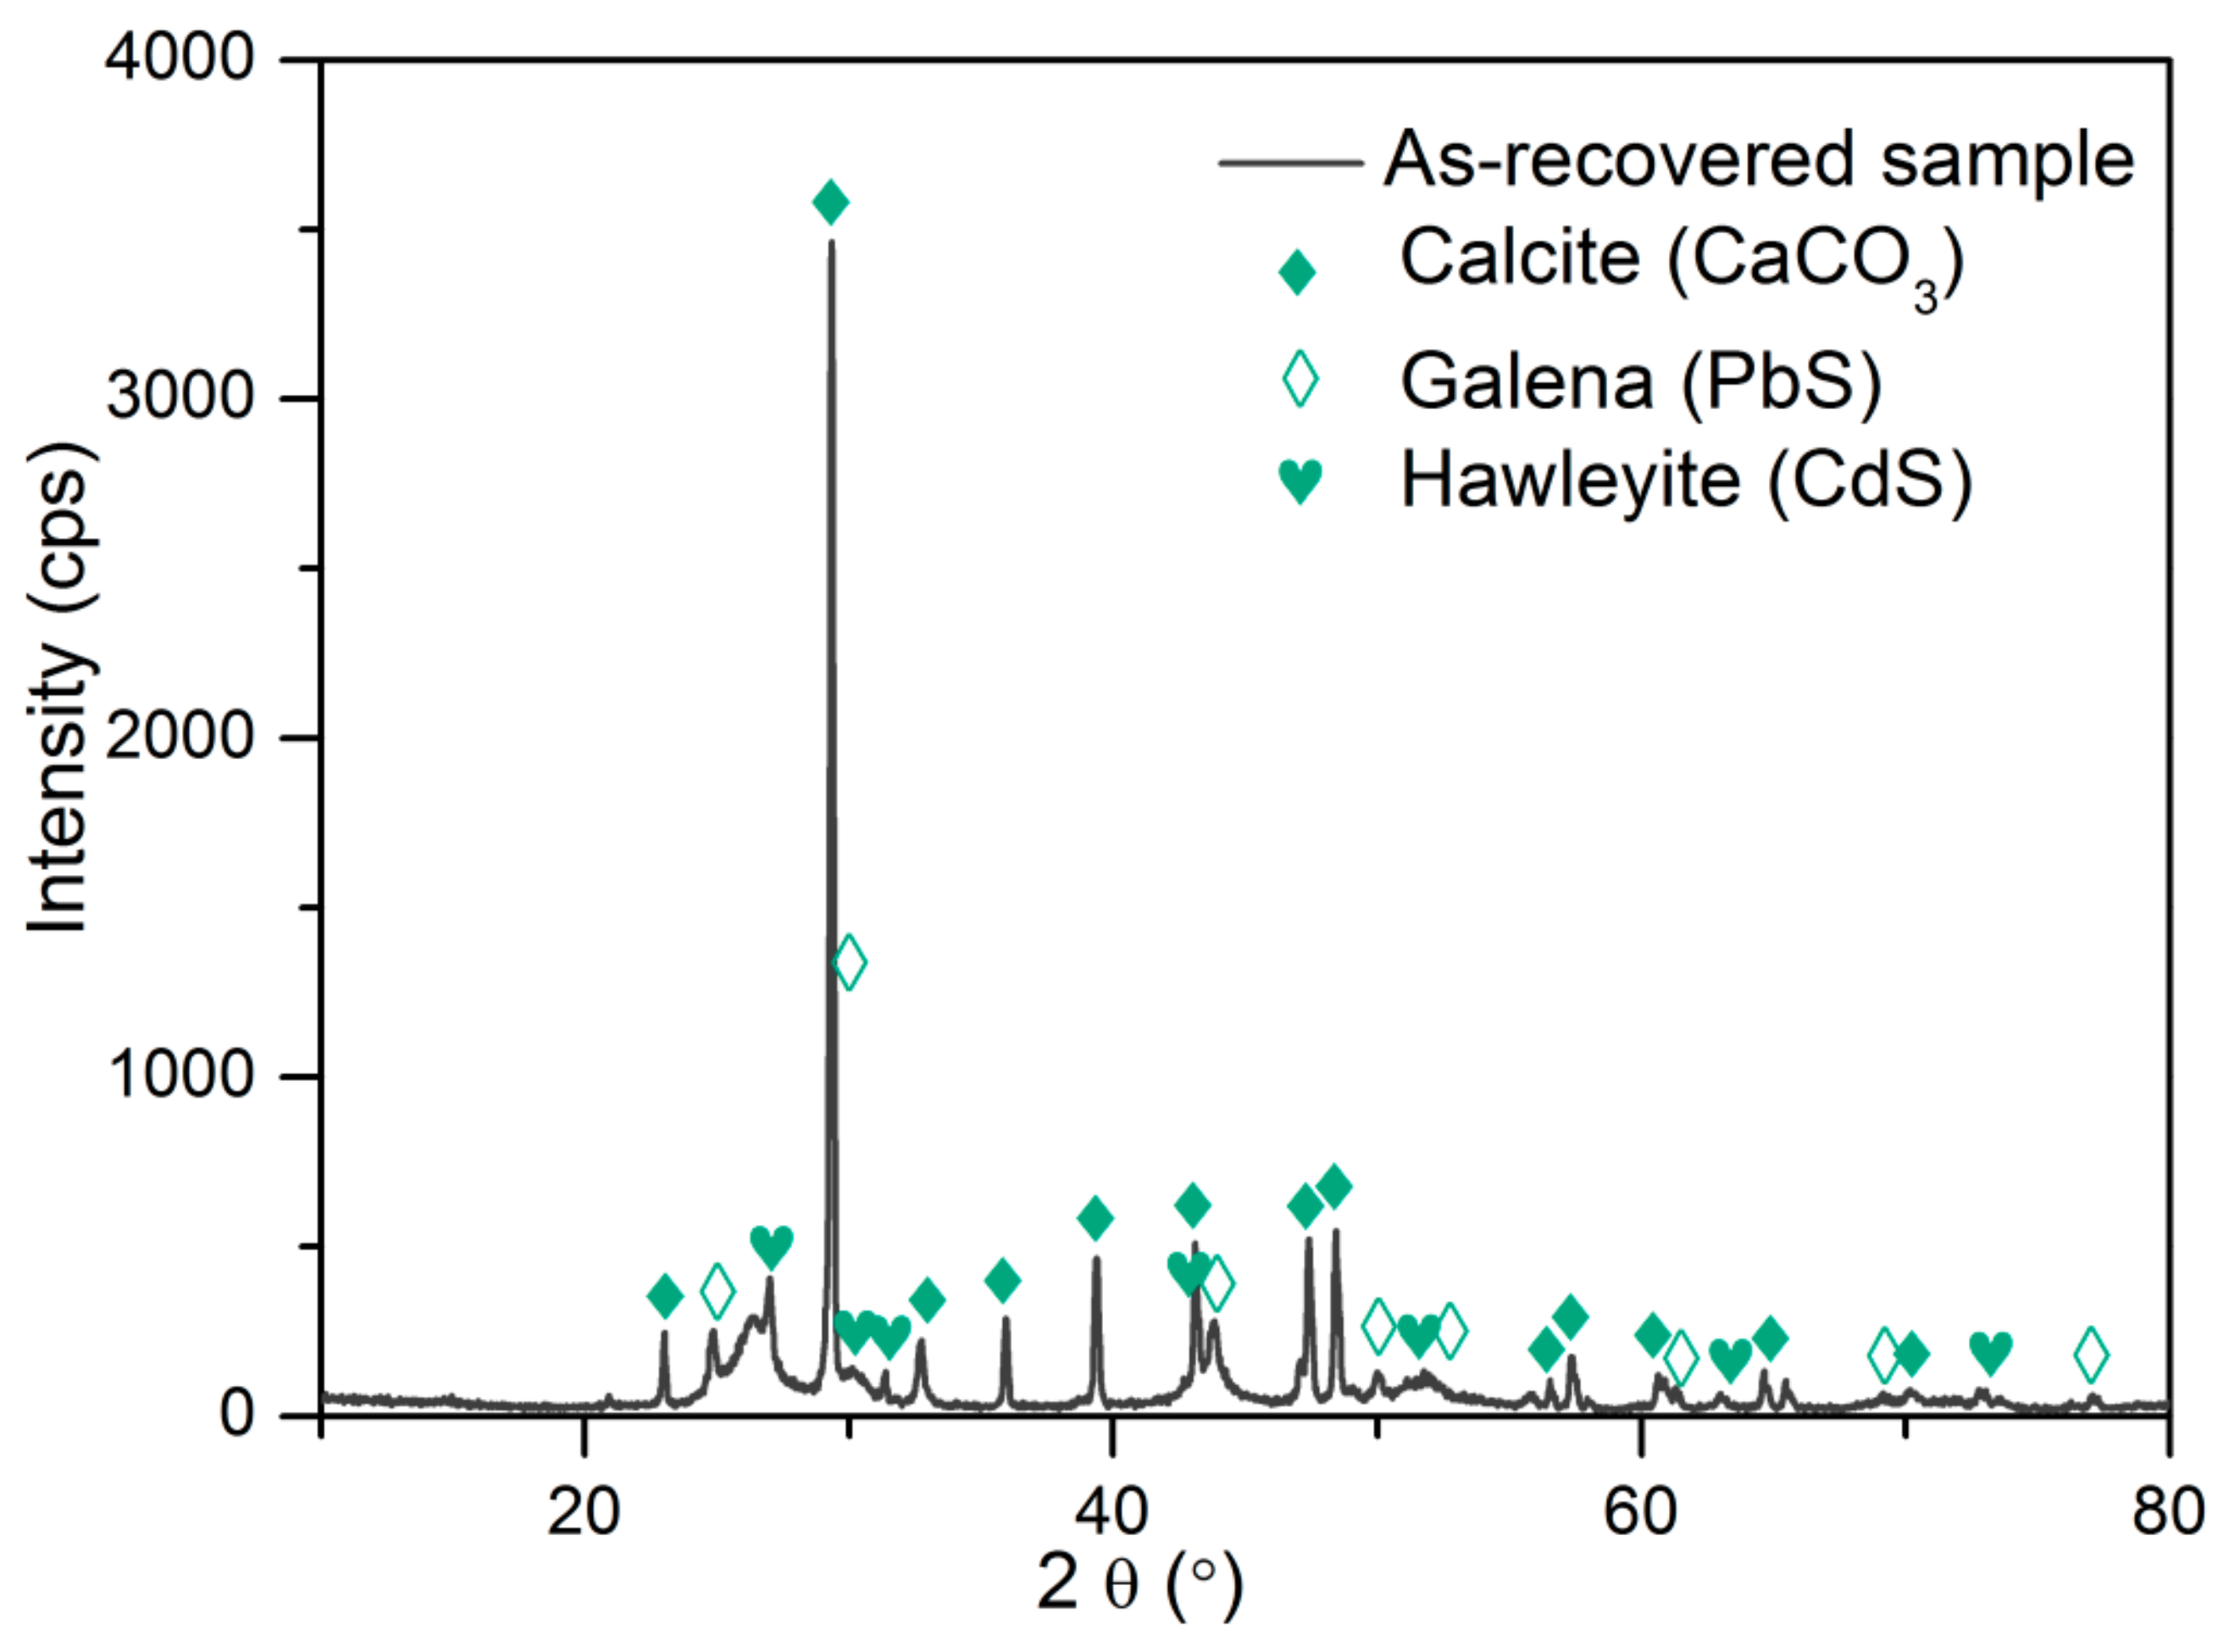
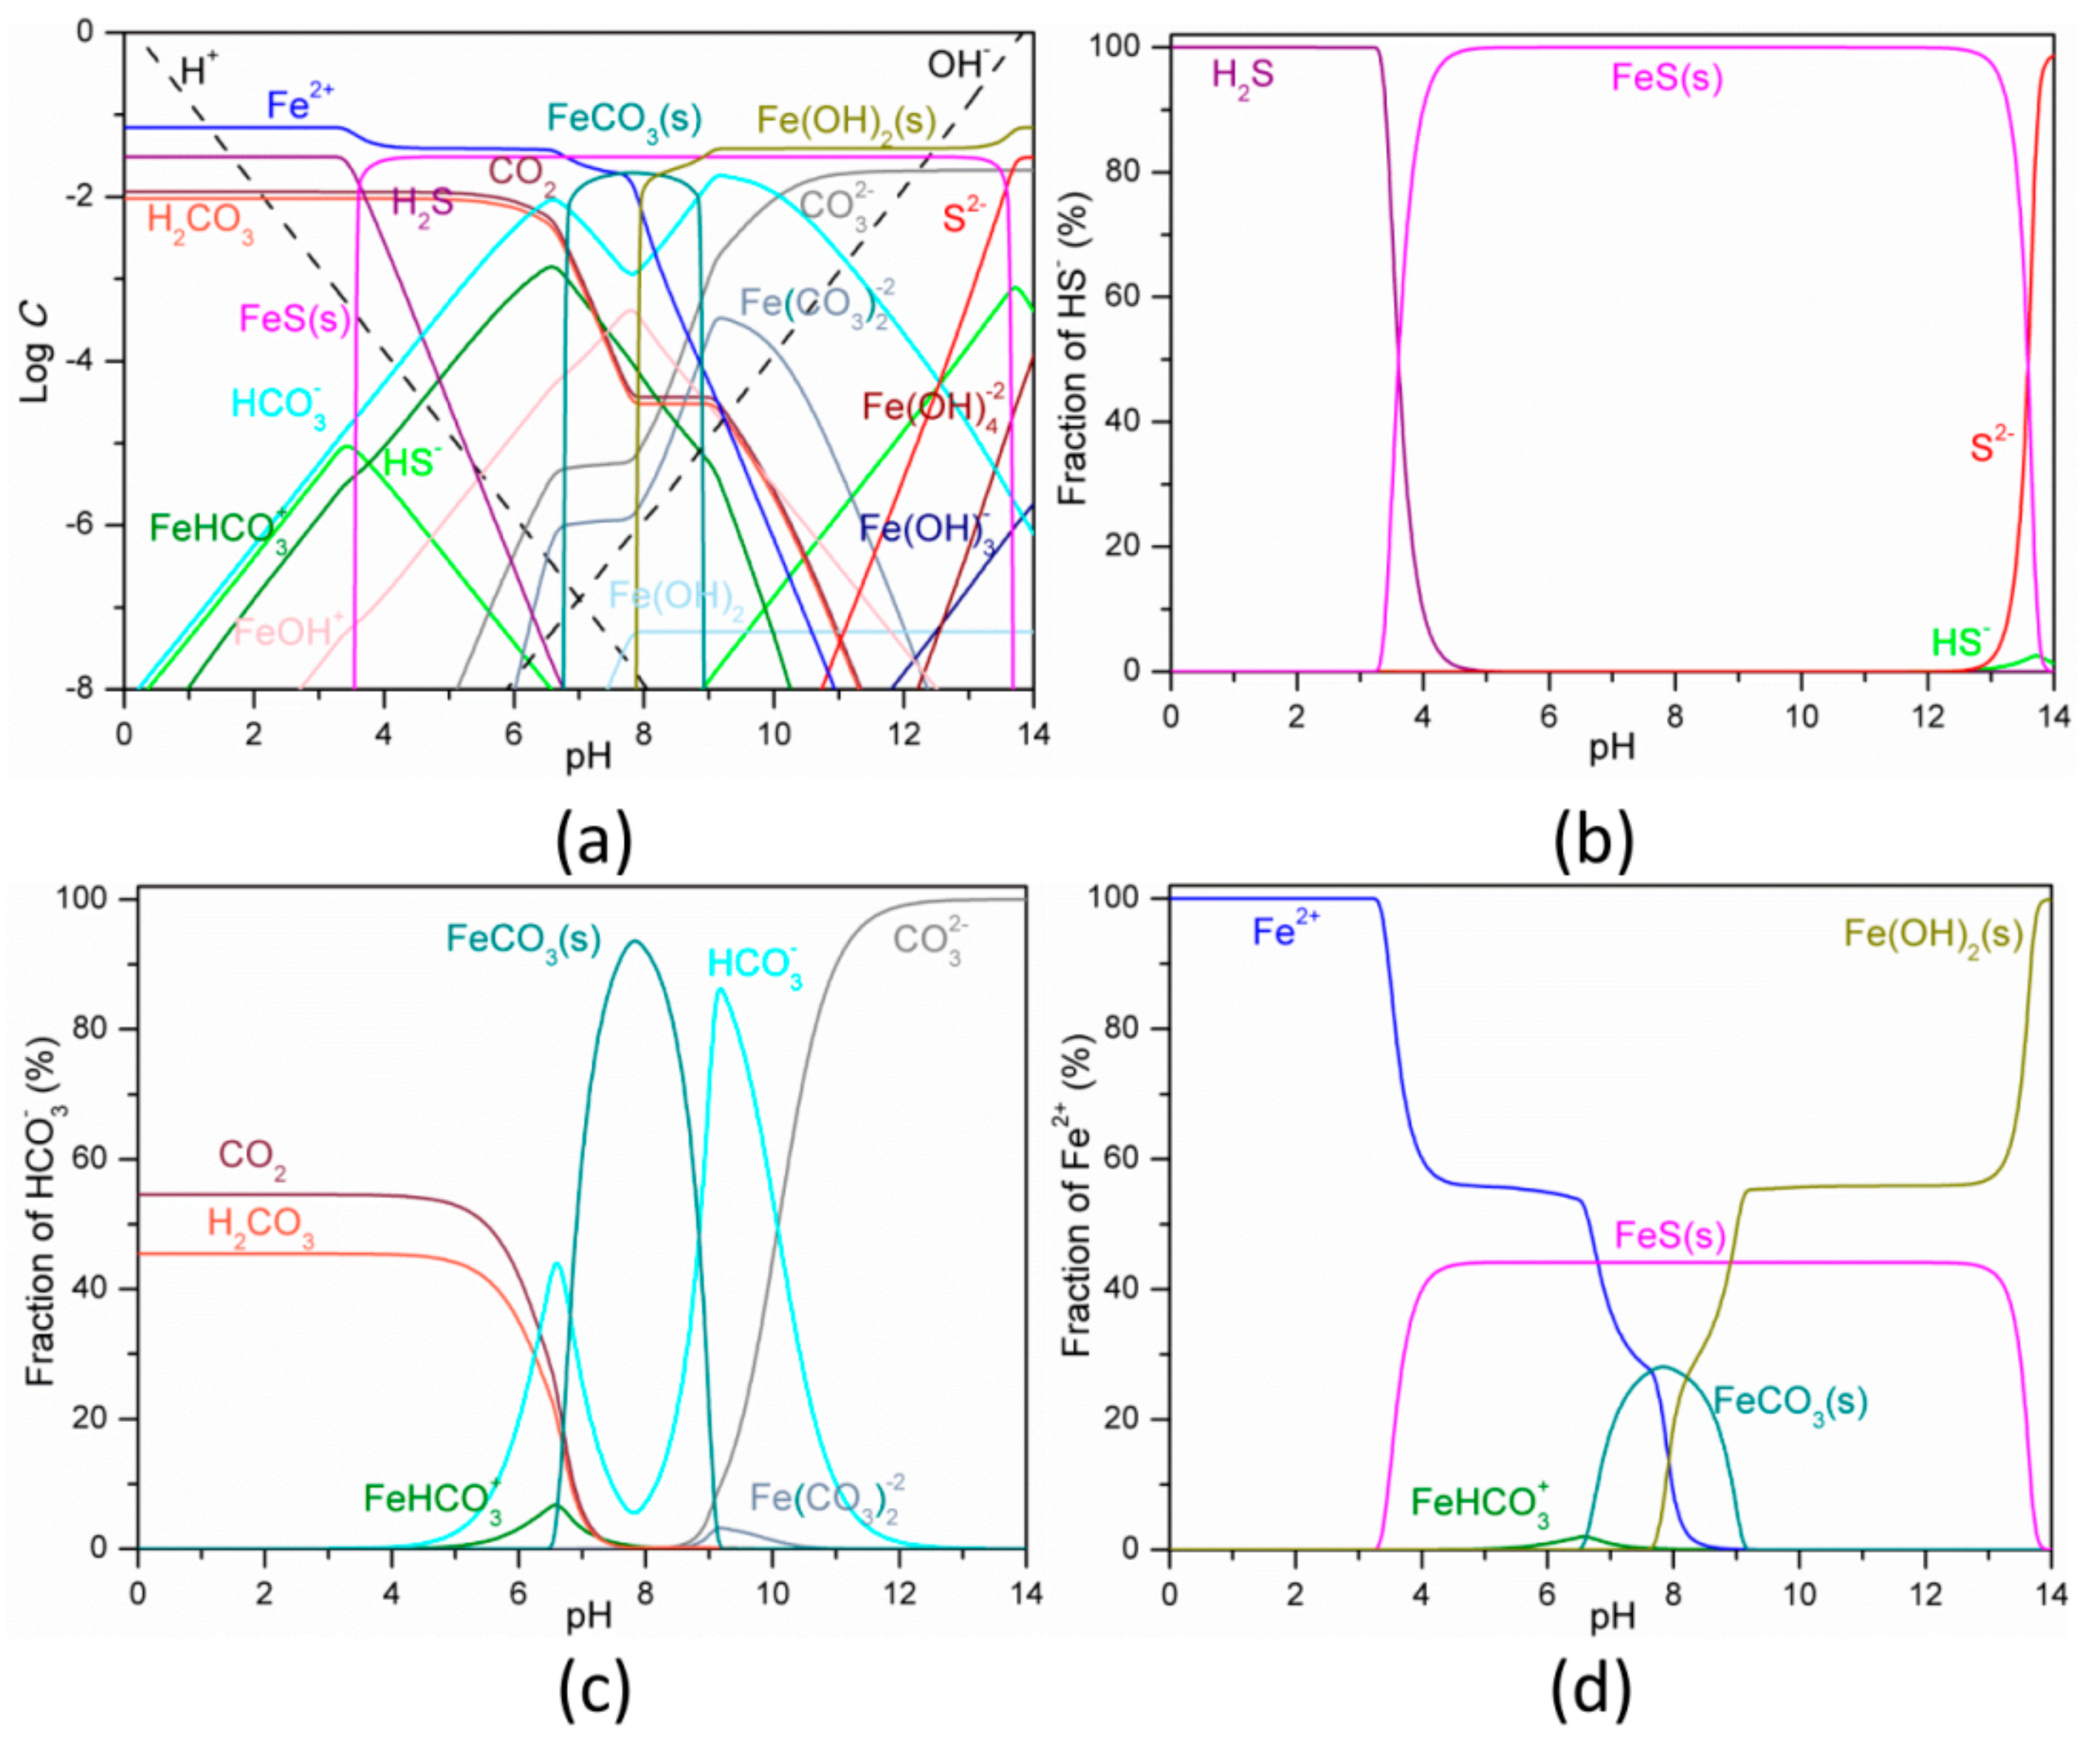
3.2. Sulfide Precipitation
4. Conclusions
Supplementary Materials
Author Contributions
Funding
Conflicts of Interest
References
- Dufo-Lopez, R.; Lujano-Rojas, J.M.; Bernal-Agustin, J.L. Comparison of different lead–acid battery lifetime prediction models for use in simulation of stand-alone photovoltaic systems. Appl. Energ. 2014, 115, 242–253. [Google Scholar] [CrossRef]
- Joerissen, L.; Garche, J.; Fabjan, C.; Tomazic, G. Possible use of vanadium redox-flow batteries for energy storage in small grids and stand-alone photovoltaic systems. J. Power Sour. 2004, 127, 98–104. [Google Scholar] [CrossRef]
- Hua, S.; Zhou, Q.; Kong, D.; Ma, J. Application of valve-regulated lead-acid batteries for storage of solar electricity in stand-alone photovoltaic systems in the northwest areas of China. J. Power Sour. 2006, 158, 1178–1185. [Google Scholar] [CrossRef]
- Bhangu, B.S.; Bentley, P.; Sone, D.A.; Bingham, C.M. Nonlinear observers for predicting state-of-charge and state-of-health of lead-acid batteries for hybrid-electric vehicles. IEEE Trans. Veh. Technol. 2005, 54, 783–794. [Google Scholar] [CrossRef] [Green Version]
- Pesaran, A.A. Battery thermal models for hybrid vehicle simulations. J. Power Sour. 2002, 110, 377–382. [Google Scholar] [CrossRef]
- Rydh, C.J. Environmental assessment of vanadium redox and lead-acid batteries for stationary energy storage. J. Power Sour. 1999, 80, 21–29. [Google Scholar] [CrossRef]
- Parker, C.D. Lead-acid battery energy-storage systems for electricity supply networks. J. Power Sour. 2001, 100, 18–28. [Google Scholar] [CrossRef]
- Yin, Y.; Liu, C.; Fan, S. Hybrid energy storage devices combining carbon-nanotube/polyaniline supercapacitor with lead-acid battery assembled through a “directly-inserted” method. RSC Adv. 2014, 4, 26378–26382. [Google Scholar] [CrossRef]
- Sun, Z.; Cao, H.; Zhang, X.; Lin, X.; Zheng, W.; Cao, G.; Sun, Y.; Zhang, Y. Spent lead-acid battery recycling in China-A review and sustainable analyses on mass flow of lead. Waste Manag. 2017, 64, 190–201. [Google Scholar] [CrossRef]
- Zabaniotou, A.; Kouskoumvekaki, E.; Sanopoulos, D. Recycling of spent lead/acid batteries: the case of Greece. Resour. Conserv. Recy. 1999, 25, 301–317. [Google Scholar] [CrossRef]
- Ma, Y.; Qiu, K. Recovery of lead from lead paste in spent lead acid battery by hydrometallurgical desulfurization and vacuum thermal reduction. Waste Manag. 2015, 40, 151–156. [Google Scholar] [CrossRef] [PubMed]
- Jolly, R.; Rhin, C. The recycling of lead-acid batteries: production of lead and polypropylene. Resour. Conserv. Recy. 1994, 10, 137–143. [Google Scholar] [CrossRef]
- Sonmez, M.S.; Kumar, R.V. Leaching of waste battery paste components. Part 2: Leaching and desulphurization of PbSO4 by citric acid and sodium citrate solution. Hydrometallurgy 2009, 95, 82–86. [Google Scholar] [CrossRef]
- Zhu, X.; Yang, J.; Gao, L.; Liu, J.; Yang, D.; Sun, X.; Zhang, W.; Wang, Q.; Li, L.; He, D.; et al. Preparation of lead carbonate from spent lead paste via chemical conversion. Hydrometallurgy 2013, 134–135, 47–53. [Google Scholar] [CrossRef]
- Gu, S.; Fu, b.; Fujita, T.; Ahn, J.W. Thermodynamic simulations for determining the recycling path of a spent lead-acid battery electrolyte sample with Ca(OH)2. Appl. Sci. 2019, 9, 2262. [Google Scholar] [CrossRef] [Green Version]
- Vu, H.H.T.; Gu, S.; Thriveni, T.; Khan, M.D.; Tuan, L.Q.; Ahn, J.W. Sustainable treatment for sulfate and lead removal from battery wastewater. Sustainability 2019, 11, 3497. [Google Scholar] [CrossRef] [Green Version]
- Ma, C.; Shu, Y.; Chen, H. Recycling lead from spent lead pastes using oxalate and sodium oxalate and preparation of novel lead oxide for lead-acid batteries. RSC Adv. 2015, 5, 94895–94902. [Google Scholar] [CrossRef]
- Buldini, P.L.; Saxena, P.; Saxena, V.; Toponi, A. Voltammetric determination of trace amounts of copper, cadmium and lead in lead-acid battery electrolyte. Analyst 1990, 115, 1073–1075. [Google Scholar] [CrossRef]
- Obeng-Gyasi, E. Sources of lead exposure in various countries. Rev. Environ. Health 2019, 34, 25–34. [Google Scholar] [CrossRef]
- Gulson, B.L.; Jameson, C.W.; Mahaffey, K.R.; Mizon, K.J.; Korsch, M.J.; Vimpani, G. Regnancy increases mobilization of lead from maternal skeleton. J. Lab. Clin. Med. 1997, 130, 51–62. [Google Scholar] [CrossRef]
- Hu, H.; Téllez-Rojo, M.M.; Bellinger, D.; Smith, D.; Ettinger, A.S.; Lamadrid-Figueroa, H.; Schwartz, J.; Schnaas, L.; Mercado-García, A.; Hernández-Avila, M. Fetal lead exposure at each stage of pregnancy as a predictor of infant mental development. Environ. Health Persp. 2006, 114, 1730–1735. [Google Scholar] [CrossRef]
- Reuben, A.; Caspi, A.; Belsky, D.W.; Broadbent, J.; Harrington, H.; Sugden, K.; Houts, R.M.; Ramrakha, S.; Poulton, R.; Moffitt, T.E. Association of childhood blood lead levels with cognitive function and socioeconomic status at age 38 years and with IO change and socioeconomic mobility between childhood and adulthood. JAMA 2017, 317, 1244–1251. [Google Scholar] [CrossRef] [PubMed]
- Obeng-Gyasi, E. Lead Exposure and Cardiovascular Disease among Young and Middle-Aged Adults. Med. Sci. 2019, 7, 103. [Google Scholar] [CrossRef] [PubMed] [Green Version]
- Harari, F.; Sallsten, G.; Christensson, A.; Petkovic, M.; Hedblad, B.; Forsgard, N.; Melander, O.; Nisson, P.M.; Borne, Y.; Engstrom, G.; et al. Blood lead levels and decreased kidney function in a population-based cohort. Am. J. Kidney Dis. 2018, 72, 381–389. [Google Scholar] [CrossRef] [Green Version]
- Lin, J.L.; Lin-Tan, D.T.; Hsu, K.H.; Yu, C.C. Environmental lead exposure and progression of chronic renal diseases in patients without diabetes. New Engl. J. Med. 2003, 348, 277–286. [Google Scholar] [CrossRef]
- Obeng-Gyasi, E.; Armijos, R.X.; Weigel, M.M.; Filippelli, G.; Sayegh, M.A. Hepatobiliary-related outcomes in US adults exposed to lead. Environments 2018, 5, 46. [Google Scholar] [CrossRef] [Green Version]
- Can, S.; Bağci, C.; Ozaslan, M.; Bozkurt, A.I.; Cengiz, B.; Cakmak, E.A.; Kocabas, R.; Karadag, E.; Tarakçioğlu, M. Occupational lead exposure effect on liver functions and biochemical parameters. Acta Physiol. Hung. 2008, 95, 395–403. [Google Scholar] [CrossRef]
- Benatti, C.T.; Tavares, C.R.G.; Lenzi, E. Sulfate removal from waste chemicals by precipitation. J. Environ. Manag. 2009, 90, 504–511. [Google Scholar] [CrossRef]
- Tait, S.; Clarke, W.P.; Keller, J.; Batstone, D.J. Removal of sulfate from high-strength wastewater by crystallization. Water Res. 2009, 43, 762–772. [Google Scholar] [CrossRef]
- Haghsheno, R.; Mohebbi, A.; Hashemipour, H.; Sarrafi, A. Study of kinetic and fixed bed operation of removal of sulfate anions from an industrial wastewater by an anion exchange resin. J. Hazard. Mater. 2009, 166, 961–966. [Google Scholar] [CrossRef]
- Liang, F.; Xiao, Y.; Zhao, F. Effect of pH on sulfate removal from wastewater using a bioelectrochemical system. Chem. Eng. J. 2013, 218, 147–153. [Google Scholar] [CrossRef]
- Jong, T.; Parry, D.L. Removal of sulfate and heavy metals by sulfate reducing bacteria in short-term bench scale upflow anaerobic packed bed reactor runs. Water Res. 2003, 37, 3379–3389. [Google Scholar] [CrossRef]
- Mizuno, O.; Li, Y.Y.; Noike, T. The behavior of sulfate-reducing bacteria in acidogenic phase of anaerobic digestion. Water Res. 1998, 32, 1626–1634. [Google Scholar] [CrossRef]
- Zhao, F.; Rahunen, N.; Varcoe, J.R.; Chandra, A.; Avignone-Rossa, C.; Thumser, A.E.; Slade, R.C.T. Activated carbon cloth as anode for sulfate removal in a microbial fuel cell. Environ. Sci. Technol. 2008, 42, 4971–4976. [Google Scholar] [CrossRef]
- Glombitza, F. Treatment of acid lignite mine flooding water by means of microbial sulfate reduction. Waste Manag. 2001, 21, 197–203. [Google Scholar] [CrossRef]
- Tsibouklis, J.; Stone, M.; Thorpe, A.A.; Graham, P.; Peters, V.; Heerlien, R.; Smith, J.R.; Green, K.L.; Nevell, T.G. Preventing bacterial adhesion onto surfaces: the low-surface-energy approach. Biomaterials 1999, 20, 1229–1235. [Google Scholar] [CrossRef]
- Johnson, D.B.; Hallberg, K.B. Acid mine drainage remediation options: a review. Sci. Total Environ. 2005, 338, 3–14. [Google Scholar] [CrossRef]
- Montgomery, A.D.; Mclnerney, M.J.; Sublette, K.L. Microbial control of the production of hydrogen sulfide by sulfate-reducing bacteria. Biotechnol. Bioeng. 1990, 35, 533–539. [Google Scholar] [CrossRef]
- Hao, O.J.; Chen, J.M.; Huang, L.; Buglass, R.L. Sulfate-reducing bacteria. Crit. Rev. Env. Sci. Tec. 1996, 26, 155–187. [Google Scholar] [CrossRef]
- Tsukamoto, T.K.; Miller, G.C. Methanol as a carbon source for microbiological treatment of acid mine drainage. Water Res. 1999, 33, 1365–1370. [Google Scholar] [CrossRef]
- Silva, A.J.; Hirasawa, J.S.; Varesche, M.B.; Foresti, E.; Zaiat, M. Evaluation of support materials for the immobilization of sulfate-reducing bacteria and methanogenic archaea. Anaerobe 2006, 12, 93–98. [Google Scholar] [CrossRef] [PubMed]
- Roy, A.; Das, B.K.; Bhattacharya, J. Development and validation of a spectrophometric method to measure sulfate concentrations in mine water without interference. Mine Water Environ. 2011, 30, 169–174. [Google Scholar] [CrossRef]
- Clescerl, L.S. Standard Methods for the Examination of Water and Wastewater, 20th ed.; American Public Health Association: Washington, DC, USA, 2005; pp. 4310–4500. [Google Scholar]
- Wu, J.; Zheng, H. Quantitative measurement of the concentration of sodium carbonate in the system of Na2CO3-H2O by raman spectroscopy. Chem. Geol. 2010, 273, 267–271. [Google Scholar] [CrossRef]
- Ponou, J.; Wang, L.P.; Dodbiba, G.; Matuo, S.; Fujita, T. Effect of carbonation on banana peels for removal of cadmium ions from aqueous solution. Environ. Eng. Manag. J. 2016, 15, 851–860. [Google Scholar] [CrossRef]
- Xia, H.; Zhan, L.; Xie, B. Preparing ultrafine PbS powders from the scrap lead-acid battery by sulfurization and inert gas condensation. J. Power Sour. 2017, 341, 435–442. [Google Scholar] [CrossRef]
- WHO. A Compendium of Standards for Wastewater Reuse in the Eastern Mediterranean Region. 2006. Available online: https://apps.who.int/iris/bitstream/handle/10665/116515/dsa1184.pdf;sequence=1 (accessed on 29 January 2020).


| Parameters | Initial a | SRB Treatment a | Precipitation a | Removal Ratios (%) | WHO Value a |
|---|---|---|---|---|---|
| pH | 7.01 | 8.86 | 9.08 | NA b | 6.0–9.0 |
| Pb2+ | 0.924 | ODL c | ODL | >94.6 | 0.2 |
| Cd2+ | 2.10 | ODL | ODL | >99.8 | 0.01 |
| SO42− | 3013.5 | 27.1 | 25.2 | 99.2 | 300 |
| Ca2+ | 400.1 | 3.78 | 3.43 | 99.1 | 200 |
| HS− | NA | 1001 | 1.27 | 99.9 | 1.0 |
| HCO3− | NA | 1278 | 786 | NA | NA |
| Fe2+ | NA | NA | 89.5 | NA | NA |
© 2020 by the authors. Licensee MDPI, Basel, Switzerland. This article is an open access article distributed under the terms and conditions of the Creative Commons Attribution (CC BY) license (http://creativecommons.org/licenses/by/4.0/).
Share and Cite
Gu, S.; Fu, B.; Ahn, J.W. Simultaneous Removal of Residual Sulfate and Heavy Metals from Spent Electrolyte of Lead-Acid Battery after Precipitation and Carbonation. Sustainability 2020, 12, 1263. https://0-doi-org.brum.beds.ac.uk/10.3390/su12031263
Gu S, Fu B, Ahn JW. Simultaneous Removal of Residual Sulfate and Heavy Metals from Spent Electrolyte of Lead-Acid Battery after Precipitation and Carbonation. Sustainability. 2020; 12(3):1263. https://0-doi-org.brum.beds.ac.uk/10.3390/su12031263
Chicago/Turabian StyleGu, Shuai, Bitian Fu, and Ji Whan Ahn. 2020. "Simultaneous Removal of Residual Sulfate and Heavy Metals from Spent Electrolyte of Lead-Acid Battery after Precipitation and Carbonation" Sustainability 12, no. 3: 1263. https://0-doi-org.brum.beds.ac.uk/10.3390/su12031263