1. Introduction
The United Nations defined a society as ageing when 15% of the country’s population were aged 60 years and above. Globally, because many developed nations have ageing populations, they are having to deal with social transformations that affect all sectors of development. Japan, which has the highest ageing ratio in the world, has now been classified as a super-aged society. Ageing populations are also becoming a major challenge in developing countries such as Malaysia, with 7 percent of the population expected to be over 60 in 2020, and 11 percent by 2030 [
1]. Ageing populations are a major challenge for low- and middle-income countries because of the rise in age-related non-communicable diseases [
2]. Global health projections [
3] also indicated that as an upper-middle-income country, Malaysia will experience a gradual increase in mortality caused by non-communicable diseases from 84.3% in 2016 to 89.9% in 2045. Therefore, an effective approach to promoting active ageing lifestyles in older adults is needed to cope with this trend.
Active ageing refers to active community engagement that promotes a healthy lifestyle in older people and retirees to improve their quality of life, increase their physical fitness, reduce health problems and prolong life. Generally, people’s physical functions deteriorate with age, making older people less active and less mobile [
4], which tends to lead to physical inactivity, as has been found in 48.8% of Malaysian men and women aged 60 years and above [
5].
To deal with the problems associated with physical inactivity, the WHO developed an active ageing framework that empowers older people’s physical, social and mental health through community engagement [
6]. Physical activity (PA) can be assessed from several active ageing indicators related to the economy, health and social services, behaviour, personal circumstances, social surroundings and the physical environment [
6]. It has been found that older adults who participate in social and physical activities have higher self-satisfaction and confidence, a lower level of hospitalisations and a decreased likelihood of early mortality [
7]. Risk of obesity can be reduced among older adults who regularly participate in physical activities such as physical transportation activities (walking or cycling to destinations), physical occupational activities, indoor and outdoor household chores and daily sports and recreation activities [
6,
8]. On the other hand, social activities such as interaction with neighbours and participating in community activities were also known to influence the elderly’s extent of PA level [
9].
Urban settings have been found to influence older people’s daily activity levels [
8]. In particular, the surrounding neighbourhood environment can influence the extent to which local residents engage in healthy active ageing activities [
10,
11]. Physical neighbourhood environments (PNE) can be measured objectively and subjectively. The objectively-measured PNE (PNEO) is the observable and measurable real-time data related to the physical characteristics of the neighbourhood environment, which can be obtained and analysed from either direct observation or secondary GIS data. Physical activity (PA) can also be measured objectively through questionnaire surveys on local residents. However, subjectively-measured PNE (PNES) is the perceived and subjective opinions of the general population about their surrounding neighbourhood environment. While both these measures are interdependent [
12], it is also important to explore the underlying assumptions that may influence the PA levels in older adults [
13,
14,
15].
While active ageing has become well-established in most policy frameworks in developed countries, it is less recognised in developing countries such as Malaysia. However, while Malaysia does promote active ageing in its revised National Policy and Plan of Action for Older Persons, 2011 [
16], the context is general with few specific actions proposed and little focus given to the influence of the physical neighbourhood environment (PNE) on older people’s physical activity (PA) level. It is consequential to cultivate the active ageing concept in Malaysia’s housing sector through the promotion of physical neighbourhood characteristics. However, even though the PNE has been found to be objectively and subjectively associated with PA in older adults, there have been no studies on the influence of the objective physical characteristics of the neighbourhood environment using real-life data (PNEO) in the local Malaysian neighbourhood context. Therefore, the objective of this paper was to analyse the relationship between the objective and subjective PNE measures and PA, and identify the measures that could be adapted into Malaysian housing policy or guidelines. The findings from the study contribute to existing knowledge and could assist in the development of active ageing neighbourhood environment or urban planning housing policy guidelines in Malaysia.
2. Literature Review and Research Design
2.1. Formulation of Conceptual Model
Several studies have found that PNEO directly influences the PA level of older adults. A study conducted in Singapore found that the PNEO measured as an accessibility index and a walkability index significantly influenced the PA level as measured through health status and clinical measures [
13]. Similarly, a study in Japan found that the neighbourhood walkability index, which was defined using PNEO measures such as residential density, street connectivity, land use mix and the availability of parks and green space, significantly influenced the PA level of older adults [
17]. Accessibility indices are usually measured by combining the values and weights from PNEO measures such as residential density, street connectivity and land use mix [
13,
18] and walkability indices are usually measured by the proximity to community facilities [
13]. While most PNE studies have used the walkability and accessibility indices to determine the influence of PNEO on PA, to determine which of these measures were significantly related to the PA level of the older adults, this study specifically referred to each PNEO measure and did not rely on a PNEO index.
Other studies have found that PNEO measures such as land use mix entropy [
19,
20,
21], population density [
19,
21,
22], traffic intersection density [
13,
23,
24,
25,
26] and proximity to recreation areas [
26,
27,
28] influence the PA levels of older adults. While these types of PNEO measures are reliable in representing the objective physical characteristics of the neighbourhood environment that can strongly influence the PA level in older adults, in some cases, local considerations are also needed. For example, in this study, an additional PNEO measure, the proximity to the mosque, was added as it was hypothesised that this also was directly related to the PA of Malaysian older adults. This was because older Muslim Malaysian adults tend to spend their free time in leisure and spiritual activities, which is considered an important type of PA as they spend more time performing formal and informal spiritual learning activities, with many attending religious activities and social activities at the mosque [
29]. Therefore, it was hypothesised that older adults living nearer to the mosque would have a higher PA.
The PNES measures were based on the Neighbourhood Environment Walkability Scale- Abbreviated (NEWS-A), which includes the perceived measures of the neighbourhood environment. This scale was considered suitable as many past studies in diverse settings have established a connection between perceived PNE and PA in older adults [
26,
27,
28,
29,
30,
31]. Past studies have also found that perceived PNE (PNES) measures such as perceived residential density [
13,
27,
32], land use diversity [
13,
27,
32,
33,
34], accessibility [
13,
32,
34,
35], street connectivity [
13,
32], infrastructure for walking and cycling [
34,
36], neighbourhood aesthetics [
13,
32,
37], safety from traffic hazards [
30,
32,
34,
37] and safety from crime [
30,
34,
37,
38] were significantly associated with PA. In addition, single-question item PNES measures such as lack of parking [
39], lack of cul-de-sacs, hilliness and physical barriers have also been found to have a significant association with PA in older adults.
To date, few studies have examined active ageing in Malaysia [
40,
41] and the impact of the PNES on older adult active lifestyles in Malaysia [
27,
35,
42,
43,
44,
45], and there have been no studies on the possible relationships between the objective PNE measures (PNEO) and the PA level in young-old adults in Malaysia. As research in Malaysia has also found a relationship between PNES and PA, it was anticipated that these measures also influenced the PA levels of older Malaysian adults. Therefore, this study hypothesised that PNEO characteristics directly affect the level of PA in older adults and that the PNES characteristics indirectly affect the PA level depending on the distinctive physical characteristics of each neighbourhood. The distinctive physical characteristics for each neighbourhood in this study were defined as small-scale physical features such as road medians, main roads with no pedestrian crossings, residential district boundaries and drainage barriers.
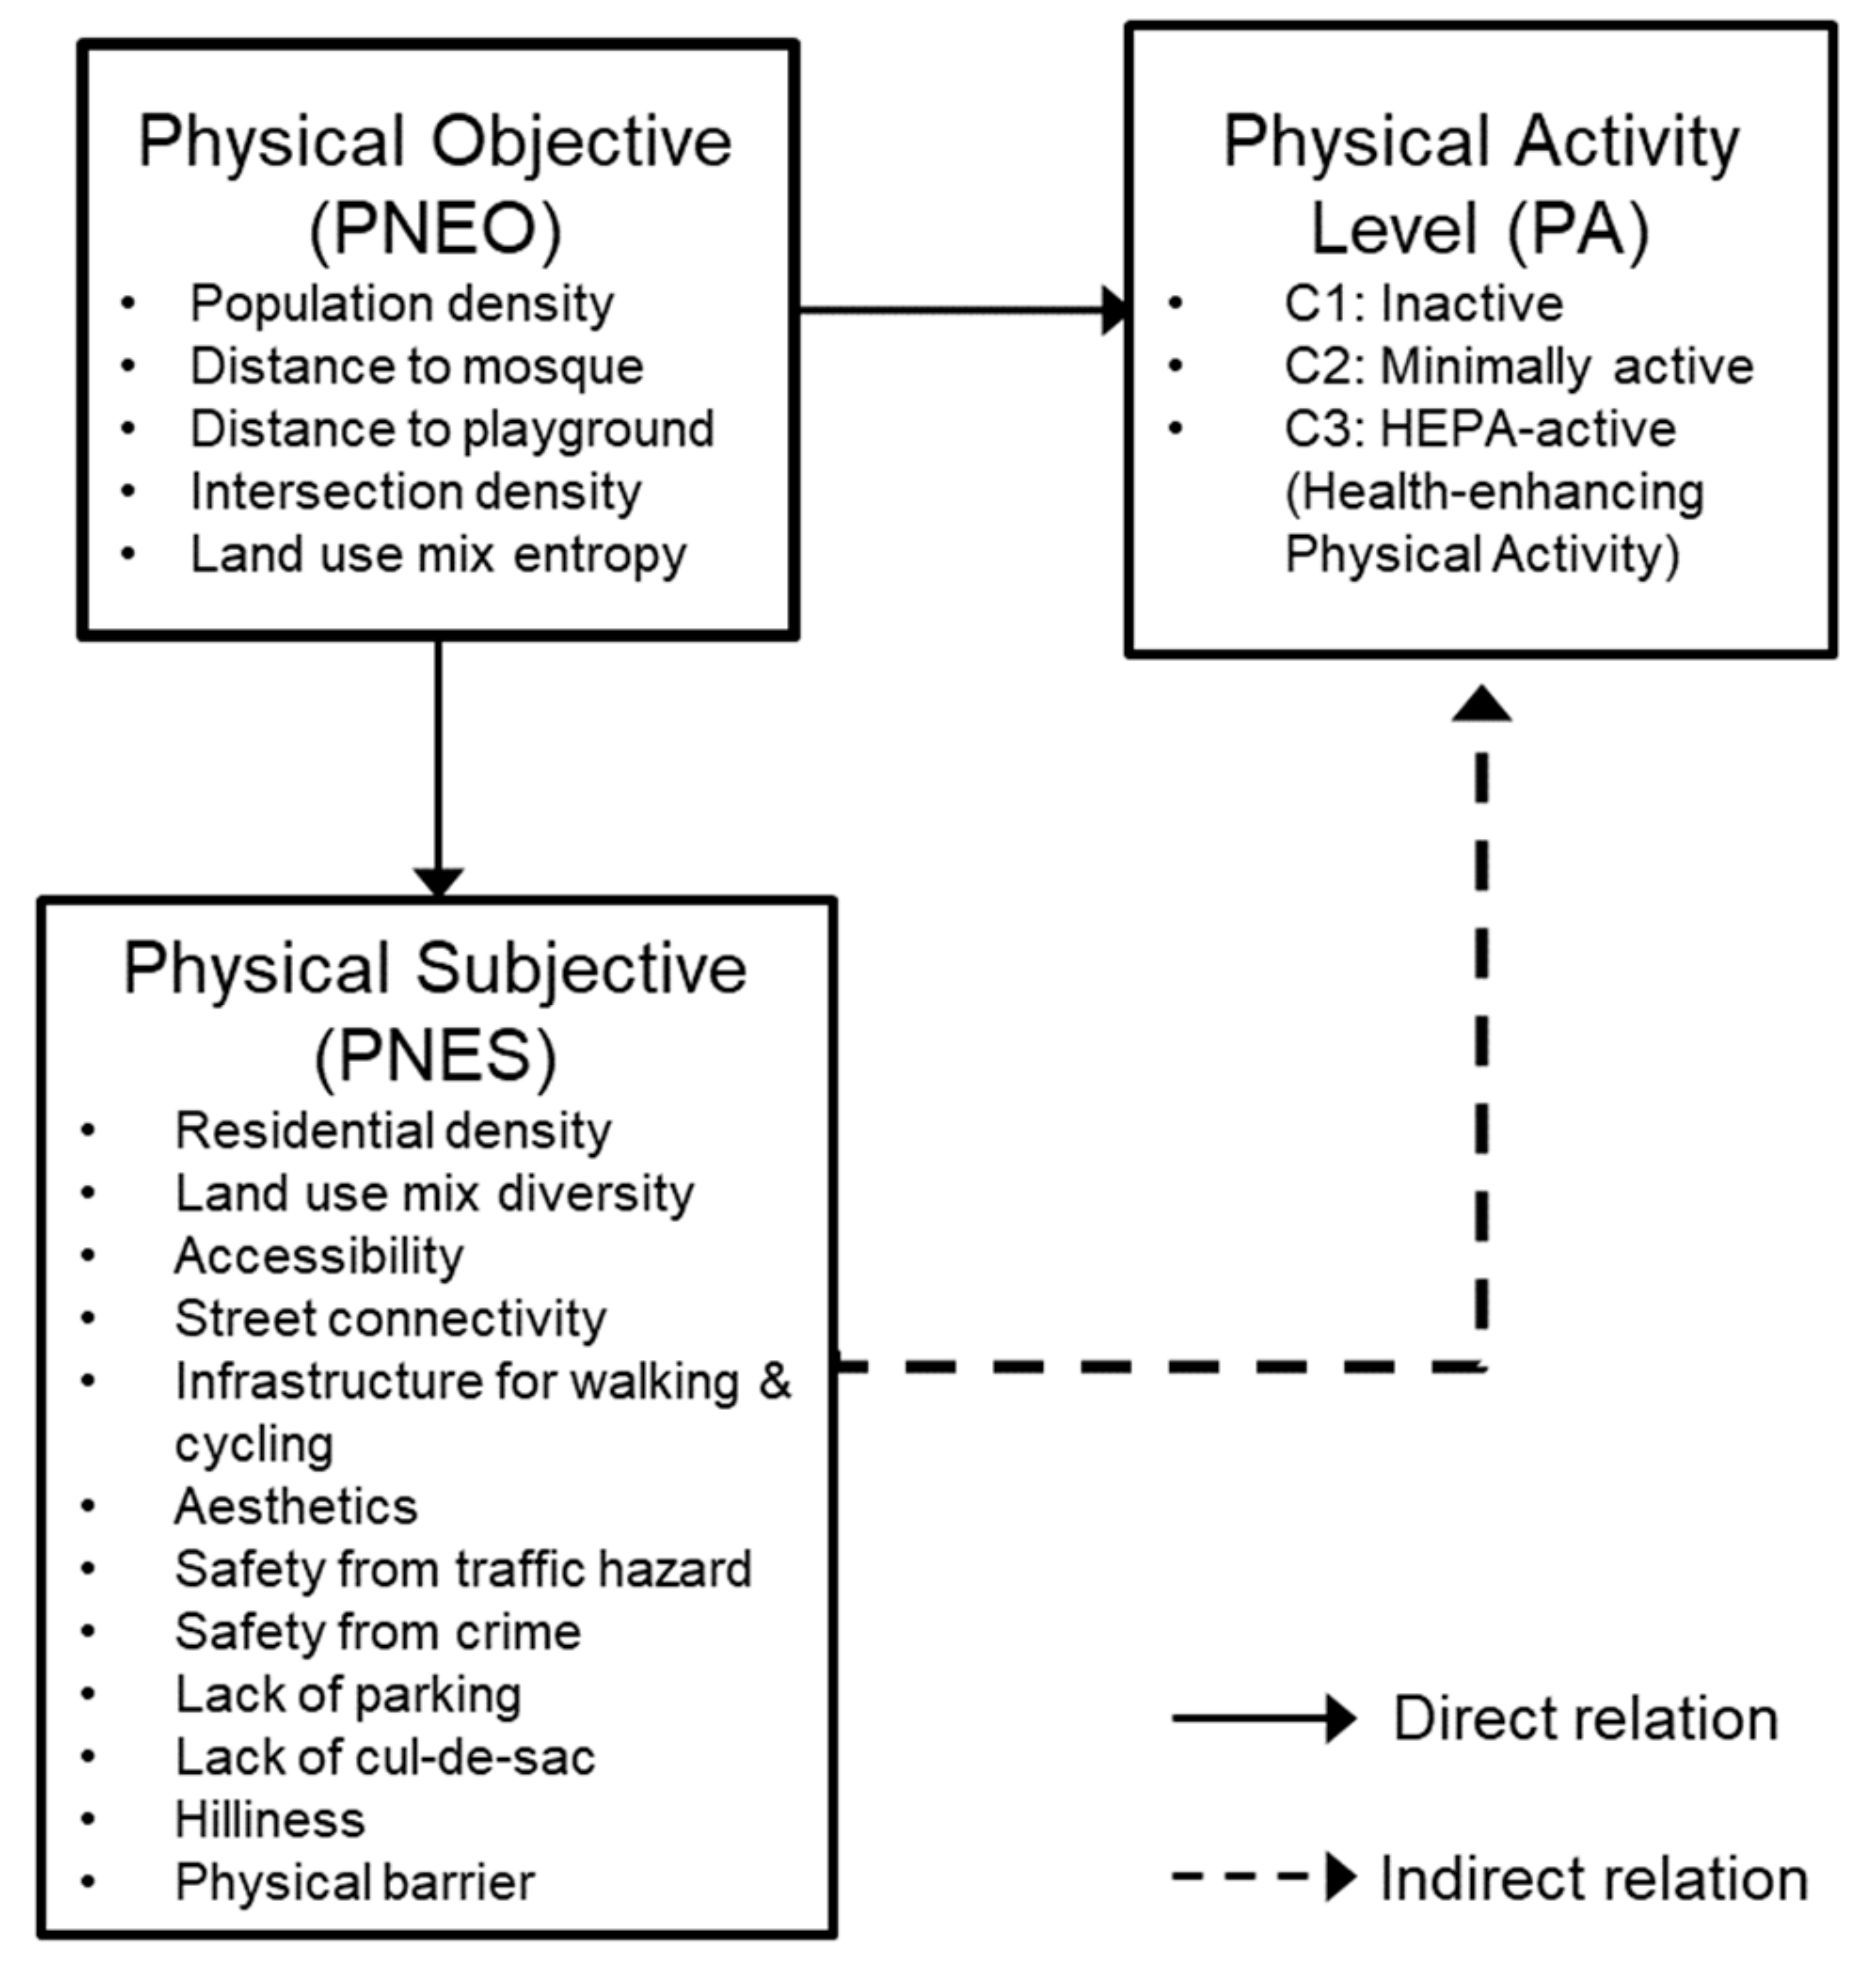
After an extensive literature review, a generalised conceptual model was developed in which the various objective (PNEO) and subjective (PNES) measures that may influence the PA in older Malaysian adults were considered, as shown in
Figure 1. As can be seen, the PNEO was the independent variable and the PNES was the dependent variable directly related to PNEO and indirectly related to the PA level through the small-scale physical characteristics of each neighbourhood, with the PA level being the outcome variable. Therefore, the influence of the PNEO and PNES on PA level in Malaysian neighbourhoods was explored in this study.
2.2. Research Design
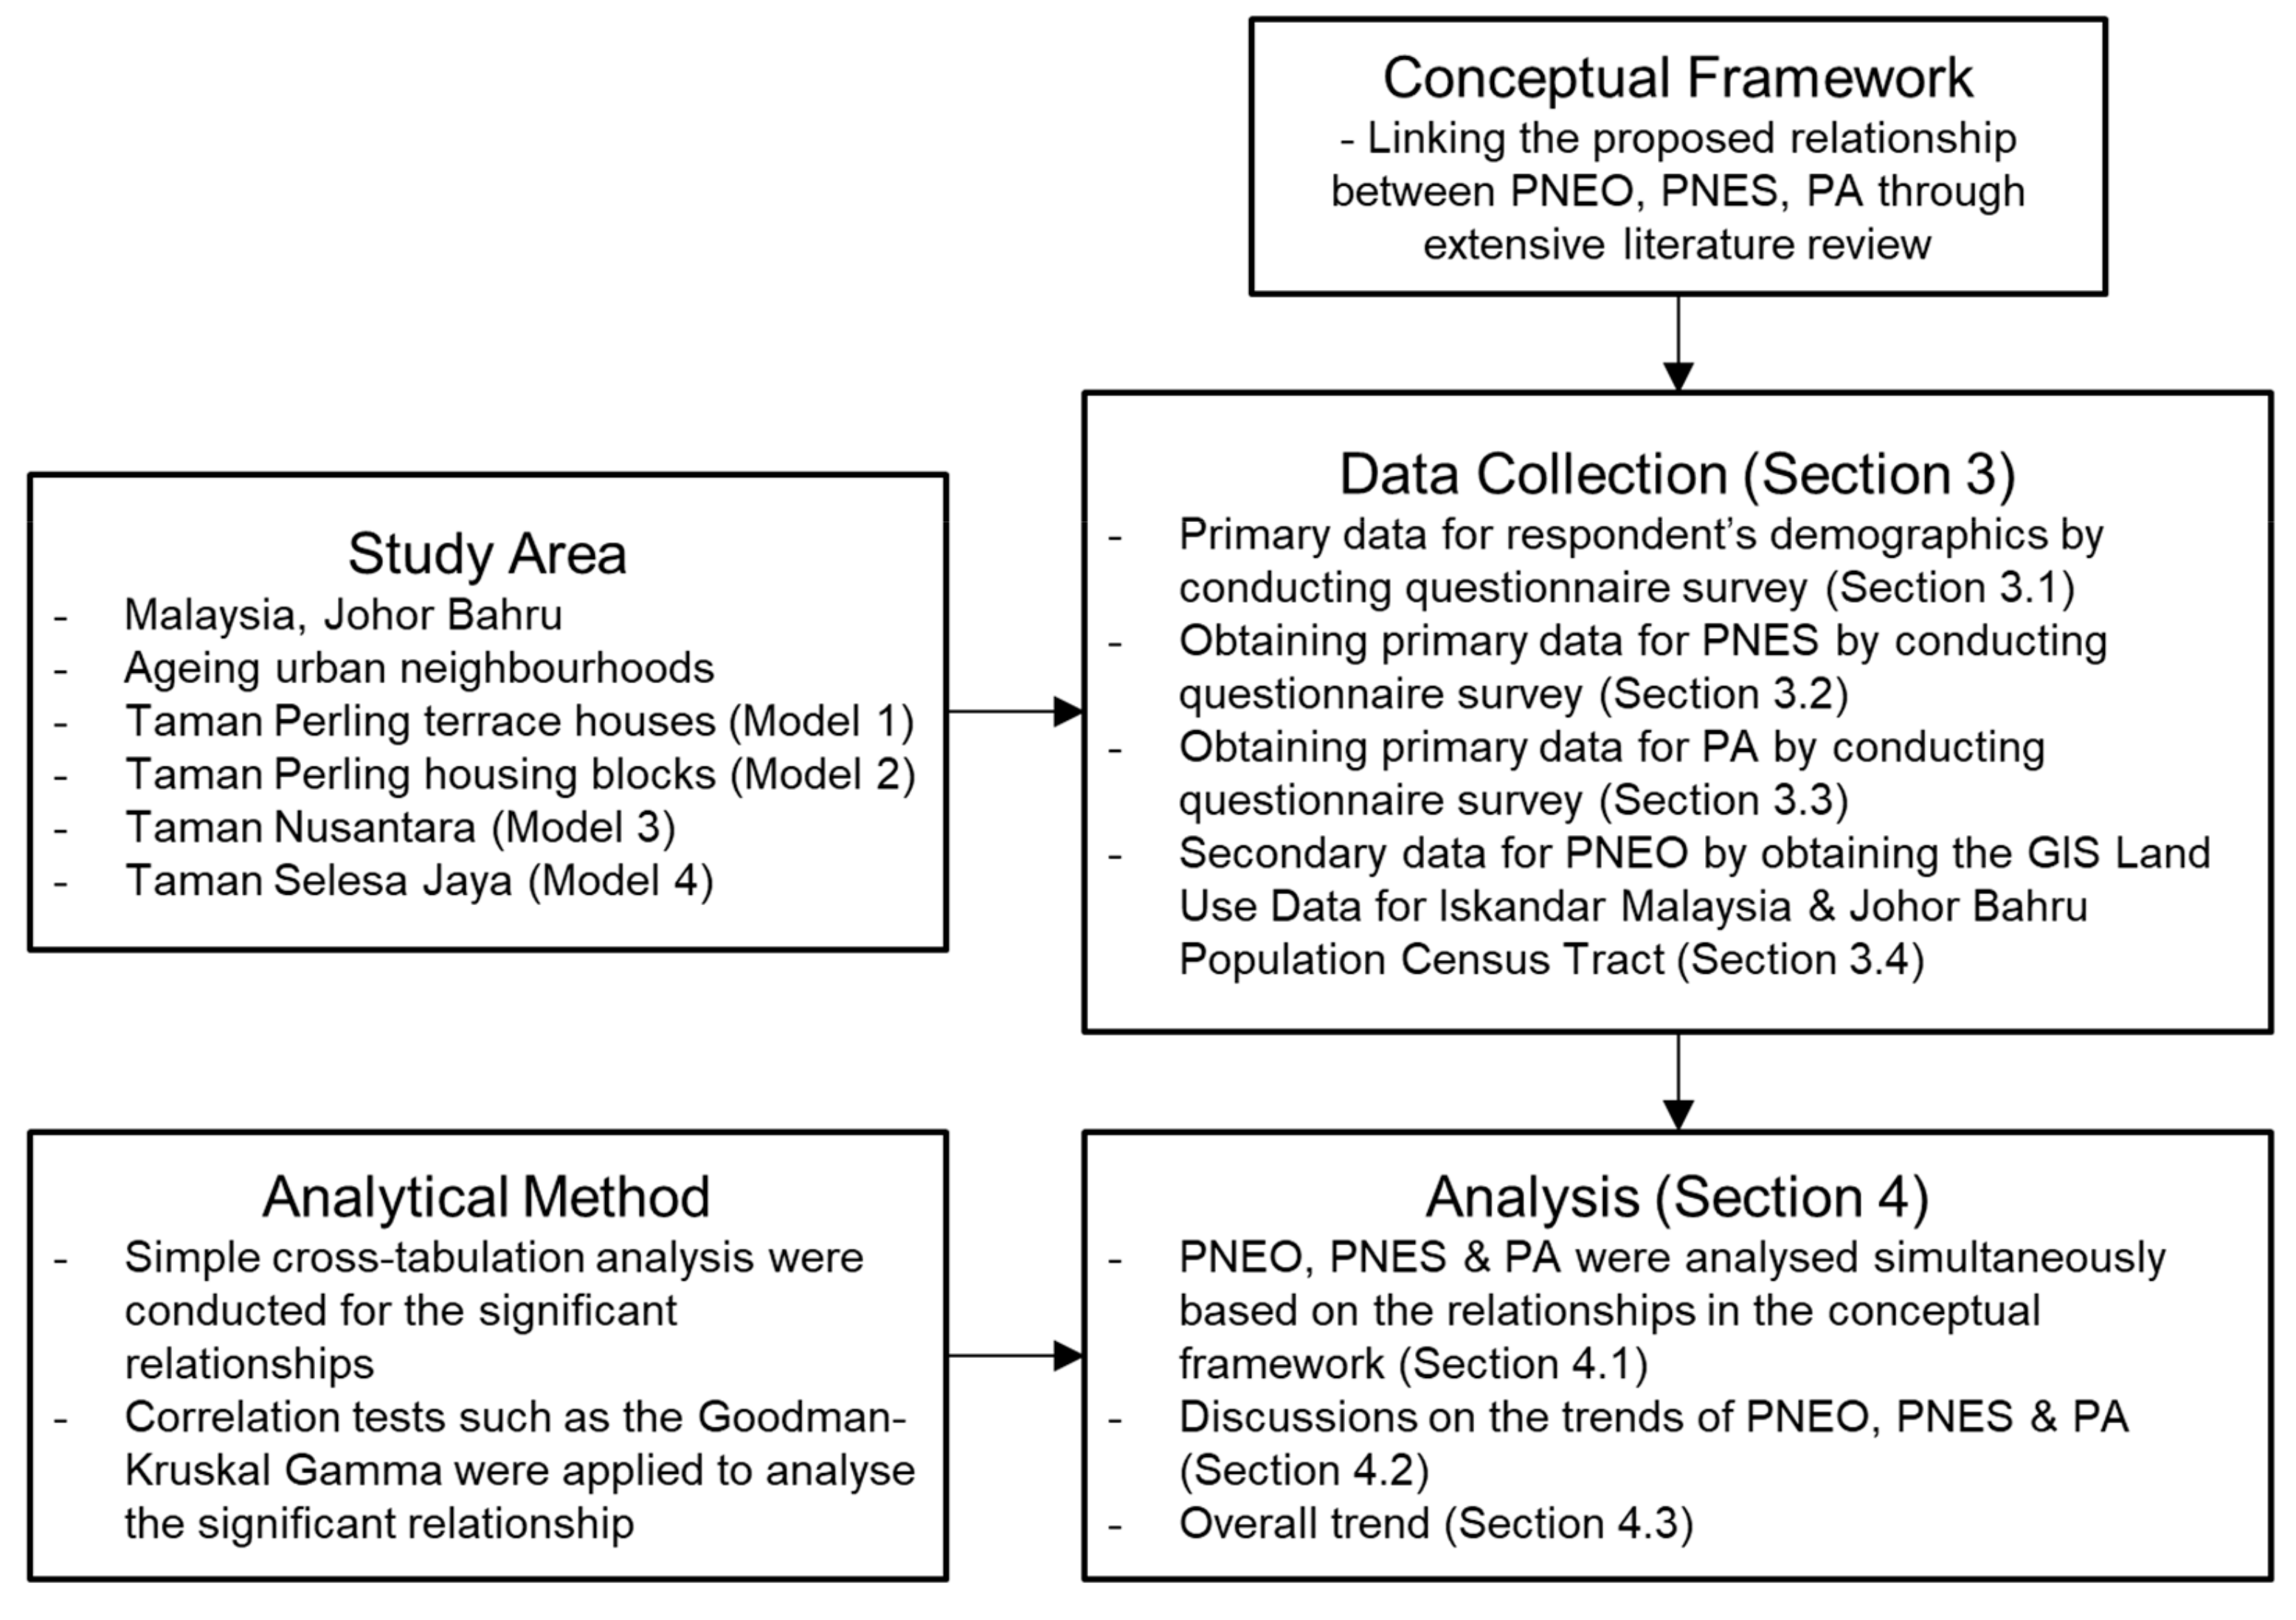
The PNE and PA were measured objectively (PNEO) and subjectively (PNES). The subsequent methodology section focuses on the analytical processes in the study. A comprehensive flow chart of the analytical process is illustrated in
Figure 2.
A questionnaire survey was conducted in the three neighbourhoods which consists of four case study areas to obtain the associated demographic attributes and the respondents’ types of houses, and to measure the PNES and PA levels of the respondents. A total of 280 respondents were individually interviewed using a questionnaire over a period of 3 months from August 2018 to October 2018. For PNEO spatial data, the analysis covered items such as the land use entropy index, population density, the proximity of neighbourhood facilities and traffic network accessibility. All significant PNEO, PNES and PA relationships were analysed using SPSS version 24.0 by using a correlation test of Goodman-Kruskal Gamma analysis. Simple cross-tabulations between the variables were conducted to explore the underlying trends in the significant relationships between the PNEO and PNES and the PA level.
3. Data Collection
3.1. Study Area and Respondent’s Demographic
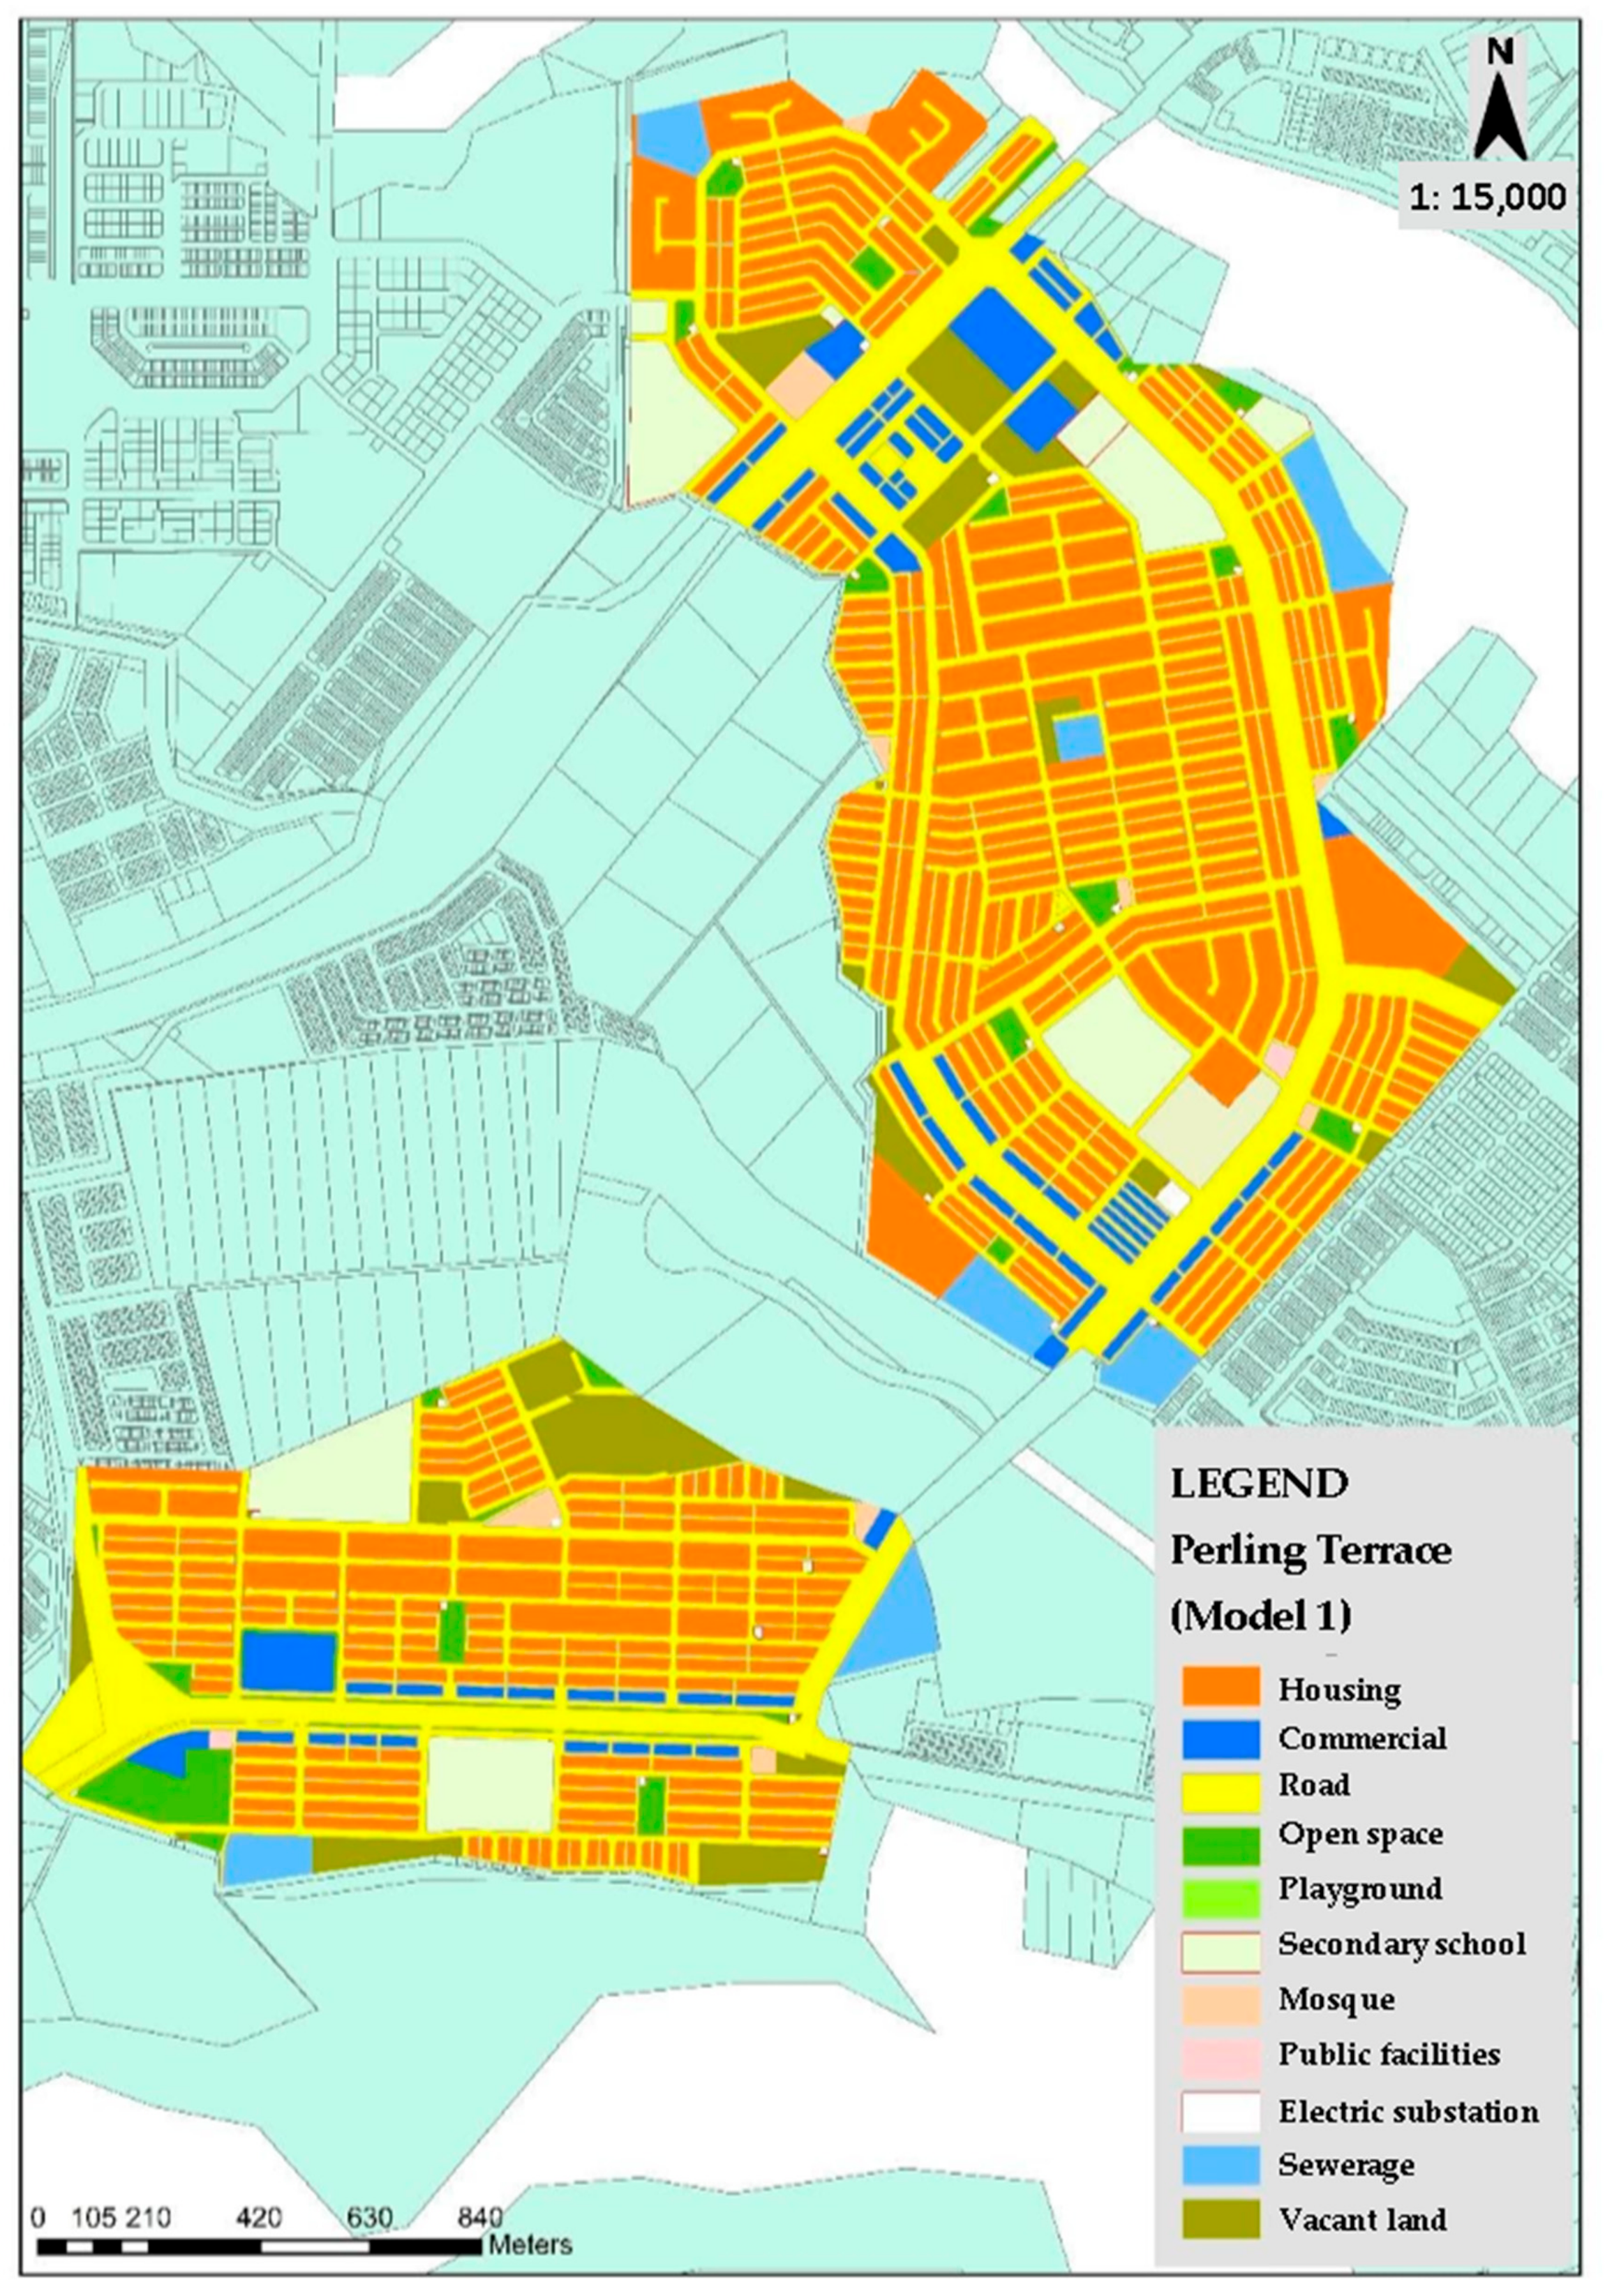
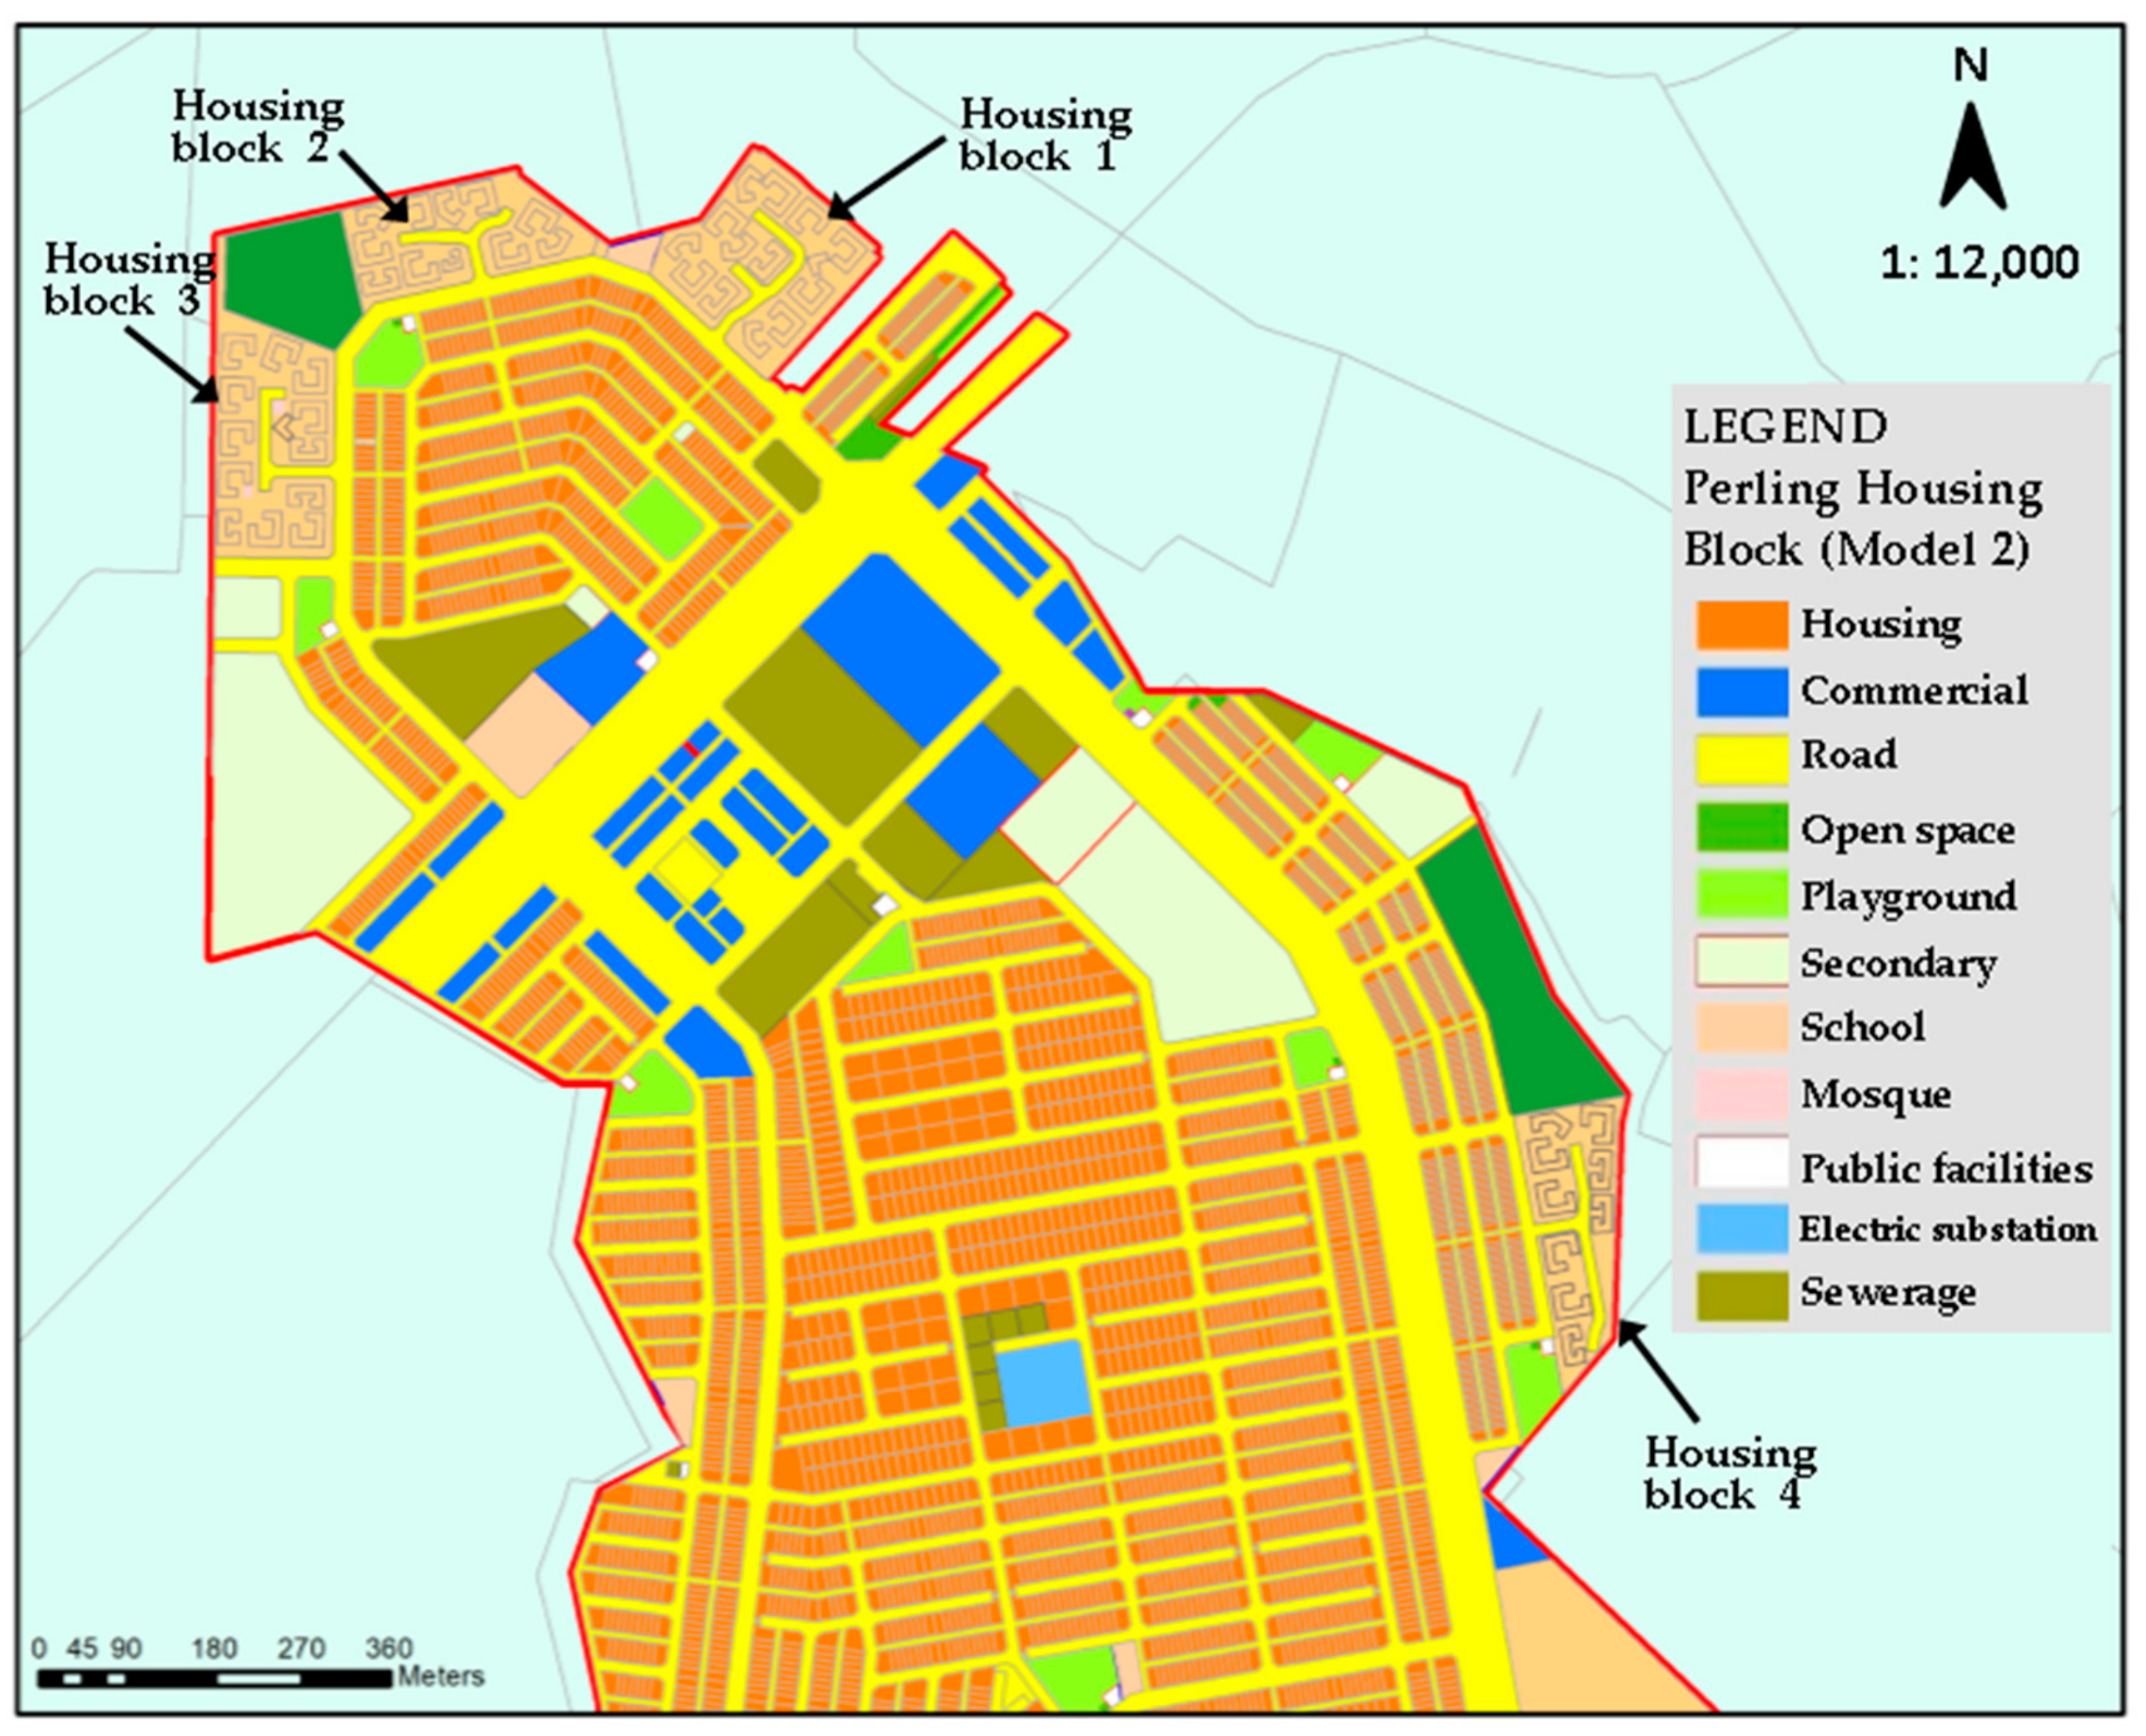
The research area was three neighbourhoods in the city of Johor Bahru, Johor, Malaysia. Normally, neighbourhoods are chosen based on a high ageing population rate; however, to facilitate this study, respondents from neighbourhoods with active neighbourhood associations were chosen as the previous pilot survey found it difficult to acquire respondents due to safety reasons. The three neighbourhoods have diverse housing types, with the land use distribution shown on the land use maps in the
Appendix A (
Figure A1,
Figure A2,
Figure A3 and
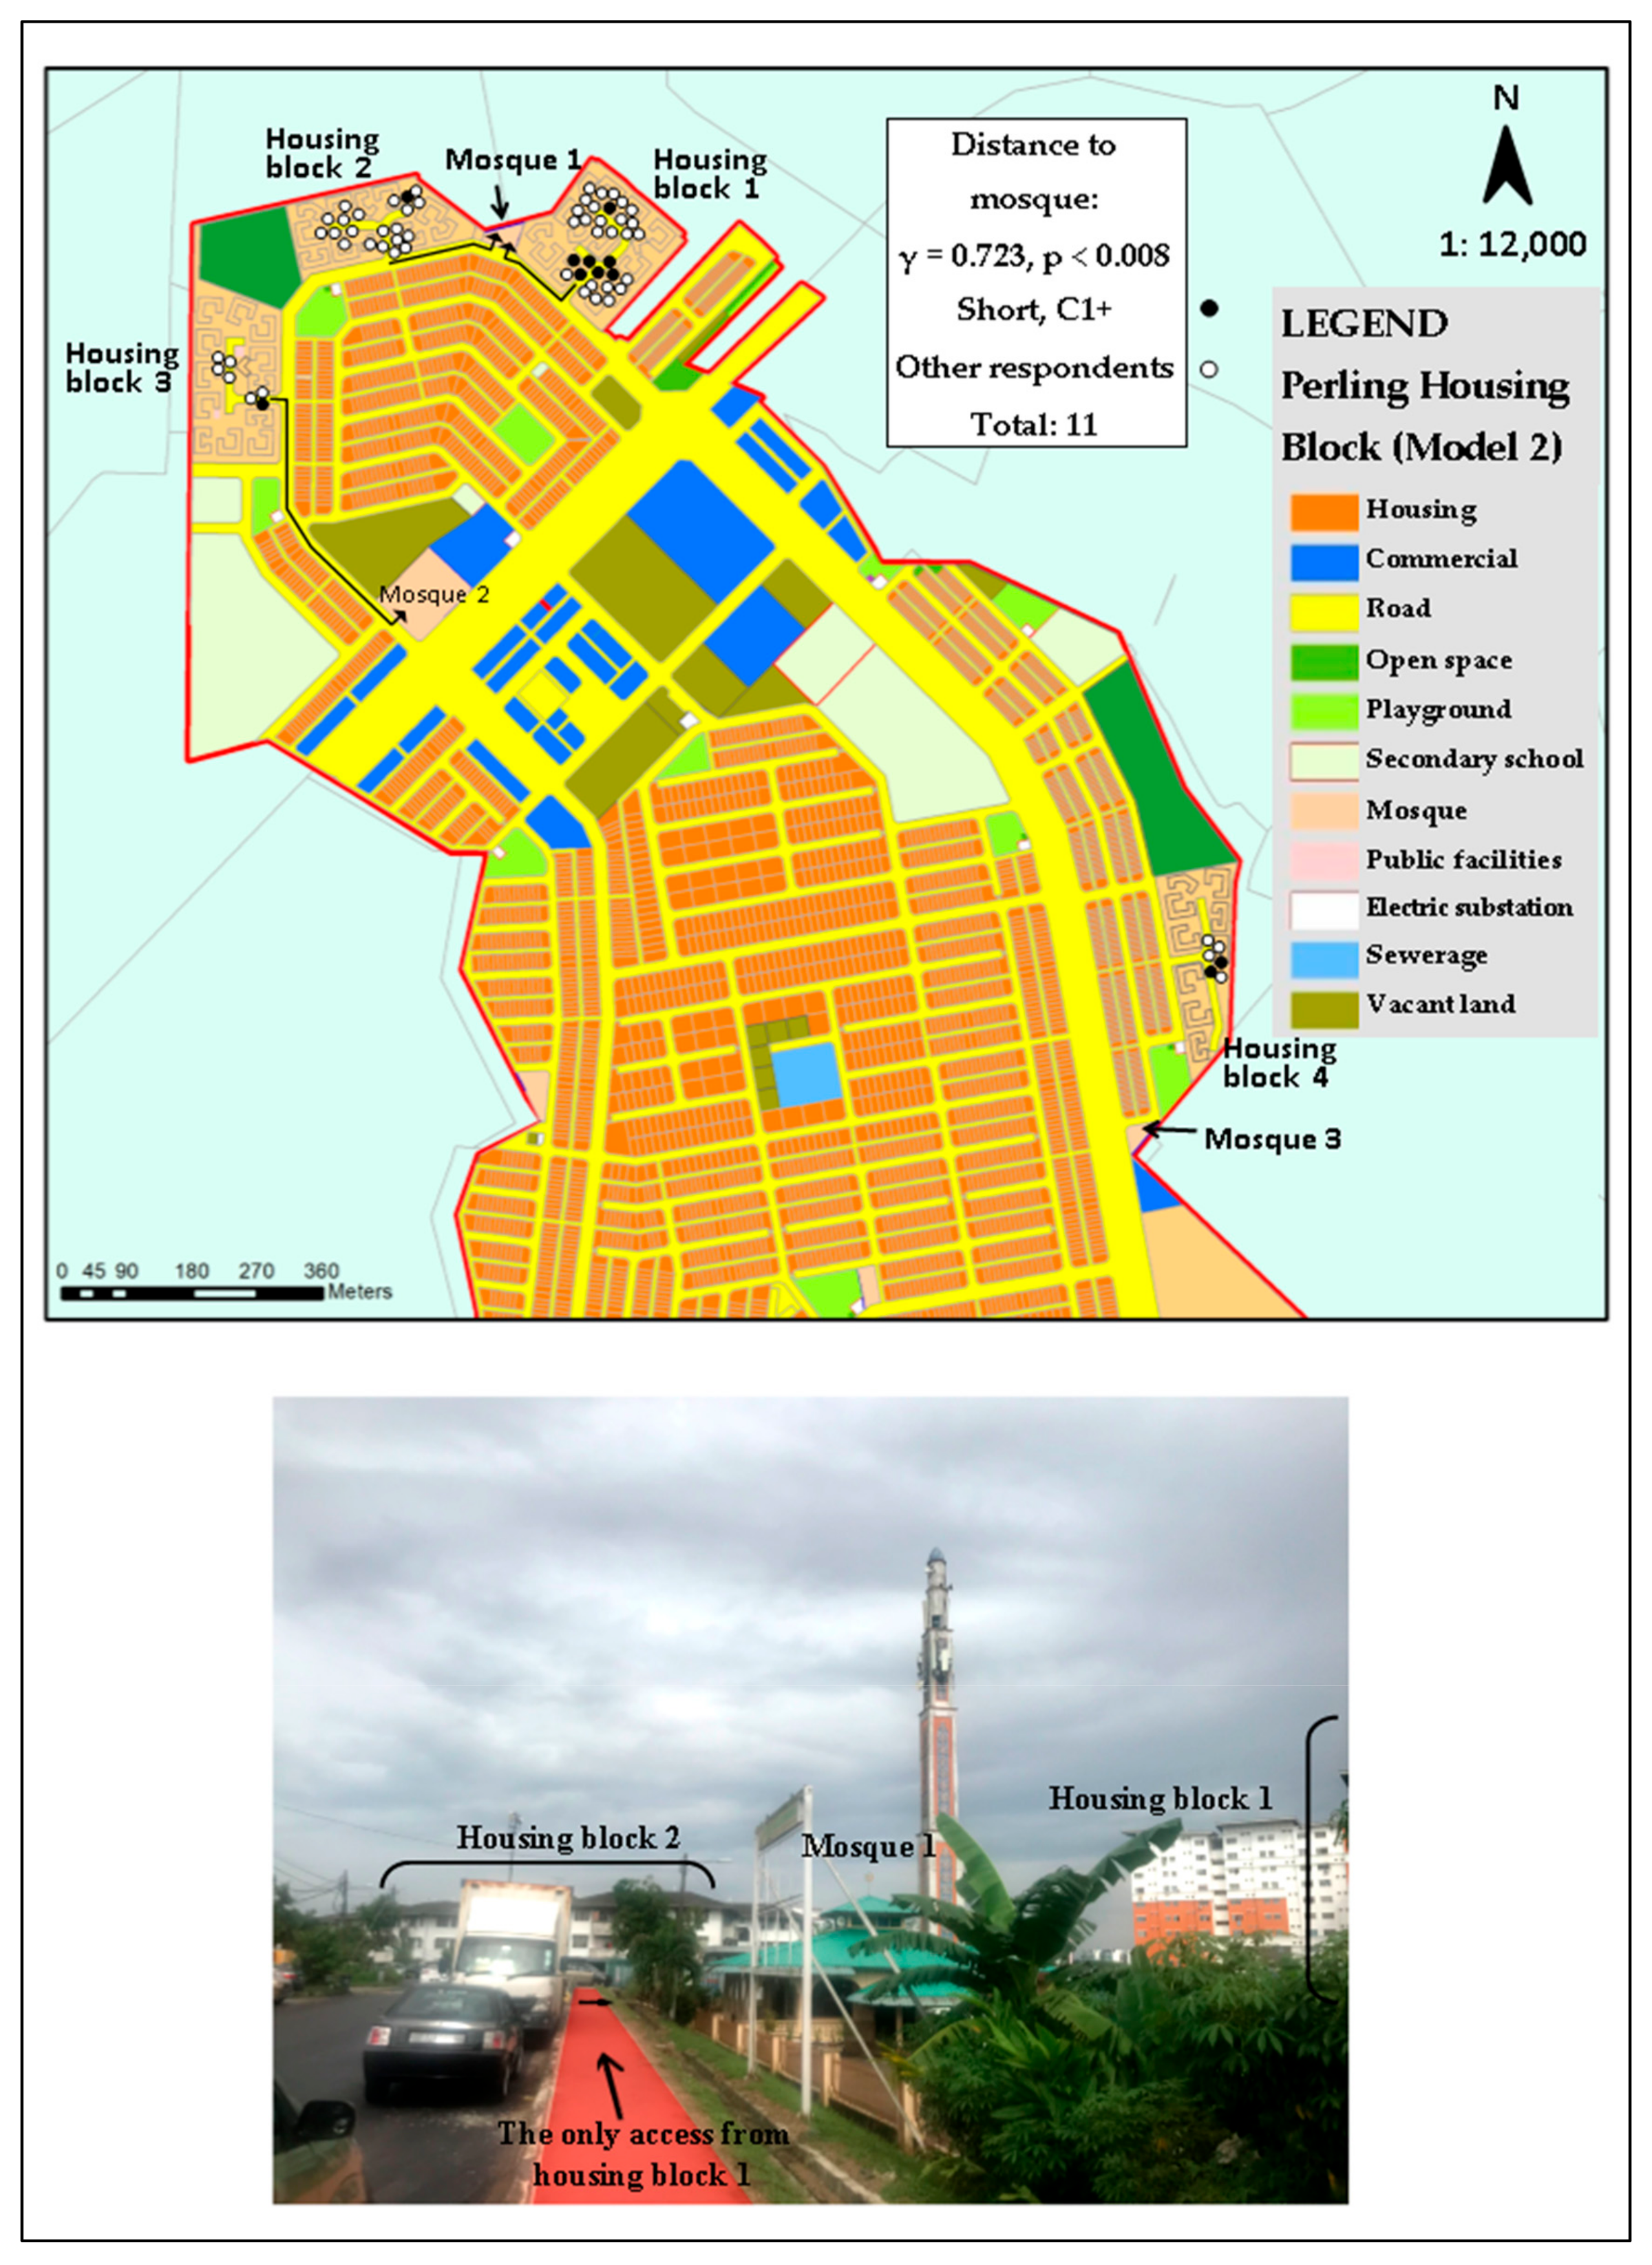
Figure A4). The main housing type in the neighbourhoods are 2 storey terraced houses and 4 to 5 storey housing blocks. The internal physical environment in the housing block areas in Taman Perling consists of several grocery stores, some food stalls, a small community hall and a small mosque, all of which are used by the local community.
The questionnaire survey consists of several parts; the first part of the questionnaire collected information on the type of their houses and the respondent demographics, the second part focused on the PNES with 5 choice Likert scale agreement measures that had been adapted from the Neighbourhood Environmental Walkability Survey-Abbreviated (NEWS-A) scale [
32], and the third part focused on the types of PA performed which is adapted from the IPAQ based on the Self-Administered Long Version Format for use among population aged 15–64 years [
46]. All parts were combined for a new restructured questionnaire.
Table 1 gives details of the housing environments in all the neighbourhoods and the number of respondents who participated. Only Taman Perling has both terrace and housing blocks areas, with the other two neighbourhoods having mainly terrace houses, that of Taman Nusantara and Taman Selesa Jaya.
The study sample was controlled, with only young-middle-aged adults from 45 years old and above being chosen as study respondents because they would be soon entering late middle-age at 50 years old. As the older people threshold is 60 years old in Malaysia, which is also the retirement age, the respondents below the age of 60 were called the young-old group who would soon be entering the 60-year-old group. Respondents aged 50 years and below represented the trends for the late middle-aged group before entering the young-old group and before entering the older generation.
To gain the respondents’ trust, the neighbourhood associations assisted the research team to facilitate the interviews. Most respondents were low- to middle-income older residents as most neighbourhood associations are usually formed and managed by low- to middle-income communities in small neighbourhoods.
Table 2 gives the descriptive statistics for the study sample and the basic demographic attributes: gender, age, length of time living in the neighbourhood, race, family structure and occupation. The average age of the respondents, aged from 45 to 75 and above, in the three neighbourhoods was 60 years old, with the highest representation being in the 60–64 age group. Most respondents had lived in the neighbourhood for more than 16 years but this varied by neighbourhood; for example, most respondents from Taman Perling and Taman Selesa Jaya had been living in these areas for longer than 16 years, but many respondents in Taman Nusantara had only been living there from 6 to 15 years as this area was developed later than Taman Perling and Taman Selesa Jaya. A majority of the respondents were Malay, with only a small number of Chinese and Indian, and most respondents were retired or unemployed. Unemployed, in this study context, mostly represents the housewives who are usually not employed and very few might be working part-time such as doing small business selling food. Lastly, family structure, in this study context, represents the living arrangement of the household. Most of the respondents seem to be living either as married couples or living with their working children. This is a normal trend among Malaysian families wherein Malaysian older adults prefers to live interdependent to their working adult children [
47].
3.2. Questionnaire Outcomes for Physical Neighbourhood Environment Subjective (PNES)
A summary of the PNES items and sub-items in the combined questionnaire are given in
Table 3. In consequence, the level of walkability correlated with an increase in PA level [
48,
49]. This means the higher the scores for the PNES measures, the higher the neighbourhood walkability and PA level.
The objective of item A was to measure the respondents’ residential density perceptions based on the NEWS-A scoring weight [
32], with higher numbers for residential density indicating higher walkability. For the other items, the scale range was from Strongly Disagree (1) to Strongly Agree (5). To properly reflect the Malaysian neighbourhood environment—places of worship, night markets, wet markets and clinics—several additions were made to questionnaire item B [
50]. Food stalls were also included as these were found to be a component of social liveability in Malaysian neighbourhoods in the pilot survey. The scores for the PNES were categorised into low, medium and high scores based on the 25th, 50th and 75th percentiles, and each PNE score was divided based on the 1st, 2nd and 3rd quartiles as there was no protocol to precisely measure the categorisation for low to high walkability based on the PNE scores. Higher scores in the NEWS-A items meant higher walkability but lower scores for traffic hazard and crime safety issues meant higher walkability [
32], due to a reverse scoring procedure.
Table 4 gives the descriptive statistics for the NEWS-A item results.
3.3. Questionnaire Outcomes for Physical Activity Level (PA)
For this study, the IPAQ for adults aged 15–64 years was considered suitable for this study. Although there is an existing IPAQ version specifically for older people aged 65 years and above, it was not employed as most respondents were late middle-aged adults who would soon enter retirement; the lower respondent age was 45 and the mean age was 60.
Different PA occur in different daily life domains; that is, the work, active transportation, domestic and garden, and leisure time activity domains. In all domains, three physical activity types were described [
46]: walking activities (PA1), moderate-intensity activities (PA2) and vigorous-intensity activities (PA3): and respondents were required to give details of the durations in minutes and frequencies, in days during the week spent on the different domains. PA1 consisted of walking with purpose, which was a mode of transport for most people with less mobility. Walking for recreation, however, referred to solely spending time on brisk walking for the purpose of exercising and maintaining health.
PA2 asked about recreation and sports activities and leisure activities such as gardening and doing house chores, and PA3 was also about recreation and sports activities and was similar to moderate activities. The major differences between the three PA types was related to the total time spent on each activity in a week. PA3 also included work-related activities such as running a business or selling food. Cycling activities were regarded as vigorous-intensity activities and were excluded from this study as it was an uncommon activity by the respondents in the neighbourhood. PA is categorised into five types in
Table 5.
The PA was measured subjectively (indirect) from the questionnaire as the respondents were asked how long they spent doing PA1, PA2 and PA3 in minutes per day in a week. Based on the IPAQ scoring protocol [
46], the physical activities were scored using continuous scores or categorical scores. For the continuous scores based on the IPAQ short form scoring protocol, average MET scores or weightings were derived for each type of physical activity: 3.3 METs for walking activities (PA1), 4.0 METs for moderate-intensity activities (PA2) and 8.0 METs for vigorous-intensity activities (PA3). Each of the average MET scores for PA1, PA2 and PA3 were then multiplied with minutes and days in a week. Total scores were also obtained by summing the MET scores for PA1, PA2 and PA3. From this, new cut off points were proposed that included the total PA performed in all types of domains: inactive (C1), minimally active (C2) and health-enhancing physically active or HEPA-active (C3). The criteria for these three levels were as follows: scores with MET-minutes and days per week below 600 were considered C1, scores with a minimum of 600 and above per week were C2 and scores with a minimum of 3000 and above per week were C3.
Table 6 illustrates the basic findings for the mean for the total continuous scores for the MET-minutes per week based on the C1, C2 and C3 scores for the respondents in the three neighbourhoods. The respondents in Taman Nusantara had the highest C1 and C2 averages, respondents in Taman Perling housing blocks had the highest C3 average and respondents in Taman Selesa Jaya had medium mean values for all physical activity categories.
3.4. Spatial Data on the Physical Neighbourhood Environment (PNEO)
The Geographic Information System (GIS) spatial data was obtained from the Iskandar Malaysia Development Authority and was based on 2012 land use data as the latest land use plan is yet to be made public by the local authority of Johor Bahru city. The GIS datasets— and use, road networks and public facilities—were combined and analysed to assess the objective physical measures of the neighbourhood environment. The analysis covered items such as the land use entropy index, population density, the proximity of neighbourhood facilities and traffic network accessibility.
Land use mix entropy has been commonly used to measure objective neighbourhood environments and land use mix diversity [
51]. Population density data in the study areas were extracted from the Johor Census Data [
52]. The population density ranges in Johor Bahru city were based on [
53]: highest (30,000–150,000 people per sq. km), moderately high (7000 people per sq. km), slightly high (5200 people per sq. km), medium (3330 people per sq. km) and low (1500 people per sq. km).
To measure the connectivity, the intersection densities were analysed using ArcGIS, and computed as the total number of crossings per unit area excluding cul-de-sacs from the centre of a location. The centre of a location refers to all respondents’ locations which were obtained by acquiring the road names of their house address. A buffer of 200 metres from the centre of the location was assigned in this study as the preferred walking distance for older Malaysian people [
27,
42], with a higher intersection density indicating a higher connectivity in the specified area [
54]. To measure accessibility, the distances from each respondent’s road address to two facilities commonly usually used by the older Malaysian adults—recreational open space and the mosque [
50]: were analysed using ArcGIS, with the distances being classified using SPSS into low, medium and high, based on the interval cut off points for the mean and a +1/−1 standard deviation. The distance scales were assumed to show variability in the relationships between the objective and the perceived PNE measures.
Table 7 gives a simple summary of the PNEO measures for the three neighbourhoods.
4. Results & Discussions
The results were based on the correlation tests, and the measures that had no significant relationships across the four neighbourhood areas were excluded from the tables. The second part of this section details the significant relationships that were found. The Goodman-Kruskal Gamma were employed to determine the significant relationships due to the nature of the variables. This correlation test was used to measure the strength of the associations between the ordinal variables of PNEO, PNES and PA. The Gamma value ranged from −1 to +1, and the strengths of association varied from 0.00 < 0.10: Negligible, 0.10 < 0.20: Weak, 0.20 < 0.40: Moderate, 0.40 < 0.60: Relatively strong, 0.60 < 0.80: Strong, and 0.80 < 1.00: Very strong [
55]. A positive gamma meant that both variables scored high and a negative gamma meant that one variable scored high and the other variable scored low. A MET PA level of C1 indicated inactive respondents, C2 indicated they were minimally active and C3 indicated that they were HEPA-active [
47].
4.1. Significant Relationships between the PNEO, the PNES and the PA
Based on the analysis, the results for the PNEO showed that population density, distance to mosque, distance to playground and land use mix entropy had significant associations with the PA level of the older adults in three neighbourhoods (
Table 8). The PNES results also showed that there were significant associations with residential density, land use mix diversity, land use mix access, street connectivity, traffic hazard safety, safety from crime, lack of parking, lack of cul-de-sacs, hilliness and physical barriers (
Table 8).
4.2. Discussions
The varying significant relationships found in the different neighbourhood settings were assumed to be, because of the small-scale physical features of the different neighbourhood characteristics. This section discusses the assumptions underlying these significant relationships.
4.2.1. Model 1 (Perling Terrace)
Despite some studies [
19] finding land use mix to be insignificant to PA, a relatively strong relationship between land use mix entropy and the PA level was found for the older people living in the terraced housing in Taman Perling. The high land use mix value indicated that the respondents were C1, which was unlikely to happen as older adults would usually show high levels of PA in high mixed land use neighbourhoods [
20]. Since most respondents were living near the main road, it is possible that their extent of PA was reduced because of the fast-speed vehicles passing through the street which might endanger the safety of the older adults.
Six PNES measures were shown to have strong relationships with PA: land use mix access, street connectivity, safety from crime, lack of cul-de-sacs, hilliness and physical barriers, with the lack of cul-de-sacs showing a perfect association of 1. When there were low land use mix access areas, the respondents tended to have a low PA level (C1). As land use mix access measures accessibility perception, a low accessibility in the housing areas indicated that the respondents perceived that there were not many stores and not many places within walking distance from their home; therefore, because it was not possible to easily walk to destinations in their home vicinity, there was a low PA level.
The street connectivity perception was also associated with the PA as people who perceived their neighbourhood to have a higher street connectivity tended to have higher PA levels and vice versa. As street connectivity measures the distance between traffic intersections and the alternative routes available in the neighbourhood, if there are strong street connectivity perceptions, there would be a higher PA (C3) because of the higher extent of physical activity in the recreation areas [
23] and the higher possibility of walking to interact with friends in the neighbourhood. Conversely, respondents who perceived that there was a low street connectivity tended to have a PA of C1. While [
24,
56] suggested that perceived street connectivity was usually positively associated with a high PA in older adults, as pointed out in [
25], low street connectivity hinders PA levels because the areas usually have longer rows of housing, less traffic intersections and a higher number of dead-end roads less conducive for walking; therefore, the results of this study add to existing knowledge.
A low perception of safety from crime would logically mean people perceive a low crime rate level and felt safe in their housing vicinity, which would logically result in a higher PA level [
38]. Interestingly, a low safety from crime perception was observed when adults showed a PA of C1 whereas a medium safety from crime perception was observed among adults who showed C2. Based on this trend, it is assumed that older adults who are more active in various physical activities tend to be more aware and conscious with their surrounding environment when compared to inactive older adults.
The perceptions towards hilliness and physical barriers were found to be strongly but negatively associated with PA, with the respondents who answered low to these two measures tending to have a PA of C2. While this neighbourhood does not have hilly topography, it does have a major physical highway or freeway barrier that divides the neighbourhood. However, on a micro-scale and focusing on the location of the respondents who answered this question, there were no physical barriers such as drainage or hilly streets within their home vicinity, which should have resulted in a higher likelihood to walk around the neighbourhood.
4.2.2. Model 2 (Perling Housing Blocks)
Important relationships between PA and PNEO were found for population density, distance to mosque and distance to recreational areas. Housing blocks in this neighbourhood have higher population densities as these are medium-rise residential blocks. Interestingly, the respondents living in high population density areas within the housing blocks were generally found to have a PA of C1, probably because the nearest grocery stores were on the ground floors of their residential blocks. Distance to the mosque had a significant relationship with a respondent’s PA; that is, respondents who lived closer to the mosque (200 m–300 m) were more likely to be C1. Due to the mosque facility being located near and adjacent to the housing block area, there is no direct pedestrian access from the housing blocks to the mosque. Therefore, the older adults have to walk outside the housing block boundary to go to the mosque, which may prevent them from walking to the mosque (
Appendix B,
Figure A5).
The distance to the open recreational areas was negatively associated with PA. People living further (more than 370 m) from the recreational areas tended to be C1 whereas people living a medium distance (214 m–370 m) from the recreational areas tended to be C2. As there are no open spaces inside the housing blocks’ vicinities, older adults have to use open space and recreational areas outside the housing blocks; therefore, the further the recreational areas, the lower the likelihood of the older adults walking and spending time there. Therefore, facilities such as recreational areas and mosques should be located no more than 370 m from housing areas to encourage older adults to stay active.
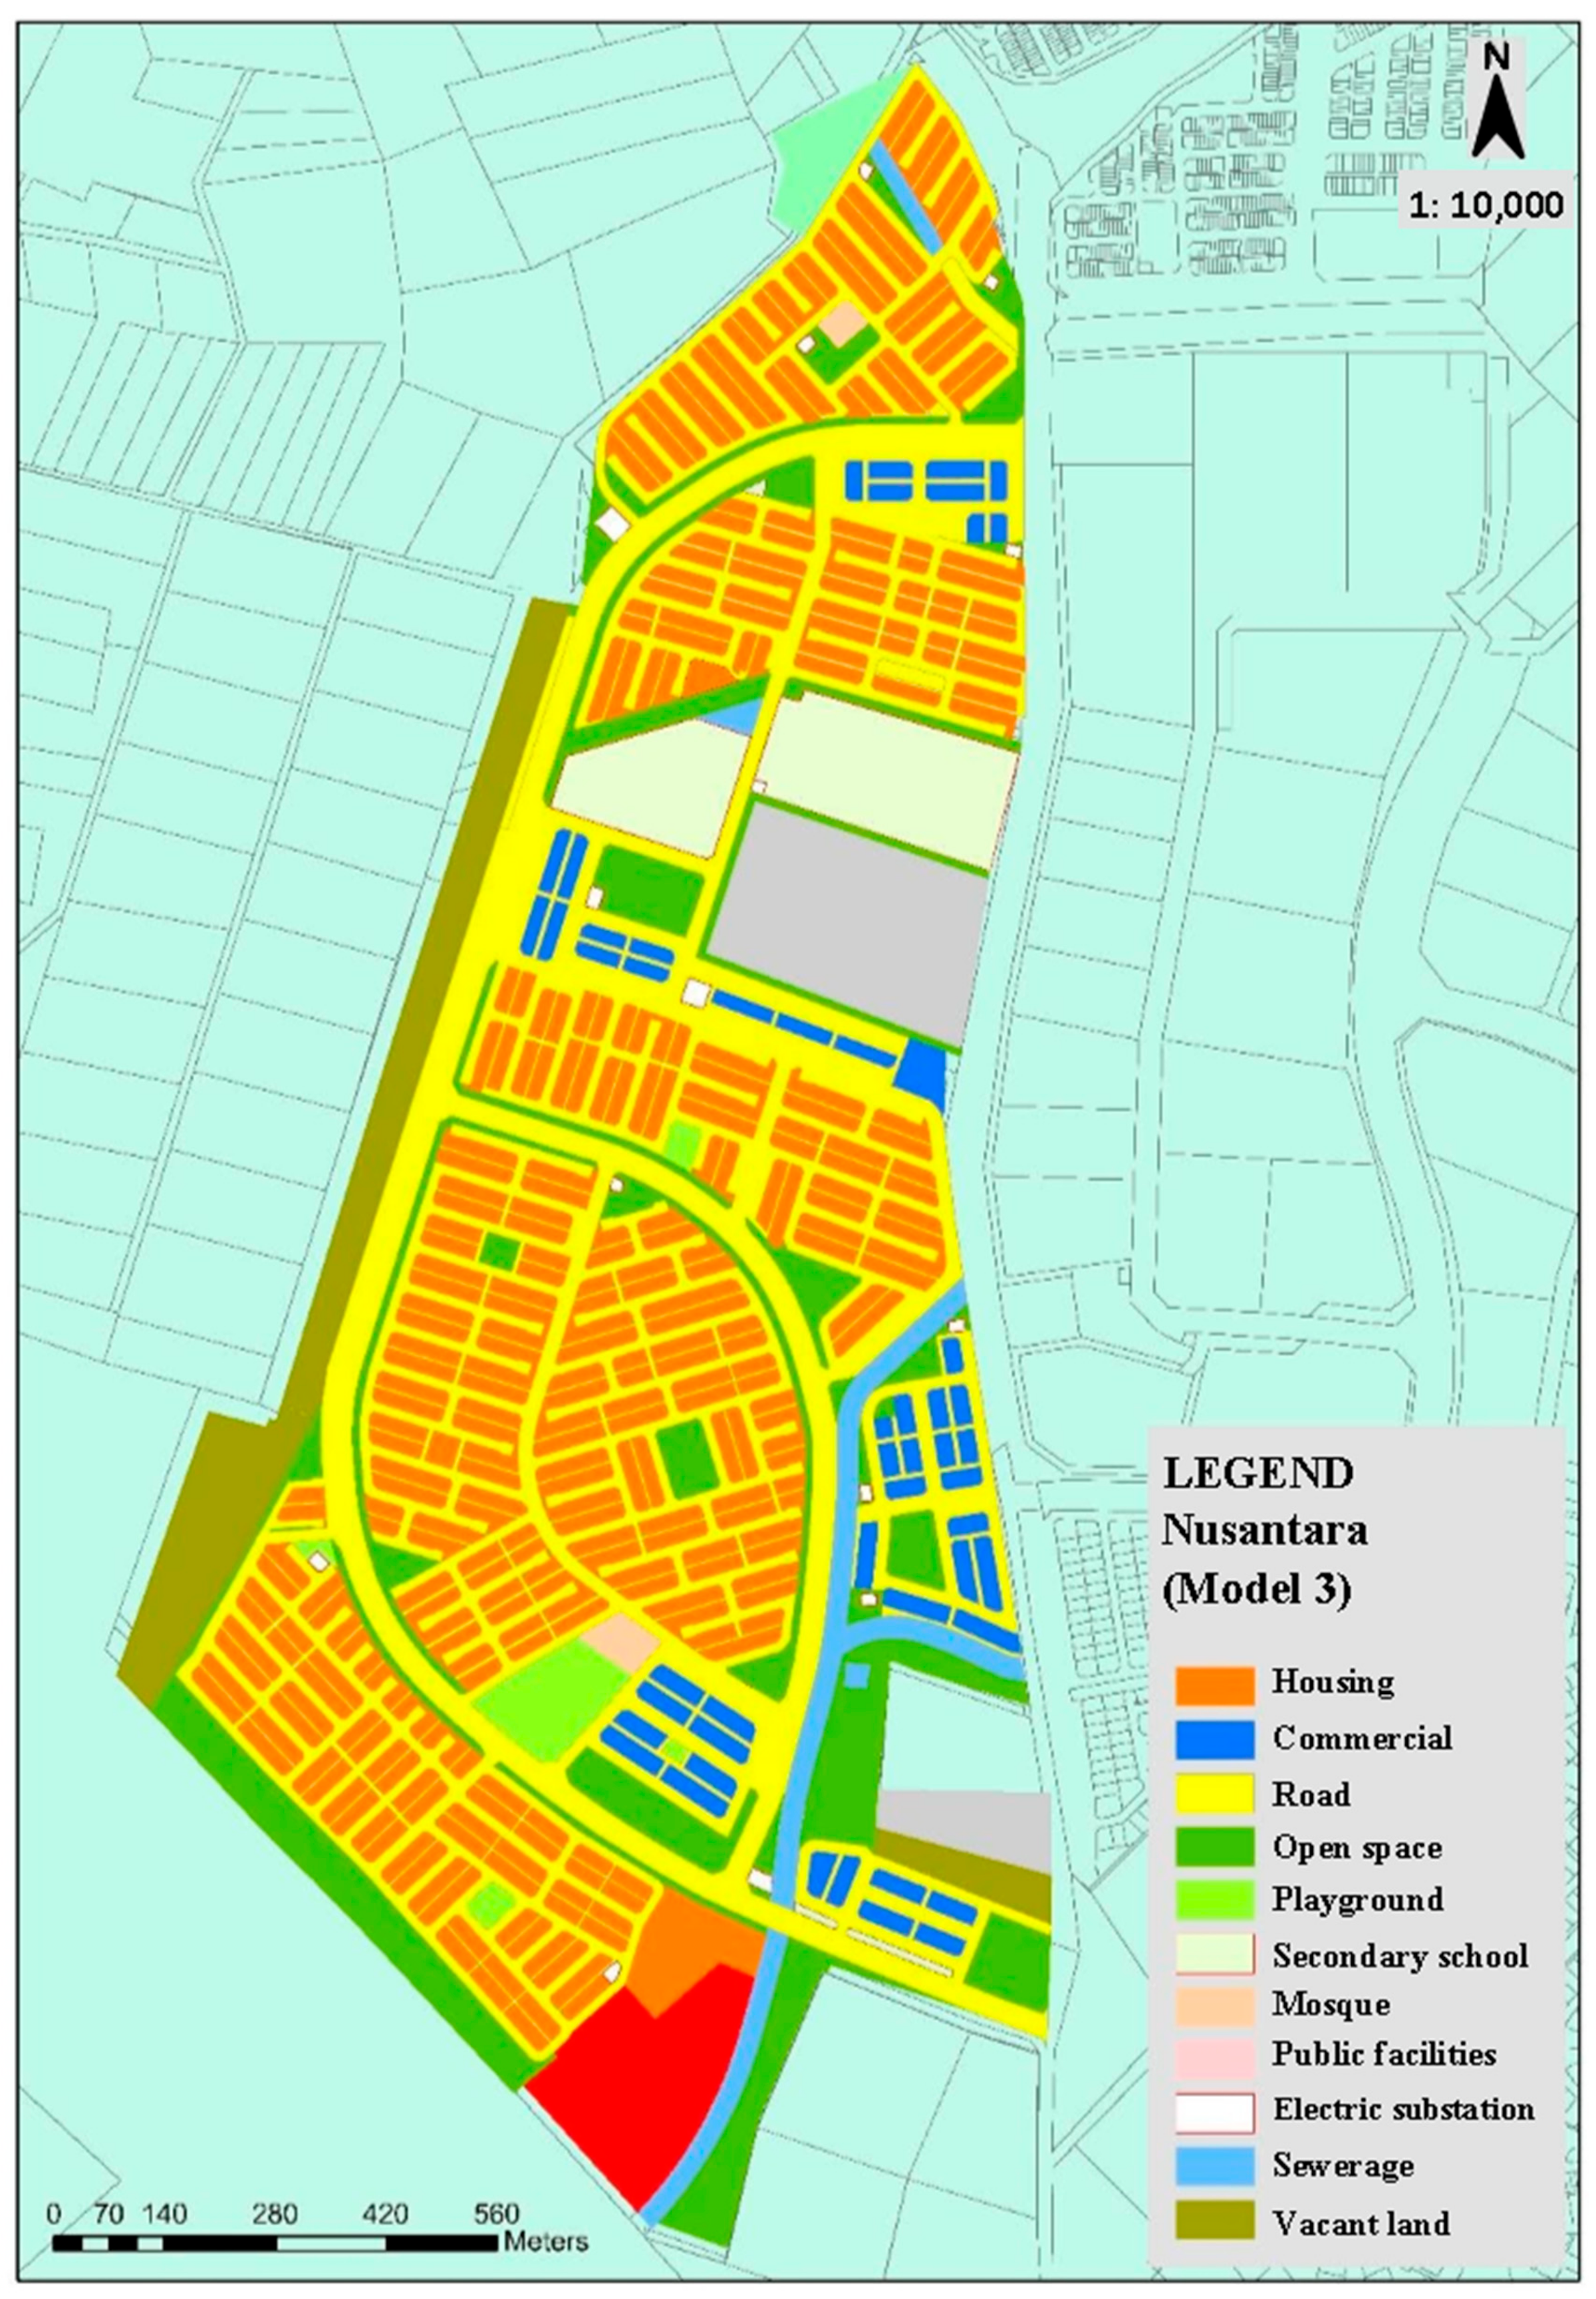
4.2.3. Model 3 (Nusantara)
Several PNEO were found to have significant associations with PA. However, while the Perling housing blocks’ distance to the open recreational area was positively associated with PA, the people living less than 210 m away tended to be C1. An investigation found that even though most respondents were living only a short distance from the only main and fully functional community facilities such as the open recreational facilities and the mosque (
Figure A6), they were separated from these facilities by a main road, and a distinct feature of this neighbourhood was that the residential area was divided into several districts based on the main road positioning. As the main road has an iron median strip (
Figure A7), the open recreational spaces could not be directly accessed because there is a drainage line that is impossible to cross without a small bridge or road (
Figure A7). Therefore, these features and possible traffic hazards could prevent the older adults from walking to the facilities.
Four PNES measures were found to have a significant relationship with PA. First, the land use mix diversity was negatively associated with the PA. Respondents who believed that there was a high land use mix diversity tended to be C1, which was the opposite of the results in [
57]. High land use mix diversity indicates that there is only a short distance to diverse land use in the respondent’s location. Therefore, it was assumed that most respondents were displaced from the main facilities such as open recreational facilities and the mosques because of main road and residential segregation in the different districts.
Second, a low safety from traffic hazard perception would typically indicate higher walkability and therefore higher PA [
30]. However, contrary to this general assumption, the respondents who perceived low traffic hazard safety tended to report a PA of C1. A review of the respondents within each residential district found that they were not living near the main roads, as can be seen on the map (
Figure A6). The respondents in the upper part of the neighbourhood tended to be located further from the main facilities, so possibly would not choose to walk, and while the respondents in the lower part were located nearer to the main facilities, they were obstructed by the main road and the grass-strip boundary, so they would also possibly not choose to walk.
Third, the lack of parking and lack of cul-de-sacs were negatively associated with PA. People who perceived that there was a low lack of parking tended to be at least minimally active (C2) whereas people who perceived there were a low lack of cul-de-sacs tended to be very active (C3). Higher scores for the lack of parking indicated a lack of parking in the local commercial area, which helped to promote walking to the local commercial area [
39] and higher PA. However, low scores for a lack of parking in commercial areas meant that as there were many parking spaces, C1 would be more likely; however, in this case, most respondents reported C2. This result may have been because respondents in Nusantara spent more time on recreational and leisure activities that did not involve walking activities within their home vicinity, as shown in
Table 6. Low scores for lack of cul-de-sacs indicated that there were a higher number of cul-de-sac streets, which should be associated with a higher walking PA [
9]. The results showed that respondents who gave lower lack of cul-de-sac scores tended to indicate a PA of C3. Therefore, contrary to [
21], this study found that a greater number of cul-de-sacs resulted in a PA of C3, possibly because every cul-de-sac in Nusantara has a small pedestrian lane to the other street, which increases the likelihood that respondents in Nusantara would walk easily around in their home vicinities but only within their residential district boundaries.
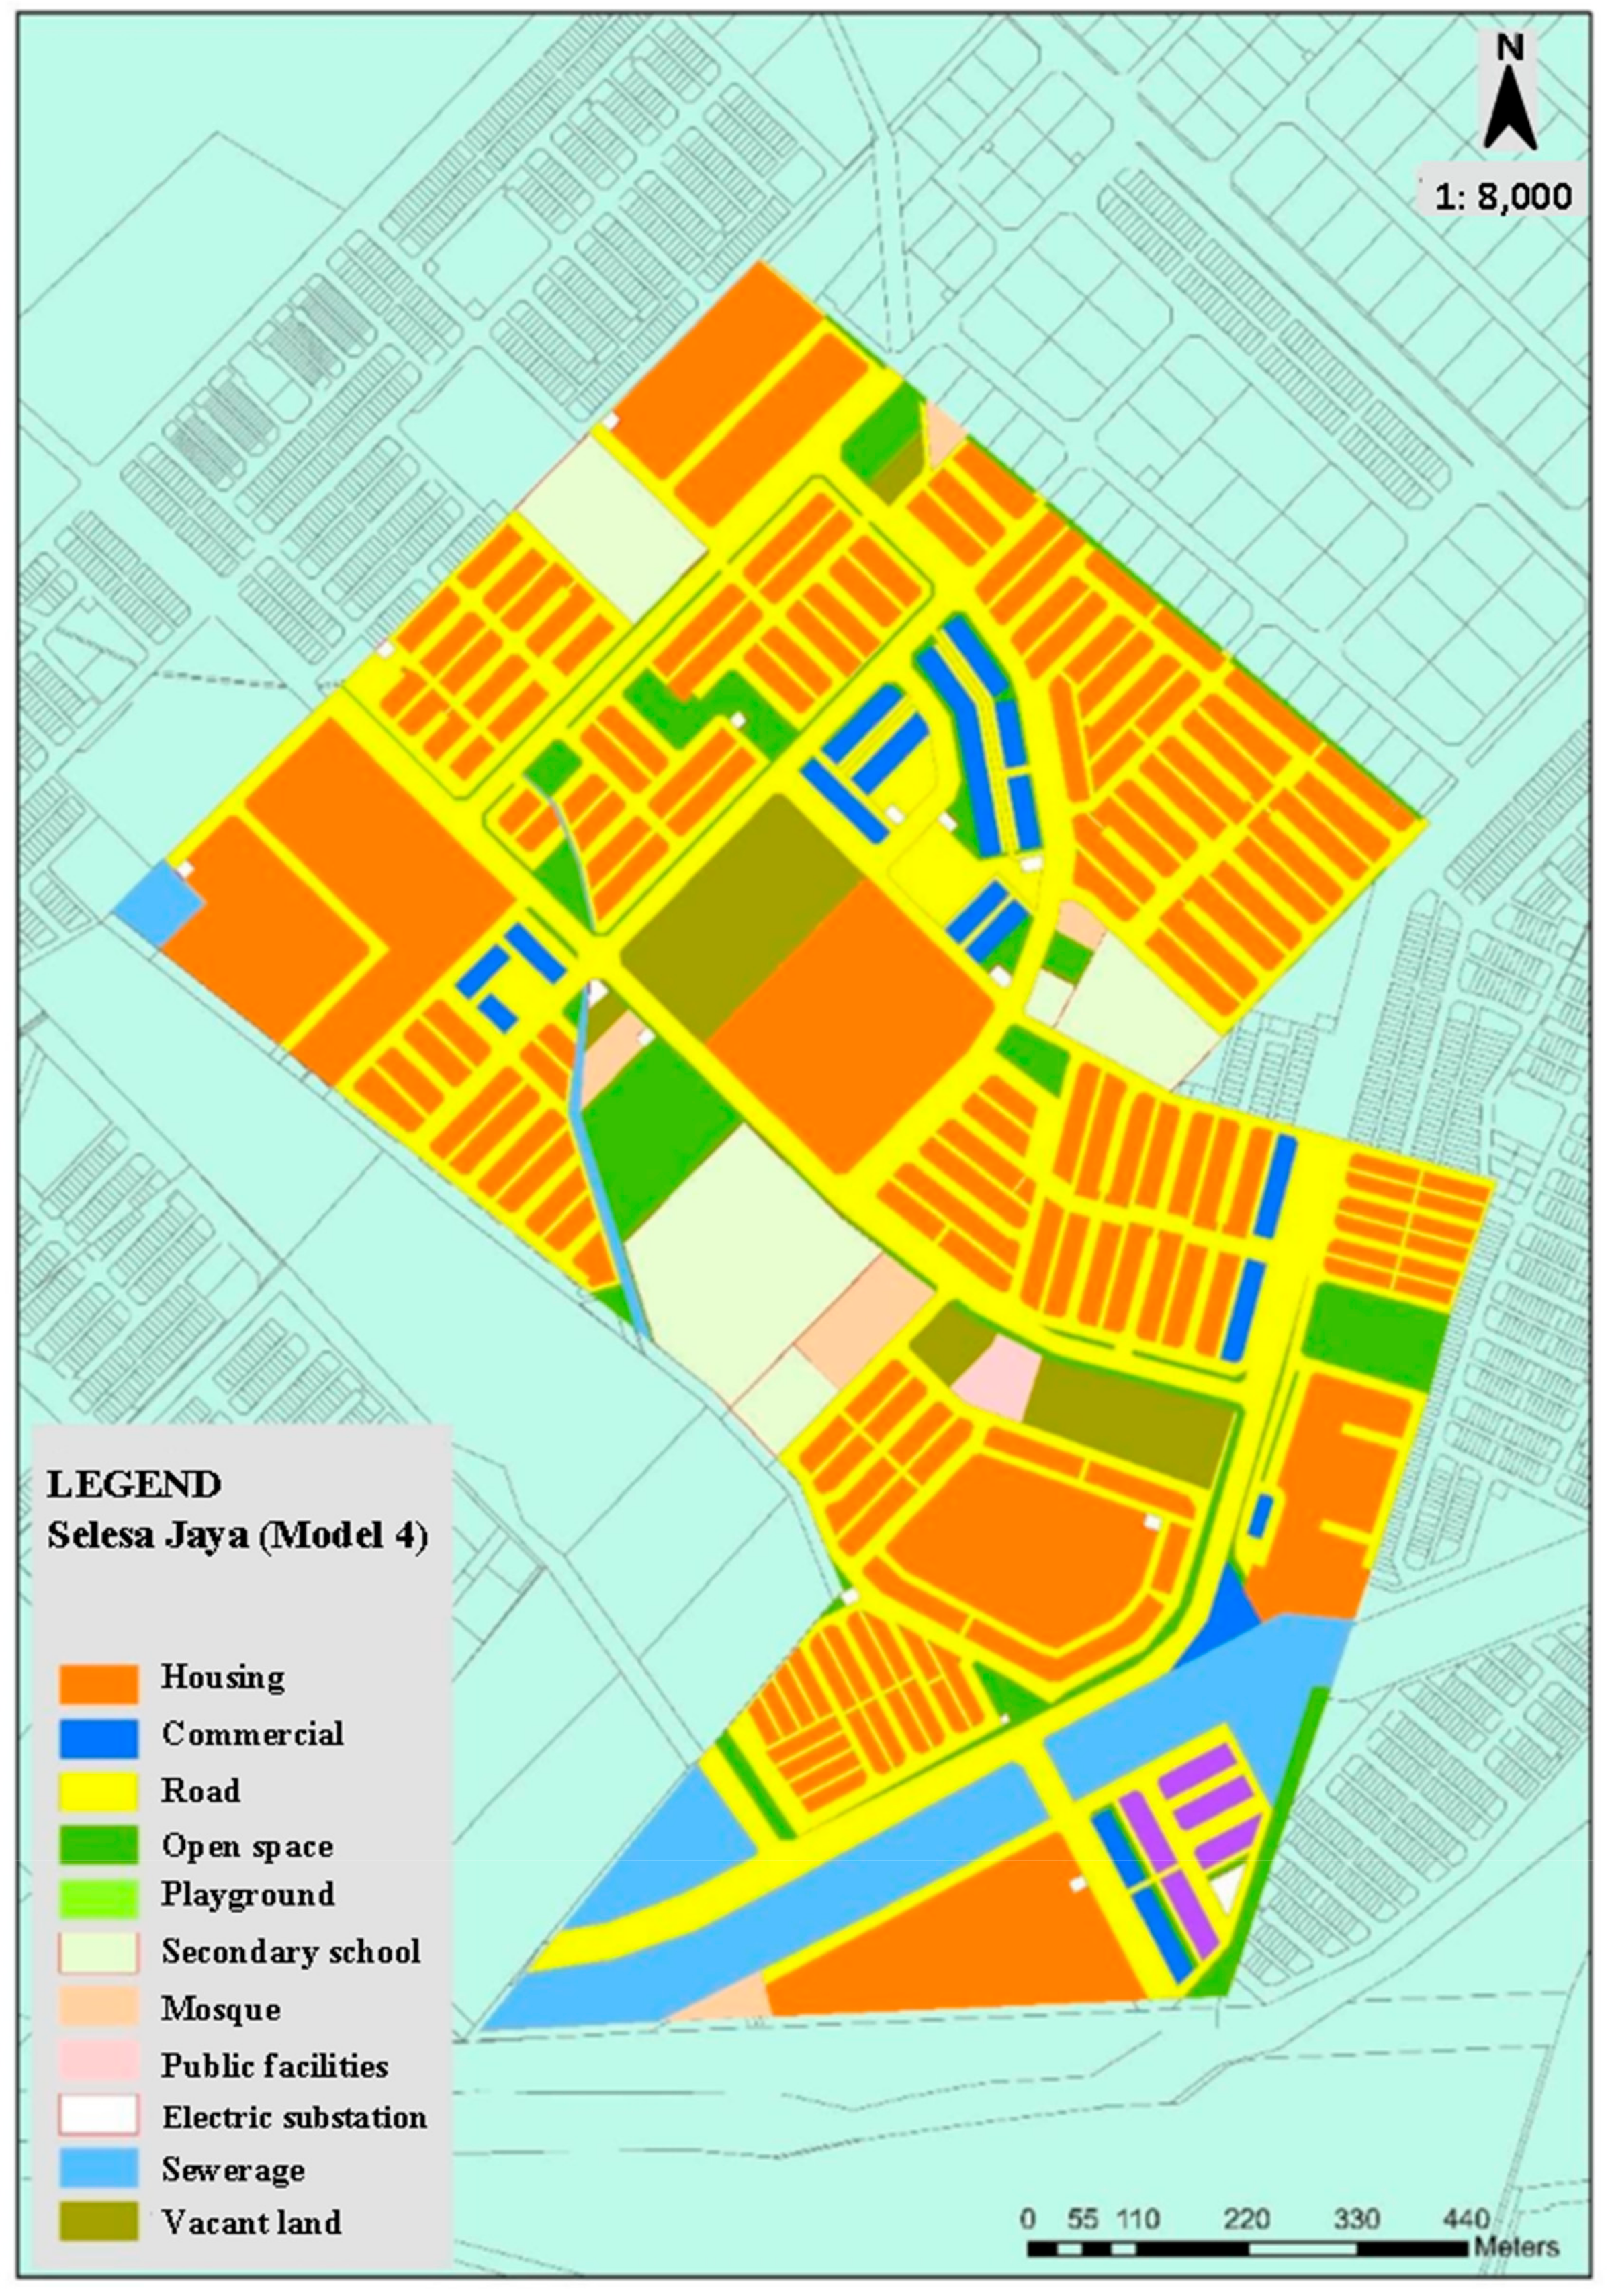
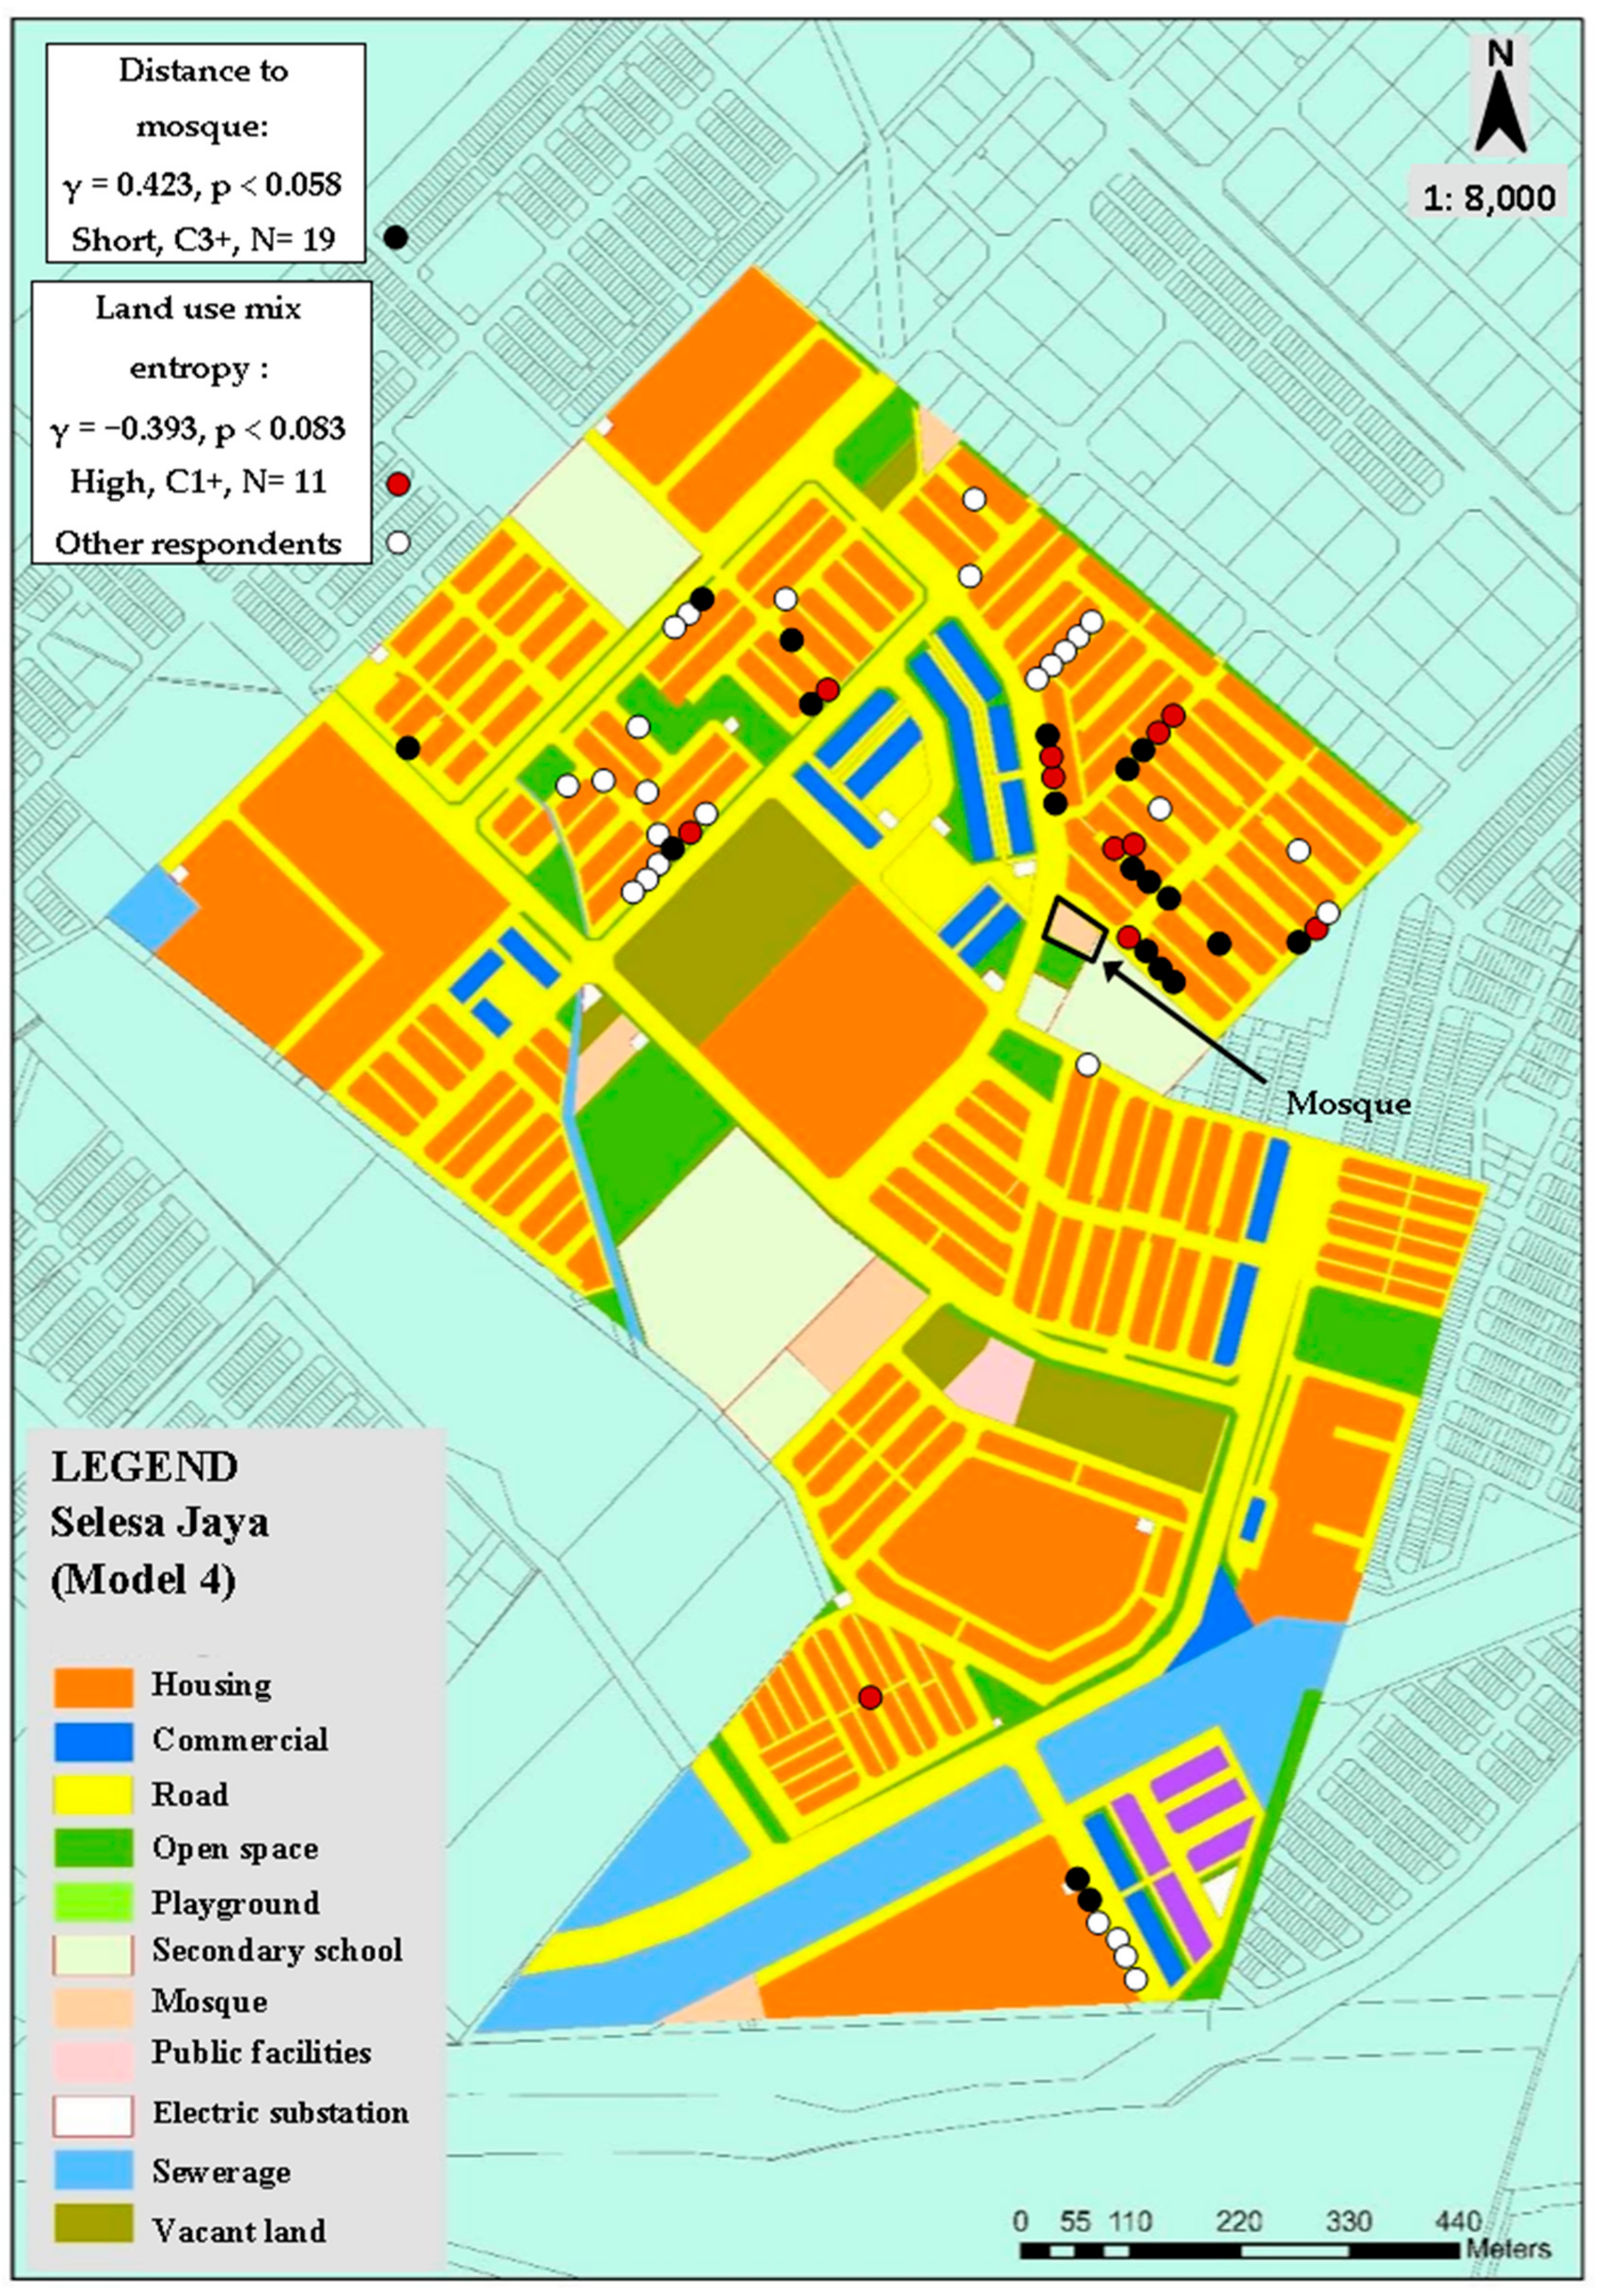
4.2.4. Model 4 (Selesa Jaya)
In this neighbourhood, two PNEO measures and three PNES measures showed good associations with PA: the distance to the mosque, the land use mix entropy and residential density, land use accessibility and safety from traffic hazard perceptions. Respondents who lived less than 200 m from the mosque tended to report a PA of C3, which supported the results in [
27] which showed adults prefer to walk less than 200 metres to community facilities before choosing to drive. A study by [
42] also found that the suitable maximum walking distance for older adults in Malaysia was usually 190 metres. However, the respondents living in lower land use mix entropy tended to report C1 in this neighbourhood as lower land use mix tends to hinder the likelihood of walking to various destinations in the neighbourhood.
Respondents who perceived that there was high residential density tended to report a PA of C1, which was contrary to most studies in Western countries, in which residential density was usually positively associated with PA [
21,
36]; however, this result was in line with a previous Asian study [
22]. As the respondents’ locations were similar to the respondents’ location for land use mix entropy, the respondents living in the high residential density area may be inactive because of low land use mix entropy.
Land use mix access is a measure of accessibility, with high accessibility more likely to result in higher PAs (C2 and C3) as there are many places within walking distance. The respondents’ locations clearly showed that they could easily walk to the nearest commercial area and the bus stops (
Figure A8). The low safety from traffic hazard perception also indicated a higher possible walkability score [
32]. It was found that the respondents who reported C2 had a low traffic hazard safety perception, which made sense as the respondents were not located near a main road and were within walking distance to grocery stores.
4.3. Overall Trend
To summarise, the aim of this study was to investigate the objective and subjective PNE associations with the PA levels in older adults. It was found that both objective and subjective PNE in the different housing environments significantly influenced the PA levels of the late middle-aged and young-old adults. Four measures of PNEO were directly related to PA levels of older adults and ten measures of PNES were indirectly related to PA level, with underlying assumptions based on the different physical neighbourhood characteristics. To the best of our knowledge, there have been no previous studies on the relationships between PNEO, PNES and PA in older adults in any Malaysian neighbourhoods.
5. Study Limitations
The major limitation in this study was related to the study areas as the respondent location distributions were only focused in certain parts of the neighbourhood areas within the various neighbourhood association boundaries. First, in Malaysia, neighbourhood associations are developed by the community when there is a need; therefore, the members voluntarily participated in this questionnaire. However, not all neighbourhoods have neighbourhood associations, which means that our research was restricted to the respondents associated with the neighbourhood associations. Second, the findings of this study only apply to late middle-age adults and young-old adults and are not representative of the whole population in each neighbourhood. This was because only a small portion of the residents volunteered and due to time limitations, only adequate sampling was conducted.
Third, this study mainly examined older Malay and Muslim adults, as only a small number of people from other backgrounds and religions were included in this study, which was not sufficient to determine any differences in their daily physical activities. Fourth, the data distribution for each of the objective and subjective PNE indicators could have limited the study outcomes. The low, medium and high range scales were based on a normal data distribution, with any indicators indicating non-normal distribution being adjusted to be normal. While several comparisons were conducted to examine how the data distribution affected the study results, the PNE objective and subjective range scales were considered reasonable. Lastly, missing values in some of the questions could not be avoided even though eligible enumerators were included in the questionnaire. This was because of the complexity of the questionnaire, which took around 20 to 30 min to complete for each respondent, which influenced the respondent’s likeliness to further cooperate.
6. Conclusions and Recommendations
All objective physical neighbourhood elements were found to have direct relationships with the older respondents’ PA levels and almost all subjective physical neighbourhood elements were found to have an indirect relationship with the respondents’ PA levels; however, the distinct physical environmental characteristics in each neighbourhood were found to influence the PA levels. The inclusion of the young-old adults PA activity types—walking, moderate-intensity and vigorous-intensity—contributed to the PA categories (inactivity, minimally active, HEPA).
The key findings were closely related to the recommended distance from facilities, and especially the mosque. Therefore, it is recommended that mosques or ‘musolla’ be no more than 200 metres from residential land to encourage a higher likelihood of PA in older Malaysian adults. It was found that as most respondents had less access to the mosque and open recreational facilities, more mosques and small recreation areas should be provided in neighbourhoods to promote active ageing lifestyles. A further important finding was that high population density was not always positively related to a higher PA, and therefore in the Malaysian context, might not be suitable housing environments to encourage active ageing. The recreation area types are also important in promoting PA; for example, as most of the open recreation areas in this study were specially designed for the younger generation, older adults were less likely to spend time on outdoor recreational activities.
All sample neighbourhoods seemed to have similar physical characteristics that prevented physical activities, such as iron road median barriers and open drainage lines that cannot be crossed without a bridge. Even though most respondents were living within walking distance of a mosque and open recreational areas, these types of barriers influenced the extent of their PA. Therefore, it is recommended that the road median have a cut off point and small pedestrian bridges be built every 200 m for pedestrians to cross. These types of changes have proven to be effective in Model 4 (Selesa Jaya) as most respondents living close to the mosque tended to have high PA levels because of the small informal pedestrian bridges every 50 m along the drainage line.
This study highlighted the importance of both objective and subjective measures which affect the extent of physical activity among young-old adults for small geographic units which are represented by the detailed outcomes of the specific neighbourhood case studies. The outcome of this study is deemed as generalisable to most ageing neighbourhoods in Malaysian urban cities considering the similar housing characteristics of terraced housing and housing blocks built environment. Nonetheless, further investigations are needed to explore the distinctive outputs for other types of housing in Malaysia, which may have influence on the physical activity level of older adults.
In conclusion, to encourage active ageing, the physical neighbourhood characteristics need to be suitable. For example, to encourage PA outside the vicinity of their homes, mosques and recreational areas need to be within 200 to 370 metres in residential areas, and there needs to be a continuous pedestrian network. Furthermore, a high population density housing environment is proven unsuitable to promote active ageing among older adults. Therefore, when planning for a future ageing society and to encourage active ageing lifestyles in Malaysian neighbourhoods, these objective and subjective PNE indicators need to be promoted.
Author Contributions
N.N. conducted fieldwork, developed conceptual framework and methodology, result analysis, drafted manuscript and finalised it. H.N. supervised the entire study, provided suggestions on the draft manuscript and conducted proofreading. All authors have read and agreed to the published version of the manuscript.
Funding
This research received no external funding.
Acknowledgments
We would like to thank all the respondents in Taman Perling, Taman Nusantara and Taman Selesa Jaya who had participated in the questionnaire survey. We would also like to acknowledge the cooperation from the neighbourhood association committee members in the neighbourhoods.
Conflicts of Interest
The authors declare no conflict of interest.
Appendix A
Figure A1.
Land Use Map of Taman Perling terrace house (Model 1).
Figure A1.
Land Use Map of Taman Perling terrace house (Model 1).
Figure A2.
Land use map of Taman Perling housing blocks (Model 2).
Figure A2.
Land use map of Taman Perling housing blocks (Model 2).
Figure A3.
Land use map of Taman Nusantara (Model 3).
Figure A3.
Land use map of Taman Nusantara (Model 3).
Figure A4.
Land use map of Taman Selesa Jaya (Model 4).
Figure A4.
Land use map of Taman Selesa Jaya (Model 4).
Appendix B
Figure A5.
Respondent’s Location for Taman Perling housing blocks (Model 2).
Figure A5.
Respondent’s Location for Taman Perling housing blocks (Model 2).
Figure A6.
Respondent’s Location for Taman Nusantara (Model 3).
Figure A6.
Respondent’s Location for Taman Nusantara (Model 3).
Figure A7.
Barriers in Taman Nusantara (Model 3).
Figure A7.
Barriers in Taman Nusantara (Model 3).
Figure A8.
Respondent’s Location in Taman Selesa Jaya (Model 4).
Figure A8.
Respondent’s Location in Taman Selesa Jaya (Model 4).
References
- Hedrich, W.; Tan, J.; Chalmers, B.; Yeo, J. Advancing into the Golden Years -Cost of Healthcare for Asia Pacific’s Elderly; Asia Pacific Risk Center: Singapore, 2016; Volume 4. [Google Scholar]
- Kampfen, F.; Wijemunige, N.; Evangelista, B., Jr. Aging, non-communicable diseases, and old-age disability in low- and middle-income countries : A challenge for global health. Int. J. Public Health 2018, 63, 1011–1012. [Google Scholar] [CrossRef] [PubMed] [Green Version]
- World Health Organization. Global Health Projections Report; World Health Organization: Geneva, Switzerland, 2018. [Google Scholar]
- Milanovic, Z.; Pantelic, S.; Trajkovic, N.; Sporis, G.; Kostic, R.; James, N. Age-related decrease in physical activity and functional fitness among elderly men and women. Clin. Interv. Aging 2013, 8, 549–556. [Google Scholar] [CrossRef] [PubMed] [Green Version]
- Chan, Y.Y.; Sooryanarayana, R.; Mohamad Kasim, N.; Lim, K.K.; Cheong, S.M.; Kee, C.C.; Lim, K.H.; Omar, M.A.; Ahmad, N.A.; Mohd Hairi, N.N. Prevalence and correlates of physical inactivity among older adults in Malaysia: Findings from the National Health and Morbidity Survey (NHMS). Arch. Gerontol. Geriatr. 2019, 81, 74–83. [Google Scholar] [CrossRef] [PubMed]
- WHO. Active Ageing: A Policy Framework. Aging Male 2002, 5, 1–37. [Google Scholar] [CrossRef]
- Gautam, R.; Saito, T.; Kai, I. Leisure and religious activity participation and mental health: Gender analysis of older adults in Nepal. BMC Public Health 2007, 7, 1–11. [Google Scholar] [CrossRef] [Green Version]
- Rebecchi, A.; Buffoli, M.; Dettori, M.; Appolloni, L.; Azara, A.; Castiglia, P.; Capolongo, S. Walkable Environments and Healthy Urban Moves: Urban Context Features Assessment Framework Experienced in Milan. Sustainability 2019, 11, 2778. [Google Scholar] [CrossRef] [Green Version]
- Bartshe, M.; Coughenour, C.; Pharr, J. Perceived walkability, social capital, and self-reported physical activity in Las Vegas college students. Sustainability 2018, 10, 3023. [Google Scholar] [CrossRef] [Green Version]
- Kerr, J.; Rosenberg, D.; Frank, L. The Role of the Built Environment in Healthy Aging: Community Design, Physical Activity, and Health among Older Adults. J. Plan. Lit. 2012, 1–2. [Google Scholar] [CrossRef]
- Rosso, A.L.; Auchincloss, A.H.; Michael, Y.L. The Urban Built Environment and Mobility in Older Adults : A Comprehensive Review. J. Aging Res. 2011. [Google Scholar] [CrossRef] [Green Version]
- Sayegh, A.; Andreani, S.; Kapelonis, C.; Polozenko, N.; Stanojevic, S. Experiencing the built environment: Strategies to measure objective and subjective qualities of places. Open Geospat. DataSoftw. Stand. 2016, 1, 1–7. [Google Scholar] [CrossRef] [Green Version]
- Nyunt, M.S.Z.; Shuvo, F.K.; Eng, J.Y.; Yap, K.B.; Scherer, S.; Hee, L.M.; Ng, T.P. Objective and subjective measures of neighborhood environment (NE): Relationships with transportation physical activity among older persons. Int. J. Behav. Nutr. Phys. Act. 2015, 12, 1–10. [Google Scholar] [CrossRef] [PubMed] [Green Version]
- Thornton, C.M.; Kerr, J.; Conway, T.L.; Saelens, B.E.; Sallis, J.F.; Ahn, D.K.; Frank, L.D.; Cain, K.L.; King, A.C. Physical Activity in Older Adults: An Ecological Approach. Ann. Behav. Med. 2017, 51, 159–169. [Google Scholar] [CrossRef] [PubMed] [Green Version]
- Hawkesworth, S.; Silverwood, R.J.; Armstrong, B.; Pliakas, T.; Nanchalal, K.; Jefferis, B.J.; Sartini, C.; Amuzu, A.A.; Wannamethee, S.G.; Ramsay, S.E.; et al. Investigating associations between the built environment and physical activity among older people in 20 UK towns. J. Epidemiol. Community Health 2018, 72, 121–131. [Google Scholar] [CrossRef] [PubMed] [Green Version]
- Zawawi, R.H. Active Ageing in Malaysia. In Proceedings of the Second Meeting of the Committee on “International Cooperation on Active Ageing”, Tokyo, Japan, 19 July 2013; pp. 1–18. [Google Scholar]
- Hanibuchi, T.; Kondo, K.; Nakaya, T.; Shirai, K.; Hirai, H.; Kawachi, I. Does walkable mean sociable? Neighborhood determinants of social capital among older adults in Japan. Health Place 2012, 18, 229–239. [Google Scholar] [CrossRef] [PubMed]
- Oliver, L.; Schuurman, N.; Hall, A.; Hayes, M. Assessing the influence of the built environement on physical activity for utility and recreation in suburban metro Vancouver. BMC Public Health 2011, 11, 959–968. [Google Scholar] [CrossRef] [PubMed] [Green Version]
- Wei, Y.D.; Xiao, W.; Wen, M.; Wei, R. Walkability, land use and physical activity. Sustainability 2016, 8, 65. [Google Scholar] [CrossRef] [Green Version]
- Christian, H.E.; Bull, F.C.; Middleton, N.J.; Knuiman, M.W.; Divitini, M.L.; Hooper, P.; Giles-Corti, B. How important is the land use mix measure in understanding walking behaviour? Results from the RESIDE study. Int. J. Behav. Nutr. Phys. Act. 2011, 8, 55. [Google Scholar] [CrossRef] [Green Version]
- Hajna, S.; Ross, N.A.; Brazeau, A.S.; Bélisle, P.; Joseph, L.; Dasgupta, K. Associations between neighbourhood walkability and daily steps in adults: A systematic review and meta-analysis. BMC Public Health 2015, 15. [Google Scholar] [CrossRef] [Green Version]
- Wang, Z.; Qin, Z.; He, J.; Ma, Y.; Ye, Q.; Xiong, Y.; Xu, F. The association between residential density and physical activity among urban adults in regional China. BMC Public Health 2019, 19, 1–7. [Google Scholar] [CrossRef] [Green Version]
- Kaczynski, A.T.; Koohsari, M.J.; Stanis, S.A.W.; Bergstrom, R.; Sugiyama, T. Association of street connectivity and road traffic speed with park usage and park-based physical activity. Am. J. Health Promot. 2014, 28, 197–203. [Google Scholar] [CrossRef]
- Wu, Z.; Song, Y.; Wang, H.; Zhang, F.; Li, F.; Wang, Z. Influence of the built environment of Nanjing’s Urban Community on the leisure physical activity of the elderly : An empirical study. BMC Public Health 2019, 19, 1–11. [Google Scholar] [CrossRef] [PubMed]
- Berrigan, D.; Pickle, L.W.; Dill, J. Associations between street connectivity and active transportation. Int. J. Health Geogr. 2010, 9, 1–18. [Google Scholar] [CrossRef] [PubMed] [Green Version]
- Ying, Z.; Ning, L.D.; Xin, L. Relationship between built environment, physical activity, adiposity, and health in adults aged 46-80 in Shanghai, China. J. Phys. Act. Health 2015, 12, 569–578. [Google Scholar] [CrossRef] [PubMed]
- Azmi, D.I.; Karim, H.A. A Comparative Study of Walking Behaviour to Community Facilities in Low-Cost and Medium Cost Housing. Procedia Soc. Behav. Sci. 2012, 35, 619–628. [Google Scholar] [CrossRef] [Green Version]
- Ribeiro, A.I.; Pires, A.; Carvalho, M.S.; Pina, M.F. Distance to parks and non-residential destinations influences physical activity of older people, but crime doesn’t: A cross-sectional study in a southern European city. BMC Public Health 2015, 15, 1–12. [Google Scholar] [CrossRef] [Green Version]
- Merriam, S.B.; Mohamad, M. How Cultural Values Shape Learning in Older Adulthood: The Case of Malaysia. Adult Educ. Q. 2000, 51, 45–63. [Google Scholar] [CrossRef]
- Oyeyemi, A.L.; Adegoke, B.O.; Sallis, J.F.; Oyeyemi, A.Y.; De Bourdeaudhuij, I. Perceived crime and traffic safety is related to physical activity among adults in Nigeria. BMC Public Health 2012, 12. [Google Scholar] [CrossRef] [Green Version]
- Salvo, G.; Lashewicz, B.M.; Doyle-Baker, P.K.; McCormack, G.R. Neighbourhood built environment influences on physical activity among adults: A systematized review of qualitative evidence. Int. J. Environ. Res. Public Health 2018, 15, 897. [Google Scholar] [CrossRef] [Green Version]
- Saelens, B.E.; Sallis, J.F.; Black, J.; Chen, D. Scoring for the Neighborhood Environment Walkability Scale–Abbreviated (NEWS-A). Am. J. Public Health 2003, 93, 1552–1558. [Google Scholar] [CrossRef]
- Cerin, E.; Lee, K.; Barnett, A.; Sit, C.H.P.; Cheung, M.; Chan, W.; Johnston, J.M. Walking for transportation in Hong Kong Chinese urban elders: A cross-sectional study on what destinations matter and when. Int. J. Behav. Nutr. Phys. Act. 2013, 10, 78. [Google Scholar] [CrossRef] [Green Version]
- Panter, J.R.; Jones, A.P.; Van Sluijs, E.M.F.; Griffin, S.J.; Wareham, N.J. Environmental and psychological correlates of older adult’s active commuting. Med. Sci. Sports Exerc. 2011, 43, 1235–1243. [Google Scholar] [CrossRef] [PubMed] [Green Version]
- Ajit Singh, D.K.; Ibrahim, A.; Palaniappan, Y.; Zhen, L.S.; Zahar, S. Built environment characteristics and its association between physical performance, falls risk and functional mobility among Malaysian older adults. J. Sains Kesihat. Malays. 2018, 2018, 187–193. [Google Scholar] [CrossRef]
- Van Holle, V.; Deforche, B.; Van Cauwenberg, J.; Goubert, L.; Maes, L.; Van de Weghe, N.; De Bourdeaudhuij, I. Relationship between the physical environment and different domains of physical activity in European adults: A systematic review. BMC Public Health 2012, 12, 807. [Google Scholar] [CrossRef] [PubMed] [Green Version]
- Jensen, W.A.; Brown, B.B.; Smith, K.R.; Brewer, S.C.; Amburgey, J.W.; Mciff, B. Active Transportation on a Complete Street: Perceived and Audited Walkability Correlates. Int. J. Environ. Res. Public Health 2017, 14, 1014. [Google Scholar] [CrossRef] [PubMed] [Green Version]
- Rees-Punia, E.; Hathaway, E.D.; Gay, J.L. Crime, perceived safety, and physical activity: A meta-analysis. Prev. Med. 2018, 111, 307–313. [Google Scholar] [CrossRef] [PubMed]
- Dalton, A.M.; Jones, A.P.; Panter, J.R.; Ogilvie, D. Neighbourhood, Route and Workplace-Related Environmental Characteristics Predict Adults’ Mode of Travel to Work. PLoS ONE 2013, 8. [Google Scholar] [CrossRef] [PubMed] [Green Version]
- Elsawahli, H.; Shah Ali, A.; Ahmad, F.; Al-Obaidi, K.M. Evaluating Potential Environmental Variables and Active Aging in Older Adults for Age-Friendly Neighborhoods in Malaysia. J. Hous. Elder. 2017, 31, 74–92. [Google Scholar] [CrossRef]
- Ambigga, K.S.; Ramli, A.S.; Suthahar, A.; Tauhid, N.; Clearihan, L.; Browning, C. Bridging the gap in ageing: Translating policies into practice in Malaysian primary care. Asia Pac. Fam. Med. 2011, 10, 1–7. [Google Scholar] [CrossRef] [Green Version]
- APUDG (Architect Planner Urban Design Group). Special Area Plan for Berjuntai Bestari District, Malaysia; APUDG: Selangor, Malaysia, 2004. [Google Scholar]
- Elsawahli, H.; Ahmad, F.; Ali, A.S. Demographic transition and sustainable communities in Malaysia. Plan. Malays. J. Malays. Inst. Plan. 2016, 5, 39–48. [Google Scholar] [CrossRef] [Green Version]
- Lai, M.M.; Lein, S.Y.; Lau, S.H.; Lai, M.L. Modeling Age-Friendly Environment, Active Aging, and Social Connectedness in an Emerging Asian Economy. J. Aging Res. 2016, 2016, 1–14. [Google Scholar] [CrossRef] [Green Version]
- Nik Mohammad, N.M.; Abbas, M.Y. Elderly Environment in Malaysia: Impact of Multiple Built Environment Characteristics. Procedia Soc. Behav. Sci. 2012, 49, 120–126. [Google Scholar] [CrossRef] [Green Version]
- Forde, C. Scoring the International Physical Activity Questionnaire (IPAQ) Exercise Prescription for the Prevention and Treatment of Disease; Trinity College Dublin, The University of Dublin: Dublin, Ireland, 2005; pp. 1–4. [Google Scholar]
- Kimm, J.; Teh, L.; Tey, N.P.; Ng, S.T. Family Support and Loneliness among Older Persons in Multiethnic Malaysia. Sci. World J. 2014, 11. [Google Scholar] [CrossRef] [Green Version]
- Saelens, B.E.; Sallis, J.F. Neighborhood Environment Walkability Scale (NEWS). Am. J. Public Health 2002, 93, 78–81. [Google Scholar] [CrossRef]
- Mena, C.; Sepúlveda, C.; Ormazábal, Y.; Fuentes, E.; Palomo, I. Impact of walkability with regard to physical activity in the prevention of diabetes. Geospat. Health 2017, 12, 175–183. [Google Scholar]
- Wan Abdul Manan, W.M.; Lee, Y.Y. Reliability and validity of the neighbourhood environment walkability scale (news)–Malay version. Int. J. Public Health Clin. Sci. 2018, 5, 65–82. [Google Scholar]
- Bordoloi, R.; Mote, A.; Sarkar, P.P.; Mallikarjuna, C. Quantification of Land Use Diversity in the Context of Mixed Land Use. Procedia Soc. Behav. Sci. 2013, 104, 563–572. [Google Scholar] [CrossRef] [Green Version]
- Department of Statistics Johor. Data on Population Density; Department of Statistics Johor: Johor Bahru, Malaysia, 2010. [Google Scholar]
- Bell, J. Data on Iskandar Malaysia Population Density. 2017. Available online: https://www.arcgis.com/home/item.html?id=63347f911ca341fcab7e382f7bee4d6d (accessed on 28 November 2019).
- Dill, J. Measuring Network Connectivity for Bicycling and Walking. In Proceedings of the Transportation Research Board 83rd Annual Meeting, Washington, DC, USA, 11–15 January 2004. [Google Scholar]
- Rea, L.M.; Parker, R.A. Designing and Conducting Survey Research: A Comprehensive Guide; John Wiley & Sons: Hoboken, NJ, USA, 2014. [Google Scholar]
- De Sa, E.; Ardern, C.I. Associations between the built environment, total, recreational, and transit-related physical activity. BMC Public Health 2014, 14, 1–8. [Google Scholar] [CrossRef] [Green Version]
- Zhao, L.; Shen, Z.; Zhang, Y.; Sheng, F. Study on the Impact of the Objective Characteristics and Subjective Perception of the Built Environment on Residents’ Physical Activities in Fuzhou, China. Sustainability 2020, 12, 329. [Google Scholar] [CrossRef] [Green Version]
© 2020 by the authors. Licensee MDPI, Basel, Switzerland. This article is an open access article distributed under the terms and conditions of the Creative Commons Attribution (CC BY) license (http://creativecommons.org/licenses/by/4.0/).


