OHS Disclosures Within Non-Financial Reports: The Romanian Case
by
 , and
, and
Ana Petrina Păun
1, 
Codruța Cornelia Dura
1,
Sorin Mihăilescu
2, 
Roland Iosif Moraru
3,* and
Claudia Adriana Isac
1 1
Department of Economic Sciences, University of Petroșani, University Street, 332001 Petroșani, Romania
2
Department of Mechanical, Industrial and Transport Engineering, University of Petroșani, University Street, 332001 Petroșani, Romania
3
Department of Management and Industrial Engineering, University of Petroșani, University Street, 332001 Petroșani, Romania
*
Author to whom correspondence should be addressed.
Sustainability 2020, 12(5), 1963; https://0-doi-org.brum.beds.ac.uk/10.3390/su12051963
Submission received: 9 February 2020
/
Revised: 1 March 2020
/
Accepted: 3 March 2020
/
Published: 4 March 2020
(This article belongs to the Collection Circular Economy and Sustainable Strategies)
Abstract
:The article addresses the issue of disclosing Occupational Health and Safety (OHS) issues by corporations in Romania, under the influence of recent changes in the legislative framework imposed by the adoption of the EU Directive 2014/95/EU on non-financial reporting by large corporations exceeding 500 employees. The goal of our study consist in determining the relevant factors that influence the level of the Romanian companies’ OHS disclosure. To this end, we have compiled a sample of 35 organizations that have elaborated and published non-financial reports during 2016–2017 and we have analysed the impact of some relevant determinants upon the reporting phenomenon. With the aim of providing a clear picture of the regional context of our study, we put together many pieces of information regarding the corporations that played the trend-setters role in Romania, by disclosing corporate social responsibility (CSR)/sustainability reports between 2003 and 2017, although this practice has been characterized by a voluntary and unsteady approach in many cases. The importance of outlining the regional context of the Romanian reporting companies is given by the urge to raise the local managers’ level of awareness towards sustainability issues and to use the recent legislative changes as opportunities to catch up with more advanced EU countries. The research methods used in order to identify the interdependencies established between the key factors involved in the disclosure practices included a mixed quantitative-qualitative approach, and referred to: content analysis of sustainability reports; descriptive analysis of the statistical variables which were taken into consideration; correlation analysis of numerical variables; and the ANOVA method for investigating the interdependencies between the categorical and numerical variables. Among the influencing factors that impact with a greater or lesser intensity the quality of OHS reporting performed by the local companies, the following were highlighted: the corporations’ market share, their field of activity, and the ownership structure.
1. Introduction
The emergence of the knowledge-based economy and the acceleration of the globalization phenomenon at an international level have been, in recent years, the catalysts that have led to rapid transformations within the organizational communication systems, materialized in the form of balancing quantitatively and qualitatively the financial and non-financial information that makes up the content of annual reports and sustainability reports published by companies. Thus, in the last decades, a series of organizational communication tools built around a few basic pillars of company activity have been substantiated and successively refined: for example, the “triple-bottom-line” reporting represents an intensely driven approach in the literature that simultaneously considers the economic dimension of the company, the social dimension and the concern for sustainable development by protecting the environment [1]. Each of the three pillars—economic, social and environmental—is intended to contribute to increasing the degree of transparency of the companies and opening them up to communicate a block of relevant information from the perspective of the deep understanding, by the stakeholders, of the driving mechanisms and use of different categories of resources used by the company. The most recently developed holistic reporting formula is integrated reporting [2,3] which provides an elaborate sustainability reporting scheme, with a more focused structure and a broader set of guiding principles. Although such a model of reports was born under the impact of increasing the demands related to the transparency of the activities carried out by private companies, there are more and more voices supporting the efforts to transpose this type of reporting within public organizations and within those operating in the non-profit sector.
On the other hand, it is worth noting the tendency of developing certain certification systems of companies’ disclosure, able to add credibility to the information communicated to the most important categories of stakeholders. Such methods emerged for the first time in the economic domain, then manifested themselves in the field of environmental protection, and subsequently were issued in the fields of corporate social responsibility and occupational health and safety. The study of the literature led us to the conclusion that there are currently a number of reporting standards that have been imposed in international practice and which establish the general reporting framework for the sustainable-oriented companies, i.e, the GRI Sustainability Guidelines, AA1000 Series, ISO 14000 Series (14001), ISO 26000:2010, UNGlobal Compact Management Model, etc. A significant number of authors and practitioners in the field, as well as brand representatives of specialized institutions in managerial consulting, advocate for the recognition of the GRI standard, as the most used model by the corporations in the non-financial disclosure area. In order get a realistic picture of the speed and magnitude of the GRI standards’ adoption and putting into force in the international business practice, it is useful to call on some significant figures: according to GRI Data Base [2,4], a number of 13,942 of organizations from around the world have produced, from 1999 to present, about 55,678 sustainability reports that comply with the GRI guidelines.
On September 29, 2014, the European Council adopted the Directive 2014/95/EU which entered into force in November 2014. This is the first Directive on non-financial reporting by public-interest entities in the EU, which exceed 500 employees. Starting with January 2017, the provisions of this directive also apply in Romania through the order of the Ministry of Public Finance no. 1938/2016. The concrete ways in which the Directive 2014/95/EU bases the reporting of these categories of information are the following:
- Either through a non-financial statement, presented as an appendix to the management report (management);
- Either by drawing up a separate report (non-financial report), which will be made available to stakeholders within a reasonable period of time (maximum 6 months) from the reference date of releasing the balance sheet.
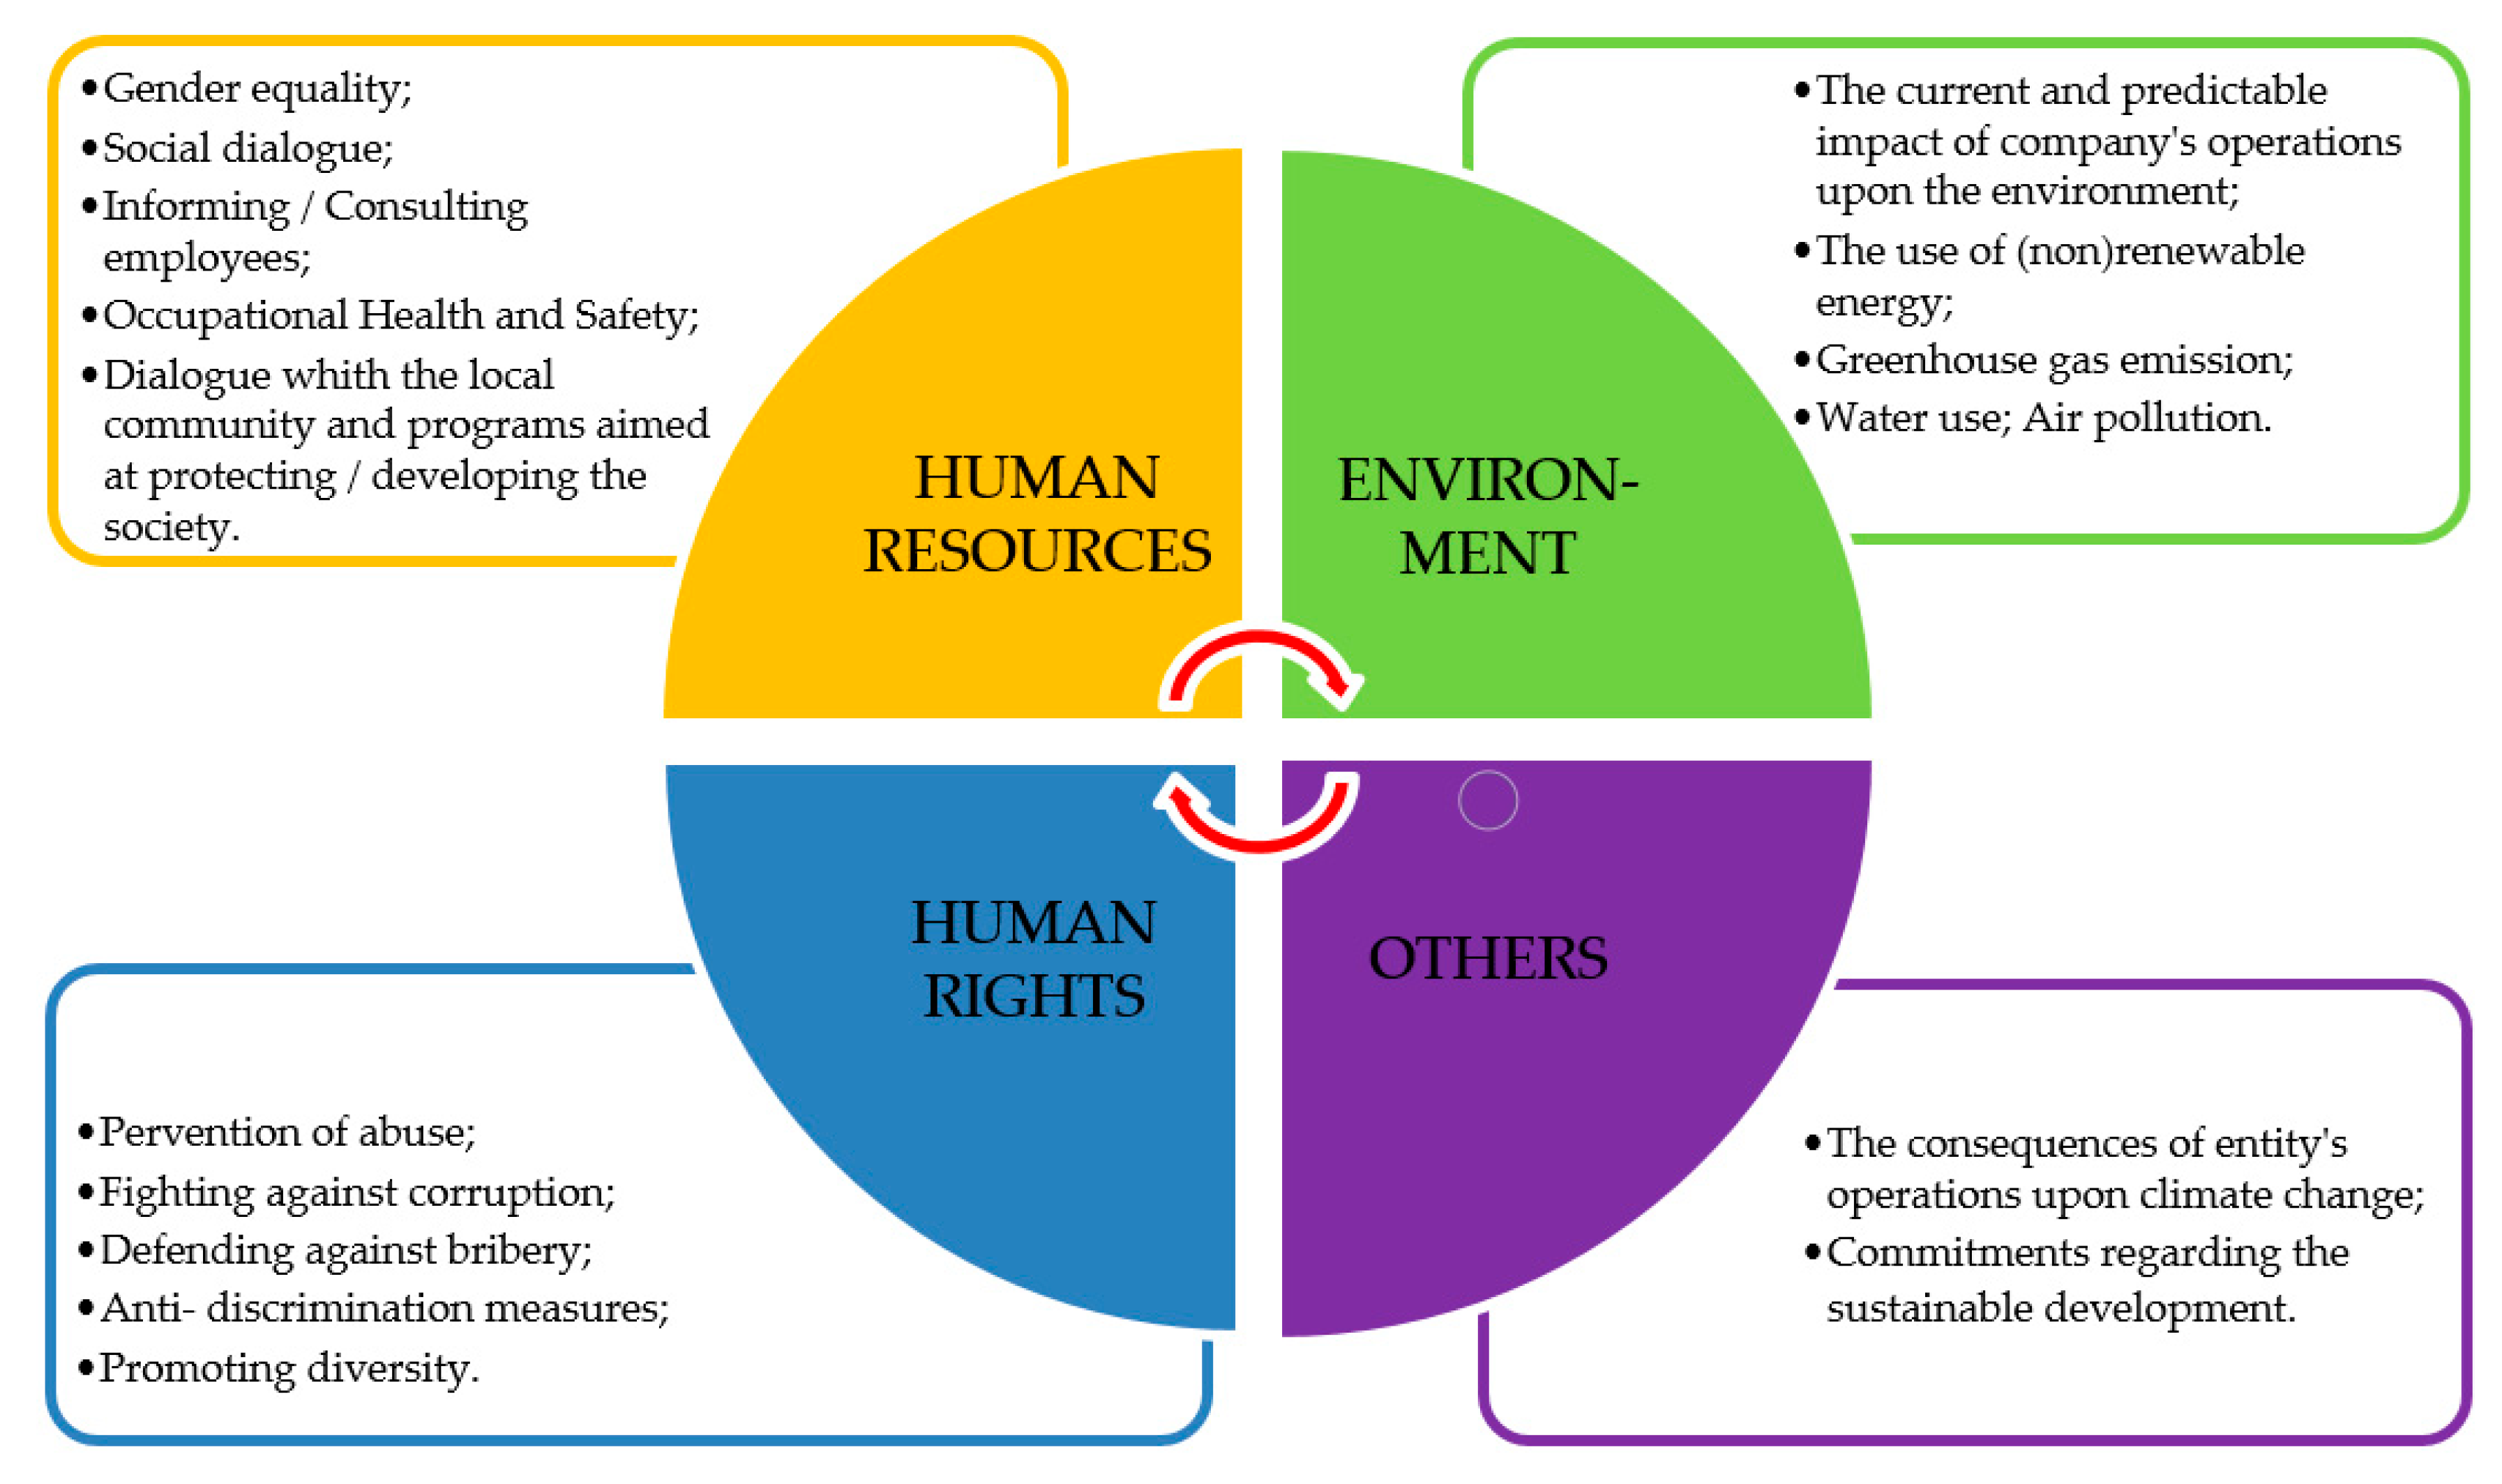
Regardless of the option chosen by each company, non-financial information will refer to: aspects related to environmental protection, social issues and human resources management (including elements related to occupational health and safety), the situation of respecting human rights and fighting corruption and the bribery phenomena, insofar as, the approach of these subjects is likely to provide an understanding of growth strategies, performances and impact that a company generates at the level of the community in which it operates, in terms of sustainable development [2,5] (Figure 1).
The scope of Directive 2014/95/EU on non-financial reporting is determined by the size of organizations that will have to comply with this recommendation. It covers so-called “large companies and groups” as defined by the Directive 2013/34 / EU as follows [2,5]:
- The phrase “large companies” is defined as those corporations that, at the date of publication of the balance sheet, exceed the limits set for at least two of the following criteria: (1) total balance sheet > 20,000,000 Euro; (2) net turnover > 40,000,000 Euro; (3) average number of employees > 250.
- “Large groups” means the economic entities formed by the parent companies and the subsidiaries that, on a consolidated basis, exceed the limits for at least two of the following three criteria in the moment in which the parent company’s balance sheet is released: (1) total balance sheet > 20,000,000 Euro; (2) the net turnover > 40,000,000 Euro; (3) average number of employees > 250.
An interesting observation can be made regarding the subsidiaries of large corporations and economic groups operating in Romania. According to Article 19 a, point 3, in conjunction with Article 29 a, point 4, stipulated in Directive 2013/34/EU, these economic entities are exempted from the obligation of non-financial reporting, if the presentation of the non-financial dimension of the activities carried out by them is realized within the report of the parent company or of another corporation that is part of the group. This phenomenon partially explains the very small number of corporations with more than 500 employees reporting non-financially in Romania so far. In other words, a fairly important segment of this statistical population of companies that exceed 500 employees is composed of subsidiaries of multinational corporations that report non-financially at group level and, for the moment, do not elaborate customized reports at the country level.
2. Literature Review and Hypotheses Development
As recently shown by the worldwide business environment, during periods of crisis, managers’ approaches towards sustainability turned into cautious and protective behaviours, which resulted in tendencies of diminishing concerns and investments in the area. In other words, it seemed that the unpredictability in economic operations could have limited the virtual positive outcomes potentially acquired by companies from a sustainable-oriented managerial policy (Giorgi et al. [6], Cañón-de-Francia et al. [7]). However, another stream of literature argue that the number of corporate social responsibility (CSR)/sustainability reports increased with the crisis, as an attempt to provide an appropriate response to the massive loss of confidence from various stakeholders—a psychosocial behaviour that seriously disturbed the business environment in moments of crisis. For instance, the studies conducted by Dias et al. [8] and Garcia-Benau et al. [9] on significant samples of listed companies from Spain and Portugal have exhibited moderate increases of report rates during the crisis, showing a positive facet of sustainability, viewed both as a convenient managerial tool aimed at alleviating the crisis’ negative consequences and as a real opportunity to validate company’s commitment to the sustainable development goals (Yelkikalan et al. [10]).
Despite periods of crisis and economic growth, the business world is witnessing, during the last 20 years, a remarkable expansion in the process of CSR/sustainability reporting embracement. In line with this trend, OHS disclosures constituted a recently emerged research framework that drew a great deal of the attention from the scholars. Nevertheless, the OHS accounting and reporting issue remains strongly correlated with corporate CSR/sustainability reporting practices; which is why our research efforts within this paragraph were focused both on identifying some relevant determinants of sustainability reporting that were brought to the fore by the literature and on the research hypotheses whose development was aimed at supporting our future investigations. Thus, the factors that significantly impact the scope and the quality of sustainability disclosures have been comprehensively examined in the pre-existing literature. In our paper, we reviewed numerous recent studies on the subject that are frequently concentrated on the issue of reporting in one specific country: e.g., Poland (Dyduch et al. [11]; Matuszak et al. [12] Maj et al. [13]), Germany (Verbeeten at el al. [14]; Gamerschlag et al. [15]); Spain (Reverte et al. [16]; Sotorrío et all. [17]); Sweden (Tagesson et al. [18]); Serbia (Denčić-Mihajlov et al. [19]; Egypt (Elfeky [20]); Turkey (Kiliç et al. [21]; Kuzey et al. [22]); Malaysia (Ozigi et al. [23]; Rahman et al. [24]; Jaffar et al. [25]); Indonesia (Roman Cahaya [26]; Pravita Ariyani et al. [27]), India (Kansal et al. [28]; Joshi et al. [29]); Jordan (Al-Hamadeen et al. [30]) and China (Wang et al. [31]; Gao [32]). Additionally, a cross-regions research was focused on establishing the reporting profiles of forest companies originating from Europe, North America, Asia and Oceania, Latin America and Africa (Li et al. [33]) and other three studies were designed themselves as synthetic reviews of relevant sustainability theories and practices around the Globe (Galant et al. [34]; Habek et al. [35]; Hahn et al. [36]). Within these studies, authors often employ the content analysis method in order to construct their particular disclosure indexes as proxies for a realistic appraisal of the extent of sustainability/OHS disclosures. In order to fulfil our research aims, we made use of a very similar approach when we decided to substantiate the OHS reporting index—the dependent variable of our study—with the purpose of measuring the amplitude of the Romanian companies’ disclosure on health and safety in the workplace.
Given the interplay between OHS disclosures and employee issues, our field of reference covered the following determinants of sustainability reporting extracted from the literature: company’s size measured by the number of employees, the ownership structure, the type of industry, the affiliation to a multinational corporation and the company’s visibility in the market. With the intention of validating the presumable impact exerted by the selected determinants upon the level of sustainability reporting, researchers usually draw up hypotheses that are going to form the subject of verification through the instrumentality of appropriate statistical methods such as correlation analysis and /or ANOVA, regression analysis etc. (Păun [2]; Dyduch et al. [11]; Matuszak et al. [12] Rahman et al. [24]; Gamerschlag et al. [15]; Reverte et al. [16]; Kiliç et al. [21]; Kuzey [22] Tagesson et al. [18], Ozigi et al [23]; Finstad et al. [37], Rasool et al. [38], Pravita Ariyani et al. [27], Wang et al. [31], Li et al. [33]). Being aware of the valuable information provided by the statistical tools in the prior researches on the subject, we employed a very similar approach.
Thus, we developed the following hypotheses for our study:
Hypothesis 1 (H1).
There is a positive association between the company size and the level of OHS disclosure;
Hypothesis 2 (H2).
There is a positive relationship among company’s visibility on the market and the level of its OHS disclosure;
Hypothesis 3 (H3).
There is a relationship between the ownership structure of the company and the OHS disclosure;
Hypothesis 4 (H4).
The type of industry a company belongs to exerts a significant influence upon its OHS disclosure;
Hypothesis 5 (H5).
A company’s affiliation to a parent multinational corporation has an important impact on the level of its OHS disclosure.
We believe that our study contributes to the literature by filling an important research gap that refers both to a proper selection of relevant determinants of OHS reporting in Romania and to a fair assessment of the scope achieved by the disclosure phenomenon in our country.
3. Research Methodology
3.1. The Sample
In order to identify the general population from which we will draw the sample under investigation, we will carry out a brief review of the existing statistical data regarding the number of Romanian companies that have elaborated and communicated CSR/sustainability reports in the last decades. Thus, in consonance with the data released in Romania in 2017 by The CSR Report Magazine, we could identify a total number of 29 Romania companies that prepared and released between 1 and 6 CSR/sustainability reports starting from 2003, but the reporting practices of these corporations were lacking in consistency throughout the years (see the Appendix A Table A1).
However, the statistical data that reflect the magnitude of the non-financial reporting phenomenon in Romania are not always homogenous. Thus, according to the study published by Cătălina Sintnikov in the volume Corporate Social Responsibility in Europe-United in Sustainable Diversity [39], on the corporateregister.com platform, which gives an inventory over 50,000 CSR reports published worldwide, only 49 CSR reports published by Romanian companies could be identified during 2005–2012. Later, in 2013, two other Romanian researchers, Ducu and Băndilă [40], inventoried the companies originating from Romania that were present on the websites of the most important non-financial reporting standards; their study yielded a total number of 58 Romanian companies that elaborated and communicated such reports, most of them using the principles of UN Global Compact and the GRI standard.
Although the mentioned figures give a global overview on the magnitude of the phenomenon of non-financial reporting at national level, for the research we undertake within the present article, it would be more relevant to approximate the total number of Romanian companies that publish non-financial reports after to January 1, 2017, when the effective transposition of Directive 2014/95 / EU into the Romanian legislation took place. Analysing a series of relevant research works emerged in the Romanian literature in relation with the issues of sustainability and CSR (Păun [2]; Lungu et al. [41]; Dura et al. [42,43,44]; Băleanu et al. [45]; Filip et al. [46]; Iamandi et al. [47]) and taking into account at the same time the content of the reports and studies published by prestigious consultancy firms that have undertaken researches in this domain or in related fields [48,49,50,51], we found that the number of companies that report non-financially in Romania in the period 2017–2018 is much lower than initially expected.
Thus, according to an analysis carried out by The CSR Report Magazine in 2017, a total number of 680 Romanian companies reckoning approximately 1,018,239 employees (a figure that represents about 1/4 of the total 4.5 million employees from Romania) should publish their own non-financial reports, complementary to traditional financial-accounting statements [48]. However, the situation at the level of 2017, provided by the same source, reflects a much narrower database: there were only 29 Romanian companies reporting at the level of 2017. Additionally, another recent study prepared by Raiffeisen Bank, the Romanian Centre for European Policies (CRPE) and Romanian business leaders within the project “Partnership for integrity” on the topic of non-financial reporting [49], involved a sample made up of 24 companies judged as performers in terms of sustainability reporting practices.
Given the focus of our interest, in the context of the present research on the way of reporting, by the Romanian companies, of the specific problems of occupational safety and health-either this is done in the non-financial type reports or in the CSR/sustainability reports-we proceeded to systematically analyse the information published on their websites, by the largest corporations in Romania and we have created a complex database, corresponding to a sample of 35 corporations (Appendix A Table A2). From a statistical perspective, we used a pseudo-random sampling method, called convenience sampling, which presumes the selecting in the research sample of those subjects for which accessible and relevant information is available. Although less rigorous compared to a random sampling method, convenience sampling is extremely useful in the mentioned case, and is also the only possible approach to use when the magnitude of the non-financial reporting phenomenon can only be approximated currently in Romania. Based on the above, we consider that the sample of 35 reporting companies presented in Appendix A Table A2 is relevant and representative, despite the fact that we cannot determine precisely its degree of representativeness—this situation is objective in nature and is caused by the fact that the population size totals from which the sample is selected can only be approximated.
3.2. Measurement of the Dependent Variable
Based on the information collected from the sample, we constructed the variable OHS Global Reporting Index, which we treated as a dependent variable in the context of the present empirical research. The determination of the statistical data series that were associated with this variable (included in the last column of the table in Appendix A Table A2) was based on a quantitative-qualitative approach resulting from the content analysis of sustainability reports and/or non-financial reports and information disclosed by the companies in the sample and made public on their websites. The content analysis technique was initially borrowed from sociology and followed the systematic, quantitative and objective research of the text that is the subject of a communication (in our case this communication is represented by the information provided by the sustainability report of the company). We chose this research method considering that there are a considerable number of articles from the international stream of publications that use it for the same purpose, namely for researching CSR reporting and/or sustainability [2,11,12,14,15,16,18,20,26].
As already mentioned, at an international level, GRI standards are the most consistent and widely used recommendations on sustainability reporting; they establish a generally accepted reporting framework, in order to ensure greater comparability in terms of social, economic and environmental impact and business performance. The GRI standards are based on the transparency and evaluation in financial-accounting terms of the economic, social and environmental impact, with reference to different categories of stakeholders. Based on these findings, we considered adequate the approach according to which the foundation of the Global reporting index in the context of the present study should have as benchmark the updated version from 2018 of the GRI 403 standard—Occupational Health and Safety [2,52].
The collection of the data necessary for the analysis of the sections dedicated to the issue of occupational safety and health from the non-financial reports of the 35 companies was done online, between January 20 and May 20, 2019. In order to substantiate an overall OHS reporting index that provides an overview of the consistency of reporting in this area, we visited the websites of the 35 companies included in the sample, investigated a significant body of information included in the sustainability reports structured according to the following areas of interest corresponding to the GRI 403 standard:
- The managerial approach to OHS and the way the report is prepared. Regarding this sub-criterion the following were taken into account: the pillars of the policy developed in the field of OHS and the extent to which its provisions are known by their own employees and stakeholders; the level of integration of the specific aspects of OHS in the package of principles, rules and programs oriented to organizational change; the inclusion of OHS aspects in the set of key values that make up the organizational culture of the entity; elaboration of sustainability reports having as reference elements of the international reporting standards or their own evaluation systems;
- Representation of employees in OHS Committees, as bodies set up to ensure the involvement and direct participation of employees in the processes of substantiation of decisions in the field of OHS, as well as in the development of packages of preventive measures to mitigate the occurrence of accidental phenomena and occupational diseases;
- OHS topics and programs addressed with priority. Regarding this sub-criterion, we have paid attention, in particular, to the following aspects: the degree of concern demonstrated by the managers of the sample companies in order to achieve the objectives in the field of elaborating specialized programs and their own indicator systems to avoid the occurrence of the risks of work injury occurrence, respectively the planning of audits and regulated revisions to minimize the risks;
- Reporting of relevant statistical data on training sessions on safety and health at workplaces, respectively to the methods and means used in the learning processes, to the degree of worker’s involvement in this endeavour, to the obtained results, respectively to the level of awareness reached by the employees from all the organizational levels regarding the essential role of the OHS issues in the organizational development and provision of safe and healthy jobs [53];
- Systematization and presentation, in a coherent formula, of a system of relevant indicators to illustrate the performance of the activities carried out in the OHS field: the occurrence of injuries at work, the number of cases of occupational diseases that took place during the reporting period, the frequency of injuries with temporary incapacity for work (lost time injuries), the rate of absenteeism due to occupational diseases, the incidence of deaths due to events occurring in the workplace; number of days of medical leave lost per employee etc.
For each of these five areas of interest, different scores were awarded, in relation to each factor’s contribution to the shaping of OHS culture and ensuring transparency in reporting. The maximum values of these scores, which were taken into account for estimating the statistical data series related to the dependent variable of the research, were the following: I1—30; I2—15; I3—20; I4—15; I5—20. The rigorous analysis of the five OHS pillars for each of the 35 companies included in the sample of reporting corporations was aimed at establishing the values of the Global OHS reporting indices [2]. These figures that make up the statistical data series related to the dependent variable, have been systematized on the last column of the table that represents the research database in Appendix A Table A2.
The basis of the values of these indices was based on both a quantitative approach (grounded on the volume of information provided by each company) and a qualitative approach (set up according to the authors’ interpretation and explanation of the information communicated by companies on their websites and/or in the sustainability reports).
3.3. Measurement of Independent Variables
In order to select the relevant determinants, with potentially significant influence on the sustainability reporting process, we considered the results of other empirical research undertaken in the literature on this topic [2,11,13,15,16,20,22,23,24,28,29,30,31,33,36]. Of course, we identified in these studies a series of parameters that presented significance in certain organizational contexts, particularities of the business environment, stages of organizational development, etc. and we proceeded to sort them in order to refine those factors that best corresponded with the objectives of our study, both regarding the possibility of accurately describing the analysed phenomenon, as well as the existence of the effective opportunities for collecting the statistical data series needed for their investigation. In doing so, we obtained the determinants from Table 1. Further on, we proceeded to establish the variables with the help of which these determinants could be quantified, the modalities of operational definition of these variables and the statistic hypotheses that should be analysed within the research. Subsequently, Table 1 was the basis of the broader approach to collect the statistical data that were systematized in Appendix A Table A2 and which formed the initial research database.
Based on the above, in the next paragraph we will deepen the analysis of the information that forms the research database, using the software IBM SPSS, one of the most efficient and frequently used statistical data processing programs [2,54,55,56,57,58,59].
The primary data used in the article were extracted from the Risco Business Intelligence database, being provided by The National Trade Register Office of Romania. The data was not distorted and was subject to a unitary collecting process. They are available on the Internet and are official statistical data, administrative in their nature, being legally accessible to public and appropriately protected by law. The use of the data does not result in any damage or distress, while they are archived, managed and released for secondary analysis, fully in line with the ethics principles. The research methodology ensures transparency, publicness and replicability.
4. Results
4.1. Descriptive Statistics
The descriptive analysis of the data aims to summarize and present in different ways the information resulting from the statistical research. We will perform a descriptive analysis of the data collected from the sample of 35 companies, on the two distinct levels: the analysis of the numerical (quantitative) variables and the analysis of the nominal (qualitative) variables respectively.
4.1.1. Numerical Data Descriptive Statistics
This type of analysis has as a starting point the database in Appendix A Table A2, which includes records for the sample made up of the 35 companies that reported non-financially during the period 2016–2017. With the help of the SPSS program, the central tendency indicators, the dispersion indicators and the distribution shape indicators will be calculated for each variable. These will be followed by calculations to verify the normality of distributions based on appropriate statistical tests.
The numerical variables subjected to the analysis, the indicators of the central tendency and the results of their normality test are summarized in Table 2.
Based on the values and the tests performed, some characteristic aspects can be highlighted for each analysed variable [2]:
- Global OHS Reporting Index: Relevant data were found for all 35 cases analysed; a mean value of the index of 67.86 and a standard deviation of 20.37 were obtained. The values of the statistical variable were included in the range [15–100]. The result of the Shapiro–Wilk test was as follows: S-W (35) = 0.961, p = 0.250, therefore p > 0.05. The null hypothesis was accepted, so the variable OHS Global Reporting Index is normally distributed. The median is equal to 70, and the extremes, from the point of view of the global OHS reporting index, are represented by the companies S.I.E.P.C.O.F.A.R. (OHS index - 15) and OMV Petrom, respectively ALRO SA Slatina (both with OHS index values equal to 100, the maximum value);
- Market Share for 2017: A number of 34 corporations were analysed. The mean obtained was 34.94%, with a standard deviation of 32.22. The values of the statistical variable fall in the range (0.85–99.71). The normality was studied, and the results obtained in the statistical test were: S-W (34) = 0.863 and p = 0.001. The value p < 0.05 determined us to reject the null hypothesis and to conclude that the variable Market Share for 2017 is not normally distributed. The mean of the market share in 2017 was 34.94%, half of companies having a market share less than or equal to 27.13%, and the other half a larger market share. According to the histogram analysis resulted for this variable, 15 companies had a market share of less than 20%;
- Number of Employees in 2017: In the case of this variable, there is only one company that was excluded from the analysis, due to the irrelevant data. We obtained a mean of 2928.71 persons, with a mean standard deviation of 3497.15. The values of the statistical variable are in the range (86–13,790). The normality test results are as follows: S-W (34) = 0.723 and p = 0.000. Given that p < 0.05, we rejected the null hypothesis; as a result the variable Number of Employees for 2017 is not normally distributed. The average number of employees for 2017 was 2929 people, half of the sample corporations having a number of employees less than or equal to 1460 people, and the other half a larger number of employees. Specifically, 26 of the corporations had a number of employees of up to 5000 people, 6 corporations had between 5000 and 10,000 employees, while another 2 companies in the sample had between 10,000 and 15,000 employees. The company with the lowest number of employees was Antalis Romania (86 persons), while the corporation with the largest number was OMV Petrom (13,790 persons).
As this analysis showed, some of the determinants considered as independent variables in the research have an asymmetric distribution. This situation is normal, if we consider that the sample under investigation only included the companies that have elaborated and published sustainability reports with an obvious component of OHS, in the period 2016–2017. Therefore, due to the different sizes of the companies considered and to some particular characteristics derived from the fields of activity—whether or not they belong to a multinational corporation, the form of ownership over the capital etc.,—the numerical variables quantified as economic indicators such as number of employees and market share recorded non-homogeneous value. To eliminate this shortcoming, we will deepen the analysis of the distribution normality for the data series related to the numerical independent variables, because for these types of variables we will apply the Pearson correlation in order to analyse the existing interdependencies. Before that, we will analyse the asymmetries identified on the basis of the primary descriptive analysis and we will introduce some constraints in order to ensure the normality of some numerical variables, so that they will be suitable, further on, for performing the correlational analysis [2].
In the case of Number of Employees in 2017, the analysis of the extreme values led to the finding of very large variations, evidenced by the SPSS program, with the help of the data in Table 3.
In order to ensure the normality of this variable, we will perform a statistical processing that involves the delimitation of two sub-samples of corporations, taking into account their salary force at the level of 2017 [2]:
- Corporations with over 1900 employees—A sub-sample for which, according to the analysis performed in Table 4, the symmetry and vaulting conditions are met, with a 95% probability that the respective distribution is normal. This layer is composed of 14 corporations: Kaufland Romania, Raiffeisen Bank, OMV Petrom, Telekom, Lidl Romania, Electrica Grup, Transelectrica, Romgaz, ArcelorMittal Galați, ALRO Slatina, S.I.E.P.C.O.F.A.R., Auchan, Holzindustrie Schweighofer and Vodafone;
- Corporations with fewer than 1900 employees—A sub-sample for which the symmetry and vaulting conditions are satisfied with 99% confidence. This layer will consist of 21 subjects: ADREM Invest, Antalis Romania, GSK Romania, KMG Rompetrol Grup, CEZ Romania, KPMG, Zentiva, Ciech Soda Romania, Rombat Metair, Holcim, HeidelbergCement Romania, Patria Bank, Vrancart, Romstal, Heineken Romania, Ameropa Romania, Antibiotice Iași, Ursus Breweries, Coca Cola HBC Romania, National Salt Company, Aerostar Bacău.
For the first sub-sample delimited in relation to the number of employees, the indicators of the central tendency are investigated. We also added the estimation of the asymmetry (Skewness) and the flattening (Kurtosis) indices, based on the results provided by the SPSS software and presented in Table 4.
We further evaluate the normality of the distribution with the standard Skewness asymmetry error, respectively the standard flattening error—Std. Error of Kurtosis. The statistical treaties indicate that the symmetry is achieved in a 99% proportion, if the condition according to which the Skewness asymmetry coefficient is within the range bounded by the following values is met: (- Skewness standard error; + Skewness standard error). Additionally, the symmetry of the analysed distribution is achieved with 95% confidence, when the Skewness asymmetry index is within a range of ±2 Std. Error of Skewness. Correspondingly, the same principle is also accepted in the case of flattening, measured by means of the Kurtosis vaulting coefficient, for which Std. Error of Kurtosis was calculated in Table 4.
For the number of employees in 2017 for the first sub-sample, the coefficient of Skewness = 1.127, and ± 2 × Std Error of Skewness = ± 2 × 0.597 = ± 1.194. Therefore, the coefficient of asymmetry is within the limits of the mentioned interval and we can see that the symmetry is achieved in a proportion of 95% at the level of this sub-sample. In turn, the Kurtosis vaulting coefficient = 0.492, and the range delimited by ± Std Error of Kurtosis = ± 1.154, will contain the Kurtosis value. Therefore, from the point of view of the vaulting coefficient, the symmetry is 99% verified.
For the second sub-sample, the indicators of the central tendency, respectively of the asymmetry Skewness and Kurtosis, revealed that there is only a 1% probability that the distribution of the variable “number of employees” should not be symmetrical and mesokurtic.
A similar operation of analysing the distribution symmetry was performed for the market share indicator at the level of 2017. The analysis of the extreme values (outliers) for this indicator suggested the need to apply the following restriction: the market share > 3%. In this situation, we eliminated from the data series 5 companies with very small market shares: ADREM Invest, Patria Bank, CEZ Romania, GSK Romania, KMG Rompetrol Grup. We then analysed the asymmetry Skewness and vaulting Kurtosis coefficients and their associated standard errors: 0.482 for the Skewness coefficient, while Std. Error of Skewness = 0.441. This led us to the conclusion that there is only 5% chance that the analysed distribution will be asymmetric, because the coefficient is within the range delimited by the values ± 2Std Error. Similarly, the Kurtosis vault coefficient = −1.118 and the Std Error of Kurtosis = 0.858, i.e., there is a 5% chance that the distribution will not be mesokurtic. As the SPSS program has shown that this distribution is mono-modal, it has obviously been shown that it can be treated in the same way as a normal distribution.
4.1.2. Categorical Data Descriptive Statistics
In order to have a general view of the nominal variables included in the analysis, we will calculate, by means of the SPSS program, the module (as an indicator of the central tendency) and the absolute and relative frequencies (or percentages) associated with these variables. Table 5 summarizes the descriptive analysis of the nominal variables included in the study [2].
Of the 35 economic entities analysed, 25 (i.e., 71.43%) represent subsidiaries of the large international corporations that carry out operations in our country. On the other hand, 10 of these economic entities (i.e., 28.57%) represent corporations with domestic capital. Regarding the classification of the companies in the sample according to the ownership structure, 28 of them (corresponding to 80%) are companies with private capital, 4 of them (i.e., 11.4%) are majority state-owned companies, and 3 of the corporations are companies with mixed capital (8.6% of the total) respectively.
Taking into consideration the level of elaboration of the report, in the category of subsidiaries of multinational corporations operating in Romania, there are entities that produce sustainability reports at country level and entities that report these operations only at group level (in which case the references to the operations carried out in Romania will be, of course, more succinct). From this perspective, the structure of the sample used in the research is the following: 26 corporations (i.e., 74.3% of the total) elaborate reports at the level of Romania, while 7 corporations (representing 20% of the sample) report at group level. To these is added the particular case of the Lafarge Holcim Group, which paid a special attention both to the sustainability strategy and the indicators of sustainable development.
Finally, depending on the field of activity in which the companies included in the sample operate, the descriptive analysis allowed to highlight the following frequencies and percentages: 5 of the reporting corporations (representing 14.3% of the sample) are producing consumer goods; 4 of the corporations (i.e., 11.4%) are part of the chemical and metallurgical industries; 3 of the corporations (i.e., 8.6%) are active in the wood and construction materials industry; 4 corporations are active in the extractive industry (more specifically in oil and gas extraction, respectively salt extraction); 3 companies (8.6%) operate in the sector of production and supply of utilities; 3 other corporations (representing a similar percentage of 8.6%) are part of “other branches of the processing industry” (respectively the aeronautical industry, the pulp and paper industry and the electro-technical industry); 6 economic entities (representing 17.1%) are part of the wholesale and retail sector; another 7 corporations (20%) fall into the services sector (namely telecommunications, distribution, financial services and consulting services) [2].
4.2. Analysis of Pearson Correlations between Numerical Variables
The Pearson correlation coefficient allows both the identification of the existence of a linear type connection between two numerical variables and the quantification of the intensity of this interdependence. The relationship used to determine the correlation coefficient is as follows [2]:
where: is the individual values of the dependent variable x; is the individual values of the independent variable y; is the arithmetic mean of the values x; is the arithmetic mean of the values y.
The values of the correlation coefficient are found in the range (−1; +1), in which the following are particularly relevant:
- r = 1, indicates a perfectly positive correlation between variables x and y, and their variation occurs in the same direction (increasing/decreasing the variable y leads to increasing/decreasing the variable x);
- r = 0, indicates an absence of the link between the variables x and y analysed;
- r = −1, reflects a perfectly negative correlation between variables x and y, in which their variation occurs in the opposite direction (increasing variable y decreases variable x, respectively decreasing variable y increasing variable x).
4.2.1. Analysis of the correlation between the Global OHS Reporting Index and the Number of Employees in 2017
In Section 4.1.1., we showed the normality of the independent variable, introducing the restriction: “number of employees > 1900”. Even if the limitation is met, the correlation with the Global OHS Reporting index is statistically insignificant, according to the results in Table 6.
In this case, r (12) = 0.357 and p = 0.210 > 0.05, therefore the null hypothesis was accepted. The same conclusion was imposed after analysing the statistical data of the corporations in the sub-sample 2, which had a number of employees <1900.
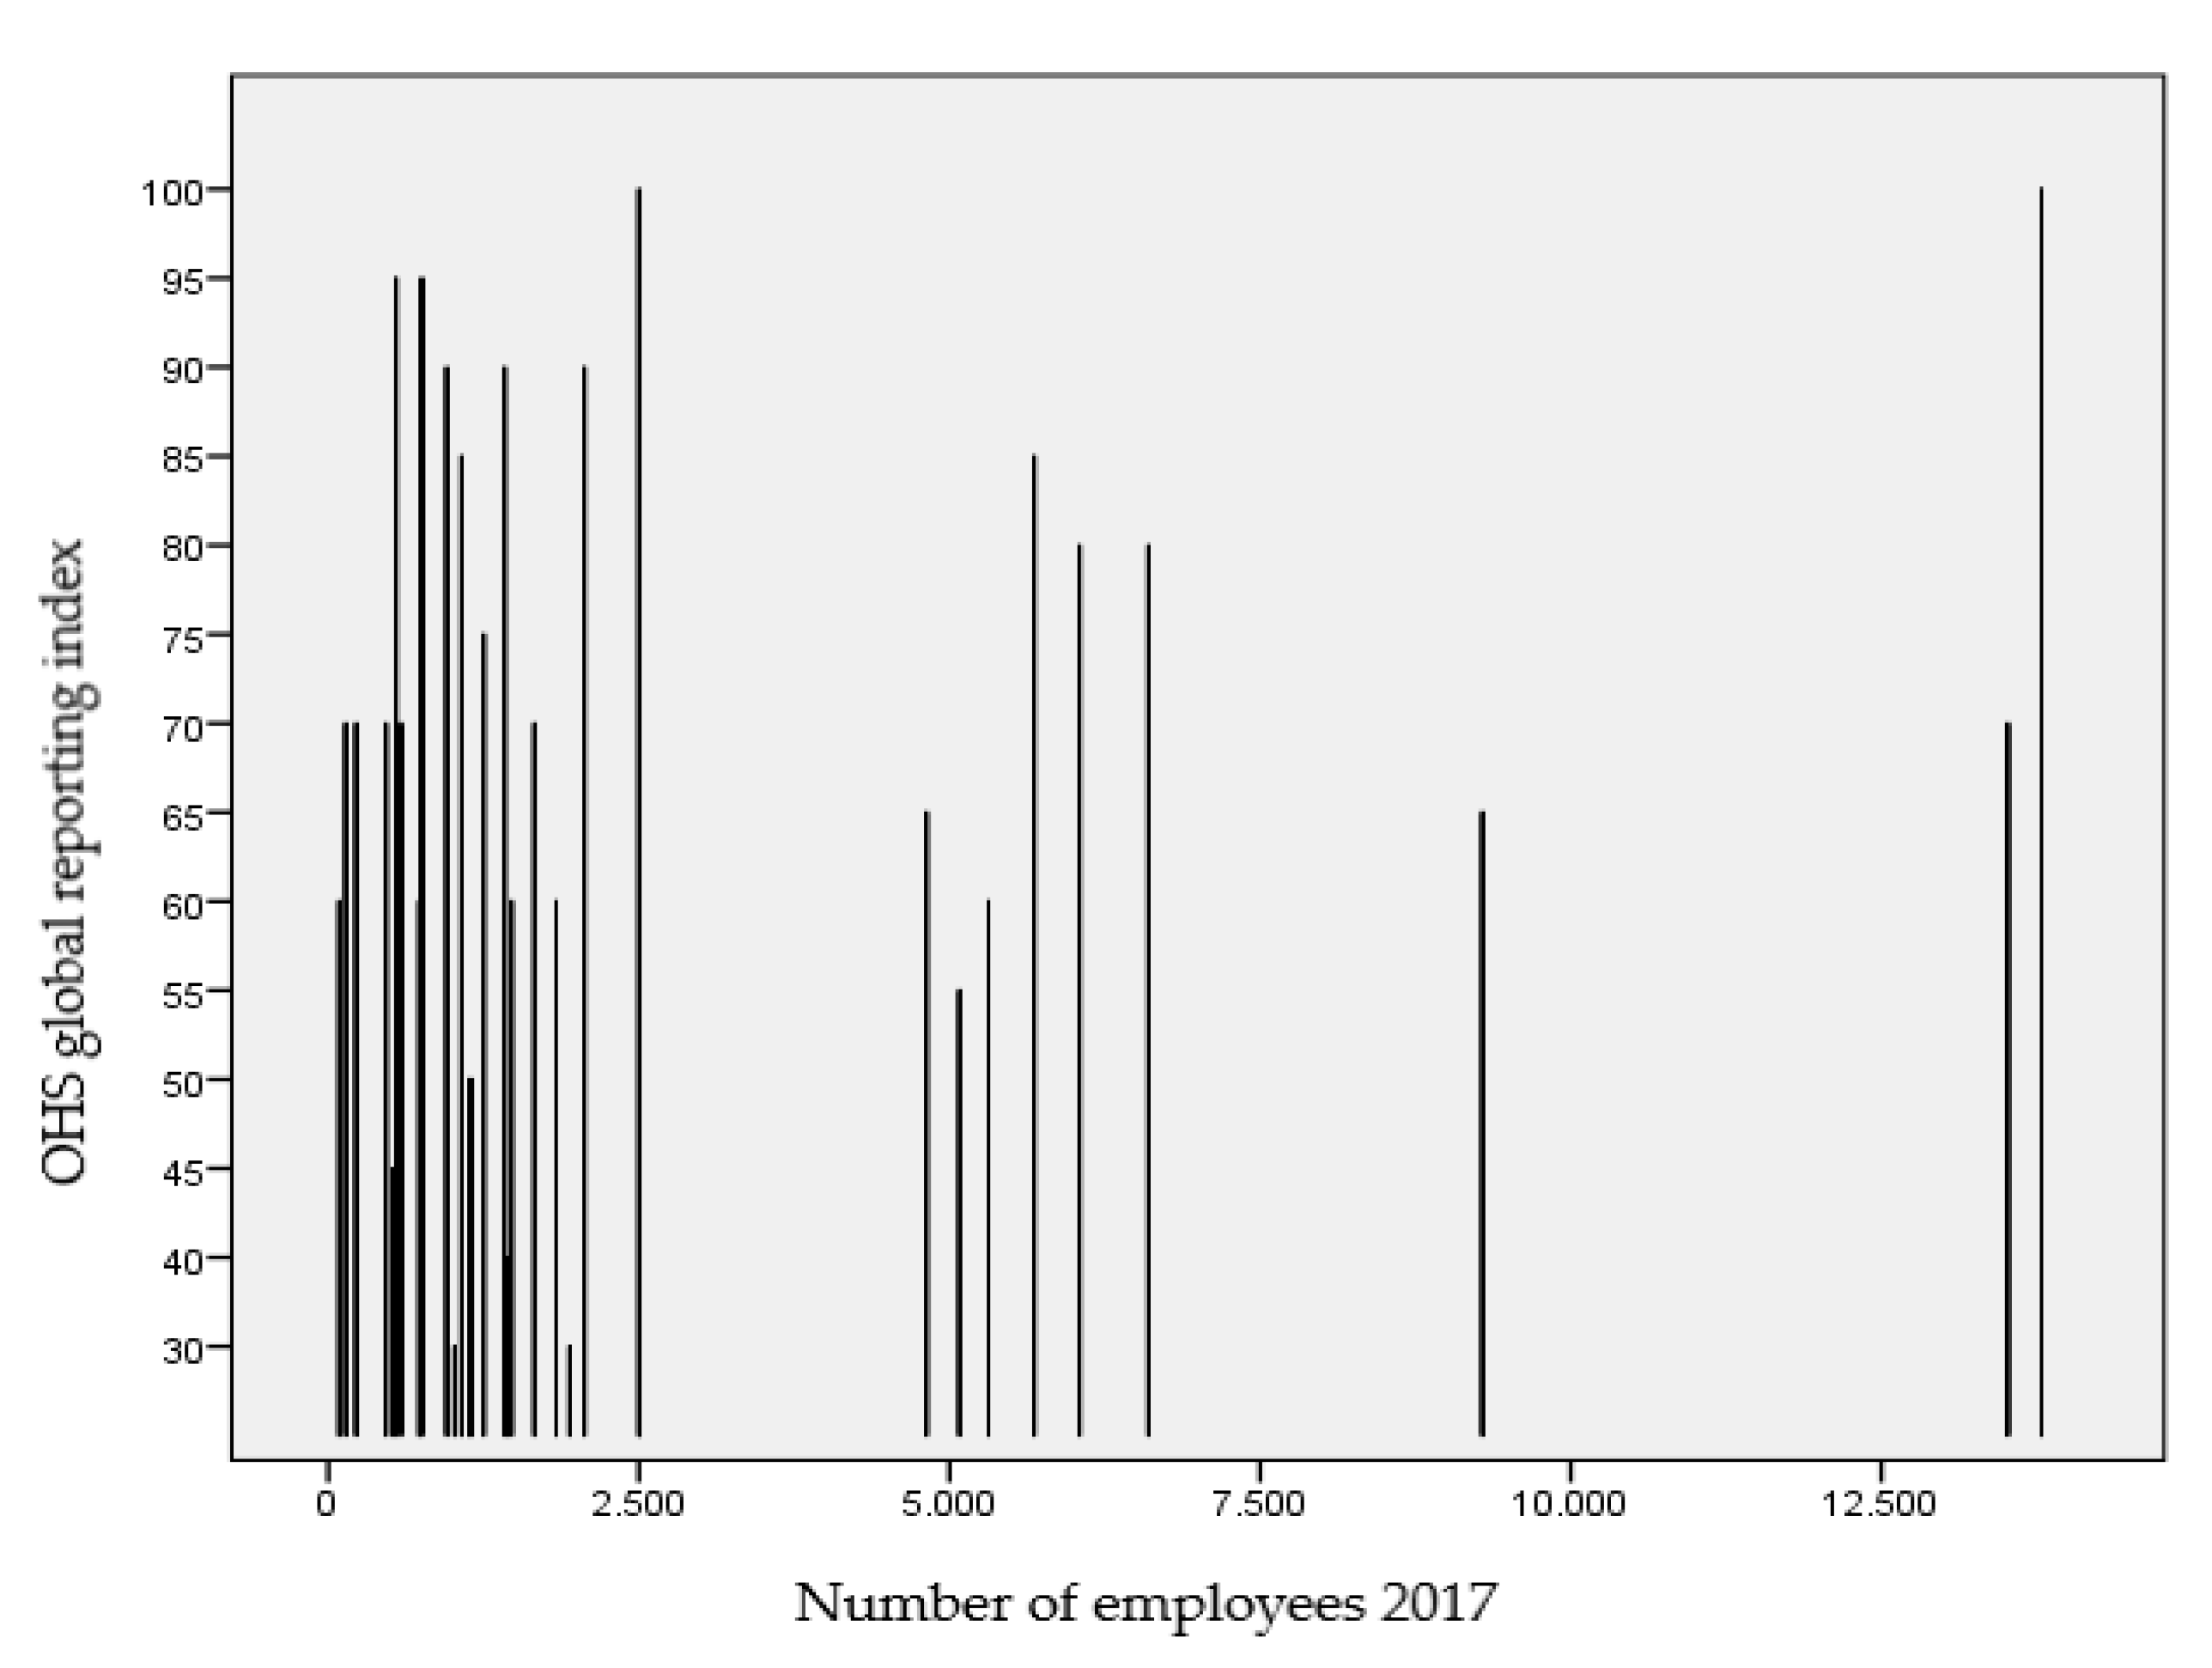
Given that the sample is extremely heterogeneous from the perspective of this variable, as we have shown in the paragraph dedicated to the descriptive analysis of numerical variables, it seems impossible to identify any association between the global OHS reporting index and the number of employees. Thus, we remind that the minimum and maximum values of this indicator delimit on a very wide range of values, between 86 and 13,790 employees in 2017, with an average standard deviation of 3497 persons. This situation is illustrated graphically in Figure 2, which reflects the values of the Global OHS Reporting index in relation to the number of employees of the corporations in the sample.
Therefore, in the case of the sample comprising 35 reporting corporations from Romania, it cannot be supported the hypothesis H1 according to which we assumed there was a relationship between the size of the company expressed by the number of employees and the Global OHS Reporting Index.
4.2.2. Analysis of the Correlation between the Global OHS Reporting Index and the Market Share in 2017
The output generated by the Pearson correlation analysis using SPSS is shown in Table 7. Since r (28) = 0.364 and p = 0.048 < 0.05, it follows that we have obtained a moderate level correlation, with a value of the coefficient of determination r2 = 0.1324. In other words, 13.24% of the spread of the global OHS reporting index can be explained by the change in market share.
In order to estimate the value of the correlation coefficient at the level of the whole population, a 95% confidence interval can be determined. To that end, Fisher’s algorithm for transforming r into Z values will be used [59]:
- we calculate the value of Z by using the formula:as well as the standard error of the transformation after:(in our case, Z = 0.381 and re = 0.192);
- the upper limit Zsup = Z + 1.96 × re (namely Zsup = 0.758);
- the lower limit Zinf = Z – 1.96 × re (namely Zinf = 0.004);
- by the inverse of the Z transformation we obtain the confidence interval for the correlation coefficient:
In our case, rsup = 0.6403 şi rinf = 0.00429.
Often, to avoid these rather complicated calculations, statisticians use the Fisher table to transform r values into Z scores. In this case, the confidence limits for the correlation coefficient between the OHS Global Reporting Index and the 2017 market share are ranging between 0.429% and 64.03%.
From the graphical point of view, the association between the global OHS reporting index and the market share of the companies in the researched sample was suggestively represented in Figure 3.
The Pearson correlation revealed in Table 7 and Figure 2 show that Hypothesis H2 is verified. In other words, for our sample of 35 Romanian reporting corporations, a positive interdependence between the company’s visibility (mirrored by its market share) and the scale of OHS disclosure has been demonstrated.
4.3. Analysis of Variance (ANOVA)
The ANOVA (“Analysis of Variance”) method is a group of statistical techniques that is used to analyze the interdependencies between a numeric variable and a nominal variable. Further on, we will apply the One-Way ANOVA method, sequentially calling into requisition the statistical operations needed to be performed in SPSS for each of the three nominal variables that were included in the database in Appendix A Table A2.
4.3.1. Analysis of the correlation between the Global OHS Reporting Index and the Company’s Ownership Structure
First of all, we will aim to investigate the fulfilment of the condition of normality of the dependent variable on each category of the independent variable. The SPSS software generates the results listed in Table 8.
Taking into account the values displayed in the column “Sig.”, it can be stated that the dependent variable Global OHS Reporting Index is normally distributed across all categories of the independent variable. Thus, the results of the Shapiro–Wilk test show that Sig. (p > 0.05), which leads to the acceptance of the null hypothesis for each category of the variable “ownership structure”.
The Levene test was further applied in order to analyse the differences between the variances of the groups (see Table 9):
We obtain for the test Levene F (2.32) = 0.888, p = 0.421; thus, we can state that the homogeneity of the variables is ensured. The ANOVA table generated by SPSS in this case is displayed below (see Table 10):
Since F (2.32) = 2.595 and p = 0.09 > 0.05, the null hypothesis was accepted and we concluded that there are no significant differences between the mean values registered by the Global OHS reporting index, considering the three categories of the variable “ownership structure”.
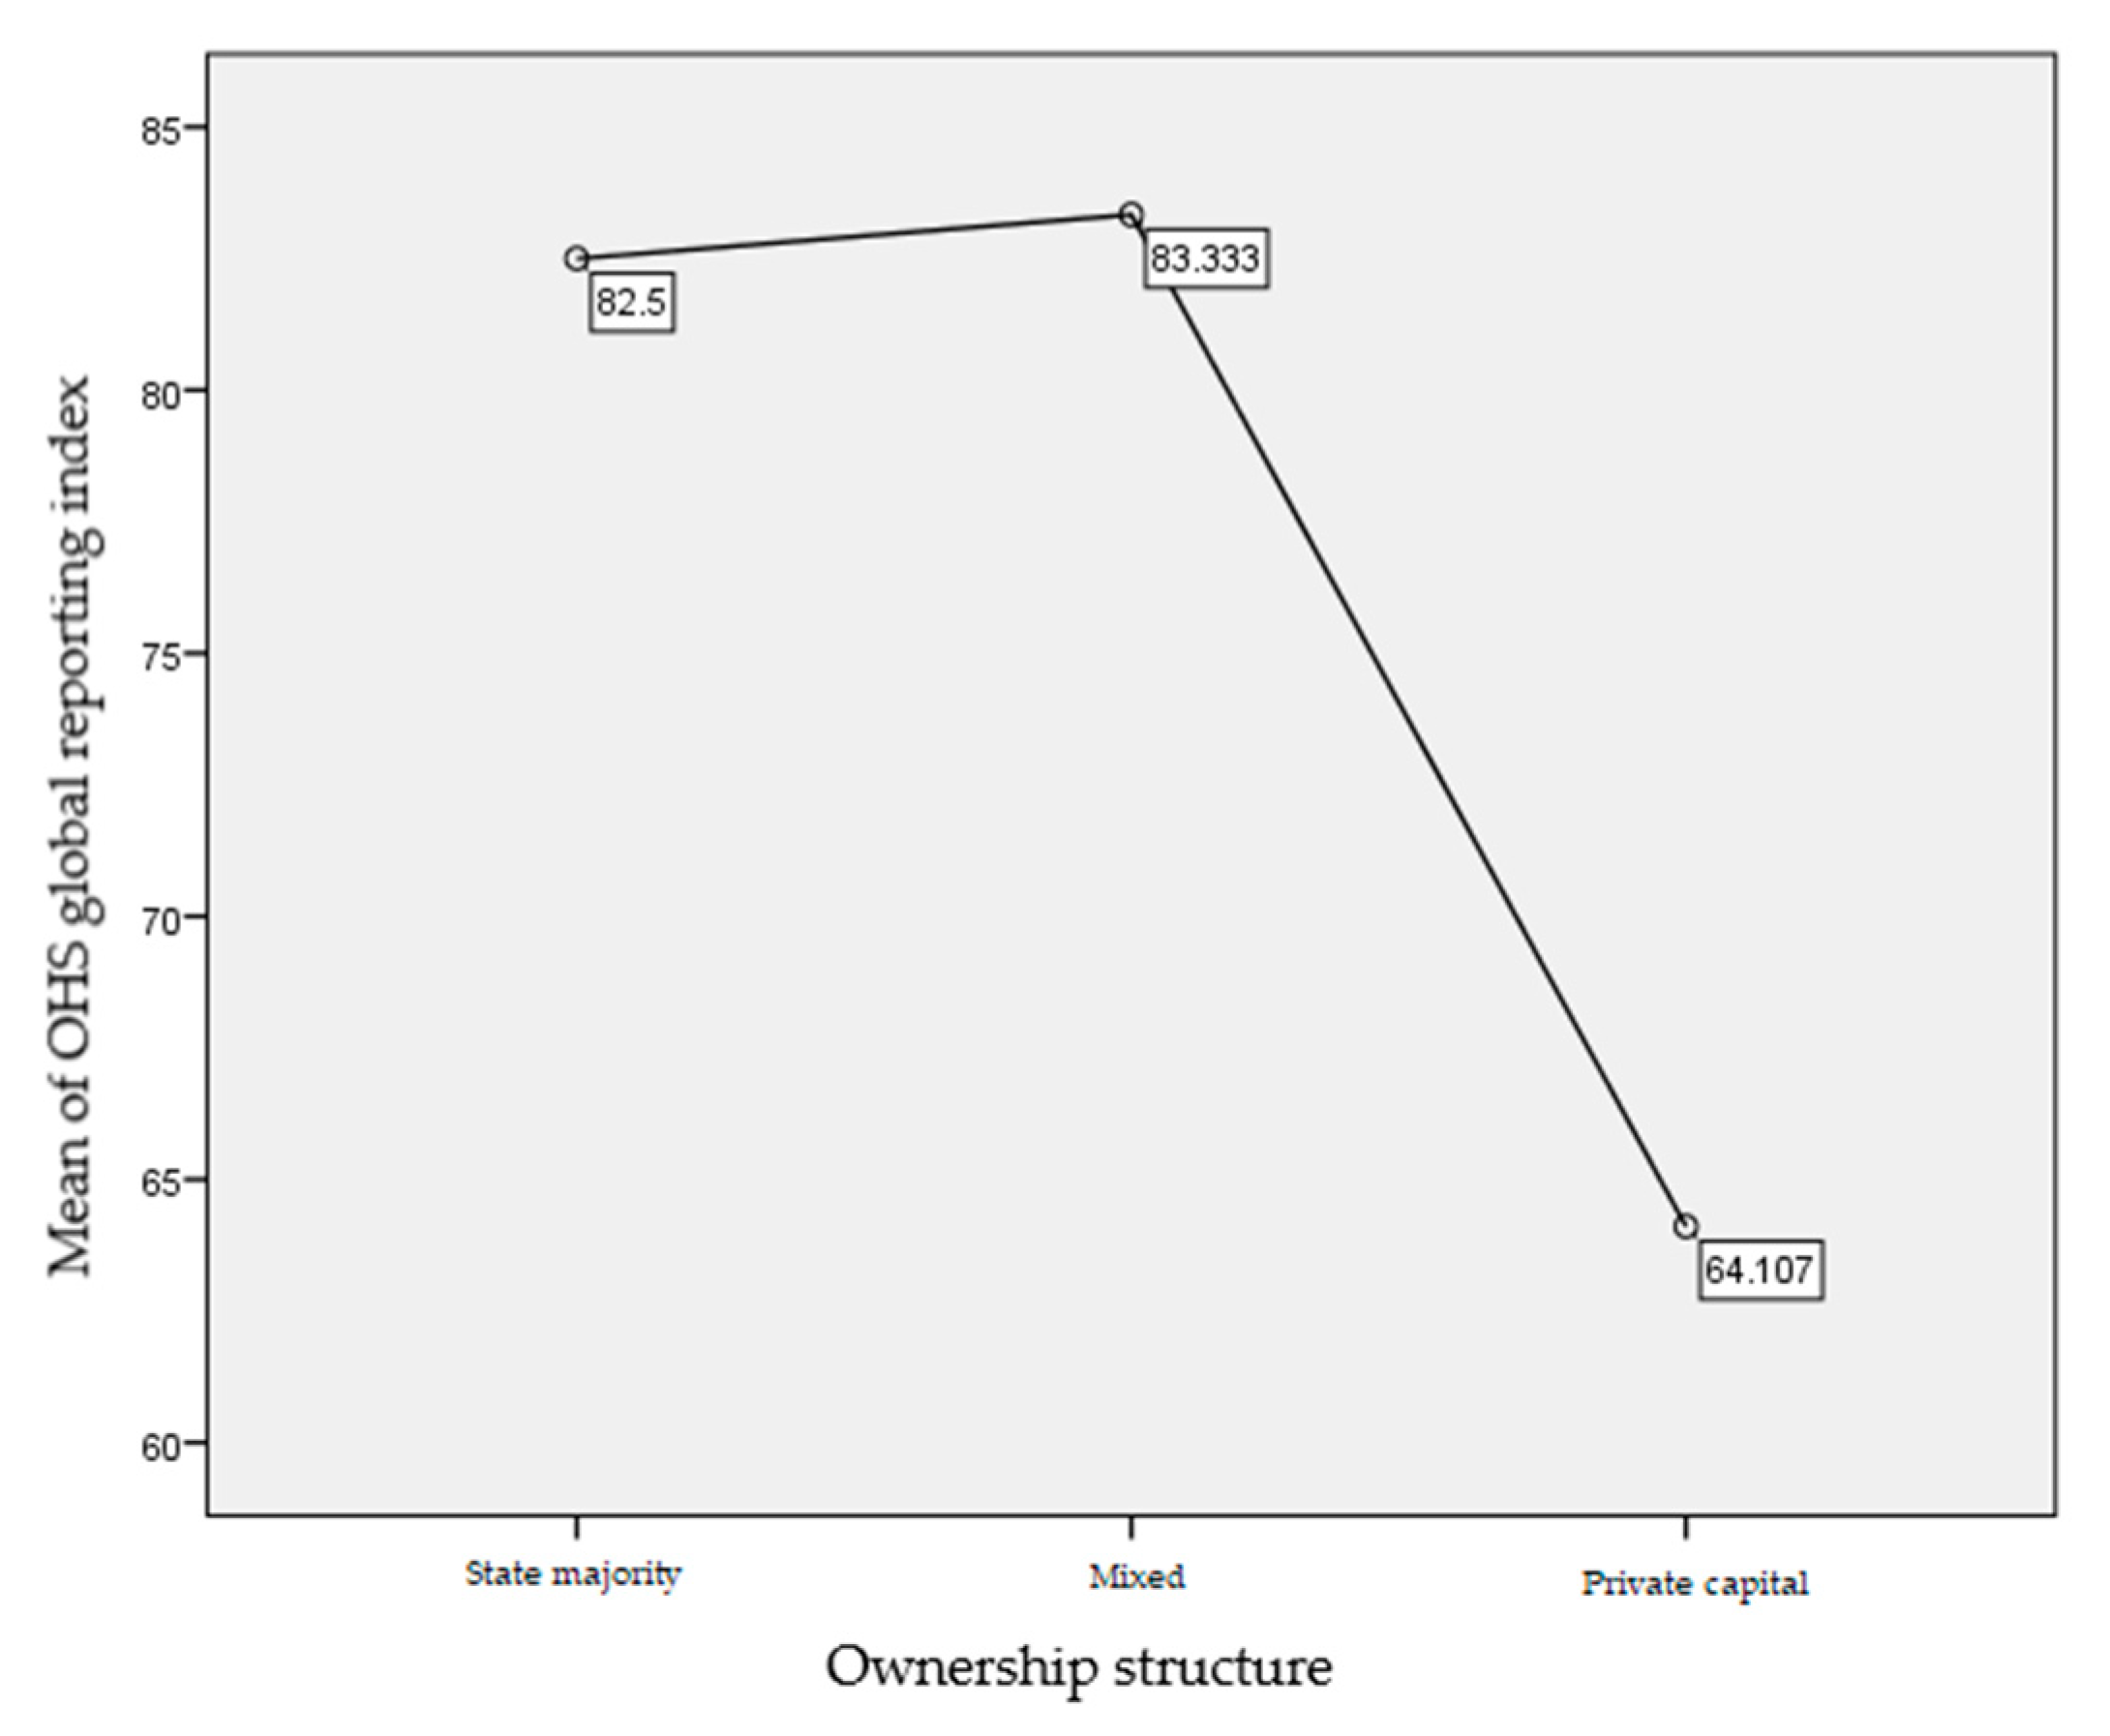
However, the graphical representation of means shown in Figure 4, allows us to visualize the differences obtained within the sample for the three categories of the dependent variable.
Thus, the tendency of public-sector and mixed-capital organizations to report more consistently compared to corporations with 100% private capital is obvious. Thus, if for the companies with private capital a mean of the global reporting index of 64.11 (lower than the sample’s mean of 67.86) is obtained, while for the corporations with mixed and majority state-owned capital the reporting indices have significantly higher values: 83.33 and 82.50 respectively.
Regarding the corporations included in our investigation, we must mention Transelectrica, Romgaz and Antibiotics Iași among the majority state-owned corporations that understood the need to adequately respond to the new requirements related to transparency and also to contribute to the paradigm shift that occurs in the domestic business environment, by preparing and releasing, for the first time in 2017, comprehensive sustainability reports, whose contents were very close to the requirements established by international standards.
4.3.2. Analysis of the Correlation between the Global OHS Reporting Index and the Company’s Field of Activity
As in the previous cases, we will first analyse the observance of the condition of normality of the dependent variable on each category of the independent variable (the field of activity). The statistical instrument used is the Shapiro–Wilk statistical test (Table 11).
The results of the Shapiro–Wilk test show that the dependent variable is normally distributed over five of the categories of the dependent variable “field of activity”. For the categories “trade” and “other branches of the processing industry”, the variable Global OHS Reporting Index is not normally distributed. The homogeneity test of the dispersions in this case generates the results synthesized in Table 12.
Therefore, F (7.27) = 1.890 and p > 0.05, so the condition of dispersion homogeneity is fulfilled. The results of the One-Way ANOVA analysis are summarized in Table 13.
The calculated value is F (7.27) = 1.380; from comparing the computed F value with a table value corresponding to a 95% probability guarantees and to the number of degrees of freedom mentioned in Table 12 (7 and 27, respectively), it follows that p = 0.254 > 0.05. As a result, we accept the null hypothesis, which stipulates that there are no significant differences between the mean values of the Global OHS reporting index by the categories of the variable “field of activity”.
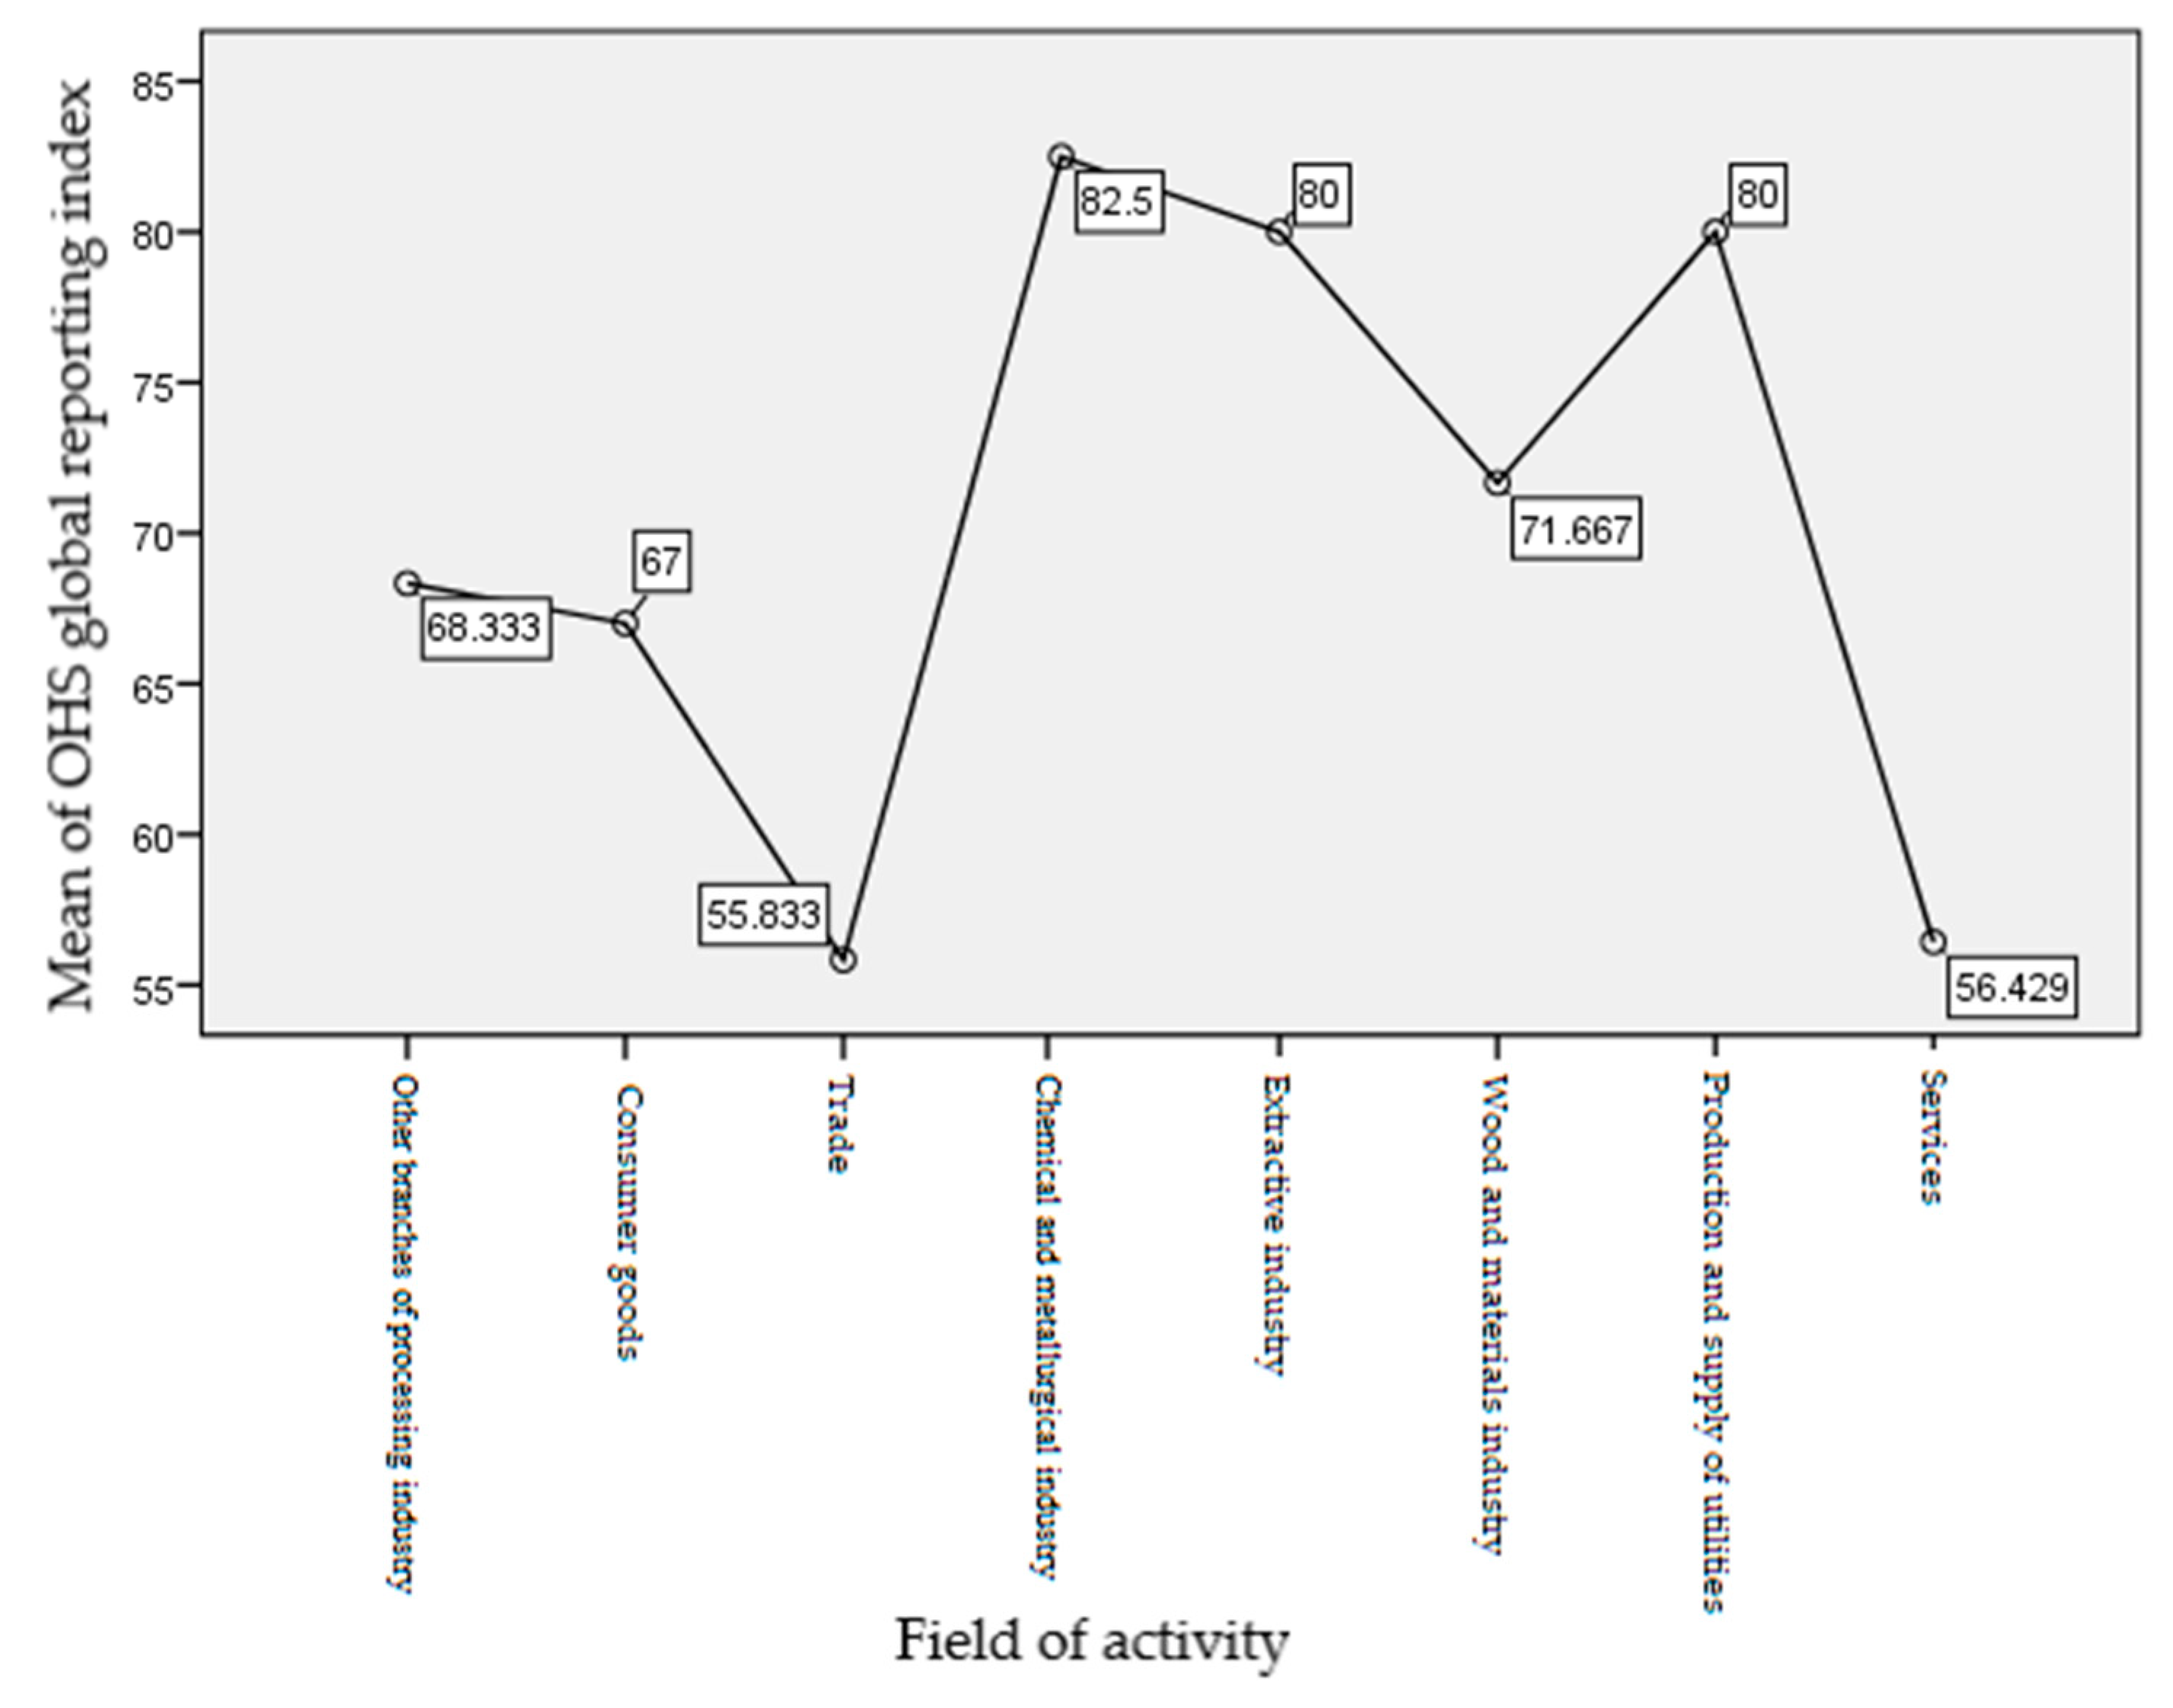
Again, the graphical representation of the means of the two variables, displayed within the Figure 5, is extremely suggestive and helps us to draw some interesting conclusions.
Thus, at the level of our sample, the highest means of the global OHS reporting index can be found in the following domains: chemical and metallurgical industry; extractive industry (in this category there are three major companies active in the oil and gas extraction sector); the production and supply of utilities. From this perspective, it is welcomed the responsible approach of the managers of companies in these “sensitive industrial areas”, which place the issue of occupational safety and health at the core of their sustainability strategies, given the specificity of the activities carried out, the extent of the risks that their employees face in the working places and the high level of costs involved in neglecting OHS issues [2,60].
On the other hand, if we analyse the graph in Figure 5 correlated with the content analysis performed in order to substantiate the global reporting indices, we should not omit the fact that although a lower reporting index for companies in the sectors of activity “trade, services and the production of consumer goods” it may seem natural if we consider the specificity of the activities carried out in these areas, there is still room for improvement within these corporations in terms of a more responsible approach to the simple aspects of occupational health and safety such as: representation of employees in OHS committees, respectively implementation of specific programs for the prevention of work injuries and occupational illnesses and/or maintaining the employees’ health status.
4.3.3. Analysis of the Correlation between the Global OHS Reporting Index and the Company’s Affiliation to a Multinational Corporation
We will analyse the null hypothesis H0, which stipulates that there are no statistically significant differences between the means of the OHS index distributed on the two categories of the independent variable: belonging to a multinational company (“Yes”), respectively a domestic company (“No”). In order to verify whether there are significant differences between the means of the numerical variable (the Global OHS reporting index) calculated on the two categories of the nominal variable (affiliation to a multinational corporation), we use the t test for independent samples. The premises that must be met for the application of this test are the following:
- The dependent variable must be a numeric variable that is normally distributed over the two categories of the independent variable;
- The variances of the groups must be similar. This verification is done using the Levene homogeneity test, but the SPSS program is also able to deal with situations where these variances are uneven, in which case the test will provide an adjusted value for t.
We apply the t test for independent samples and check the normality of the dependent variable on the categories of the independent variable. Both the Kolmogorov–Smirnov test results and those of the Shapiro–Wilk normality test demonstrate that the dependent variable is normally distributed over each of the two subgroups (Table 14).
Thus, for Shapiro–Wilk the results are: p = 0.514 for the companies belonging to parent multinational corporations, respectively p = 0.385 for the domestic companies. Since in each case the condition p > 0.05 is met, the normality hypothesis for each of the two subgroups is demonstrated.
We will not check the variance equality only through the Levene test, but we will also use the t test, given that this test is stronger and provides solutions for the situation where the differences between variances are encountered. Therefore, we applied the t test with the help of SPSS and we obtained the results mentioned in Table 15.
Analysing the results of the Levene test of homogeneity of variances, it follows that we have F (33) = 3.247 and p = 0.081 > 0.0.5; therefore, the variances are assumed to be equal. Additionally, the results of the t test will be taken from the first line of the table below: t (33) = −1.524 and p = 0.137. Hence, in this case we cannot reject the null hypothesis either and we will decide that there are no statistically significant differences between the mean values of Global OHS Reporting Index for the two categories of the independent variable.
In order to highlight the existing differences in the investigated sample, we summarize in Table 16 the descriptive analysis indicators for the Global OHS Reporting Index for the two categories of the independent variable. Thus, we obtained an interesting and slightly atypical result, according to which the companies belonging to an MNC have a mean OHS index of m1 = 64.60 with a standard deviation of s1 = 22.45, and those with domestic capital are characterized by a higher mean: m2 = 76.00, with a standard deviation s2 = 11.00.
We found that the values of the global reporting index are higher among the companies with domestic capital, compared to the values of the same dependent variable measured in the case of the subsidiaries of the multinational corporations operating in the territory of Romania. In this context, our findings indicate an extremely positive evolution for the companies with domestic capital: the increase in the percentage of organizations that have consolidated integrated management systems for their businesses has led to higher performances in terms of occupational health and safety issues.
5. Discussion
The present study was focused on identifying the main determinants that exert significant impacts on the level of OHS disclosure among large corporations operating in the Romanian market. We have assessed the quality of health and safety disclosures within the framework of the new legislative constraints set forth by the implementation of Directive 2014/95/EU. The research adds the extant literature on the non-financial disclosure issue in Romania an empirical contribution on the reporting phenomenon within the OHS domain, which most likely represents the first approach with national coverage on the subject. Form among the most presumable factors to affect the quality of OHS disclosure put forward in CSR/sustainability/non-financial reports, we have chosen, based on the literature review outcomes, the following determinants: the company size; the market share; the ownership structure; the type of industry and the affiliation to a multinational parent corporation.
In respect with our first hypothesis H1 according to which the size of the reporting company is positively correlated with the quality of OHS disclosure, our findings seem to call in question the results put forward by the majority of studies currently undertaken. A closer look on the issue leads us to believe that this conclusion requires a wider vision. Thus, in line with the study conducted by Dyduch et al. [11] we can rather state that the company’s size cannot be judged categorically as a determinant of the non-financial/OHS disclosure.
Hence, the majority of the researchers from the literature take into consideration two distinct proxies in order to measure the size of a reporting company–i.e., the turnover and the number of employees. While the first independent variable (the turnover) was strongly recommended by several studies (Hahn et al. [36]; Tagesson et al. [18]) as a key factor affecting the quality of the sustainability disclosure, the employment size creates the impression of an irrelevant association with the dependent variable. The review of the literature enabled us to identify other studies that employed the above-mentioned proxies in order to measure the corporation’s size. For instance, Tagesson et al. [18], concluded that social disclosures are more likely to correlate with the number of employees, whereas other sections of sustainability reports would be associated with corporate turnover. In consonance with these findings, we chose the staff number as a proper dimension for measuring the size of the reporting company, having in mind the obvious interaction between health and safety at workplaces and human resources issues. However, our statistical analyses showed that the level of OHS disclosure in Romania is not significantly affected by the corporations’ number of employed persons. Furthermore, with regard to the hypothesis H1, we agree with Ozigi et al. [22] according to which the disclosure on employee issues may present, more or less, country-specific archetypes since the reporting practices became compulsory in EU countries (Williams et al. [61]). As far as our sample of 35 Romanian corporations is regard, the employment size does no significantly impact the level of disclosure in the OHS domain.
The hypothesis H2 which verified the correlation between OHS information and company’s visibility on the market was supported. The literature provides several proxies for corporate visibility: the media exposure of the company, the supply-chain position, the market share and other brand-related features (Michelon [62]; Dura C. et al. [63]; Wang et al. [31]; Tan et al. [64]; Hahn et al. [36]). Our findings are consistent with the outcomes emphasized by Wang et al. [31] and Tan et al. [64]. Thus, the moderate positive link between the magnitude of OHS reporting and the market share of the reporting corporation can be interpreted as follows: companies with solid market positions tend to produce quality sustainability reports (within which the OHS component occupies a privileged place), in order to strengthen their successful corporate brand among consumers, business partners and even their own employees. The greater the company’s visibility on the market, the higher is the public scrutiny and the employee’s attention towards its operations.
In our research, we also put forward hypothesis H3 according to which there is an association between the ownership structure of the reporting company and the level of OHS disclosure. From statistical point of view, we rejected the hypothesis H3, but an in-depth analysis supported by the suggestive graphical representations generated by SPSS, showed some differences in the level of disclosures between private and public companies. Prior studies in the literature performed by Eng et al. [65], Galo et al. [66], Tagesson et al. [18] demonstrated that majority state owned corporations are more likely to exhibit higher levels of sustainability/non-financial disclosures than the other categories. However, the literature stream contains also several researches that claim the opposite conclusion: Haniffa et al. [67], Aman et al. [68]. In the Romanian case, corporations in the public sector and those with mixed capital have higher values of the Global reporting index compared to private capital corporations. Although the non-financial reporting system was initially designed for private sector corporations, at present, the balance seems to be in favour of adopting at a higher quality level, good reporting practices by the public sector and by the firms with mixed capital. Thus, we concluded that the relationship with a wide range of stakeholders (including the general public and consumers paying taxes), but also the recent change of the legislative framework in our country and the careful monitoring by the regulatory bodies, were the factors that drove the corporations in the public domain to assume a higher level of responsibility for the sustainability of the activities carried out and also to raise the degree of attention paid to issues related to occupational safety and health.
The next hypothesis H4 stipulated that there was a significant correlation among the industry (i.e., the economic sector) that incorporates the reporting company and its level of awareness regarding the sustainability/OHS disclosure. There is abundant literature which has previously discussed and proved the existence of the previously mentioned relationship: Sotorrío et all. [17]; Reverte et al. [16]; Aman et al. [68]; Gamerschlag et al. [15]; Tan et al. [64] Kansal et al. [28]; Jaffar et al. [25] etc. Although the statistical significance of this hypothesis was not supported at the level of our sample, the highest means of the global OHS reporting index could be found within the so called “sensitive industries” susceptible of producing hazardous materials and increased OHS risks: chemical and metallurgical industry; extractive industry; the production and supply of utilities and son on. Thus, we considered that the trustworthy attitude demonstrated by the sustainable-oriented approach of managers of from these sectors is beneficial, given the high level of costs involved in neglecting OHS issues: the increased incidence of work-related injuries and occupational diseases, occupational stress and adjacent risks, low level of labour productivity and output, financial losses caused by lost work time as a result of accidents, the deterioration of the reputation and the image of the corporation etc. We acknowledge that other non-financial effects which are more difficult to quantify could have amplified the shortcomings borne by the large employers from the “sensitive industries” which would lack an adequate managerial vision in the field of safety and health at work.
The last hypothesis, H5 argued that the reporting company’s affiliation to a multinational corporation is significantly impacting its level of disclosure in the OHS area. Surprisingly, we found that this determinant also encountered as “the presence of reporting company’s in foreign markets” or “the level of its internationalization” is under-researched in the literature. The most relevant studies on the subject were conducted by Freedman et al. [69]; Reverte [16] and Kolk et al. [70]. According to these authors, the affiliation of the reporting company to a multinational was initially believed to have a positive effect upon the disclosure consistency. Thus, the wider variety of stakeholders’ demands, the multiplicity of legislative requirements, the cultural diversity as well as the heterogeneity of values embraced by customers and employees, would drive companies with international operations to disclose a larger volume of information. Furthermore, in the Romanian case, there were a number of empirical studies in the literature that showed that large multinational corporations played the spearhead role in introducing CSR/sustainability best practices in our country (Dura et al. [63]; Băleanu et al. [45]; Filip et al. [46]; Iamandi et al. [47]). However, the research conducted for our sample of 35 Romanian corporations allowed us to highlight a turning point in this process. Thus, as the corporations with domestic capital complied with the Directive 2014/95/EU and, at the same time, understood the benefits of sustainability reporting for the transparency and image of their operations, the percentage of the domestic companies that consolidated their integrated management systems for their business increased significantly, while internal reporting procedures have begun to prove their functionality. Of course, in this context, the so-called “ripple effect” that causes the appearance of mimicry in the sphere of non-financial reporting should not be neglected, but even such an evolution is likely to highlight that CSR /sustainability reporting begins to germinate among local corporations, and OHS issues receive due attention in this context [2,63].
The authors are aware that the study presented in the present paper is not free of limitations. Firstly, the sample size used in order to lay foundations for the empirical research on OHS disclosure in Romania companies does not exceed 35 domestic firms, an overwhelming part of them falling into the large corporation’s category. Although the selection procedure and the limited volume of the total population were largely documented within the Section 3.3, we cannot overlook that our research provides little information on OHS disclosures among small and medium sized enterprises (SME) originating from Romania. Secondly, the way of constructing the Global reporting index which constituted the dependent variable was affected, more or less, by the authors’ subjectivity, as the content analysis relied merely on the rationale and the experience gained by the researchers in their previous work. However, we kept under control, as far as possible, the subjective judgements that could intervene in the process of interpreting the conclusions that were drew up from the content analysis, by using the GRI 403 standard as a disclosure benchmark while evaluating the substance of the OHS section of each sustainability/non-financial report.
Despite its inherent limitations, we believe that our study enriches the literature in several ways. Firstly, it presents on overview of the reporting practices in the OHS area, a crucial component of labour-related sustainability disclosure, which is under-researched by the literature at this moment. Secondly, it examines on empirical basis, a set of determinants which affect the level and the quality of OHS disclosures by the Romanian companies. Finally, the study provides insights into the disclosure practices in Romania, being among the very few attempts of presenting the dimension accomplished by the reporting phenomenon in our country.
6. Conclusions
Our research showed that an increasing number of the managers of the local corporations are in the awareness stage regarding the understanding of the role of the human resource as a pivotal element of the capital of any organization. These local managers demolish the old myth according to which employees’ health and safety efforts were viewed exclusively as a cost-generating legal obligation and make the transition to a new approach in managerial thinking, based on investing in promoting OHS as a generator of multiple benefits for employees, for the company and the local community in which it operates.
While a new approach regarding the disclosure of sustainability/non-financial information is still in the making, we strongly recommend the Romanian managers to prepare and release the reports on a regular basis. Besides, taking into consideration the lack of consistency with the international reporting standards, we believe that achieving a higher level of compliance with the benchmarks represents another top priority in the near future. In this respect, the external assurance of sustainability/non-financial reporting represents a strategy that must be adopted by the Romanian corporations in order to increase the robustness, the confidence and the reliance of disclosed data.
As far as the SME sector is concerned, although it was initially estimated that the Directive 2014/95/EU would have a strong knock-on effect on the small enterprises operating in the supply chain of large corporations, we found that this was not the case in Romania, at least for the first few years following the transposition of the European guidelines into the national legislation. Therefore, there is still a lot to do by the government, the community and the stakeholders in order to join forces and to advocate for wider dissemination of the sustainable principles within the Romanian business environment.
Author Contributions
Conceptualization, C.C.D.; data curation, A.P.P.; funding acquisition, A.P.P. and C.A.I.; methodology, C.C.D.; project administration, R.I.M.; resources, S.M.; supervision, R.I.M.; visualization, S.M.; writing—review and editing, C.A.I. All authors have read and approved the final manuscript.
Funding
This research received no external funding.
Conflicts of Interest
The authors declare no conflict of interest.
Appendix A

Table A1.
The List of Reporting Romanian Companies between 2003 and 2017.
| Company | Reports Number | Year | ||||||||||||||
|---|---|---|---|---|---|---|---|---|---|---|---|---|---|---|---|---|
| 2003 | 2004 | 2005 | 2006 | 2007 | 2008 | 2009 | 2010 | 2011 | 2012 | 2013 | 2014 | 2015 | 2016 | 2017 | ||
| Orange Romania | 5 | x | x | x | x | x | ||||||||||
| Holcim Romania | 6 | x | x | x | x | x | x | |||||||||
| BCR | 2 | x | x | |||||||||||||
| OTP Bank | 7 | x | x | x | x | x | x | x | ||||||||
| Siveco Romania | 6 | x | x | x | x | x | x | |||||||||
| Provident Financial Romania | 2 | x | x | |||||||||||||
| Raiffeisen Bank | 9 | x | x | x | x | x | x | x | x | x | ||||||
| Heineken Romania | 6 | x | x | x | x | x | x | |||||||||
| Telekom Romania | 6 | x | x | x | x | x | x | |||||||||
| Ursus Breweries | 4 | x | x | x | x | |||||||||||
| GSK Romania | 5 | x | x | x | x | x | ||||||||||
| OMV Petrom | 5 | x | x | x | x | x | ||||||||||
| Coca-Cola HBC Romania | 3 | x | x | x | ||||||||||||
| Heidelberg Cement | 2 | x | x | |||||||||||||
| Rom radiatoare SA | 4 | x | x | x | x | |||||||||||
| KPMG Romania | 2 | x | x | |||||||||||||
| Lafarge Romania | 1 | x | ||||||||||||||
| Auchan Romania | 2 | x | x | |||||||||||||
| KMG International (Rompetrol) | 1 | x | ||||||||||||||
| ArcelorMittal | 3 | x | x | x | ||||||||||||
| Maguay Romania | 1 | x | ||||||||||||||
| Insoft Romania | 1 | x | ||||||||||||||
| Farmaciile Dona | 1 | x | ||||||||||||||
| Electrica | 1 | x | ||||||||||||||
| CEZ Group Romania | 1 | x | ||||||||||||||
| Distributie Energie Oltenia | 1 | x | ||||||||||||||
| Kaufland Romania | 1 | x | ||||||||||||||
| Lidl Romania | 1 | x | ||||||||||||||
| Transelectrica | 1 | x | ||||||||||||||
Table A2.
Database with the 35 companies included in the sample and the analysed variables.
| Crt. no. | Company Name | Number of Employees 2017 | Market Share 2017 | Property Structure | Field of Activity | Affiliation to MNC | Global OHS Reporting Index |
|---|---|---|---|---|---|---|---|
| 1 | Antibiotics Iaşi | 1420 | 15.65 | Majority State | Pharmaceutical industry | No | 90 |
| 2 | Coca Cola HBC Romania | 1476 | 37.39 | Private | Food industry | Yes | 60 |
| 3 | Heineken Romania | 1157 | 29.2 | Private | Food industry | Yes | 50 |
| 4 | Ursus Breweries | 1443 | 42.93 | Private | Food industry | Yes | 40 |
| 5 | Zentiva | 548 | 18.04 | Private | Pharmaceutical industry | Yes | 95 |
| 6 | Auchan | 9290 | 3.93 | Private | Retail | Yes | 65 |
| 7 | GSK Romania | 142 | 1.81 | Private | Wholesale | Yes | 70 |
| 8 | Kaufland România | 13,519 | 7.58 | Private | Retail | Yes | 70 |
| 9 | Lidl Romania | 4815 | 46.79 | Private | Retail | Yes | 65 |
| 10 | ROMSTAL | 1132 | 14.19 | Private | Wholesale | Yes | 50 |
| 11 | SIEPCOFAR | 1946 | 5.15 | Private | Retail | Yes | 15 |
| 12 | ADREM Invest | 770 | 1.48 | Private | Consulting services | No | 75 |
| 13 | Antalis Romania | 86 | 5.15 | Private | Distribution services | No | 60 |
| 14 | KPMG | 519 | 3.21 | Private | Consulting services | Yes | 45 |
| 15 | Patria Bank | 1018 | 0.85 | Private | Financial banking services | Yes | 30 |
| 16 | Raiffeisen Bank | 5314 | 8.42 | Private | Financial banking services | Yes | 60 |
| 17 | Telekom | 5078 | 46.74 | Private | Telecommunications services | Yes | 55 |
| 18 | Vodafone | 2508 | 36.26 | Private | Telecommunications services | Yes | 70 |
| 19 | KMG Rompetrol Grup | 224 | 2.06 | Mixed | Oil and gas industry | Yes | 70 |
| 20 | OMV Petrom | 13,790 | 99.07 | Mixed | Oil and gas industry | Yes | 100 |
| 21 | Romgaz | 6046 | 93.19 | Majority State | Oil and gas industry | No | 80 |
| 22 | National Salt Company | 1660 | 95.7 | Majority State | Salt extraction industry | No | 70 |
| 23 | ALRO Slatina | 2501 | 59.99 | Private | Metallurgical industry | Yes | 100 |
| 24 | AMEROPA Romania /Azomureş | 1252 | 86.74 | Private | Chemical industry | Yes | 75 |
| 25 | ArcelorMittal Galaţi | 5682 | 52.37 | Private | Metallurgical industry | Yes | 85 |
| 26 | Ciech Soda România | 587 | 48.8 | Private | Chemical industry | No | 70 |
| 27 | Heidelberg Cement Romania | 955 | 30.87 | Private | Construction materials industry | Yes | 90 |
| 28 | Holcim | 755 | 36.44 | Private | Construction materials industry | Yes | 95 |
| 29 | Holzindustrie Schweighofer | 1945 | 25.07 | Private | Wood industry | Yes | 30 |
| 30 | CEZ Romania | 465 | 1.6 | Privat | Energy industry | Yes | 70 |
| 31 | Electrica Group | - | - | Mixed | Energy industry | No | 80 |
| 32 | Transelectrica | 2063 | 99.71 | Majority State | Energy industry | No | 90 |
| 33 | Aerostar Bacău | 1834 | 23.4 | Private | The aeronautical industry | No | 60 |
| 34 | Rombat Metair | 733 | 86.15 | Private | Electro-technical industry | Yes | 60 |
| 35 | Vrancart | 1072 | 9.21 | Private | The pulp and paper industry | No | 85 |
References
- Amos, O.A.; Uniamikogbo, E. Sustainability and Triple Bottom Line: An Overview of Two Interrelated Concepts. Igbinedion Univ. J. Account. 2016, 2, 88–126. [Google Scholar]
- Păun, A.P. Cercetări Empirice Privind Performanța de Securitate în Contextul Responsabilității Sociale Corporative (Research on Occupational Health and Safety Performance within the Framework of Corporate Social Responsibility). Ph.D. Thesis, University of Petroșani, Petroșani, România, 2019. [Google Scholar]
- Tiron-Tudor, A.; Nistor, C.S.; Ștefănescu, C.A.; Zanellato, G. Encompassing Non-Financial Reporting in A Coercive Framework for Enhancing Social Responsibility: Romanian Listed Companies’ Case. Amfiteatru Econ. J. 2019, 21, 590–606. [Google Scholar] [CrossRef]
- GRI’s Sustainability Disclosure Database. Available online: https://database.globalreporting.org (accessed on 15 May 2019).
- Ducu, C.; Toma, B. Obligativitatea raportării non-financiare de către companii din UE—Impactul Directivei 2014/95/UE asupra mediului de afaceri din România (The Mandatory Character of Non-Financial Reporting by EU Companies—The Impact of EU Directive 2014/95/EU upon the Business Environment in Romania); Policy Memo 57; Centre for Advanced Research in Management and Applied Ethics & The Romanian Centre for European Policies: Bucharest, România, 2014. [Google Scholar]
- Giorgi, G.; Arcangeli, G.; Mucci, N.; Cupelli, V. Economic Stress in Workplace: The Impact of Fear the Crisis on Mental Health. Work 2015, 51, 135–142. [Google Scholar] [CrossRef] [PubMed]
- Cañón-de-Francia, J.; Garcés-Ayerbe, C. Factors and Contingencies for the “It Pays to Be Green Hypothesis”. The European Union’s Emissions Trading System (EU ETS) and Financial Crisis as Contexts. Int. J. Environ. Res. Public Health 2019, 16, 2988. [Google Scholar] [CrossRef] [PubMed] [Green Version]
- Dias, A.; Lima Rodrigues, L.; Craig, R. Global Financial Crisis and Corporate Social Responsibility Disclosure. Soc. Responsib. J. 2016, 12, 654–671. [Google Scholar] [CrossRef]
- García-Benau, M.A.; Sierra—Garcia, L.; Zorio, A. Financial Crisis Impact on Sustainability Reporting. Manag. Decis. 2013, 51, 1528–1542. [Google Scholar] [CrossRef]
- Yelkikalan, N.; Köse, C. The Effects of the Financial Crisis on Corporate Social Responsibility. Int. J. Bus. Soc. Sci. 2012, 3, 292–300. [Google Scholar]
- Dyduch, J.; Krasodomska, J. Determinants of Corporate Social Responsibility Disclosure: An Empirical Study of Polish Listed Companies. Sustainability 2017, 9, 1934. [Google Scholar] [CrossRef] [Green Version]
- Matuszak, L.; Rózańska, E. CSR Disclosure in Polish Listed Companies in the Light of Directive 2014/95/EU Requirements: Empirical Evidence. Sustainability 2017, 9, 2304. [Google Scholar] [CrossRef] [Green Version]
- Maj, J.; Hawrysz, L.; Bębenek, P. Determinants of Corporate Social Responsibility Disclosure in Polish Organizations. Int. J. Contemp. Manag. 2018, 17, 197–215. [Google Scholar] [CrossRef]
- Verbeeten, F.H.M.; Gamerschlag, R.; Möller, K. Are CSR Disclosures Relevant for Investors? Empirical Evidence from Germany. Manag. Decis. 2016, 54, 1359–1382. [Google Scholar] [CrossRef]
- Gamerschlag, R.; Möller, K.; Verbeeten, F. Determinants of voluntary CSR disclosure: Empirical evidence from Germany. Rev. Manag. Sci. 2011, 5, 233–262. [Google Scholar] [CrossRef] [Green Version]
- Reverte, C. Determinants of Corporate Social Responsibility Disclosure Ratings by Spanish Listed Firms. J. Bus. Ethics 2009, 88, 351–366. [Google Scholar] [CrossRef]
- Sotorrío, L.L.; Sánchez, J.L.F. Corporate Social Reporting for Different audiences: The Case of Multinational Corporations in Spain. Corp. Soc. Responsib. Environ. Manag. 2010, 17, 272–283. [Google Scholar] [CrossRef]
- Tagesson, T.; Blank, V.; Broberg, P.; Collin, S.O. What Explains the Extent and Content of Social and Environmental Disclosures on Corporate Web Sites: A Study of Social and Environmental Reporting in Swedish Listed Corporations. Corp. Soc. Responsib. Environ. Manag. 2009, 16, 352–364. [Google Scholar] [CrossRef]
- Denčić-Mihajlov, K.; Spasić, D. Mandatory and Voluntary Disclosures of Serbian Listed Companies—Achieved Level and Some Recommendation for Improving their Relevance. Int. J. Bus. Econ. Sci. Appl. Res. 2016, 9, 27–38. [Google Scholar]
- Elfeky, M.I. The Extent of Voluntary Disclosure and Its Determinants in Emerging Markets: Evidence from Egypt. J. Financ. Data Sci. 2017, 3, 45–59. [Google Scholar] [CrossRef]
- Kiliç, M.; Kuzey, C. Factors Influencing Sustainability Reporting: Evidence from Turkey. Recent Issues Account. Financ. Audit. 2017, 139–175. Available online: https://ssrn.com/abstract=3098812 (accessed on 27 February 2019). [CrossRef]
- Kuzey, C.; Uyar, A. Determinants of Sustainability Reporting and Its Impact on Firm Value: Evidence from the Emerging Market of Turkey. J. Clean. Prod. 2017, 143, 27–39. [Google Scholar] [CrossRef]
- Ozigi, O.; Binti Mohd Said, R.; Bin Mat Daud, Z. Determinants and Level of Corporate Sustainability Disclosure on Employees in Malaysia. Int. J. Econ. Commer. Manag. 2017, V, 218–235. [Google Scholar]
- Rahman, N.H.W.A.; Zain, M.M.; Al-Haj, N.H.Y.Y. CSR Disclosures and its Determinants: Evidence from Malaysian Government Link Companies. Soc. Responsib. J. 2011, 7, 181–201. [Google Scholar] [CrossRef]
- Jaffar, R. The Environmental Reporting Practice of ‘Environmentally Problematic Companies’ in Malaysia. Int. J. Account. Gov. Soc. 2006, 1, 37–47. [Google Scholar]
- Roman Cahaya, F. Health and Safety Disclosures in Indonesia: A CSR Convergence Strategy. J. Ekonomi Syariah Indonesia 2012, 2, 143–154. [Google Scholar] [CrossRef]
- Pravita Ariyani, A.; Digdo Hartomo, O. Analysis of Key Factors Affecting the Reporting Disclosure Indexes of Sustainability Reporting in Indonesia. Int. J. Bus. Econ. Law 2018, 16, 15–25. [Google Scholar]
- Kansal, M.; Joshi, M.; Batra, G.S. Determinants of Corporate Social Responsibility Disclosures: Evidence from India. Adv. Account. 2014, 30, 217–229. [Google Scholar] [CrossRef]
- Joshi, G.S.; Hyderabad, R.L. Determinants of Corporate Social Responsibility Reporting in India. J. Manag. 2018, 6, 1–10. [Google Scholar] [CrossRef]
- Al-Hamadeen, R.; Badran, S. Nature and Determinants of CSR Disclosure: Experience of the Jordanian Public Shareholding Companies. Eur. J. Bus. Manag. 2014, 6, 18–34. [Google Scholar]
- Wang, J.; Song, L.; Yao, S. The Determinants of Corporate Social Responsibility Disclosure: Evidence from China. J. Appl. Bus. Res. 2013, 29, 1833–1848. [Google Scholar] [CrossRef]
- Gao, Y. Corporate Social Performance in China: Evidence from Large Firms. J. Bus. Ethics 2009, 89, 23–35. [Google Scholar] [CrossRef]
- Li, N.; Toppinen, A.; Tuppura, A.; Puumalainen, K.; Hujala, M. Determinants of Sustainability Disclosure in the Global Forest Industry. Electron. J. Bus. Ethics Organ. Stud. 2011, 16, 33–40. [Google Scholar]
- Galant, A.; Cadez, S. Corporate Social Responsibility and Financial Performance Relationship: A Review of Measurement Approaches. Econ. Res. 2017, 30, 676–693. [Google Scholar] [CrossRef]
- Habek, P.; Wolniak, R. Assesing the Quality of Corporate Social Responsibility Reports: The Case of Reporting Practices in Selected European Union Member States. Qual. Quant. 2016, 50, 399–420. [Google Scholar] [CrossRef] [PubMed] [Green Version]
- Hahn, R.; Kuhnen, M. Determinants of sustainability reporting: A review of results, trends, theory, and opportunities in an expanding field of research. J. Clean. Prod. 2013, 59, 5–21. [Google Scholar] [CrossRef]
- Finstad, G.L.; Ariza-Montes, A.; Giorgi, G.; Lecca, L.I.; Arcangeli, A.; Mucci, N. The JDCS Model and Blue-Collar Bullying: Decent Working Conditions for a Healthy Environment. Int. J. Environ. Res. Public Health 2019, 16, 3411. [Google Scholar] [CrossRef] [PubMed] [Green Version]
- Rasool, S.M.; Wang, M.; Zhang, Y.; Samma, M. Sustainable Work Performance: The Roles of Workplace Violence and Occupational Stress. Int. J. Environ. Res. Public Health 2020, 17, 912. [Google Scholar] [CrossRef] [PubMed] [Green Version]
- Stnikov, C. Corporate Social Responsibility in Romania: Evolutions, Trends and Perspectives. In Corporate Social Responsibility in Europe—United in Sustainable Diversity; Idowu, S., Schmidpeter, R., Fifka, M., Eds.; Springer International Publishing: Cham, Switzerland, 2015; pp. 381–395. [Google Scholar]
- Ducu, C.; Băndilă, R. Research on the International Non-Financial Reporting Standards—Working Paper of the Clean Business Coalition; Clean Business Coalition & Romanian Business Leaders Foundation: Bucharest, Romania, 2013. [Google Scholar]
- Lungu, C.; Caraiani, C.; Dascălu, C. Cercetări privind raportarea responsabilității sociale corporative (Research on Corporate Social Responsibility Reporting). Amfiteatru Econ. J. 2011, 13, 117–131. [Google Scholar]
- Dura, C.; Drigă, I.; Păun, A.P. OHS Disclosure in Romania in the Framework of CSR Reporting. Suppl. Qual. Access Success J. 2019, 20, 429–435. [Google Scholar]
- Dura, C.C.; Drigă, I.; Isac, C. Environmental Reporting by Oil and Gas Multinationals from Russia and Romania: A Comparative Analysis. Environ. Eng. Manag. J. 2017, 16, 1269–1274. [Google Scholar] [CrossRef]
- Dura, C.; Păun, A.P.; Moraru, R. Empirical Analysis on the Relationship between Corporate Health and Safety Performance and the Financial Outcome within Socially Responsible Companies. Qual. Access Success J. 2018, 19, 155–160. [Google Scholar]
- Băleanu, T.E.; Chelcea, L.; Stancu, A. The social responsibility of the top 100 Romanian companies. An analysis of corporate websites. Amfiteatru Econ. J. 2011, 13, 237–250. [Google Scholar]
- Filip, R.; Iamandi, I.E.; Munteanu, S.M. Corporate Social Responsibility Management Standards in Romania: Application and Evaluation at Corporate Level. Bus. Excell. Manag. 2012, 2, 35–46. [Google Scholar]
- Iamandi, I.E. Empirical Analysis on CSR Communication in Romania: Transparency and Participation. Rom. Econ. J. 2012, 15, 25–50. [Google Scholar]
- Companiile Care Schimbă România (Companies that Change Romania). CSR Rep. 2017, 3, 14–34. Available online: https://issuu.com/thecrrreport/docs/_revista_csr__3__pages (accessed on 15 May 2019).
- Non—Financial Reporting Seen by Performers, Romanian Centre for European Policies. Available online: http://www.crpe.ro/wp-content/uploads/2015/06/Raport-cercetare-raportare-non-financiara-FINAL.pdf (accessed on 15 May 2019).
- Dinamica și Perspectivele Domeniului CSR în România (The Dynamics and Perspectives of the CSR Domain in Romania), Editions V, VI, VII, 2017, 2018, 2019. Available online: https://www.csrmedia.ro/studii-csr/ (accessed on 2 February 2019).
- Romania CSR Index 2017, 2018, 2019. Theazores.ro. Available online: https://www.theazores.ro/romania-csr-index (accessed on 25 April 2019).
- GRI 403: Occupational Health & Safety, Global Reporting Initiative. 2018. Available online: https://www.globalreporting.org/standards/gri-standards-download-center/gri-403-occupational-health-and-safety-2018/ (accessed on 11 January 2019).
- Obrad, C.; Gherheș, V. A Human Resource Perspective on Responsible Corporate Behavior. Case Study: The Multinational Companies in Western Romania. Sustainability 2018, 10, 726. [Google Scholar] [CrossRef] [Green Version]
- Cristinel, C. Analiza Datelor de Marketing. Aplicații în SPSS (Marketing Data Analysis. SPSS Applications); Editura CH Beck: București, România, 2012; pp. 28–191. [Google Scholar]
- Gabor, M.R. Analiza și Inferența Statistică a Datelor de Marketing (Analysis and Statistical Inference of Marketing Data); Editura C.H. Beck: București, România, 2016; pp. 56–129. [Google Scholar]
- Bucea-Manea-Țoniș, R.; Bucea-Manea-Țoniș, R.; Epure, M. SPSS și Excel în Analiza Datelor Statistice în Domeniile Economic, Social, Tehnic (SPSS and Excel in Statistical Data Analysis within the Economic, Social and Technical Fields); Editura AGIR: București, România, 2010; pp. 73–157. [Google Scholar]
- Maxim, C. Analiza Datelor și Gestionarea Informatică a Resurselor Umane (Data Analysis and the Computer Aided Management of Human Resources); Editura Tritonic: București, România, 2013; pp. 144–226. [Google Scholar]
- Tatu, C.I. Analiza Datelor de Marketing (Marketing Data Analysis); Editura ASE: București, România, 2018; pp. 197–300. [Google Scholar]
- Noaghi, S.; Dura, C. Elemente de Statistică Aplicată (The Basis of Applied Statistics); Editura Risoprint: Cluj Napoca, România, 2018; pp. 26–84. [Google Scholar]
- Băbuț, G.; Moraru, R.I.; Dura, C. Conceptual and methodological Framework for Risk Analysis and Evaluation on Seveso Industrial Sites: (I) Risk Evaluation Terminology, Objectives and Stages. Qual. Access Success J. 2015, 16, 111–116. [Google Scholar]
- Williams, S.J.; Adams, C.A. Moral accounting? Employee disclosures from a stakeholder accountability perspective. Account. Audit. Account. J. 2013, 26, 449–495. [Google Scholar] [CrossRef]
- Michelon, G. Sustainability Disclosure and Reputation: A Comparative Study; Working Paper; No. 44; Marco Fanno: Conegliano, Italy, 2017; Available online: http://www.economia.unipd.it/sites/decon.unipd.it/files/20070044.pdf (accessed on 20 August 2019).
- Dura, C.; Drigă, I. The impact of multinational companies from Romania on increasing the level of corporate social responsibility awareness. Contemp. Econ. 2017, 11, 45–66. [Google Scholar] [CrossRef] [Green Version]
- Tan, A.; Benni, D.; Liani, W. Determinants of Corporate Social Responsbility Disclosure and Investor Reaction. Int. J. Financ. Issues 2016, 6, 11–17. [Google Scholar]
- Eng, L.L.; Mak, Y.T. Corporate Governance and Voluntary Disclosure. J. Account. Public Policy 2003, 22, 325–345. [Google Scholar] [CrossRef]
- Gallo, P.J.; Jones Christensen, L. Firm Size Matters: An Empirical investigation of Organizational Size and Ownership on Sustainability-Related Behaviors. Bus. Soc. 2011, 50, 315–349. [Google Scholar] [CrossRef]
- Haniffa, R.M.; Cooke, T.E. Culture, Corporate Governance and Disclosure in Malaysian Corporations. Abacus 2002, 38, 317–349. [Google Scholar] [CrossRef]
- Aman, Z.; Ismail, S. The Determinants of Corporate Sustainability Reporting: Malaysian Evidence. In Proceedings of the 4th International Conference on Management and Muamalah (ICoMM), Putrajaya, Malaysia, 7–8 November 2017. [Google Scholar]
- Freedman, M.; Jaggi, B. Global Warming Disclosures: Impact of Kyoto Protocol Across Countries. J. Int. Financ. Manag. Account. 2011, 22, 46–90. [Google Scholar] [CrossRef]
- Kolk, A.; Fortainer, F. Internationalization and Environmental Disclosure: The Role of Home and Host Institutions. Multinatl. Bus. Rev. 2013, 21, 87–114. [Google Scholar] [CrossRef] [Green Version]
Figure 1.
Main aspects comprised within companies’ non-financial disclosures [2].
Figure 1.
Main aspects comprised within companies’ non-financial disclosures [2].

Figure 2.
Graphical representation of the values of the Global OHS Reporting Index and the number of employees for the companies included in the sample.
Figure 2.
Graphical representation of the values of the Global OHS Reporting Index and the number of employees for the companies included in the sample.

Figure 3.
Graphical representation of the interdependence between the variables “Market Share” and “Global OHS Reporting Index”.
Figure 3.
Graphical representation of the interdependence between the variables “Market Share” and “Global OHS Reporting Index”.

Figure 4.
Graphical representation of the means of the two variables: Global OHS Reporting Index and ownership structure.
Figure 4.
Graphical representation of the means of the two variables: Global OHS Reporting Index and ownership structure.

Figure 5.
Graphical representation of the means of the two variables: Global OHS Reporting Index and the field of activity.
Figure 5.
Graphical representation of the means of the two variables: Global OHS Reporting Index and the field of activity.

Table 1.
The determinants of OHS reporting, the variables included in the research and the null hypotheses.
Table 1.
The determinants of OHS reporting, the variables included in the research and the null hypotheses.
| Determinant | Corresponding Variable | Operational Definition | Formulation of Null Hypotheses | The Type of Variable |
|---|---|---|---|---|
| Form of ownership | Capital structure |
| H0A: The value of the global OHS reporting index does not depend on the capital structure of the corporation | Categorical |
| The size of the corporation | The workforce | Number of employees | H0B: The value of the global OHS reporting index does not depend on the number of employees of the company | Numerical |
| Company’s visibility in the market | Market share | CP = (Corporation’s turnover/Total turnover of the sector) × 100 | H0C: The value of the global OHS reporting index does not depend on the company’s position in the market | Numerical |
| Field of activity | Type of industrial sector |
| H0D: The value of the global OHS reporting index does not depend on the company’s field of activity | Categorical |
| Affiliation to a multinational corporation | A subsidiary of a corporation |
| H0E: The value of the global OHS reporting index does not depend on the affiliation of the company to a multinational corporation | Dichotomous |
Table 2.
Summary of preliminary descriptive analysis of numerical data.
| Variable | No. of Cases Analysed | Minimum Value | Maximum Value | Mean | Median | Mean Standard Deviation | Shapiro–Wilk Normality Tests | ||
|---|---|---|---|---|---|---|---|---|---|
| Statistic | Df | Sig. | |||||||
| Global OHS reporting index | 35 | 15 | 100 | 67.86 | 70 | 20.37 | 0.961 | 35 | 0.250 |
| Number of employees | 34 | 86 | 13,790 | 2929 | 1460 | 3497 | 0.723 | 34 | 0.000 |
| Market share | 34 | 0.85 | 99.71 | 34.94 | 27.13 | 32.22 | 0.863 | 34 | 0.001 |
Table 3.
The extreme values of the variable number of employees (2017).
| Variable | Level | Corporation | Value | |
|---|---|---|---|---|
| Number of employees in 2017 | Highest | 1 | OMV Petrom | 13,790 |
| 2 | Kaufland România | 13,519 | ||
| 3 | Auchan | 9290 | ||
| 4 | Electrica Group | 6601 | ||
| 5 | Romgaz | 6046 | ||
| Lowest | 1 | Antalis România | 86 | |
| 2 | GSK România | 142 | ||
| 3 | KMG Rompetrol Grup | 224 | ||
| 4 | CEZ România | 465 | ||
| 5 | KPMG | 519 | ||
Table 4.
Indices of asymmetry (Skewness) and flattening (Kurtosis) for sub-sample 1 of the number of employees.
Table 4.
Indices of asymmetry (Skewness) and flattening (Kurtosis) for sub-sample 1 of the number of employees.
| Parameters | Value | |
|---|---|---|
| N | Valid | 14 |
| Missing | 0 | |
| Mean | 5792.71 | |
| Median | 5196.00 | |
| Mode | 1945 1 | |
| Std. Deviation | 3955.972 | |
| Skewness | 1.127 | |
| Std. Error of Skewness | 0.597 | |
| Kurtosis | 0.492 | |
| Std. Error of Kurtosis | 1.154 | |
| Minimum | 1945 | |
| Maximum | 13,790 | |
1 Multiple modes exist. The smallest value is shown.
Table 5.
Categorical data descriptive statistics.
| No. | Nominal type Variable | Variable Variant | Frequency | Percentage | Valid Percentage | Cumulative Percentage |
|---|---|---|---|---|---|---|
| 1. | Affiliation to a multinational company | Yes | 25 | 71.4 | 71.4 | 71.4 |
| No | 10 | 28.6 | 28.6 | 100.0 | ||
| Total | 35 | 100.0 | 100.0 | - | ||
| 2. | Capital structure | Majority state ownership | 4 | 11.4 | 11.4 | 11.4 |
| Mixed | 3 | 8.6 | 8.6 | 20.0 | ||
| Private ownership | 28 | 80.0 | 80.0 | 100.0 | ||
| Total | 35 | 100.0 | 100.0 | - | ||
| 3. | Report level | Romania | 26 | 74.3 | 78.8 | 100.0 |
| Group (with brief references to Romania) | 7 | 20.0 | 21.2 | 21.2 | ||
| Total | 33 | 94.3 | 100.0 | - | ||
| 4. | Field of activity | Consumer goods production | 5 | 14.3 | 14.3 | 22.9 |
| Trade | 6 | 17.1 | 17.1 | 40.0 | ||
| Services | 7 | 20.0 | 20.0 | 100.0 | ||
| Extractive industry | 4 | 11.4 | 11.4 | 62.9 | ||
| Chemical and metallurgical industry | 4 | 11.4 | 11.4 | 51.4 | ||
| Wood and construction materials industry | 3 | 8.6 | 8.6 | 71.4 | ||
| Production and supply of utilities | 3 | 8.6 | 8.6 | 80.0 | ||
| Other branches of processing industry | 3 | 8.6 | 8.6 | 8.6 | ||
| Total | 35 | 100.0 | 100.0 | - |
Table 6.
Pearson’s correlation between the Global OHS Reporting Index and the “number of employees of the corporation” (sub-sample 1).
Table 6.
Pearson’s correlation between the Global OHS Reporting Index and the “number of employees of the corporation” (sub-sample 1).
| Global OHS Reporting Index | Number of Employees 2017 | ||
|---|---|---|---|
| Global OHS reporting index | Pearson Correlation | 1 | 0.357 |
| Sig. (2-tailed) | - | 0.210 | |
| N | 14 | 14 | |
| Number of employees 2017 | Pearson Correlation | 0.357 | 1 |
| Sig. (2-tailed) | 0.210 | - | |
| N | 14 | 14 |
Table 7.
Pearson correlation between OHS reporting index and the market shares of the sample corporations.
Table 7.
Pearson correlation between OHS reporting index and the market shares of the sample corporations.
| Global OHS Reporting Index | Market Share (%) 2017 | ||
|---|---|---|---|
| Global OHS reporting index | Pearson Correlation | 1 | 0.364 * |
| Sig. (2-tailed) | - | 0.048 | |
| N | 30 | 30 | |
| Market share (%) 2017 | Pearson Correlation | 0.364 1 | 1 |
| Sig. (2-tailed) | 0.048 | - | |
| N | 30 | 30 |
*,1 Correlation is significant at the 0.05 level (2-tailed).
Table 8.
Checking the normality of the variable “company’s ownership structure” on each category of the dependent variable.
Table 8.
Checking the normality of the variable “company’s ownership structure” on each category of the dependent variable.
| Ownership Structure (Capital) | Kolmogorov-Smirnov 1 | Shapiro-Wilk | |||||
|---|---|---|---|---|---|---|---|
| Statistic | df | Sig. | Statistic | df | Sig. | ||
| Global OHS Reporting Index | Majority State | 0.283 | 4 | . | 0.863 | 4 | 0.272 |
| Mixed | 0.253 | 3 | . | 0.964 | 3 | 0.637 | |
| Private | 0.135 | 28 | 0.200 2 | 0.970 | 28 | 0.576 | |
1 Lilliefors Significance Correction. 2 This is a lower bound of the true significance.
Table 9.
Dispersion homogeneity testing—Global OHS Reporting Index.
| Levene Statistic | df1 | df2 | Sig. |
|---|---|---|---|
| 0.888 | 2 | 32 | 0.421 |
Table 10.
Variance analysis table (ANOVA)—Global OHS Reporting Index.
| Sum of Squares | df | Mean Square | F | Sig. | |
|---|---|---|---|---|---|
| Between Groups | 1969.940 | 2 | 984.970 | 2.595 | 0.090 |
| Within Groups | 12,144.345 | 32 | 379.511 | - | - |
| Total | 14,114.286 | 34 | - | - | - |
Table 11.
Checking the normality of the variable “activity field of the corporation” on each category of the dependent variable.
Table 11.
Checking the normality of the variable “activity field of the corporation” on each category of the dependent variable.
| Activity Field | Kolmogorov-Smirnov 1 | Shapiro–Wilk | |||||
|---|---|---|---|---|---|---|---|
| Statistic | df | Sig. | Statistic | df | Sig. | ||
| OHS global reporting index | Other branches of processing industry | 0.385 | 3 | . | 0.750 | 3 | 0.000 |
| Consumer goods | 0.227 | 5 | 0.200 * | 0.897 | 5 | 0.395 | |
| Trade | 0.333 | 6 | 0.036 | 0.739 | 6 | 0.016 | |
| Chemical and metallurgical industry | 0.215 | 4 | . | 0.946 | 4 | 0.689 | |
| Extractive industry | 0.260 | 4 | . | 0.827 | 4 | 0.161 | |
| Wood and materials industry | 0.361 | 3 | . | 0.807 | 3 | 0.132 | |
| Production and supply of utilities | 0.175 | 3 | . | 1.000 | 3 | 1.000 | |
| Services | 0.177 | 7 | 0.200 2 | 0.952 | 7 | 0.748 | |
*,1 Lilliefors Significance Correction. 2 This is a lower bound of the true significance.
Table 12.
Levene test for dispersion homogeneity analysis—Global OHS Reporting Index.
| Levene Statistic | df1 | df2 | Sig. |
|---|---|---|---|
| 1.890 | 7 | 27 | 0.111 |
Table 13.
Variance analysis table (ANOVA)—Global OHS Reporting Index.
| Sum of Squares | df | Mean Square | F | Sig. | |
|---|---|---|---|---|---|
| Between Groups | 3719.405 | 7 | 531.344 | 1.380 | 0.254 |
| Within Groups | 10,394.881 | 27 | 384.996 | - | - |
| Total | 14,114.286 | 34 | - | - | - |
Table 14.
Checking the normality of the variable “Global OHS Reporting Index” on each category of the variable “affiliation to a multinational corporation”.
Table 14.
Checking the normality of the variable “Global OHS Reporting Index” on each category of the variable “affiliation to a multinational corporation”.
| Affiliation to MNC | Kolmogorov-Smirnov 1 | Shapiro–Wilk | |||||
|---|---|---|---|---|---|---|---|
| Statistic | df | Sig. | Statistic | df | Sig. | ||
| Global OHS reporting index | Yes | 0.125 | 25 | 0.200 2 | 00.965 | 25 | 0.514 |
| No | 0.142 | 10 | 0.200 2 | 0.923 | 10 | 0.385 | |
1 Lilliefors Significance Correction. 2 This is a lower bound of the true significance.
Table 15.
The results of the t-test for independent samples applied to the case of the “global reporting index” variable.
Table 15.
The results of the t-test for independent samples applied to the case of the “global reporting index” variable.
| Levene’s Test for Equality of Variances | t-test for Equality of Means | |||||||||
|---|---|---|---|---|---|---|---|---|---|---|
| F | Sig. | t | df | Sig. (2-tailed) | Mean Difference | Std. Error Difference | 95% Confidence Interval of the Difference | |||
| Lower | Upper | |||||||||
| Global OHS reporting index | Equal variances assumed | 3.247 | 0.081 | −1.524 | 33 | 0.137 | −11.400 | 7.479 | −26.617 | 3.817 |
| Equal variances not assumed | - | - | −2.007 | 31.338 | 0.053 | −11.400 | 5.681 | −22.981 | 0.181 | |
Table 16.
Indicators of the descriptive analysis for the dependent variable “Global OHS Reporting Index” for the two levels of the independent variable “affiliation to MNC”.
Table 16.
Indicators of the descriptive analysis for the dependent variable “Global OHS Reporting Index” for the two levels of the independent variable “affiliation to MNC”.
| Affiliation to MNC | N | Mean | Std. Deviation | Std. Error Mean | |
|---|---|---|---|---|---|
| Global OHS reporting index | Yes | 25 | 64.60 | 22.450 | 4.490 |
| No | 10 | 76.00 | 11.005 | 3.480 |
© 2020 by the authors. Licensee MDPI, Basel, Switzerland. This article is an open access article distributed under the terms and conditions of the Creative Commons Attribution (CC BY) license (http://creativecommons.org/licenses/by/4.0/).
Share and Cite
MDPI and ACS Style
Păun, A.P.; Dura, C.C.; Mihăilescu, S.; Moraru, R.I.; Isac, C.A. OHS Disclosures Within Non-Financial Reports: The Romanian Case. Sustainability 2020, 12, 1963. https://0-doi-org.brum.beds.ac.uk/10.3390/su12051963
AMA Style
Păun AP, Dura CC, Mihăilescu S, Moraru RI, Isac CA. OHS Disclosures Within Non-Financial Reports: The Romanian Case. Sustainability. 2020; 12(5):1963. https://0-doi-org.brum.beds.ac.uk/10.3390/su12051963
Chicago/Turabian StylePăun, Ana Petrina, Codruța Cornelia Dura, Sorin Mihăilescu, Roland Iosif Moraru, and Claudia Adriana Isac. 2020. "OHS Disclosures Within Non-Financial Reports: The Romanian Case" Sustainability 12, no. 5: 1963. https://0-doi-org.brum.beds.ac.uk/10.3390/su12051963
Note that from the first issue of 2016, this journal uses article numbers instead of page numbers. See further details here.