Accessibility Dynamics and Regional Cross-Border Cooperation (CBC) Perspectives in the Portuguese—Spanish Borderland

 ,
,  , , , , and
Abstract
:1. Introduction
2. Literature Review
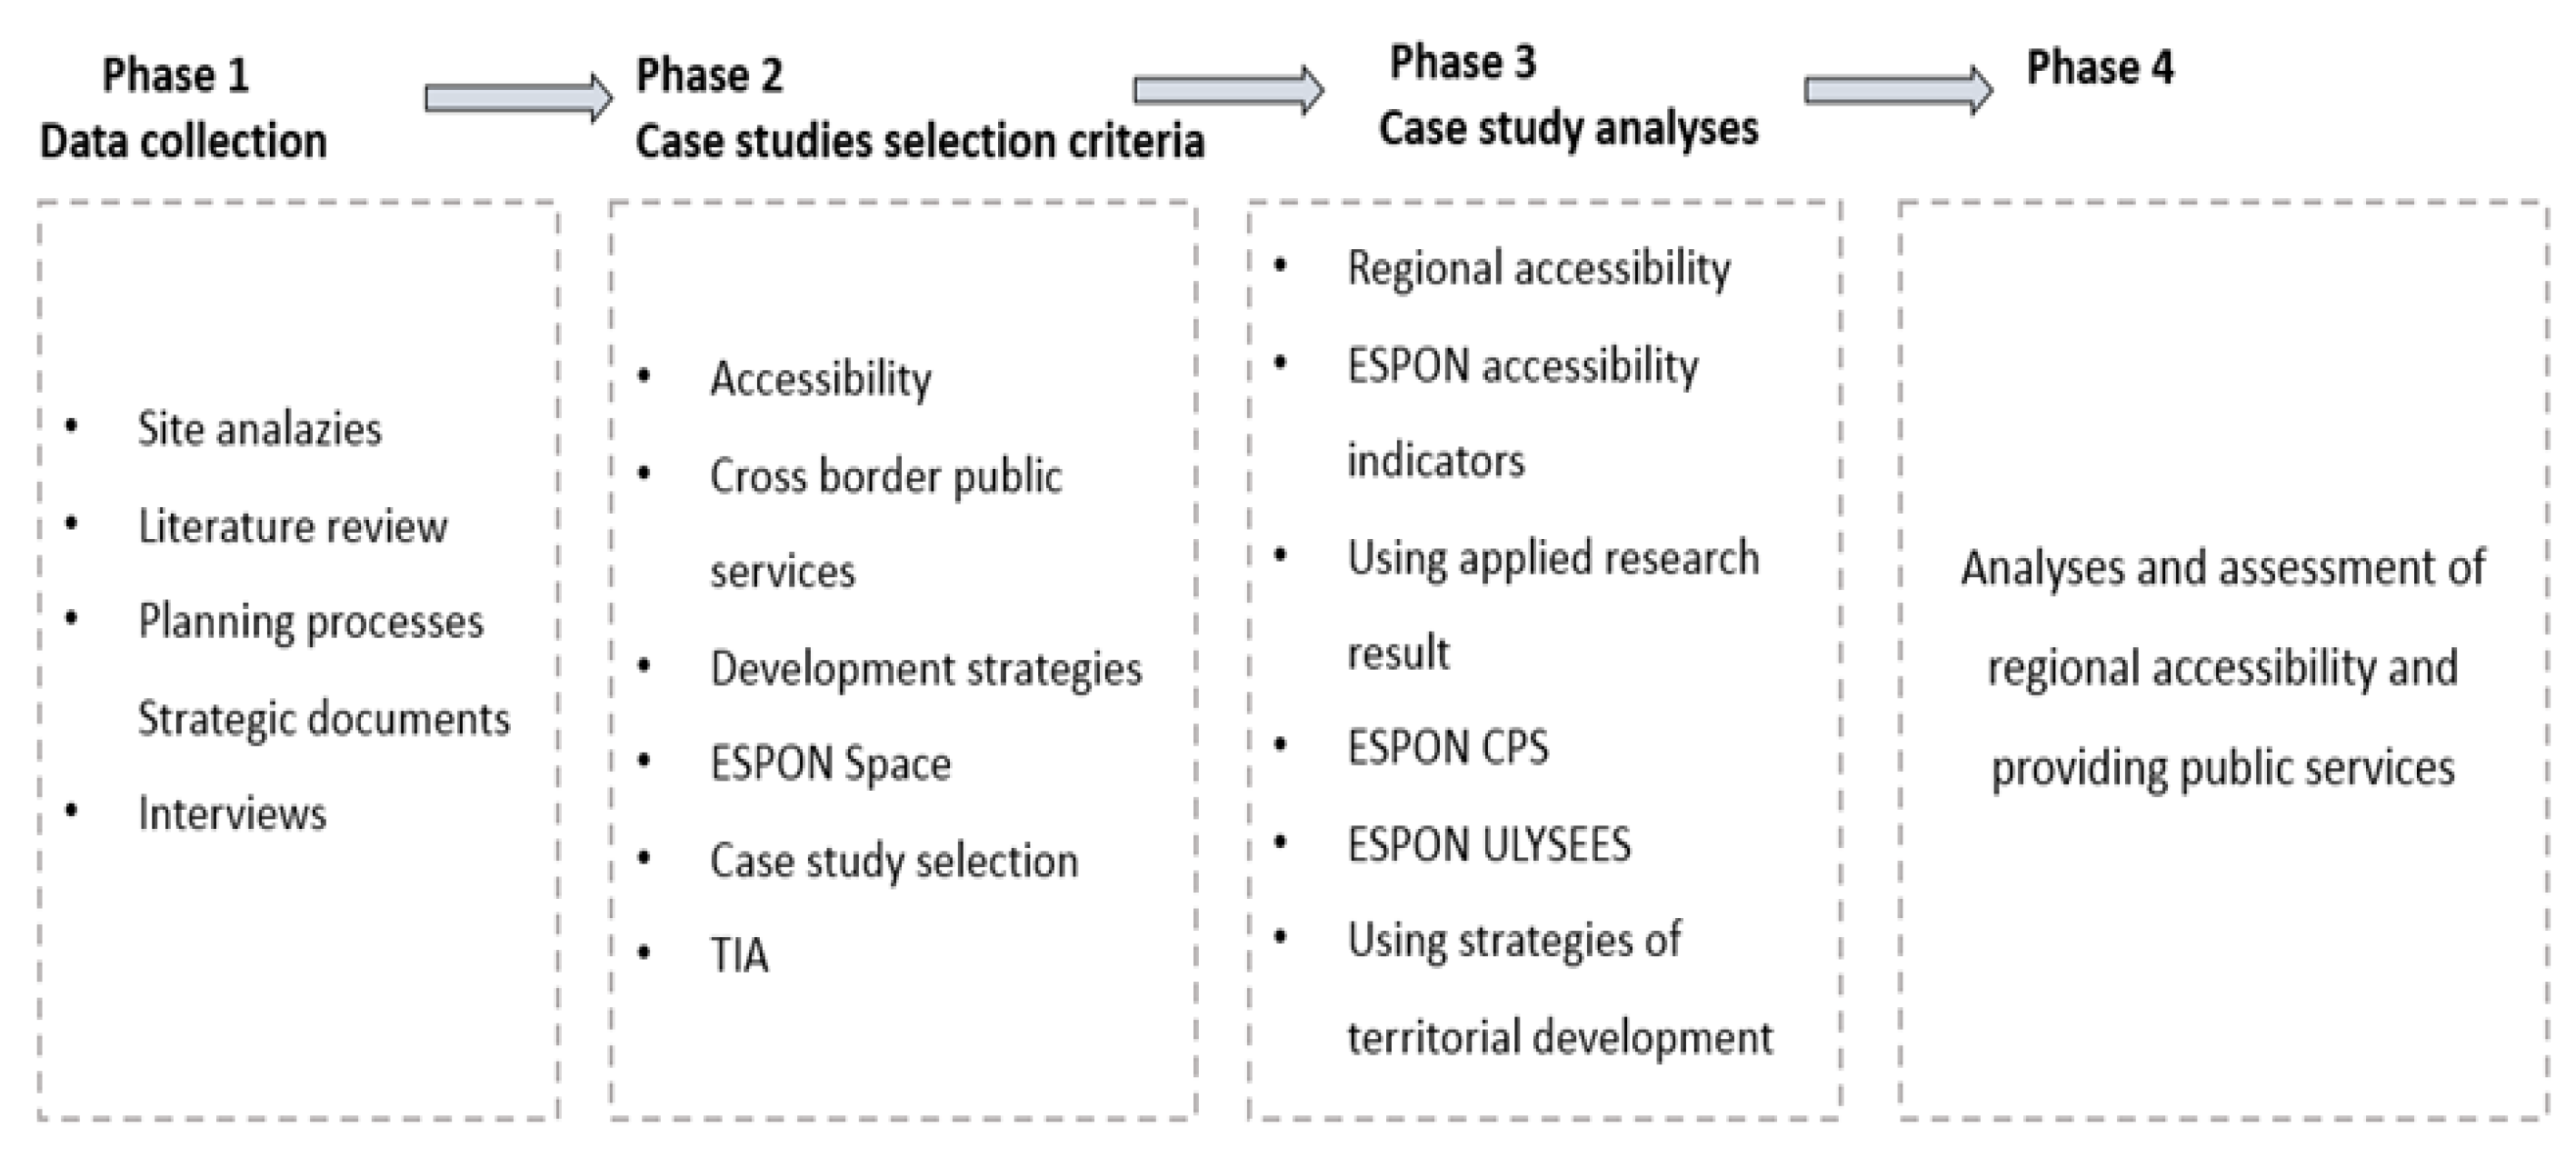
3. Methodology
4. Case Study Analyses
- Cities must have a record of previous work on CBC.
- The CBC project should consider the integration of environmental, sociocultural, and economic development goals, as part of a singular development strategy.
- Cities should demonstrate relationships with multiple stakeholders organized in a group association created to develop and strengthen aspects inherent to CBC, and development objectives.
- The distance between cities could not be greater than 60 km.
- At least one of the cities should be a medium-sized city.
- There should be considerable connectivity—movement between cities.
- There should be considerable the low formal number of CPS
- Eurocity marketing and advertisements must be previously identified as a critical factor for territorial success.
4.1. Data Analyses
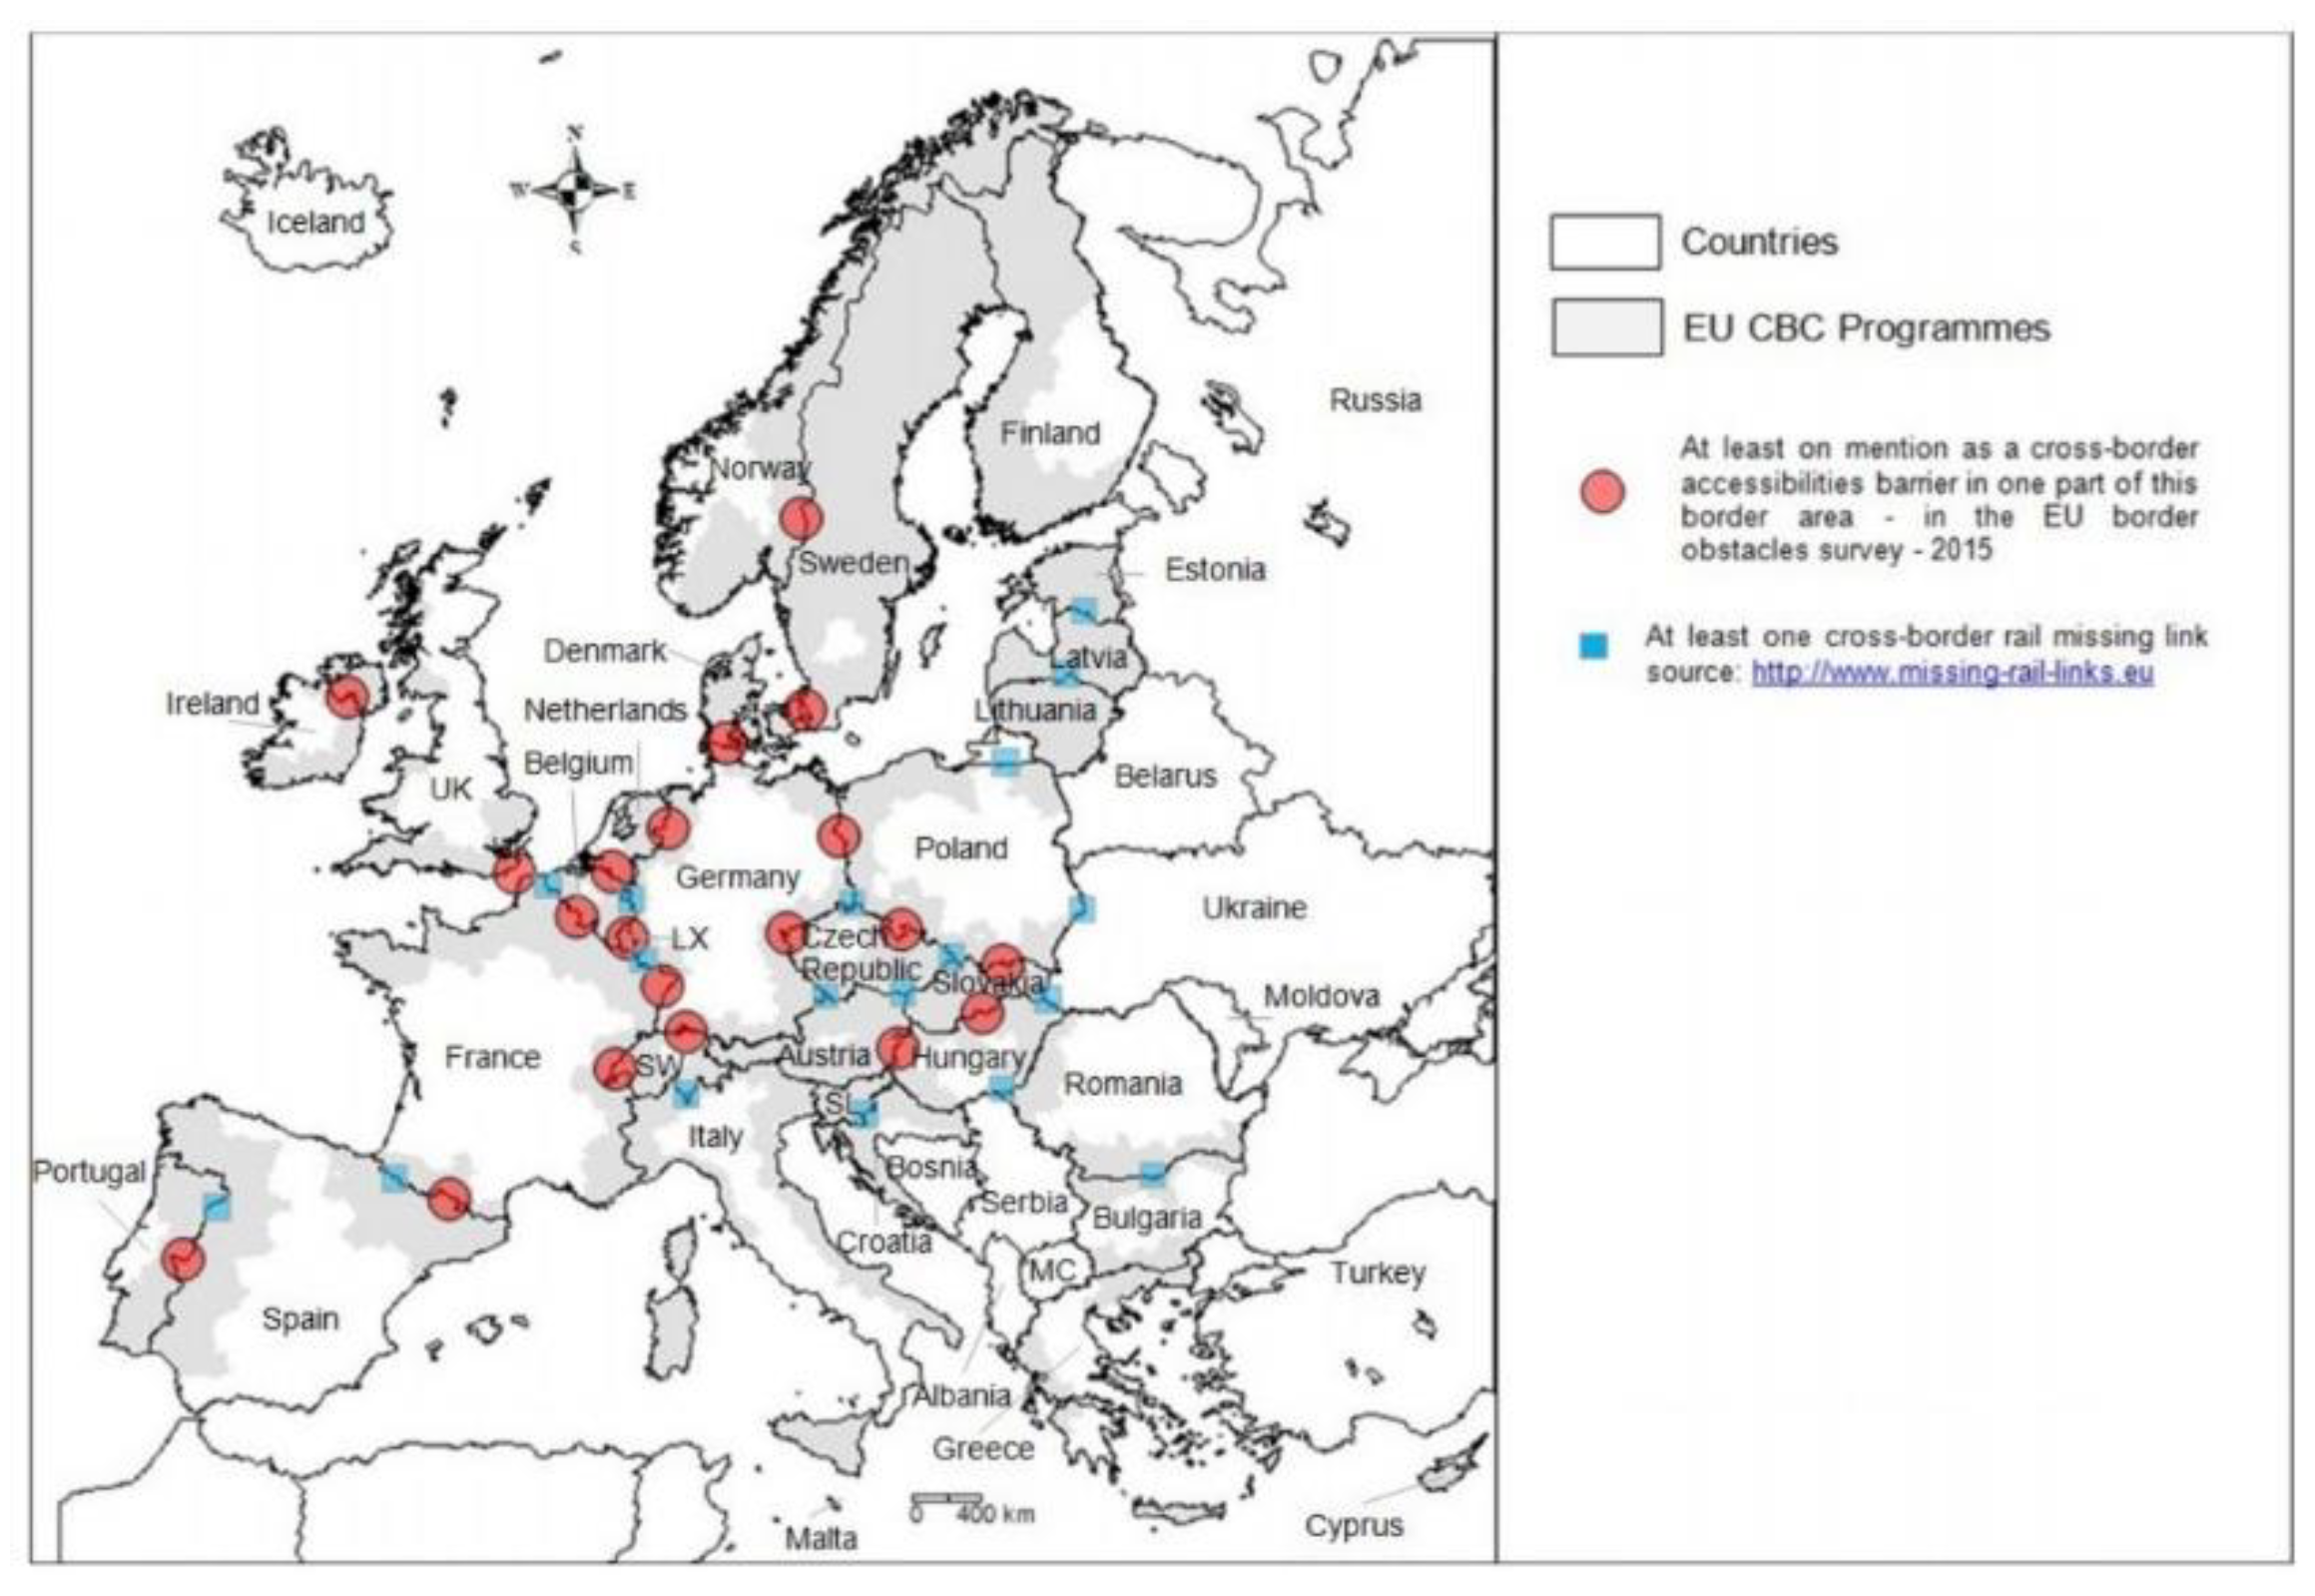
- Obstacles associated with political borders linked to legal and administrative questions;
- Effects associated with economic discontinuities and natural obstacles (weak urban network, and low density of population and settlements).
4.2. Potential Accessibility Indicators
- ‘Ai’(1)—the accessibility of area ‘I’.
- ‘Wj’—the activity W to be reached in area ‘j’
- ‘c ij’—the generalized cost of reaching area ‘j’ from the area ‘I’.
- The absolute level of accessibility (i) / Potential accessibility by road, standardized (ESPON = 100) 2001, 2006 (relative change of accessibility)/(Average relative change of accessibility) * 100/percentage of ESPON average because the accessibility indicators are in non-familiar units. They are standardized to the average accessibility of the European Union i.e., the absolute values are transformed so that the European average is 100. By presenting the absolute values as such indices, it can be seen which regions are in a better or a worse position than the European average [10,16].
- Index change of accessibility (i_ch)/ Potential accessibility by road, change of standardized (stand percentage of ESPON average/(standardized value average = 100 in 2006—standardized value average = 100 in 2001). For this, the accessibility values of 2001 are standardized to the EU27 average of that year and those of 2006 to the average of that year, each EU27 average is set to 100 and the regional values are transformed accordingly [10,31].A better the relative locational quality is expressed with positive values and loss in relative locational quality is expressed with negative values [10,31].
4.3. Daily Accessibility Indicators
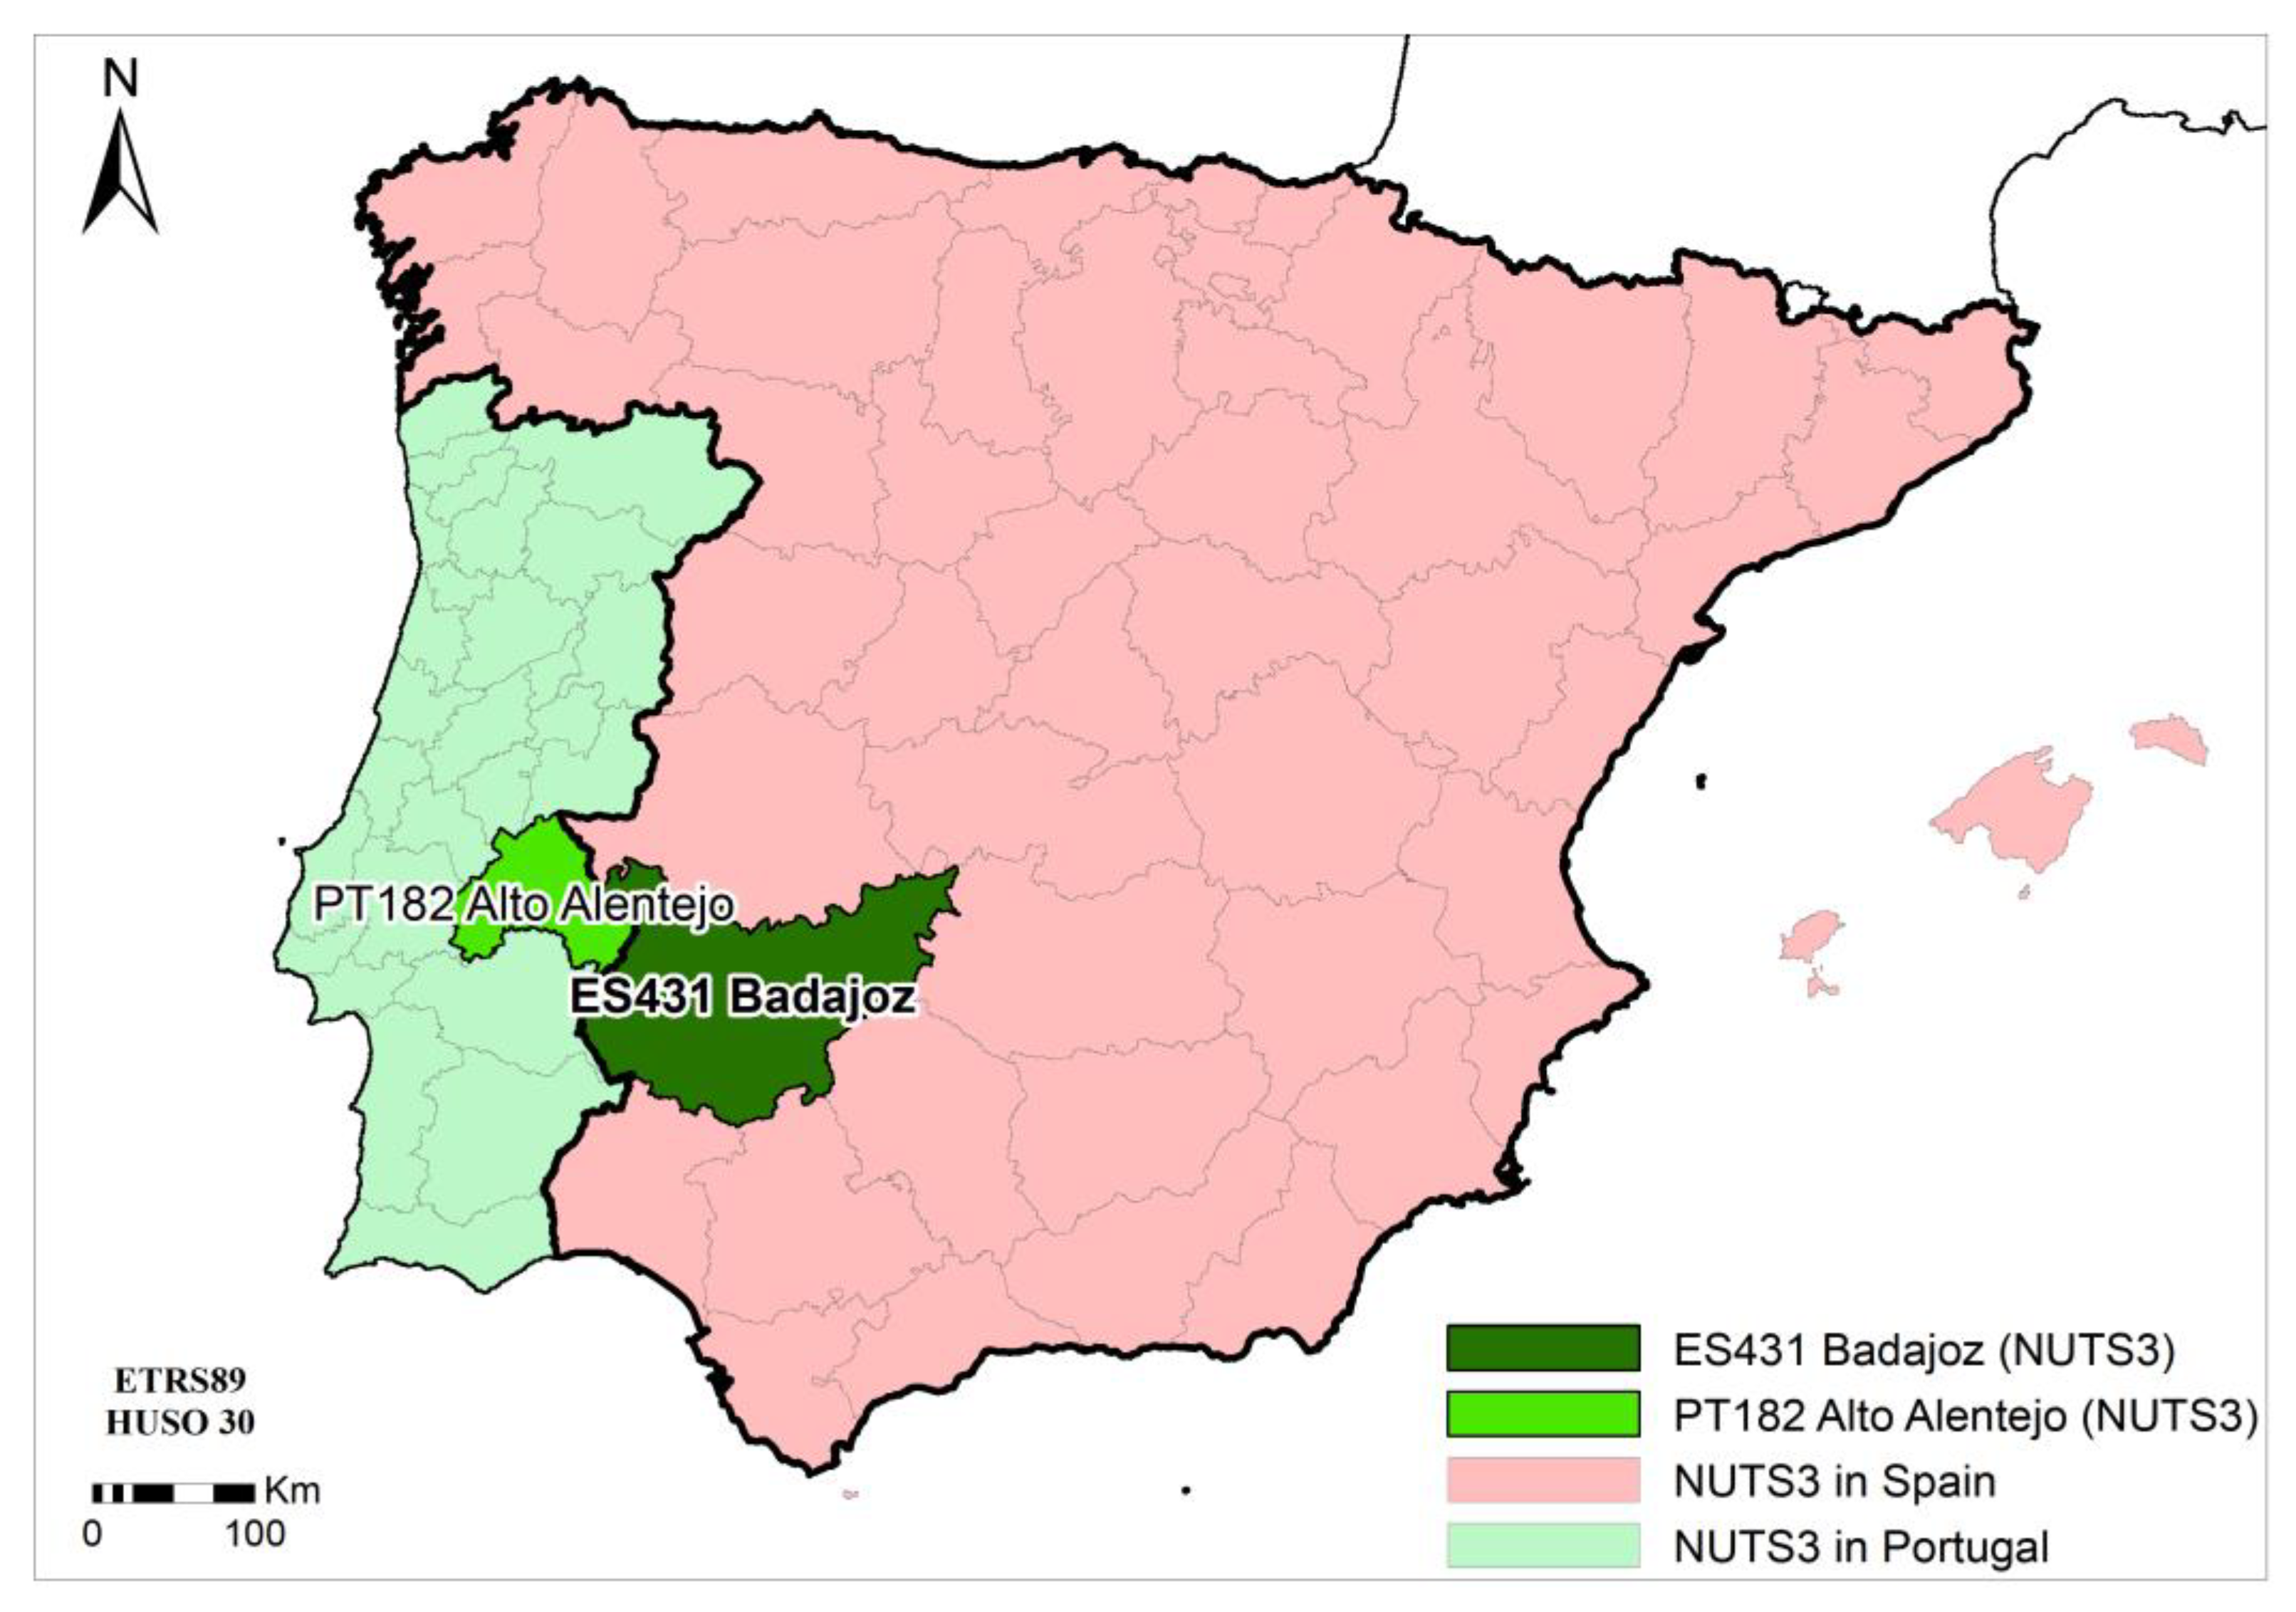
4.4. Study Area
5. Results
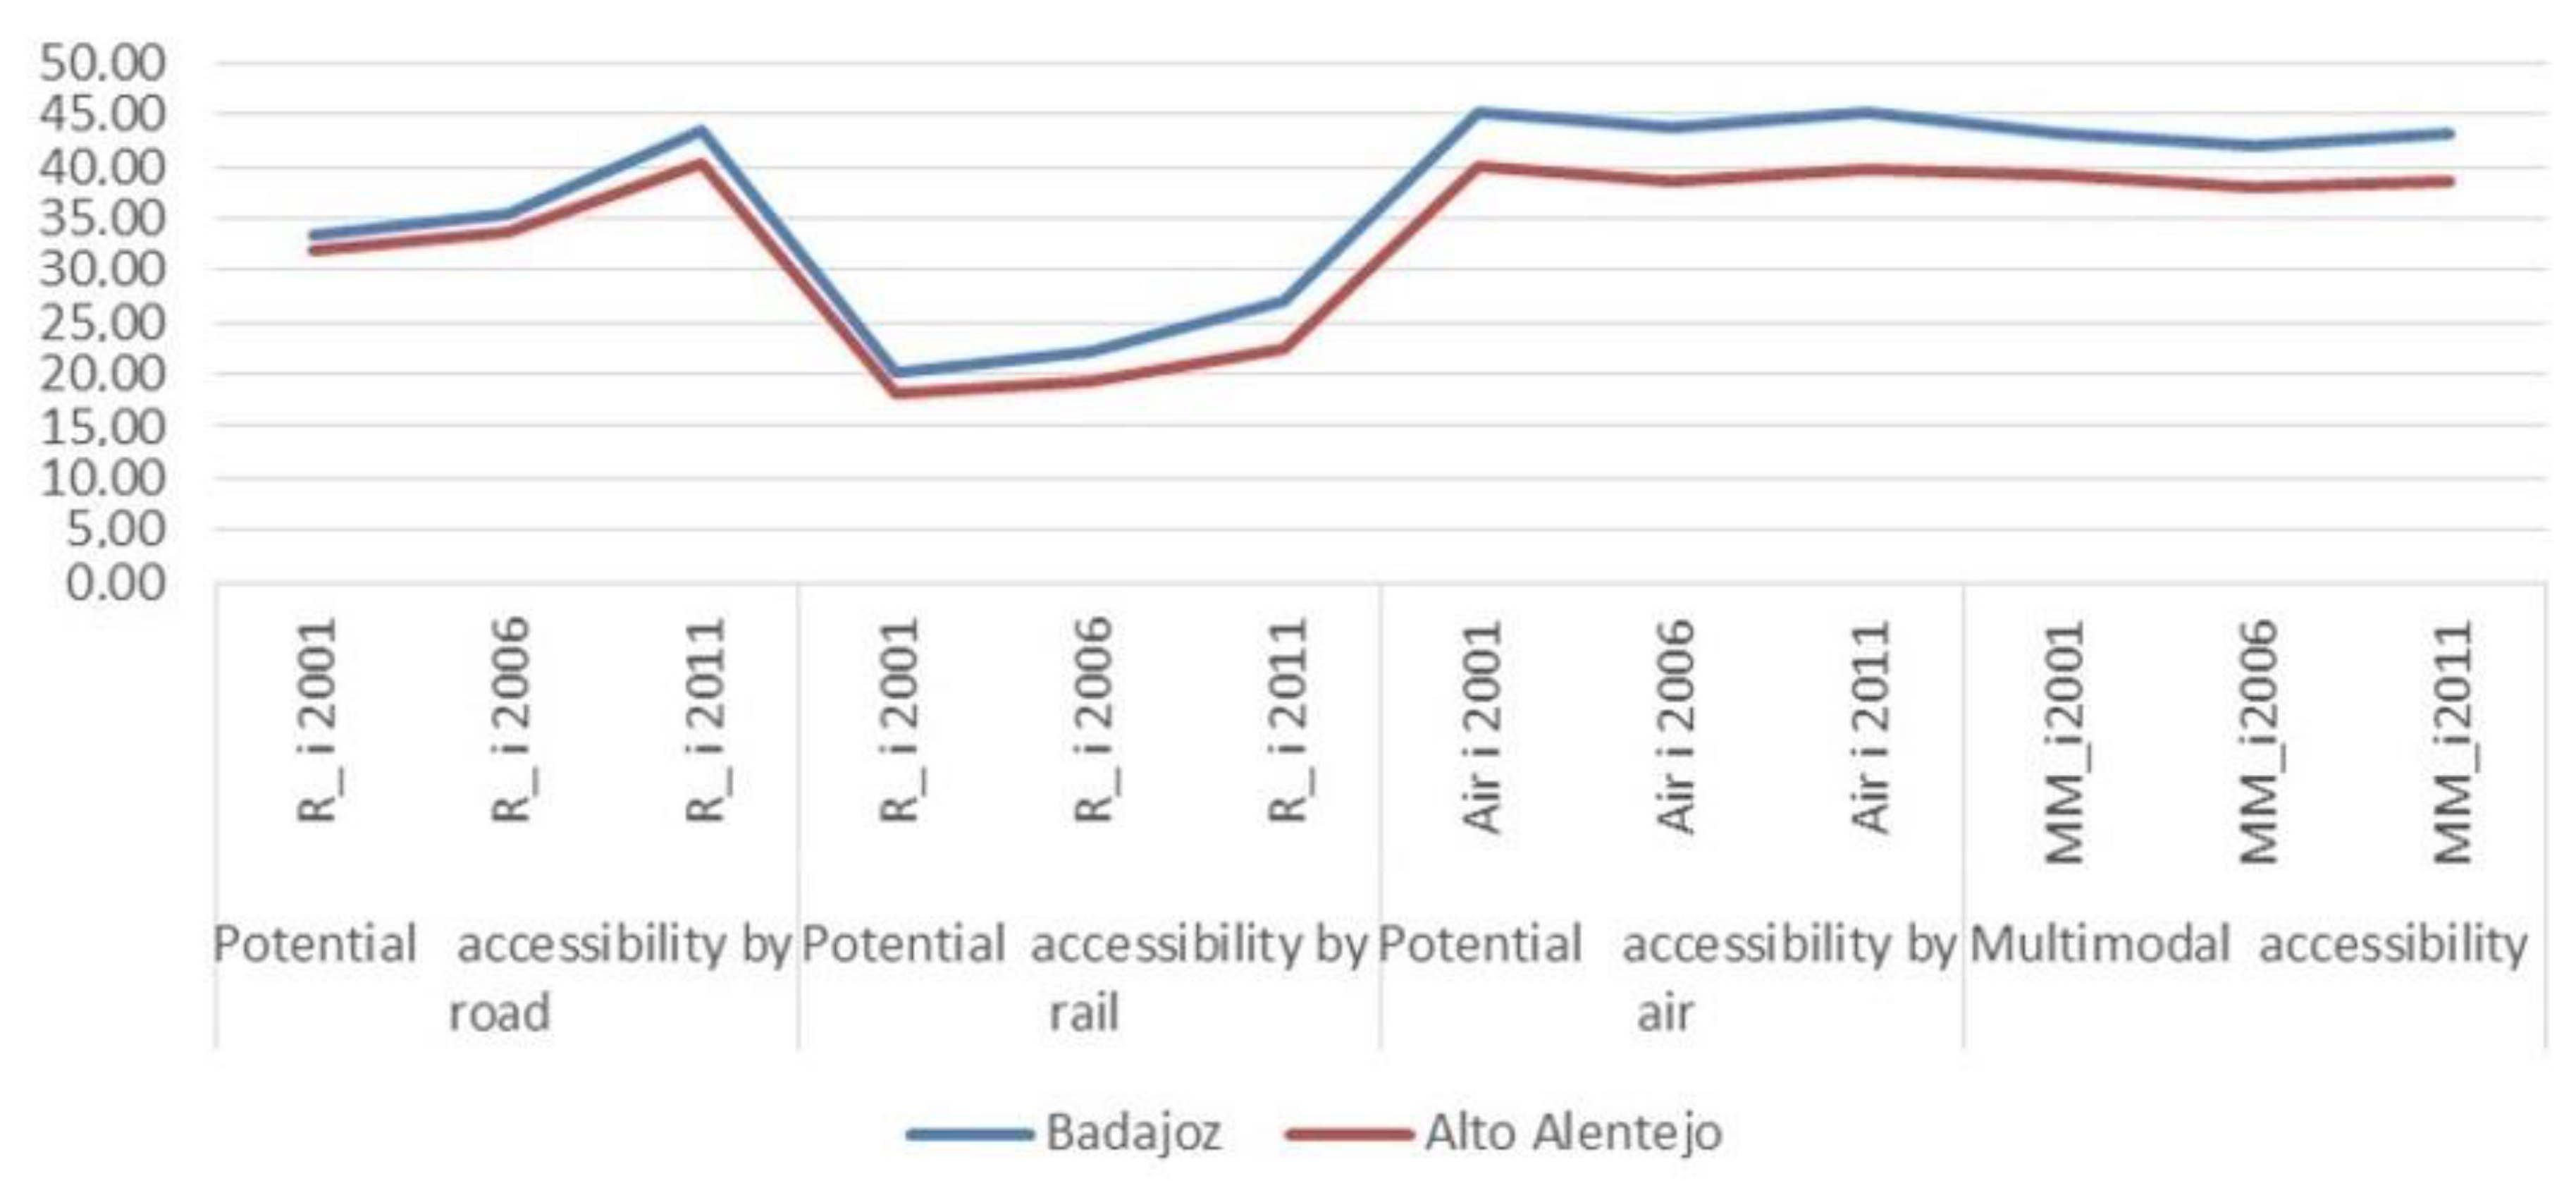
5.1. Accessibility
5.2. Cross-border Public Services
- Invasive species management system, of climate change, and environmental protection;
- Cross-border multimodal freight transport platform, in the field of transport and mobility;
- Cross-border mobility observatory, in the field of transport and mobility.
6. Discussion and Conclusions
Author Contributions
Funding
Conflicts of Interest
References
- Van Houtum, H. An Overview of European geographical Research on Borders and border regions. J. Borderl. Stud. 2000, 15, 56–83. [Google Scholar] [CrossRef]
- Decoville, A.; Durand, F.; Sohn, C.; Walther, O. Comparing cross-border metropolitan integration in Europe: Towards a functional typology. J. Borderl. Stud. 2013, 28, 221–237. [Google Scholar] [CrossRef]
- Reitel, B. Border temporality and space integration in the European transborder agglomeration of Basel. J. Borderl. Stud. 2013, 28, 239–256. [Google Scholar] [CrossRef]
- Sohn, C. Cross-Border Cooperation Structures in Europe: Learning from the Past, Looking to the Future. J. Borderl. Stud. 2017, 32, 415–416. [Google Scholar] [CrossRef]
- Medeiros, E. Cross-border transports and cross-border mobility in EU border regions. Case Stud. Transp. Policy. 2018, 7, 1–12. [Google Scholar] [CrossRef]
- te Brömmelstroet, M.; Bertolini, L. A transition towards sustainable strategy making: Integrating land use and transport knowledge types. In Transitions towards Sustainable Mobility: New Solutions and Approaches for Sustainable Transport Systems; van Nunen, J.A.E.E., Huijbregts, P., Rietveld, P., Eds.; Springer: Berlin, Germany, 2011; pp. 19–40. [Google Scholar]
- Condeço-Melhorado, A.; Christidis, P. Road Accessibility in Border Regions. A Joint Approach. Netw. Spat. Econ. 2018, 18, 363–383. [Google Scholar]
- European Commission. Cross-Border Transport Infrastructure in the EU, JRC Publications Repository; European Commission: Brussels, Belgium, 2018; Available online: https://publications.jrc.ec.europa.eu/repository/ (accessed on 27 February 2019).
- Kompil, M.; Jacobs-Crisioni, C.; Dijkstra, L.; Lavalle, C. Mapping accessibility to generic services in Europe: A market-potential based approach. Sustain. Cities Soc. 2019. [Google Scholar] [CrossRef]
- European Territorial Observatory Network. Available online: https://www.espon.eu/2020 (accessed on 15 February 2019).
- European Spatial Planning Observation Network. PROFECY—Processes, Features and Cycles of Inner Peripheries in Europe (Inner Peripheries: National Territories Facing Challenges of Access to Basic Services of General Interest) Applied Research Final Report, Executive Summary, Version 07/12/2017; European Union: Luxembourg, 2017. [Google Scholar]
- European Spatial Planning Observation Network. Cros Border Public Services CPS. 2018, Target Analyses of Cros Border Public Services; Final Report; European Union: Luxembourg, 2018. [Google Scholar]
- Miller, H.J. Modeling accessibility using space-time prism concepts within geographical information-systems. J. Geogr. Inf. Syst. 1991, 5, 287–301. [Google Scholar]
- Handy, S.L.; Niemeier, D.A. Measuring accessibility: An exploration of issues and alternatives. Environ. Plan. A. 1997, 29, 1175–1194. [Google Scholar] [CrossRef]
- Kwan, M.P.; Weber, J. Individual accessibility revisited: Implications for geographical analysis in the twenty-first century. Geogr. Anal. 2003, 35, 341–353. [Google Scholar] [CrossRef]
- Castanho, R.; Vulevic, A.; Fernández, J.P.; Naranjo, G.; Loures, L. Accessibility and connectivity—Movement between cities, as a critical factor to achieve success on cross-border cooperation (CBC) projects. A European analysis. Sustain. Cities Soc. 2017, 2, 181–190. Available online: https://0-doi-org.brum.beds.ac.uk/10.1016/j.scs.2017.03.026 (accessed on 10 May 2019). [CrossRef]
- Vulevic, A. Demographic response to accessibility improvement in depopulation cross border regions: The Case of Euro region Danube 21 in Serbia. In Proceeding Book, Faculty of Geography; University of Belgrade: Belgrade, Serbia, 2017; UDC 314.87:911.37(497.11). [Google Scholar] [CrossRef] [Green Version]
- UNECE and SDGs. Available online: https://www.uneceorg/unece-and-the-sdgs/unece-and-the-sdgs.html (accessed on 11 April 2019).
- United Nations (UN). UN Study: Transport for Sustainable Development—The Case of Inland Transport; UNITED NATIONS: New York, NY, USA; Geneva, Switzerland, 2015. [Google Scholar]
- Cano, E.; Musarella, C.M.; Cano-Ortiz, A.; Piñar Fuentes, J.C.; Rodríguez Torres, A.; Del Río González, S.; Pinto Gomes, C.J.; Quinto-Canas, R.; Spampinato, G. Geobotanical Study of the Microforests of Juniperus oxycedrus subsp. badia in the Central and Southern Iberian Peninsula. Sustain. J. 2019, 11, 1111. [Google Scholar] [CrossRef] [Green Version]
- LISER. Opportunities of Cross-Border Cooperation between Small and Medium Cities in Europe; Luxembourg Institute of Socio—Economic Research: Luxembourg, 2015. [Google Scholar]
- Durà, A.; Camonita, F.; Berzi, M.M.; Noferini, A. Euroregions, Excellence and Innovation across EU Borders. A Catalogue of Good Practices, Barcelona; Department of Geography: Abu Dhabi, UAB, 2018; p. 254, D.L. B 2160-2018 ISBN paper version: 978-84-947903-8-6; ISBN 978-84-947903-9-3. [Google Scholar]
- Castanho, R.; Loures, L.; Fernández, J.; Pozo, L. Identifying critical factors for success in Cross Border Cooperation (CBC) development projects. Habitat Int. 2016. [Google Scholar] [CrossRef]
- Naranjo, J.M. Impacts on the social cohesion of mainland Spain’s future motorway and high-speed rail networks. Sustainability 2016, 8, 624. [Google Scholar] [CrossRef] [Green Version]
- Boehnke, K.; Rippl, S.; Fuss, D. Sustainable Civil-Society Engagement: Potentials of a Transnational Civil Society in French-German, Polish-German, and Czech-German Border Regions. Sustain. J. 2015, 7, 4078–4099. [Google Scholar] [CrossRef] [Green Version]
- Kurowska-Pysz, J. Opportunities for cross-border entrepreneurship development in a cluster model exemplified by the Polish-Czech border region. Sustain. J. 2016, 8, 230. [Google Scholar] [CrossRef] [Green Version]
- Scott, J. Rebordering Central Europe: Observations on Cohesion and Cross-border Cooperation. In Cross-Border Review Yearbook 2016; European Institute of Cross-BorderStudies—Central European Service for Cross-border Initiatives (CESCI): Budapest, Hungary, 2016; pp. 9–28, ISSN 2064-6704. [Google Scholar]
- Vulevic, A. Accessibility concepts and indicators in transportation strategic planning issues: Theoretical framework and literature review. Logist. Sustain. Transp. 2016. [Google Scholar] [CrossRef] [Green Version]
- Castanho, R.A.; Loures, L.; Cabezas, J.; Fernández-Pozo, L. Cross-Border Cooperation (CBC) in Southern Europe—An Iberian Case Study. The Eurocity Elvas-Badajoz. Sustain. J. 2017, 9, 360. [Google Scholar] [CrossRef] [Green Version]
- Vulevic, A.; Macura, D.; Djordjevic, D.; Castanho, R. Assessing accessibility and transport infrastructure inequities in administrative units in Serbia’s Danube Corridor based on multi-criteria analysis and GIS mapping tools. Transylv. Rev. Adm. Sci. 2018, 53, 123–143. [Google Scholar] [CrossRef]
- European Spatial Planning Observation Network. Transport Services and Networks: Territorial Trends and Basic Supply of Infrastructure for Territorial Cohesion (ESPON 1.2.1.); Final Report; University of Tours: Tours, France, 2006; Available online: http://www.espon.eu (accessed on 25 February 2019).
- European Commision. Using Applied Research Results from ESPON as a Yardstick for Cross-Border Spatial Development Planning; Final Report, Version 25(01); European Commision: Brussels, Belgium, 2013. [Google Scholar]
- Lefteris, T.; Kallioras, D.; Manetos, P.; Petrakos, G. A border regions typology in the enlarged European Union. J. Borderl. Stud. 2005, 20, 67–89. [Google Scholar]
- Medeiros, E. European Territorial Cooperation. Series: The Urban Book Series; Springer: Berlin, Germany, 2018; ISBN 978-3-319-74887-0. [Google Scholar]
- Peyrony, J.; Denert, O. Planning for Cross-Border Territories: The Role Played, Raumforsch Raumordn; Springer: Berlin, Germany, 2012; Volume 70, pp. 229–240. [Google Scholar] [CrossRef]
- Sohn, C. Modelling Cross-Border Integration: The Role of Borders as a Resource. Geopolitics 2014, 19. [Google Scholar] [CrossRef]
- Kallioras, D.; Petrakos, G.; Tsiapa, M.; Topaloglou, L. The Determinants of Growth in EU Border Regions. In Proceedings of the ERSA Conference Papers ERSA 10, Barcelona, Spain, 30 August–2 September 2011; European Regional Science Association: Brussels, Belgium, 2011; p. 702. [Google Scholar]
- European Commission. DG Regio, Passenger Rail Accessibility in Europe’s Border Areas; WP 11/2017; European Commission: Brussels, Belgium, 2017; p. 3. [Google Scholar]
- Szary, A.L. Walls and Border Art: The Politics of Art Display. J. Borderl. Stud. 2012, 2, 213–228. [Google Scholar] [CrossRef] [Green Version]
- Sohn, C. The Border as a Resource in the Global Urban Space: A Contribution to the Cross-Border Metropolis Hypothesis. Int. J. Urban. 2013. [Google Scholar] [CrossRef]
- Decoville, A.; Durand, D. Building a cross-border territorial strategy between four countries: Wishful thinking? Eur. Plan. Stud. 2016, 24, 1–9. [Google Scholar] [CrossRef]
- Ferreira, C.; MacNeill, S.; Broughton, K.; Ferreira, J.; Broadhurst, K.; Berkeley, N.; Fertner, C.; Groth, N.B.; Cotella, G.; Rivolin, U.J.; et al. ESPON. ReSSI—Regional Strategies for Sustainable and Inclusive Territorial Development; European Union: Luxembourg, 2017. [Google Scholar]
- Gudmundsson, H.; Mattias, H. Sustainable Development Principles and Their Implications for Transport. Ecol. Econ. 1996, 19, 269–282. [Google Scholar] [CrossRef]
- European Commission. Overcoming Obstacles in Border Regions—Summary Report on the Online Public Consultation; Publications Office of the European Union: Luxembourg, 2016; ISBN 978-92-79-57347-7. [Google Scholar]
- Fries-Terch, E.; Tugran, T.; Bradley, H. Annual Report on Intra-EU Labour Mobility; Final Report January 2018; European Commission: Brussels, Belgium, 2018. [Google Scholar]
- Maggi, R.; Masser, I.; Nijkamp, P. Missing networks in European transport and communications. Transp. Rev. 1992, 12, 311–321. [Google Scholar] [CrossRef]
- López, E.; Gutiérrez, J.; Gómez, G. Measuring regional cohesion effects of large-scale transport infrastructure investments: An accessibility approach. Eur. Plan. Stud. 2008, 16, 277–301. [Google Scholar] [CrossRef] [Green Version]
- Biehl, D. The role of infrastructure in regional development. In Infrastructure and Regional Development, European Research in Regional Science; Vickerman, R.W., Ed.; Pion: London, UK, 1991; Volume 1, pp. 9–35. [Google Scholar]
- Geurs, K.T.; Ritsema, J.R. Van Eck Accessibility Measures: Review and Applications. Evaluation of Accessibility Impacts of Land-Use Transportation Scenarios, and Related Social and Economic Impact, RIVM Report 408505 006 edn; National Institute of Public Health and the Environment: Bilthoven, The Netherlands, 2001. [Google Scholar]
- Kim, H.-M.; Kwan, M.P. Space-time accessibility measures: A eocomputational algorithm with a focus on the feasible opportunity set and possible activity duration. J. Geogr. Syst. 2003, 5, 71–91. [Google Scholar] [CrossRef]
- Bertolini, L.; Le Clerq, F.; Kapoen, L. Sustainable accessibility: A conceptual framework to integrate transport and land use plan-making. Two test-applications in the Netherlands and a reflection on the way forward. Transp. Policy. 2005, 12, 201–220. [Google Scholar] [CrossRef]
- Christodoulou, A.; Christidis, P. Measuring Cross-Border Road Accessibility in the European Union. Sustain. J. 2019, 11, 4000. [Google Scholar] [CrossRef] [Green Version]
- European Spatial Planning Observation Network. TRACC—Transport Accessibility at Regional/Local Scale and Patterns in Europe. 2013. Available online: http://www.espon.eu/main/ (accessed on 22 June 2019).
- OTALEX-C; ATLAS; OTALEX-C. Direccíon General de Transportes, Ordenación del Territorio e Urbanismo, Consejeria de Fomento, Vivienda, Ordenación del Territorio y Turismo; Junta de Extyremadura: Merida, Spain, 2013. [Google Scholar]
- Batista, T.; Cabezas, J.; Fernández, L.; Pinto-Gomes, C. IDE-OTALEX C. The first crossborder SDI between Portugal and Spain: Background and development. J. Earth Sci. Eng. 2013, 3, 393. [Google Scholar]
- Martín, G. Border Space as a Vehicle for Territorial Cooperation in the New Programming Period 2014–2020, OTALEX-C, Direccíon General de Transportes, Ordenación del Territorio e Urbanismo, Consejeria de Fomento, Vivienda, Ordenación del Territorio y Turismo; Junta de Extyremadura: Badajoz, Spain, 2013. [Google Scholar]
- Wassenberg, B. Secondary foreign policy as a peace-building tool: A European model? The contribution of cross-border cooperation to reconciliation and stability in Europe. Reg. Fed. Stud. 2017, 27, 219–237. [Google Scholar] [CrossRef]
- Jaansoo, A.; Groenendijk, N. Cross-border delivery of public services: How useful are EGTCs? In Proceedings of the 54th ERSA Congress, St. Petersburg, Russia, 26–29 August 2014. [Google Scholar]
- Yin, R. Case Study Research e Design and Methods; Sage Publications: London, UK, 1994. [Google Scholar]
- Levy, J. Case Studies—Types, Designs and Logics of Inference. Confl. Manag. Peace Sci. 2008, 25, 1–18. [Google Scholar] [CrossRef]
- European Spatial Planning Observation Network. DEMIFER—Demographic and Migratory Flows Affecting European Regions and Cities—Applied Research; Final Report; European Union: Luxembourg, 2013. [Google Scholar]
- Wegener, M.; Eskelinnen, H.; Fürst, F.; Schürmann, C.; Spiekermann, K. Criteria for the Spatial Differentiation of the EU Territory: Geographical Position; Forschungen 102.2; Bundesamt für Bauwesen und Raumordnung: Bonn, Germany, 2002. [Google Scholar]
- Garrinhas, J.P. Elvas—Uma Geografia de Fronteira; Associação de Desenvolvimento Pela Cultura: Elvas, Portugal, 2018. [Google Scholar]
- Spiekermann, K.; Wegener, M. The PROPOLIS model for assessing urban sustainability. Int. J. Urban Sustain. 2007, 2, 306–326. [Google Scholar]
- Medeiros, E. Territorial Impact Assessment and Cross-Border Cooperation. J. Reg. Stud. Reg. Sci. 2015, 2, 97–115. [Google Scholar] [CrossRef]
- European Commission (EC). Available online: http://ec.europa.eu (accessed on 10 September 2019).
- Sá Marques, T.; Saraiva, M.; Ribeiro, D.; Amante, A.; Silva, D.; Melo, P. Accessibility to services of general interest in polycentric urban system planning: The case of Portugal. Eur. Plan. Stud. 2019. [Google Scholar] [CrossRef]
- Antrop, M. Changing patterns in the urbanized countryside of Western Europe. Landsc. Ecol. 2000, 15, 257–270. [Google Scholar] [CrossRef]
- Rossetti, S. Applying Accessibility Tools to Address Urban and Transport Planning. The Case of the Eurocity of Valenca-Tui and the Euroregion of Galicia-Norte de Portugal. 2014. Available online: https://iris.unibs.it/handle/11379/459210#.WSgT4euGO71 (accessed on 25 October 2018).
- European Commission. Comprehensive Analysis of the Existing Cross-Border Rail Transport Connections and Missing Links on the Internal EU Borders; European Commission: Brussels, Belgium, 2018. [Google Scholar]
- Ribeiro, A.; Silva, J. Cross Border Acessibility and Spatial Development in Portugal and Spain. In Proceedings of the ERSA, 2010 Congress, Jonkoping University, Jonkoping, Sweden, 19–22 August 2010. [Google Scholar]
- Eurobarometer Survey on Border Obstacles. 2015. Available online: https://ec.europa.eu/regional_policy/sources/docoffic/official/reports/eurobarometer/422/cbc_coop_summary_en.pdf (accessed on 10 April 2019).
- Castanho, R.A. Sustainable Urban Planning in Transboundary Areas: Analysis of Critical Factors for Territorial Success. Ph.D. Thesis, Department of Vegetal Biology, Ecology and Earth Sciences, University of Extremadura (UEx), Badajoz, Spain, 2017. [Google Scholar]
- Codosero Rodas, J.; Naranjo Gómez, J.; Castanho, R.A.; Cabezas, J. Land Valuation Sustainable Model on Urban Planning Development: A Case Study in Badajoz, Spain. Sustainability 2018, 10, 1450. [Google Scholar] [CrossRef] [Green Version]
- Naranjo Gómez, J.; Castanho, R.A.; Cabezas-Fernandez, J.; Loures, L. Evaluación de las Áreas de Servicio de la Alta Velocidad Ferroviaria en la España Peninsular desde un Enfoque SIG Multi-método. Assessing High Speed Railway Service Areas in Spain Mainland from a Multi-method GIS Approach. Rev. Estud. Andal. 2019, 37. [Google Scholar] [CrossRef]
- Naranjo Gómez, J.; Castanho, R.A.; Cabezas, J.; Loures, L. Assessment of High-Speed Rail Service Coverage in Municipalities of Peninsular Spain. Infrastructures 2020, 5, 11. [Google Scholar] [CrossRef] [Green Version]


| Projects | Indicators | ||
|---|---|---|---|
| ESPON Project 1.2.1. Transports services and networks: territorial trends and basic supply of infrastructure for territorial cohesion. Update 2006 [31] | Potential accessibility by road, rail, air, multimodal/Absolute level, standardized (ESPON = 100) | ||
| Geographical scale | Source | Time frame | |
| NUTS3 * | ESPON Data base | 2001;2006 | |
| ESPON Project TRACC. Transport Accessibility at regional/local scale and patterns in Europe 2013 [53] | Potential accessibility Travel Indicators TRACC by road, rail, air, multimodal/Absolute level, standardized (ESPON = 100) | ||
| Geographical scale | Source | Time frame | |
| NUTS3 * | ESPON Data base | 2011 | |
| Daily accessibility (Indicators TRACC by road, rail) | |||
| Geographical scale | Source | Time frame | |
| NUTS3 * | ESPON Data base | 2011 | |
| ESPON project Cross-border public services, Target analyses [12] | Cross-border public-services(key criteria for defining CPS, functional characteristics of provided CPS) | ||
| Geographical scale | Source | Time frame | |
| NUTS3 * | ESPON Data base | 2018 | |
| Country/City | Total Area km² 2011 | Population Number 2011 | Population Density Inhabitants/km² 2011 |
|---|---|---|---|
| Spain (Country) | 504,645 | 47,190,493 | 94 |
| Badajoz (City) | 1470 | 151,565 | 103 |
| Portugal (Country) | 92,090 | 10,476,021 | 114 |
| Alto Alentejo (Region) | 6230 | 118,410 | 19 |
| CASE STUDY | Index | Badajoz | Alto Alentejo |
|---|---|---|---|
| GEOTIME/NUTS3 | |||
| ES/ES431 | PT/PT182 | ||
| Potential accessibility by road | R_ i 2001 | 33.30 | 31.90 |
| R_ i 2006 | 35.30 | 33.80 | |
| R_ i 2011 | 43.50 | 40.40 | |
| Potential accessibility by rail | R_ i 2001 | 20.10 | 18.20 |
| R_ i 2006 | 22.10 | 19.30 | |
| R_ i 2011 | 27.20 | 22.60 | |
| Potential accessibility by air | Air i 2001 | 45.10 | 39.90 |
| Air i 2006 | 43.70 | 38.70 | |
| Air i 2011 | 45.20 | 39.70 | |
| Multimodal accessibility | MM_i2001 | 43.10 | 39.10 |
| MM_i2006 | 42.10 | 38.10 | |
| MM_i2011 | 43.20 | 38.60 | |
| CASE STUDY | Index | Badajoz | Alto Alentejo |
|---|---|---|---|
| GEOTIME/NUTS3 | |||
| ES/ES431 | PT/PT182 | ||
| Potential accessibility by road | Ri_ch2001/2006 | 2.00 | 1.90 |
| Potential accessibility by rail | Ri_ch2001/2006 | 2.00 | 1.00 |
| Potential accessibility by air | Air i ch2001/2006 | −1.3 | −1.20 |
| Multimodal accessibility | MM_ich2001/2006 | −1.00 | −1.00 |
| CASE STUDY | GEOTIME | NUTS3 | Daily Road | Daily Rail | Daily Fastest |
|---|---|---|---|---|---|
| Badajoz | ES | ES431 | 6152400 | 1972900 | 6152400 |
| Alto Alentejo | PT | PT182 | 7197900 | 3661900 | 7197900 |
| CPS Name in the Policy Area | Border | Key Selection Criteria |
|---|---|---|
| EURES-Cross-border Information Service (in field Labor market and employment) | SP-PT | Service provision in a labor market with a relatively low number of cross-border commuters. Aiming more at promoting cross-border working in a large geographical area along the border. The CPS has been established recently in 2017. |
| EUROBEC: Building the Eurocity Badajoz-Elvas-Campo Maior/Construyendo la Eurocidad Badajoz-Elvas-Campo Maior | SP-PT | Possibilities for improving the institutional capacity and better public administration |
| Cross-border early warning networks in environmental protection systems in civil protection | SP-PT | Prevention of risks and improvement of the management of natural resources and promote adaptation to climate change in all sectors |
| Regional Accessibility | |
|---|---|
| Indicators | |
| Sustainable targets |
|
| Future challenge |
|
© 2020 by the authors. Licensee MDPI, Basel, Switzerland. This article is an open access article distributed under the terms and conditions of the Creative Commons Attribution (CC BY) license (http://creativecommons.org/licenses/by/4.0/).
Share and Cite
Vulevic, A.; Castanho, R.A.; Naranjo Gómez, J.M.; Loures, L.; Cabezas, J.; Fernández-Pozo, L.; Martín Gallardo, J. Accessibility Dynamics and Regional Cross-Border Cooperation (CBC) Perspectives in the Portuguese—Spanish Borderland. Sustainability 2020, 12, 1978. https://0-doi-org.brum.beds.ac.uk/10.3390/su12051978
Vulevic A, Castanho RA, Naranjo Gómez JM, Loures L, Cabezas J, Fernández-Pozo L, Martín Gallardo J. Accessibility Dynamics and Regional Cross-Border Cooperation (CBC) Perspectives in the Portuguese—Spanish Borderland. Sustainability. 2020; 12(5):1978. https://0-doi-org.brum.beds.ac.uk/10.3390/su12051978
Chicago/Turabian StyleVulevic, Ana, Rui Alexandre Castanho, José Manuel Naranjo Gómez, Luís Loures, José Cabezas, Luis Fernández-Pozo, and José Martín Gallardo. 2020. "Accessibility Dynamics and Regional Cross-Border Cooperation (CBC) Perspectives in the Portuguese—Spanish Borderland" Sustainability 12, no. 5: 1978. https://0-doi-org.brum.beds.ac.uk/10.3390/su12051978