Environmental DNA and Specific Primers for Detecting the Invasive Species Ectopleura crocea (Hydrozoa: Anthoathecata) in Seawater Samples


Abstract
:1. Introduction
2. Materials and Methods
2.1. Sample Collection
2.2. Molecular Identification of E. crocea
2.2.1. DNA Extraction, Amplification, and Sequencing
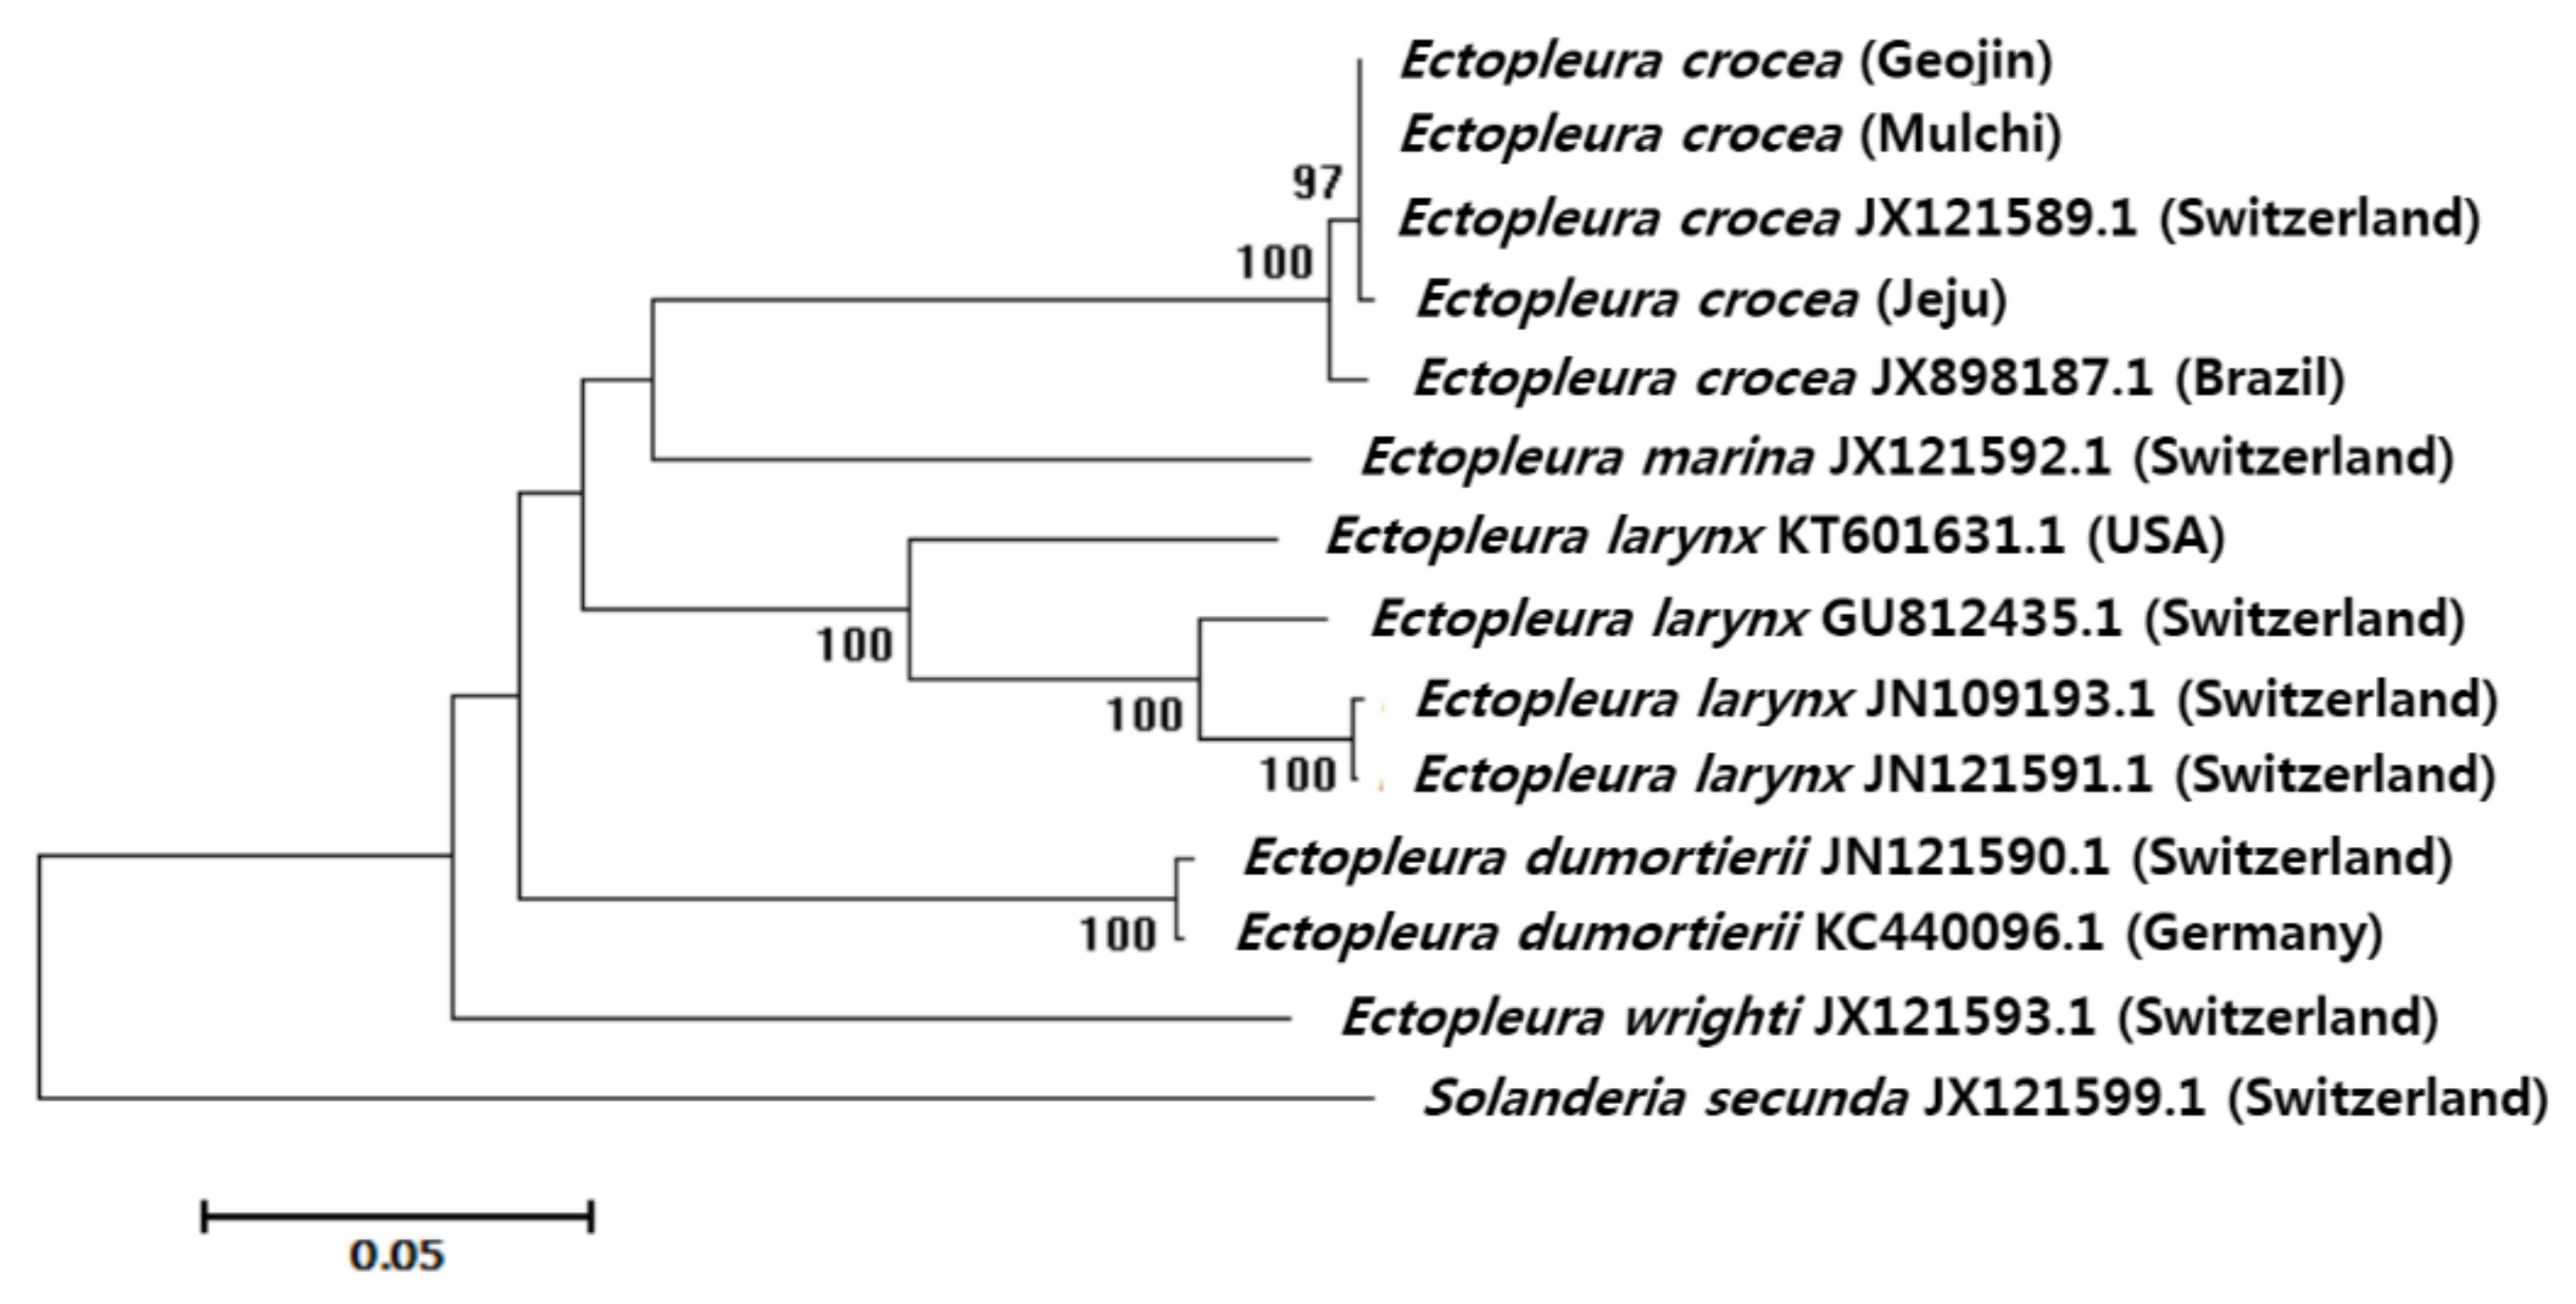
2.2.2. Sequence and Phylogenetic Analyses
2.3. Species-Specific Primers and eDNA
2.3.1. E. crocea-Specific Primers and Probe Design
2.3.2. Collection and Isolation of eDNA
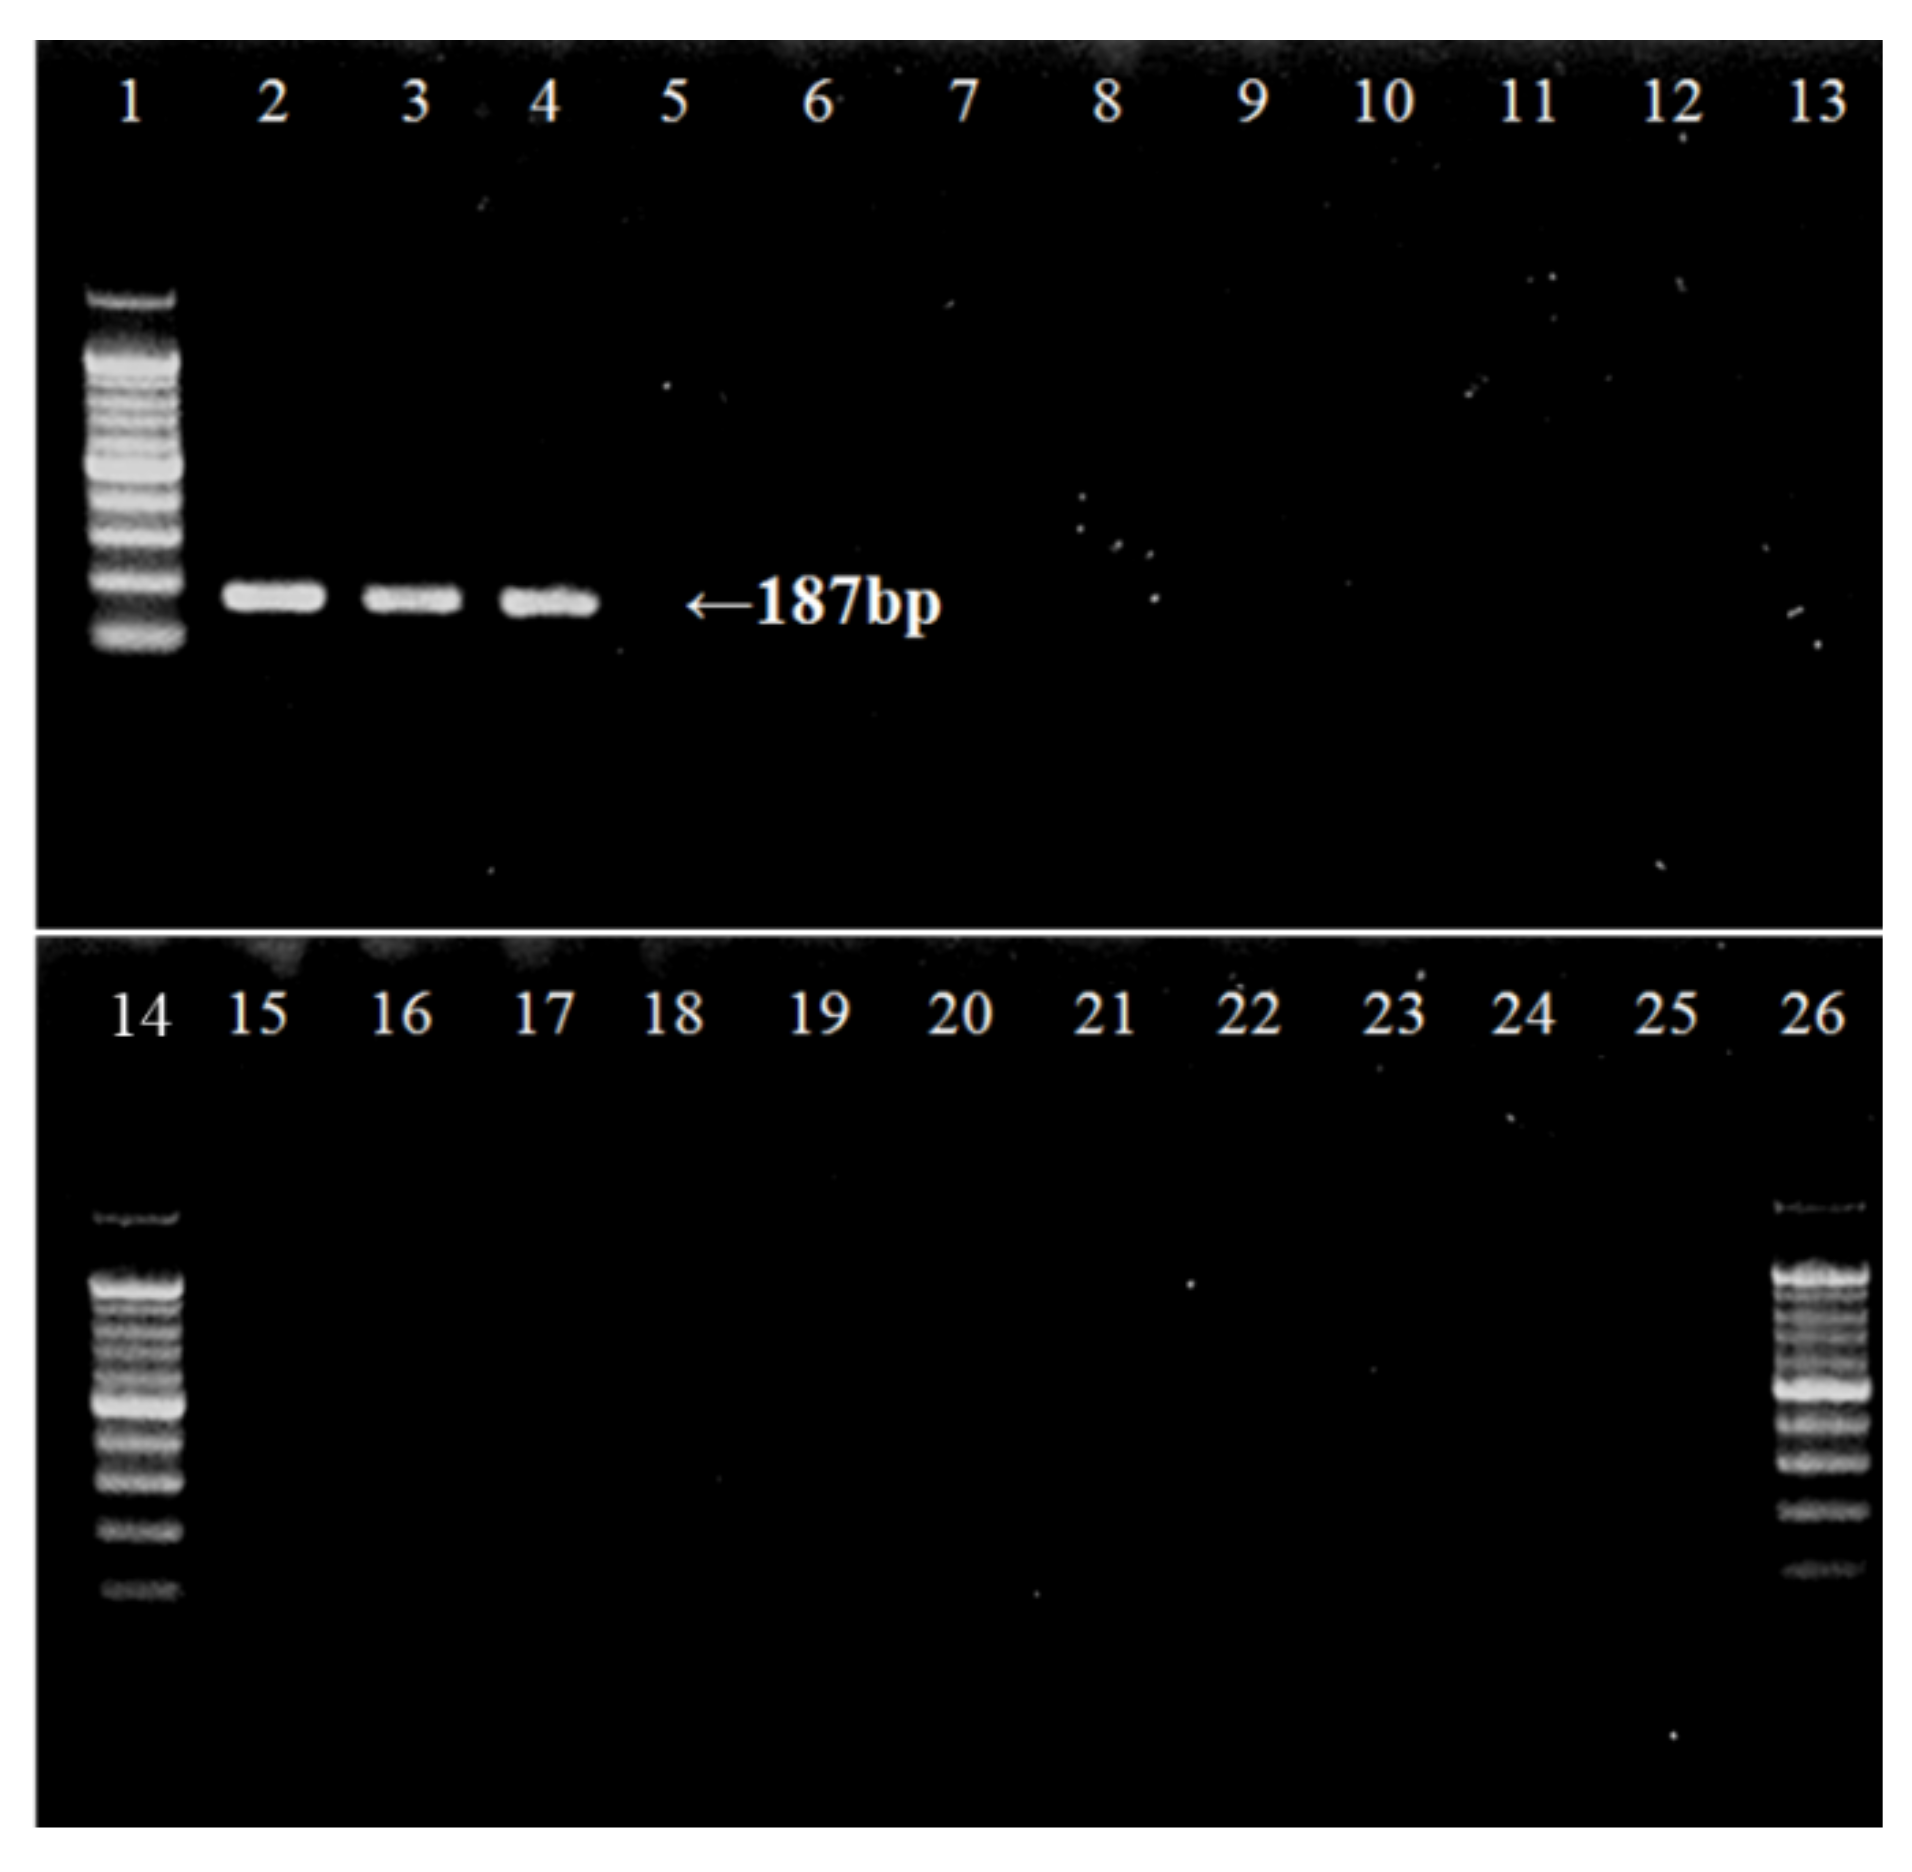
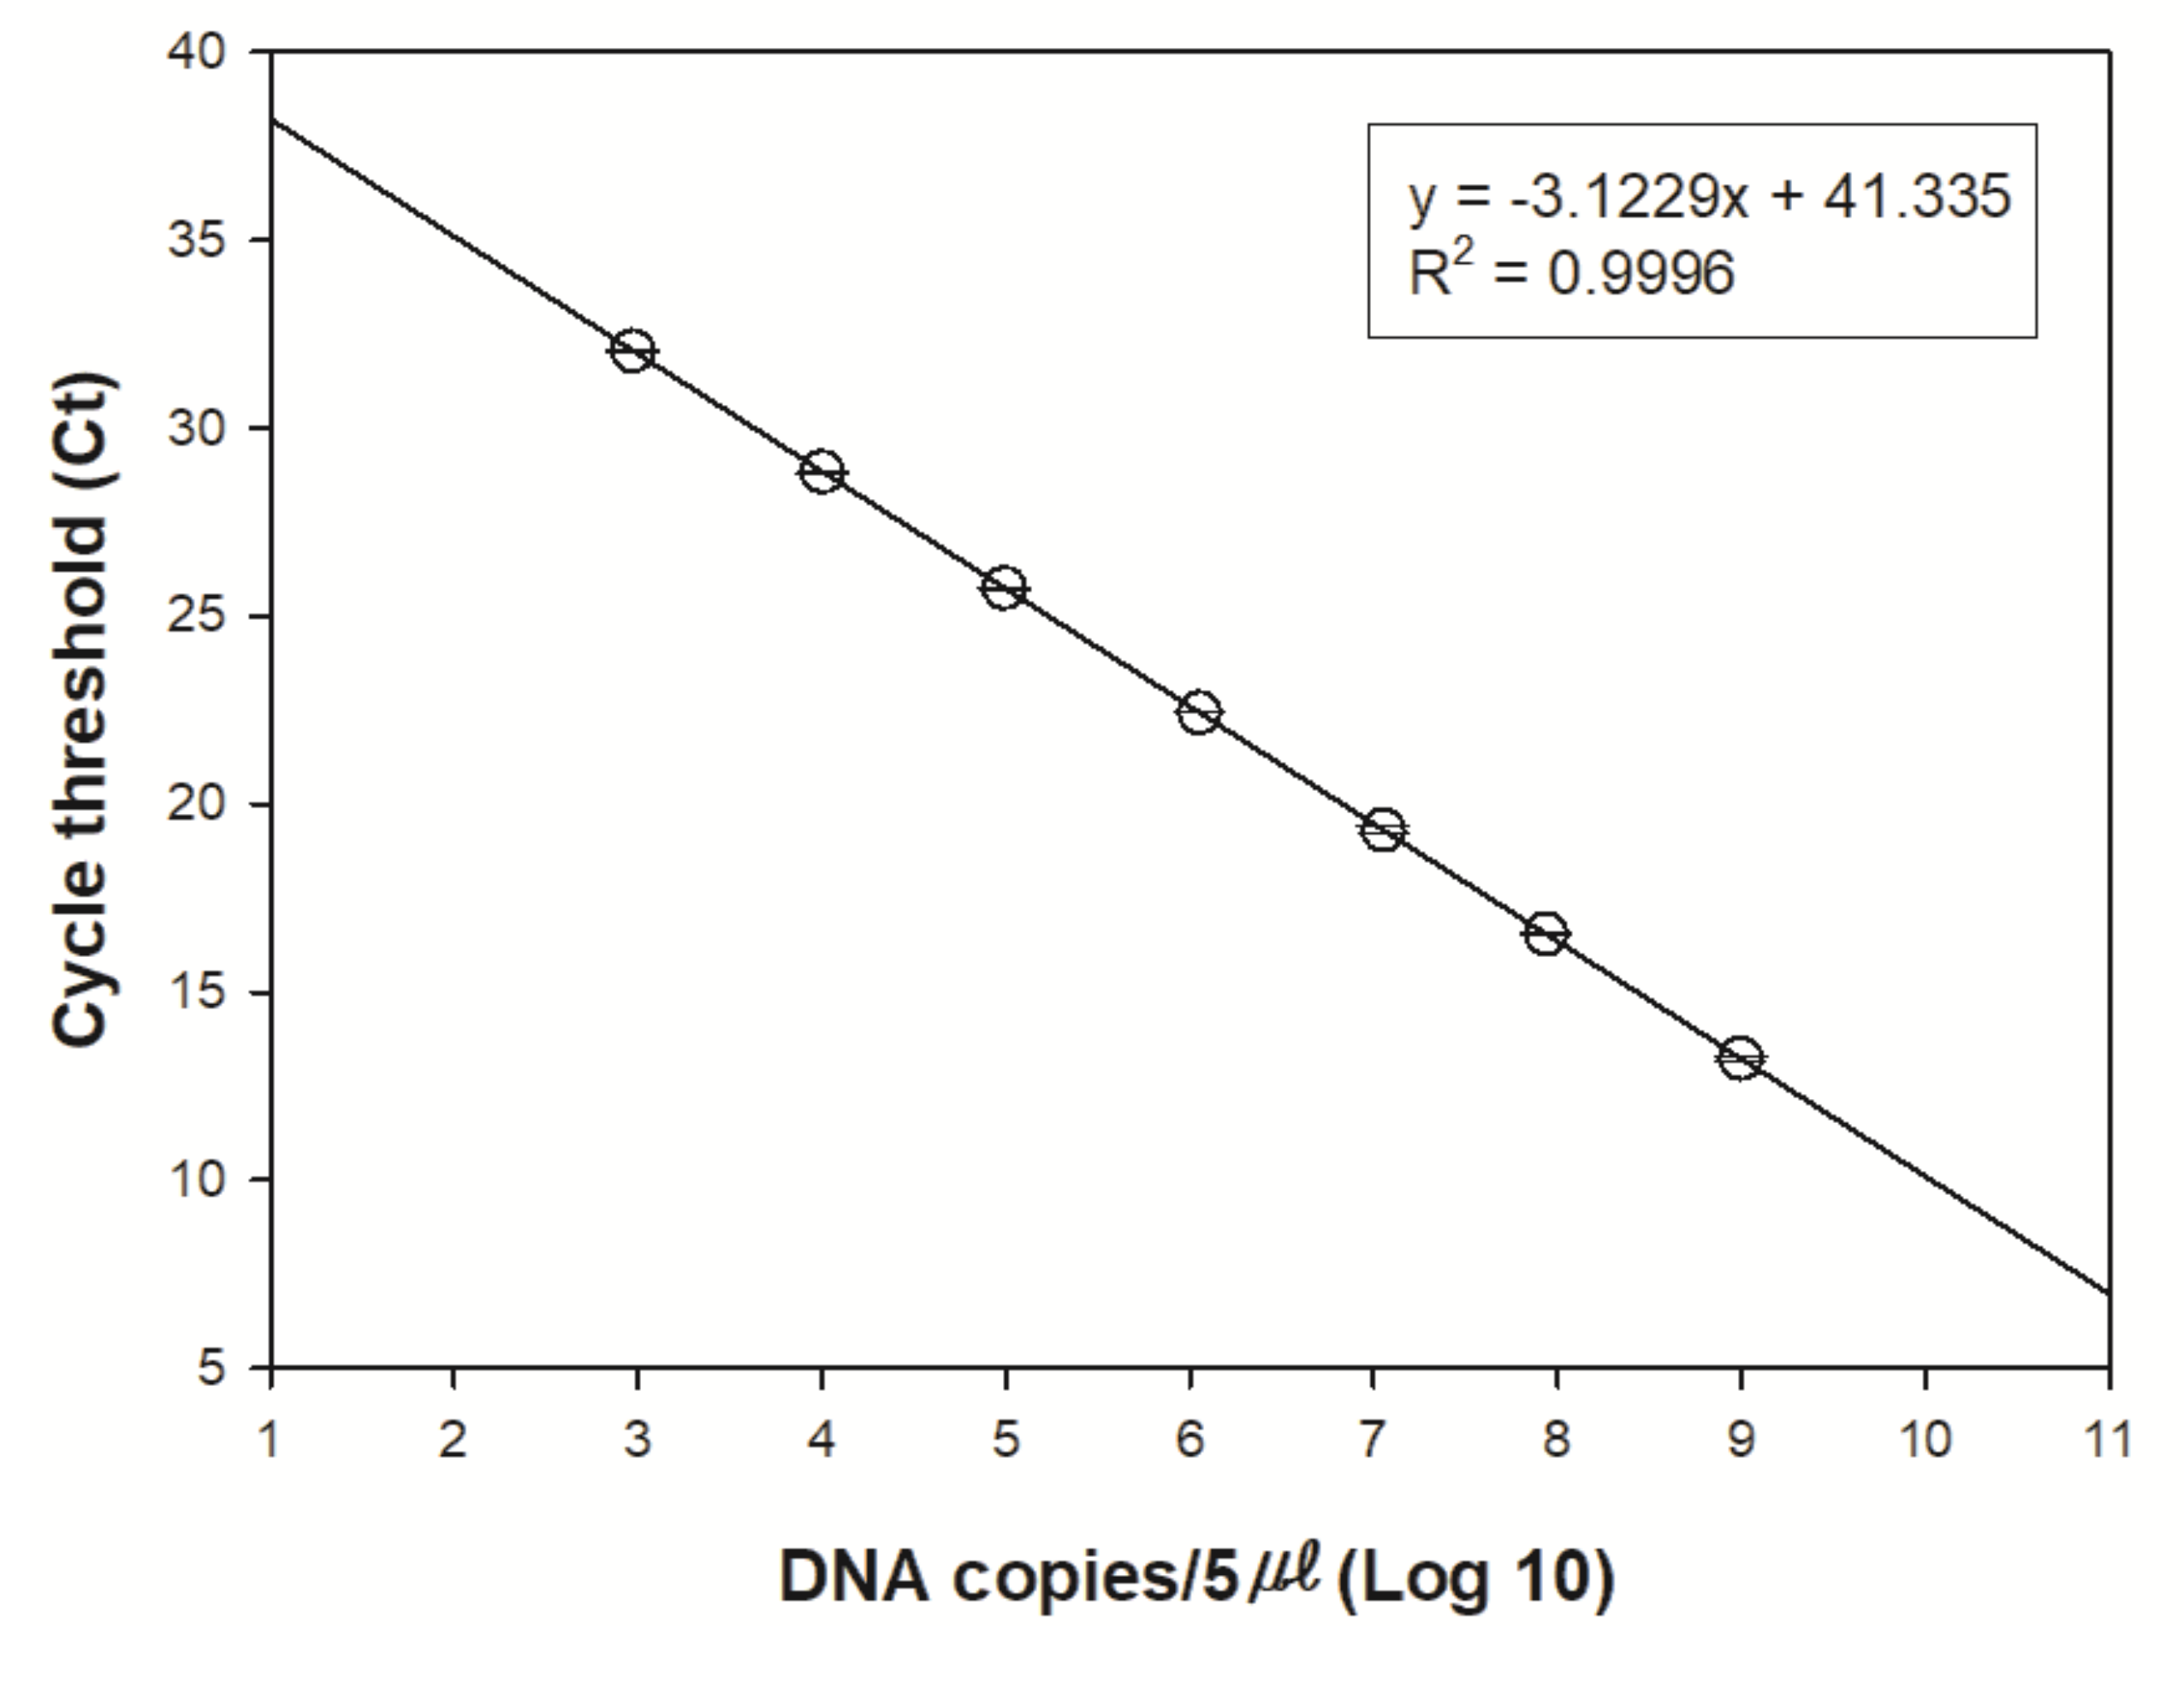
2.3.3. eDNA Amplification
3. Results
4. Discussion
Author Contributions
Funding
Conflicts of Interest
Appendix A

| Phylum | Class | Species | Accession Number |
|---|---|---|---|
| Porifera | Demospongiae | Amphimedon compressa | EU237474 |
| Aplysina fulva | EU237476 | ||
| Callyspongia plicifera | EU237477 | ||
| Chondrilla nucula | EU237478 | ||
| Halisarca dujardini | EU237483 | ||
| Hippospongia lachne | EU237484 | ||
| Igernella notabilis | EU237485 | ||
| Iotrochota birotulata | EU237486 | ||
| Plakinastrella onkodes | EU237487 | ||
| Topsentia ophiraphidites | EU237482 | ||
| Vaceletia sp. | EU237489 | ||
| Xestospongia muta | EU237490 | ||
| Cnidaria | Hydrozoa | Clava multicornis | JN700935, NC 016465 |
| Craspedacusta sowerbyi | JN593332, NC 018537 | ||
| Cubaia aphrodite | JN700942, NC 016467 | ||
| Hydra magnipapillata | NC 011221 | ||
| Hydra oligactis | EU237491, NC 010214 | ||
| Hydra sinensis | JX089978, NC 021406 | ||
| Hydra vulgaris | HM369413 | ||
| Hydra vulgaris | HM369414 | ||
| Laomedea flexuosa | JN700945, NC 016463 | ||
| Turritopsis dohrnii | KT020766, KT899097, NC 031213 | ||
| Scyphozoa | Aurelia aurita | DQ787873, HQ694729, NC 008446 | |
| Aurelia sp. | LC005413, LC005414 | ||
| Cassiopea frondosa | JN700936, NC 016466 | ||
| Chrysaora quinquecirrha | HQ694730, NC 020459 | ||
| Craspedacusta sowerbyi | JN593332 | ||
| Haliclystus antarcticus | KU947038, NC 030337 | ||
| Anthozoa | Alveopora allingi | AB907079 | |
| Alveopora catalai | AB907081 | ||
| Alveopora excelsa | AB907085 | ||
| Alveopora japonica | AB907087 | ||
| Alveopora sp. | KJ634271 | ||
| Alveopora spongiosa | AB907093 | ||
| Alveopora tizardi | AB907096 | ||
| Alveopora verrilliana | AB907097 | ||
| Arthropoda | Hexanauplia | Acasta sulcata | KJ754818, NC 029168 |
| Amphibalanus amphitrite | KF588709, NC 024525 | ||
| Armatobalanus allium | KJ754817, NC 029167 | ||
| Balanus balanus | KM660676, NC 026466 | ||
| Capitulum mitella | AB167462 | ||
| Chelonibia testudinaria | KJ754819, NC 029169 | ||
| Chthamalus antennatus | KP294312, NC 026730 | ||
| Epopella plicata | KM008743, NC 033393 | ||
| Lepas anserifera | KP294311, NC 026576 | ||
| Lepas australis | KM017964, NC 025295 | ||
| Megabalanus ajax | KF501046, NC 024636 | ||
| Megabalanus volcano | AB167539, NC 006293 | ||
| Pollicipes mitella | AY514042 | ||
| Pollicipes polymerus | AY456188, NC 005936 | ||
| Striatobalanus amaryllis | KF493890, NC 024526 | ||
| Tetraclita japonica | AB126701, NC 008974 | ||
| Tetraclita serrata | KJ434948, NC 029154 | ||
| Tetraclitella divisa | KJ754822, NC 029170 | ||
| Bryozoa | Gymnolaemata | Bugula dentata | KC129718 |
| Bugula flabellata | AY061749 | ||
| Bugula fulva | KC129719 | ||
| Bugula migottoi | KC129720 | ||
| Bugula neritina | AY690838, KC129722, KC129735, KC129735, KC129754, KC129822 | ||
| Bugula stolonifera | KC129849 | ||
| Bugula turrita | KC129850 | ||
| Celleporella hyalina | JQ839275, JQ839276, NC 018344 | ||
| Flustra foliacea | JQ061319, NC 016722 | ||
| Flustrellidra hispida | DQ157889, NC 008192 | ||
| Membranipora grandicella | NC 018355 | ||
| Tubulipora flabellaris | EU563937 | ||
| Watersipora subtorquata | EU365892, NC 011820 | ||
| Echinodermata | Crinoidea | Antedon mediterranea | AM404181, NC 010692 |
| Florometra serratissima | NC 001878 | ||
| Neogymnocrinus richeri | DQ068951, NC 007689 | ||
| Phanogenia gracilis | DQ068952, NC 007690 | ||
| Asteroidea | Acanthaster brevispinus | AB231476, NC 007789 | |
| Acanthaster planci | AB231475, NC 007788 | ||
| Aphelasterias japonica | NC 025766 | ||
| Asterias amurensis | AB183559, NC 006665 | ||
| Astropecten polyacanthus | AB183560, NC 006666 | ||
| Luidia quinalia | AB183558 | ||
| Patiria pectinifera | D16387 | ||
| Ophiuroidea | Amphipholis squamata | FN562578, NC 013876 | |
| Astrospartus mediterraneus | FN562580, NC 013878 | ||
| Astrospartus mediterraneus | NC 013878 | ||
| Ophiacantha linea | NC 023254 | ||
| Ophiocomina nigra | FN562577, NC 013874 | ||
| Ophiopholis aculeata | AF314589, NC 005334 | ||
| Ophiura albida | AM404180, NC 010691 | ||
| Ophiura lutkeni | AY184223, NC 005930 | ||
| Echinoidea | Arbacia lixula | NC 001770 | |
| Echinocardium cordatum | NC 013881 | ||
| Heliocidaris crassispina | NC 023774 | ||
| Hemicentrotus pulcherrimus | NC 023771 | ||
| Loxechinus albus | JX888466 | ||
| Mesocentrotus franciscanus | NC 024177 | ||
| Mesocentrotus nudus | NC 020771 | ||
| Nacospatangus alta | NC 023255 | ||
| Paracentrotus lividus | J04815 | ||
| Pseudocentrotus depressus | KC490913, NC 023773 | ||
| Sterechinus neumayeri | NC 027063 | ||
| Strongylocentrotus droebachiensis | EU054306, NC 009940 | ||
| Strongylocentrotus intermedius | KC490912, NC 023772 | ||
| Strongylocentrotus pallidus | NC 009941 | ||
| Strongylocentrotus purpuratus | NC 001453 | ||
| Temnopleurus hardwickii | NC 026200 | ||
| Holothuroidea | Apostichopus japonicus | EU294194 | |
| Balanoglossus clavigerus | NC 013877 | ||
| Cucumaria miniata | AY182376 | ||
| Holothuria forskali | NC 013884 | ||
| Holothuria scabra | NC 027086 | ||
| Parastichopus californicus | NC 026727 | ||
| Parastichopus nigripunctatus | NC 013432 | ||
| Parastichopus parvimensis | NC 029699 | ||
| Peniagone sp. | KF915304 | ||
| Stichopus horrens | HQ000092, NC 014454 | ||
| Chordata | Ascidiacea | Aplidium conicum | FN313538, NC 013584 |
| Aplidium tabarquensis | HF548555 | ||
| Ascidiella aspersa | HF548561, NC 021469 | ||
| Botrylloides leachii | HF548553, HG931921, NC 024103 | ||
| Botrylloides nigrum | HF548559, NC 021467 | ||
| Botrylloides pizoni | HF548554, HG931922, NC 024104 | ||
| Botrylloides violaceus | HF548552, NC 024256 | ||
| Botryllus schlosseri | FM177702, HF548550, HF548551, HG931923, NC 021463 | ||
| Ciona intestinalis | AJ517314, NC 004447 | ||
| Ciona intestinalis type B | AM292218, NC 017929 | ||
| Ciona savignyi | AB079784, NC 004570 | ||
| Clavelina lepadiformis | AM292603, FJ839918, NC 012887 | ||
| Clavelina phlegraea | AM292604, NC 024105 | ||
| Didemnum vexillum | KM259616, KM259617, NC 026107 | ||
| Diplosoma listerianum | FN313539, NC 013556 | ||
| Halocynthia roretzi | AB024528, NC 002177 | ||
| Halocynthia spinosa | HF548558, NC 021466 | ||
| Herdmania momus | AM292602, FN296153, NC 013561 | ||
| Microcosmus sulcatus | AM292321, NC 013752 | ||
| Phallusia fumigata | NC 009834 | ||
| Phallusia mammillata | AM292320, NC 009833 | ||
| Polycarpa mytiligera | HF548556, NC 021464 | ||
| Pyura gangelion | HF548557, NC 021465 | ||
| Rhodosoma turcicum | HF548560, NC 021468 | ||
| Styela clava | HG931920 | ||
| Styela plicata | AM292601, NC 013565 |
| 1 | 2 | 3 | 4 | 5 | 6 | 7 | 8 | 9 | 10 | 11 | 12 | 13 | 14 | |
|---|---|---|---|---|---|---|---|---|---|---|---|---|---|---|
| Ectopleura crocea (Geojin) | - | 0.000 | 0.002 | 0.000 | 0.004 | 0.019 | 0.019 | 0.020 | 0.020 | 0.020 | 0.019 | 0.018 | 0.022 | 0.029 |
| Ectopleura crocea (Mulchi) | 0.000 | - | 0.002 | 0.000 | 0.004 | 0.019 | 0.019 | 0.020 | 0.020 | 0.020 | 0.019 | 0.018 | 0.022 | 0.029 |
| Ectopleura crocea (Jeju) | 0.002 | 0.002 | - | 0.002 | 0.004 | 0.019 | 0.019 | 0.020 | 0.020 | 0.020 | 0.019 | 0.018 | 0.021 | 0.029 |
| Ectopleura crocea JX121589.1 (Switzerland) | 0.000 | 0.000 | 0.002 | - | 0.004 | 0.019 | 0.019 | 0.020 | 0.020 | 0.020 | 0.019 | 0.018 | 0.022 | 0.029 |
| Ectopleura crocea JX898187.1 (Brazil) | 0.009 | 0.009 | 0.011 | 0.009 | - | 0.019 | 0.019 | 0.020 | 0.021 | 0.021 | 0.019 | 0.018 | 0.021 | 0.029 |
| Ectopleura dumortierii JX121590.1 (Switzerland) | 0.190 | 0.190 | 0.192 | 0.190 | 0.187 | - | 0.002 | 0.020 | 0.020 | 0.020 | 0.020 | 0.020 | 0.020 | 0.028 |
| Ectopleura dumortierii KC440096.1 (Germany) | 0.187 | 0.187 | 0.190 | 0.187 | 0.185 | 0.003 | - | 0.020 | 0.020 | 0.020 | 0.021 | 0.020 | 0.020 | 0.028 |
| Ectopleura larynx GU812435.1 (Switzerland) | 0.199 | 0.199 | 0.197 | 0.199 | 0.207 | 0.195 | 0.192 | - | 0.009 | 0.008 | 0.014 | 0.020 | 0.021 | 0.028 |
| Ectopleura larynx JN109193.1 (Switzerland) | 0.204 | 0.204 | 0.202 | 0.204 | 0.211 | 0.192 | 0.195 | 0.038 | - | 0.002 | 0.014 | 0.021 | 0.020 | 0.029 |
| Ectopleura larynx JX121591.1 (Switzerland) | 0.204 | 0.204 | 0.202 | 0.204 | 0.211 | 0.192 | 0.195 | 0.036 | 0.002 | - | 0.014 | 0.020 | 0.020 | 0.029 |
| Ectopleura larynx KT601631.1 (USA) | 0.190 | 0.190 | 0.192 | 0.190 | 0.192 | 0.201 | 0.204 | 0.103 | 0.104 | 0.102 | - | 0.018 | 0.021 | 0.028 |
| Ectopleura marina JX121592.1 (Switzerland) | 0.176 | 0.176 | 0.179 | 0.176 | 0.176 | 0.218 | 0.215 | 0.187 | 0.198 | 0.196 | 0.170 | - | 0.022 | 0.027 |
| Ectopleura wrighti JX121593.1 (Switzerland) | 0.232 | 0.232 | 0.229 | 0.232 | 0.229 | 0.201 | 0.196 | 0.212 | 0.204 | 0.207 | 0.206 | 0.211 | - | 0.029 |
| Solanderia secunda JX121599.1 (Switzerland) | 0.347 | 0.347 | 0.350 | 0.347 | 0.350 | 0.328 | 0.323 | 0.323 | 0.340 | 0.337 | 0.329 | 0.318 | 0.334 | - |
References
- Rees, H.C.; Maddison, B.C.; Middleditch, D.J.; Patmore, J.R.; Gough, K.C. Review: The detection of aquatic animal species using environmental DNA—A review of eDNA as a survey tool in ecology. J. Appl. Ecol. 2014, 51, 1450–1459. [Google Scholar] [CrossRef]
- Foote, A.D.; Thomsen, P.F.; Sveegaard, S.; Wahlberg, M.; Kielgast, J.; Kyhn, L.A.; Salling, A.B.; Galatius, A.; Orlando, L.; Gilbert, M.T.P. Investigating the potential use of environmental DNA (eDNA) for genetic monitoring of marine mammals. PLoS ONE 2012, 7, e41781. [Google Scholar] [CrossRef] [PubMed]
- Thomsen, P.F.; Kielgast, J.; Iversen, L.L.; Møller, P.R.; Rasmussen, M.; Willerslev, E. Detection of a diverse marine fish fauna using environmental DNA from seawater samples. PLoS ONE 2012, 7, e41732. [Google Scholar] [CrossRef] [PubMed]
- Kelly, R.P.; Port, J.A.; Yamahara, K.M.; Crowder, L.B. Using environmental DNA to census marine fishes in a large mesocosm. PLoS ONE 2014, 9, e86175. [Google Scholar] [CrossRef] [Green Version]
- Taberlet, P.; Coissac, E.; Pompanon, F.; Brochmann, C.; Willerslev, E. Towards next-generation biodiversity assessment using DNA metabarcoding. Mol. Ecol. 2012, 21, 2045–2050. [Google Scholar] [CrossRef] [PubMed]
- Jerde, C.L.; Mahon, A.R.; Chadderton, W.L.; Lodge, D.M. “Sight-unseen” detection of rare aquatic species using environmental DNA. Conserv. Lett. 2011, 4, 150–157. [Google Scholar] [CrossRef]
- Dejean, T.; Valentini, A.; Miquel, C.; Taberlet, P.; Bellemain, E.; Miaud, C. Improved detection of an alien invasive species through environmental DNA barcoding: The example of the American bullfrog Lithobates catesbeianus. J. Appl. Ecol. 2012, 49, 953–959. [Google Scholar] [CrossRef]
- Wilcox, T.M.; McKelvey, K.S.; Young, M.K.; Jane, S.F.; Lowe, W.H.; Whiteley, A.R.; Schwartz, M.K. Robust detection of rare species using environmental DNA: The importance of primer specificity. PLoS ONE 2013, 8, e59520. [Google Scholar] [CrossRef] [PubMed] [Green Version]
- Ardura, A.; Zaiko, A.; Martinez, J.L.; Samulioviene, A.; Semenova, A.; Garcia-Vazquez, E. eDNA and specific primers for early detection of invasive species–a case study on the bivalve Rangia cuneata, currently spreading in Europe. Mar. Environ. Res. 2015, 112, 48–55. [Google Scholar] [CrossRef]
- Ikeda, K.; Doi, H.; Tanaka, K.; Kawai, T.; Negishi, J. Using environmental DNA to detect an endangered crayfish Cambaroides japonicas in streams. Conserv. Genet. 2016, 8, 231–234. [Google Scholar] [CrossRef]
- DiBattista, J.D.; Roberts, M.B.; Bouwmeester, J.; Bowen, B.W.; Coker, D.J.; Lozano-Cortés, D.F.; Choat, J.H.; Gaither, M.R.; Hobbs, J.A.; Khalil, M.T.; et al. A review of contemporary patterns of endemism for shallow water reef fauna in the Red Sea. J. Biogeogr. 2016, 43, 423–439. [Google Scholar] [CrossRef] [Green Version]
- Gurevitch, J.; Padilla, D.K. Are invasive species a major cause of extinctions? Trends Ecol. Evol. 2004, 19, 470–474. [Google Scholar] [CrossRef] [PubMed]
- Bax, N.; Williamson, A.; Aguero, M.; Gonzalez, E.; Geeves, W. Marine invasive alien species: A threat to global biodiversity. Marine Policy 2003, 27, 313–323. [Google Scholar] [CrossRef]
- Vander Zanden, M.J.; Hansen, G.J.A.; Higgins, S.N.; Kornis, M.S. A pound of prevention, plus a pound of cure: Early detection and eradication of invasive species in the Laurentian Great Lakes. J. Great Lakes Res. 2010, 36, 199–205. [Google Scholar] [CrossRef]
- Comtet, T.; Sandionigi, A.; Viard, F.; Casiraghi, M. DNA (meta) barcoding of biological invasions: A powerful tool to elucidate invasion processes and help managing aliens. Biol. Invasions 2015, 17, 905–922. [Google Scholar] [CrossRef]
- Ficetola, G.F.; Miaud, C.; Pompanon, F.; Taberlet, P. Species detection using environmental DNA from water samples. Biol. Lett. 2008, 4, 423–425. [Google Scholar] [CrossRef] [Green Version]
- Gotelli, N.J.; Colwell, R.K. Quantifying biodiversity: Procedures and pitfalls in the measurement and comparison of species richness. Ecol. Lett. 2001, 4, 379–391. [Google Scholar] [CrossRef] [Green Version]
- Darling, J.A.; Mahon, A.R. From molecules to management: Adopting DNA-based methods for monitoring biological invasions in aquatic environments. Environ. Res. 2011, 111, 978–988. [Google Scholar] [CrossRef]
- Goldberg, C.S.; Turner, C.R.; Deiner, K.; Klymus, K.E.; Thomsen, P.F.; Murphy, M.A.; Spear, S.F.; McKee, A.; Oyler-McCance, S.J.; Cornman, R.S.; et al. Critical considerations for the application of environmental DNA methods to detect aquatic species. Methods Ecol. Evol. 2016, 7, 1299–1307. [Google Scholar] [CrossRef]
- Hajibabaei, M.; Smith, M.A.; Janzen, D.H.; Rodriguez, J.J.; Whitfield, J.B.; Hebert, P.D.N. A minimalist barcode can identify a specimen whose DNA is degraded. Mol. Ecol. Notes 2006, 6, 959–964. [Google Scholar] [CrossRef]
- Bohmann, K.; Evans, A.; Gilbert, M.T.P.; Carvalho, G.R.; Creer, S.; Knapp, M.; Yu, D.W.; De Bruyn, M. Environmental DNA for wildlife biology and biodiversity monitoring. Trends. Ecol. Evol. 2014, 29, 358–367. [Google Scholar] [CrossRef] [PubMed]
- Valentini, A.; Taberlet, P.; Miaud, C.; Civade, R.; Herder, J.; Thomsen, P.F.; Bellemain, E.; Besnard, A.; Coissac, E.; Boyer, F.; et al. Next-generation monitoring of aquatic biodiversity using environmental DNA metabarcoding. Mol. Ecol. 2016, 25, 929–942. [Google Scholar] [CrossRef] [Green Version]
- Goldberg, C.S.; Pilliod, D.S.; Arkle, R.S.; Waits, L.P. Molecular detection of vertebrates in stream water: A demonstration using rocky mountain tailed frogs and Idaho giant salamanders. PLoS ONE 2011, 6, e22746. [Google Scholar] [CrossRef]
- Piaggio, A.J.; Engeman, R.M.; Hopken, M.W.; Humphrey, J.S.; Keacher, K.L.; Bruce, W.E.; Avery, M.L. Detecting an elusive invasive species: A diagnostic PCR to detect Burmese python in Florida waters and an assessment of persistence of environmental DNA. Mol. Ecol. Resour. 2014, 14, 374–380. [Google Scholar] [CrossRef] [PubMed] [Green Version]
- Davy, C.M.; Kidd, A.G.; Wilson, C.C. Development and validation of environmental DNA (eDNA) markers for detection of freshwater turtles. PLoS ONE 2015, 10, e0130965. [Google Scholar] [CrossRef] [PubMed] [Green Version]
- Goldberg, C.S.; Sepulveda, A.; Ray, A.; Baumgardt, J.; Waits, L.P. Environmental DNA as a new method for early detection of New Zealand mudsnails (Potamopyrgus antipodarum). Freshw. Sci. 2013, 32, 792–800. [Google Scholar] [CrossRef] [Green Version]
- Xia, Z.; Zhan, A.; Gao, Y.; Zhang, L.; Haffner, G.D.; MacIsaac, H.J. Early detection of a highly invasive bivalve based on environmental DNA (eDNA). Biol. Invasions 2017, 20, 437–447. [Google Scholar] [CrossRef]
- Wood, S.A.; Pochon, X.; Ming, W.; von Ammon, U.; Woods, C.; Carter, M.; Smith, M.; Inglis, G.; Zaiko, A. Considerations for incorporating real-time PCR assays into routine marine biosecurity surveillance programmes: A case study targeting the Mediterranean fanworm (Sabella spallanzanii) and club tunicate (Styela clava). Genome 2019, 62, 137–146. [Google Scholar] [CrossRef] [Green Version]
- Kim, P.; Kim, D.; Yoon, T.J.; Shin, S. Early detection of marine invasive species, Bugula neritina (Bryozoa: Cheilostomatida), using species-specific primers and environmental DNA analysis in Korea. Mar. Environ. Res. 2018, 139, 1–10. [Google Scholar] [CrossRef]
- Lesser, M.P.; Shumway, S.E.; Cucci, T.; Smith, J. Impact of fouling organisms on mussel rope culture: Interspecific competition for food among suspension-feeding invertebrates. J. Exp. Mar. Biol. Ecol. 1992, 165, 91–102. [Google Scholar] [CrossRef]
- De Sa, F.S.; Nalesso, R.C.; Paresgue, K. Fouling organisms on Perna perna mussels: Is it worth removing them? Braz. J. Oceanogr. 2007, 55, 155–161. [Google Scholar] [CrossRef]
- McKindsey, C.W.; Lecuona, M.; Huot, M.; Weise, A.M. Biodeposit production and benthic loading by farmed mussels and associated tunicate epifauna in Prince Edward Island. Aquaculture 2009, 295, 44–51. [Google Scholar] [CrossRef]
- Braithwaite, R.A.; McEvoy, L.A. Marine biofouling on fish farms and its remediation. Adv. Mar. Biol. 2005, 47, 215–252. [Google Scholar] [CrossRef] [PubMed]
- De Nys, R.; Guenther, J. The impact and control of biofouling in marine finfish aquaculture. In Advances in Marine Antifouling Coatings and Technologies; Hellio, C., Yebra, D., Eds.; Woodhead: Cambridge, MA, USA, 2009; pp. 177–221. [Google Scholar] [CrossRef]
- Dürr, S.; Watson, D.I. Biofouling and antifouling in aquaculture. In Biofouling; Dürr, S., Thomason, J.C., Eds.; Wiley-Blackwell: Oxford, UK, 2010; pp. 267–287. [Google Scholar]
- Mills, C.E.; Marques, A.C.; Migotto, A.E.; Calder, D.R. Hydrozoa: Polyps, hydromedusae, and siphonophora. In The Light and Smith Manual: Intertidal Invertebrates from Central California to Oregon; Carlton, J.T., Ed.; University of California Press: Berkley, CA, USA, 2007; pp. 118–167. [Google Scholar]
- Fitridge, I.; Keough, M.J. Ruinous resident: The hydroid Ectopleura crocea negatively affects suspended culture of the mussel Mytilus galloprovincialis. Biofouling 2013, 29, 119–131. [Google Scholar] [CrossRef]
- Fitridge, I. The ecology of hydroids (Hydrozoa: Cnidaria) in Port Phillip Bay, Australia, and their impacts as fouling species in longline mussel culture. PhD thesis, Department of Zoology, The University of Melbourne, Melbourne, Australia, 2011. [Google Scholar]
- Fitridge, I.; Dempster, T.; Guenther, J.; de Nys, R. The impact and control of biofouling in marine aquaculture: A review. Biofouling 2012, 28, 49–669. [Google Scholar] [CrossRef]
- Rho, B.J. Studies on the marine hydroid in Korea. J. Korean Res. Inst. Better Liv., Ewha Womans Univ. 1969, 2, 161–174. [Google Scholar]
- Folmer, O.; Black, M.; Hoeh, W.; Lutz, R.; Vrijenhoek, R. DNA primers for amplification of mitochondrial cytochrome c oxidase subunit I from diverse metazoan invertebrates. Mol. Mar. Biol. Biotechnol. 1994, 3, 294–299. [Google Scholar]
- Hall, T.A. BioEdit: A user-friendly biological sequence alignment editor and analysis program for Windows 95/98/NT. Nucleic Acids Symp. Series 1999, 41, 95–98. [Google Scholar]
- Thompson, J.D.; Gibson, T.J.; Plewniak, F.; Jeanmougin, F.; Higgins, D.G. The CLUSTAL X windows interface: Flexible strategies for multiple sequence alignment aided by quality analysis tools. Nucleic Acids Res. 1997, 25, 4876–4882. [Google Scholar] [CrossRef] [Green Version]
- Kumar, S.; Stecher, G.; Tamura, K. MEGA7: Molecular evolutionary genetics analysis version 7.0 for bigger datasets. Mol. Biol. Evol. 2016, 33, 1870–1874. [Google Scholar] [CrossRef] [Green Version]
- Kimura, M. A simple method for estimating evolutionary rates of base substitutions through comparative studies of nucleotide sequences. J. Mol. Evol. 1980, 16, 111–120. [Google Scholar] [CrossRef] [PubMed]
- Collins, R.A.; Boykin, L.M.; Cruickshank, R.H.; Armstrong, K.F. Barcoding’s next top model: An evaluation of nucleotide substitution models for specimen identification. Methods Ecol. Evol. 2012, 3, 457–465. [Google Scholar] [CrossRef]
- Takahara, T.; Minamoto, T.; Yamanaka, H.; Doi, H.; Kawabata, Z. Estimation of fish biomass using environmental DNA. PLoS ONE 2012, 7, e35868. [Google Scholar] [CrossRef] [PubMed] [Green Version]
- Turner, C.R.; Barnes, M.A.; Xu, C.C.; Jones, S.E.; Jerde, C.L.; Lodge, D.M. Particle size distribution and optimal capture of aqueous macrobial eDNA. Methods Ecol. Evol. 2014, 5, 676–684. [Google Scholar] [CrossRef] [Green Version]
- Smith, C.J.; Nedwell, D.B.; Dong, L.F.; Osborn, A.M. Evaluation of quantitative polymerase chain reaction-based approaches for determining gene copy and gene transcript numbers in environmental samples. Environ. Microbiol. 2006, 8, 804–815. [Google Scholar] [CrossRef]
- Zhang, A.N.; Mao, Y.; Zhang, T. Development of quantitative real-time PCR assays for different clades of “Candidatus accumulibacter”. Sci. Rep. 2016, 6, 23993. [Google Scholar] [CrossRef] [Green Version]
- Rasmussen, R.P. Quantification on the light cycler. In Rapid Cycle Real-time PCR; Meuer, S., Wittwe, R.C., Nakagawara, K.I., Eds.; Springer: Berlin/Heidelberg, Germany, 2011; pp. 21–34. [Google Scholar]
- Darling, J.A.; Blum, M.J. DNA-based methods for monitoring invasive species: A review and prospectus. Biol. Invasions 2007, 9, 751–765. [Google Scholar] [CrossRef]
- Blaxter, M.L. The promise of a DNA taxonomy. Philos. Trans.Roy. Soc. Lond. Ser. B-Biol. Sci. 2004, 359, 669–679. [Google Scholar] [CrossRef] [Green Version]
- Hebert, P.D.N.; Gregory, T.R. The promise of DNA barcoding for taxonomy. Syst. Biol. 2005, 54, 852–859. [Google Scholar] [CrossRef]
- Mikkelsen, N.T.; Schander, C.; Willassen, E. Local scale DNA barcoding of bivalves (Mollusca): A case study. Zool. Scr. 2007, 36, 455–463. [Google Scholar] [CrossRef]
- Go’mez, A.; Wright, P.J.; Lunt, D.H.; Cancino, J.M.; Carvalho, G.R.; Hughes, R.N. Mating trials validate the use of DNA barcoding to reveal cryptic speciation of a marine bryozoan taxon. Proc. R. Soc. B 2007, 274, 199–207. [Google Scholar] [CrossRef] [PubMed]
- Moura, C.J.; Harris, D.J.; Cunha, M.R.; Rogers, A.D. DNA barcoding reveals cryptic diversity in marine hydroids (Cnidaria, Hydrozoa) from coastal and deep-sea environments. Zool. Scr. 2007, 37, 93–108. [Google Scholar] [CrossRef]
- Ward, R.D.; Holmes, B.H.; O’hara, T.D. DNA barcoding discriminates echinoderm species. Mol. Ecol. Resour. 2008, 8, 1202–1211. [Google Scholar] [CrossRef] [PubMed]
- Jennings, R.M.; Bucklin, A.; Ossenbrugger, H.; Hopcroft, R.R. Species diversity of planktonic gastropods (Pteropoda and Heteropoda) from six ocean regions based on DNA barcode analysis. Deep-Sea Res. PT. II 2010, 57, 2199–2210. [Google Scholar] [CrossRef]
- Van de Vossenberg, B.T.L.H.; Ibanez-Justicia, A.; Metz-Verschure, E.; van Veen, E.J.; Bruil-Dieters, M.L.; Scholte, E.J. Real-time PCR Tests in Dutch Exotic Mosquito Surveys; Implementation of Aedes aegypti and Aedes albopictus Identification Tests, and the Development of Tests for the Identification of Aedes atropalpus and Aedes japonicus japonicus (Diptera: Culicidae). J. Med. Entomol. 2015, 52, 336–350. [Google Scholar] [CrossRef]
- Barnes, M.A.; Turner, C.T.; Jerde, C.L.; Renshaw, M.A.; Chadderton, W.L.; Lodge, D.M. Environmental conditions influence eDNA persistence in aquatic systems. Environ. Sci. Technol. 2014, 48, 1819–1827. [Google Scholar] [CrossRef]
- Strickler, K.M.; Fremier, A.K.; Goldberg, C.S. Quantifying effects of UV-B, temperature, and pH on eDNA degradation in aquatic microcosms. Biol. Conserv. 2015, 183, 85–92. [Google Scholar] [CrossRef]
- Thomsen, P.F.; Willerslev, E. Environmental DNA—An emerging tool in conservation for monitoring past and present biodiversity. Biol. Conserv. 2015, 183, 4–18. [Google Scholar] [CrossRef]
- Schneider, J.; Valentini, A.; Dejean, T.; Montarsi, F.; Taberlet, P.; Glaizot, O.; Fumagalli, L. Detection of invasive mosquito vectors using environmental DNA (eDNA) from water samples. PLoS ONE 2015, 11, e0162493. [Google Scholar] [CrossRef]
- Inui, R.; Akamatsu, Y.; Kanno, K.; Yamanaka, H.; Takahara, T.; Minamoto, T. Environmental DNA analysis for estimating the abundance and biomass of stream fish. Freshw. Biol. 2017, 62, 30–39. [Google Scholar] [CrossRef]
- Huber, I.; Block, A.; Sebah, D.; Debode, F.; Morisset, D.; Grohmann, L. Development and validation of duplex, triplex, and pentaplex real-time PCR screening assays for the detection of genetically modified organisms in food and feed. J. Agric. Food Chem. 2013, 61, 10293–10301. [Google Scholar] [CrossRef] [PubMed]
- Eichmiller, J.J.; Bajer, P.G.; Sorensen, P.W. The relationship between the distribution of common carp and their environmental DNA in a small lake. PLoS ONE 2014, 9, e112611. [Google Scholar] [CrossRef] [PubMed]
- Matsunaga, K.; Togashi, K. A simple method for discriminating Bursaphelenchus xylophilus and B. mucronatus by species-specific polymerase chain reaction primer pairs. Nematology 2004, 6, 273–277. [Google Scholar] [CrossRef]
- Thomsen, P.F.; Møller, P.R.; Sigsgaard, E.E.; Knudsen, S.W.; Jørgensen, O.A.; Willerslev, E. Environmental DNA from seawater samples correlate with trawl catches of subarctic, deepwater fishes. PLoS One 2016, 11, e0165252. [Google Scholar] [CrossRef] [PubMed] [Green Version]
 ;
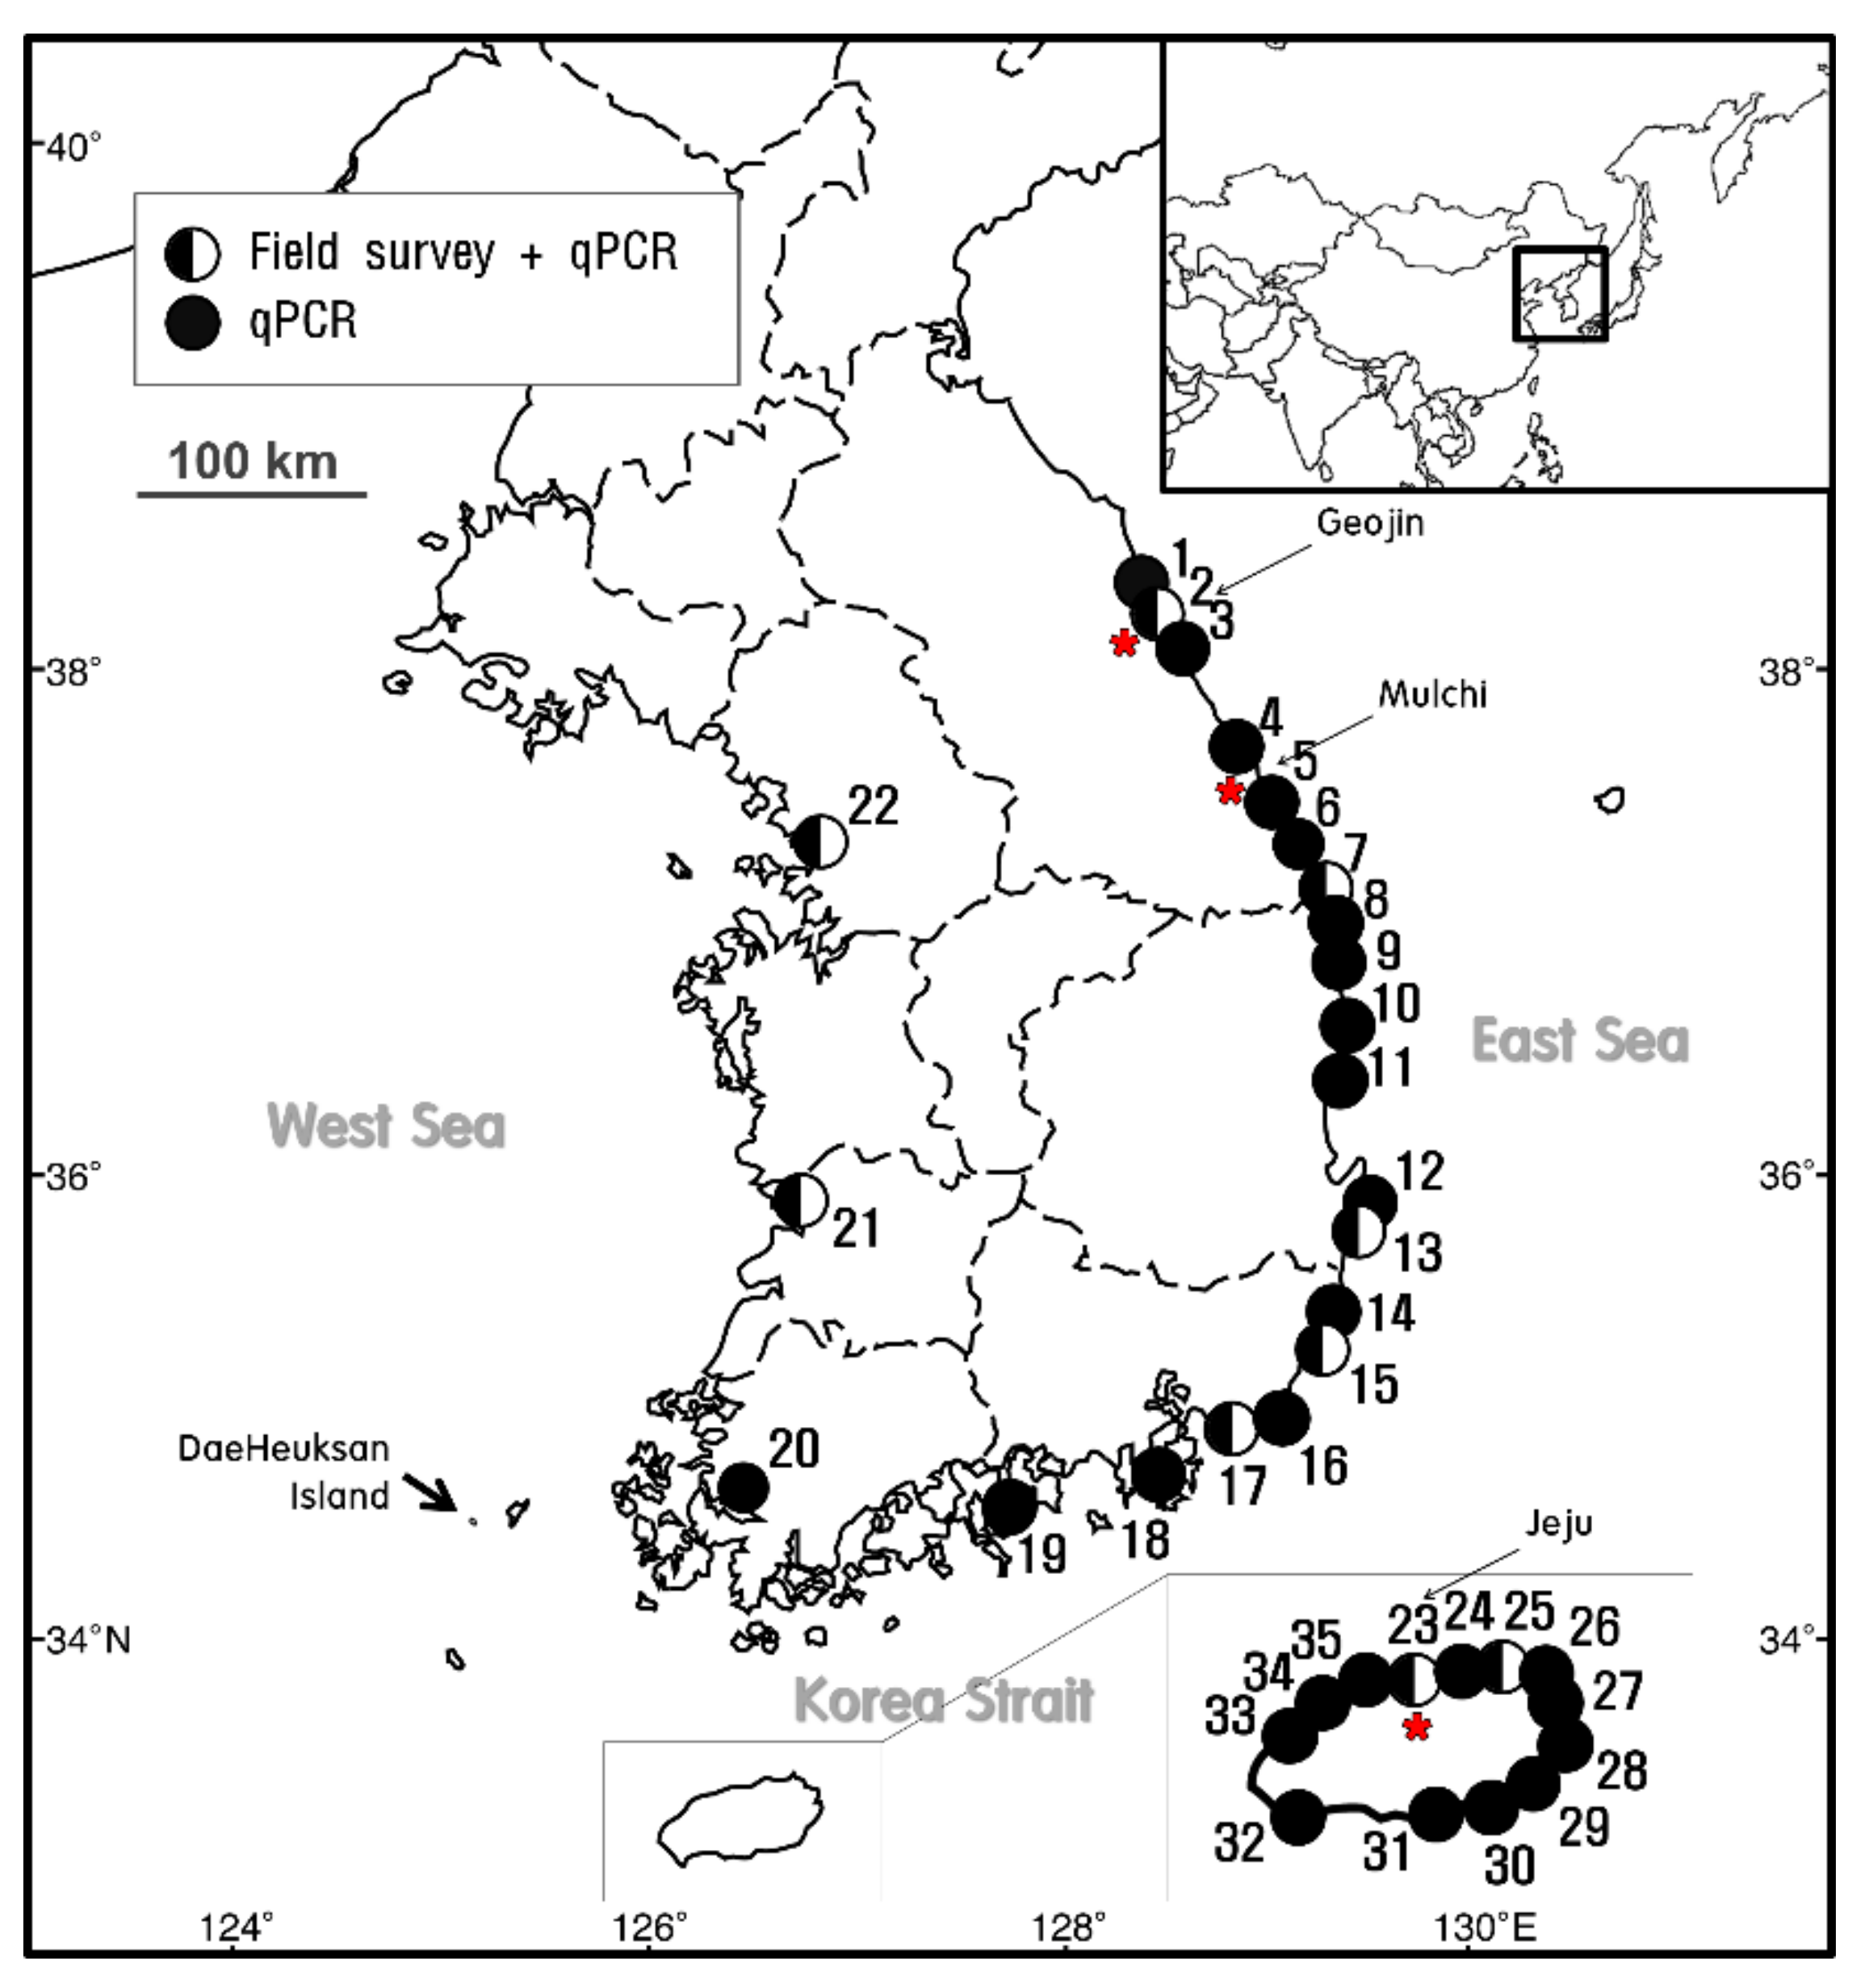
;  indicates the sites at which E. crocea was detected using qPCR analysis alone. The star (
  ) indicates the sampling sites for the molecular analysis.
; indicates the sites at which E. crocea was detected using qPCR analysis alone. The star ( ) indicates the sampling sites for the molecular analysis.
) indicates the sampling sites for the molecular analysis.
; indicates the sites at which E. crocea was detected using qPCR analysis alone. The star ( ) indicates the sampling sites for the molecular analysis.


| Primer & Probe | Sequence | Source |
|---|---|---|
| LCO1490 | 5ʹ-GGTCAACAAATCATAAAGATATTGG-3ʹ | Folmer et al. (1994) [41] |
| HCO2198 | 5ʹ-TAA ACTTCAGGGTGACCAAAAAATCA-3ʹ | |
| EcCr_SF | 5ʹ-TCTTTACTAGGAGATGACCATCTC-3ʹ | In this study |
| EcCr_SR | 5ʹ-AGTCAGAAACTTAARTTATTAAGT-3ʹ | |
| EcCr Probe | 5ʹ-6-Fam-TGCCAGTTTTAATTGGTGGATTTGG-BHQ-1-3ʹ |
| Taxon | Date | Location |
|---|---|---|
| Phylum CNIDARIA | - | - |
| Class Hydrozoa | - | - |
| Ectopleura crocea | 2016 | Geojin |
| 2016 | Mulchi | |
| 2016 | Jeju | |
| Bougainvillia ramosa | 2016 | Incheon |
| Campanularia hincksii | 2016 | Yeosu |
| Obelia dichotoma | 2016 | Gunsan |
| Obelia longissimi | 2016 | Mokpo |
| Laomedea calceolifera | 2017 | Busan |
| Phylum CHORDATA | - | - |
| Class Ascidiacea | - | - |
| Ascidiella aspersa | 2017 | Chuksan |
| Herdmania momus | 2016 | Seongsanpo |
| Phylum BRYOZOA | - | - |
| Class Gymnolaemata | - | - |
| Bugula neritina | 2016 | Anmok |
| Tricellaria occidentalis | 2016 | Ulsan |
| Watersipora subtorquata | 2016 | Jongdal |
| Phylum ECHINODERMATA | - | - |
| Class Crinoidea | - | - |
| Antedon serrata | 2009 | Busan |
| Heliometra glacialis | 2016 | Daejin |
| Class Asteroidea | - | - |
| Patiria pectinifera | 2016 | Juckbyeon |
| Asterias amurensis | 2016 | Dadaepo |
| Class Ophiuroidea | - | - |
| Ophiactis savignyi | 2016 | Dodu |
| Ophiopholis mirabilis | 2016 | Gampo |
| Class Echinoidea | - | - |
| Temnopleurus hardwickii | 2016 | Mipo |
| Prionocidaris japonica | 2012 | Aewol |
| Class Holothuroidea | - | - |
| Eupentacta chronhjelmi | 2016 | Tongyeong |
| Protankyra bidentata | 2015 | Incheon |
| Number | Region | Location | Latitude | Longitude |
|---|---|---|---|---|
| 1 | East Sea | Daejin | 38°29′56.61″N | 128°25′34.18″E |
| 2 | Geojin | 38°26′53.14″N | 128°27′46.37″E | |
| 3 | Gonghyunjin | 38°21′22.38″N | 128°30′43.26″E | |
| 4 | Jangsa | 38°13′35.24″N | 128°35′16.66″E | |
| 5 | Jumunjin | 37°53′31.41″N | 128°49′47.61″E | |
| 6 | Sacheon | 37°50′11.44″N | 128°52′42.30″E | |
| 7 | Mukho | 37°33′15.38″N | 129°07′06.64″E | |
| 8 | Donghae | 37°29′21.30″N | 129°07′23.35″E | |
| 9 | Imwon | 37°13′46.03″N | 129°20′45.80″E | |
| 10 | Jukbyeon | 37°03′17.32″N | 129°25′26.30″E | |
| 11 | Chuksan | 36°30′33.25″N | 129°26′54.35″E | |
| 12 | Guryongpo | 35°59′22.58″N | 129°33′19.97″E | |
| 13 | Yangpo | 35°52′56.34″N | 129°31′35.13″E | |
| 14 | Korea Strait | Ulsan | 35°31′09.47″N | 129°22′24.47″E |
| 15 | Bangeojin | 35°29′05.79″N | 129°25′44.76″E | |
| 16 | Daebyeon | 35°13′29.29″N | 129°13′41.95″E | |
| 17 | Busan | 35°07′02.60″N | 129°02′55.49″E | |
| 18 | Kwangyang | 34°54′55.32″N | 127°40′52.40″E | |
| 19 | Tongyeong | 34°50′23.05″N | 128°25′12.58″E | |
| 20 | Mokpo | 34°46′51.50″N | 126°22′59.76″E | |
| 21 | Yellow Sea | Bieung | 35°56′11.21″N | 126°31′38.01″E |
| 22 | Incheon | 37°27′34.05″N | 126°37′32.32″E | |
| 23 | Jeju Island | Jeju | 33°31′13.94″N | 126°32′11.91″E |
| 24 | Jocheon | 33°32′26.53″N | 126°38′08.00″E | |
| 25 | Bukchon | 33°33′10.65″N | 126°41′55.92″E | |
| 26 | Gimnyeong | 33°33′30.54″N | 126°44′11.94″E | |
| 27 | Jongdal | 33°28′23.88″N | 126°56′00.78″E | |
| 28 | Seongsanpo | 33°28′22.41″N | 126°56′04.58″E | |
| 29 | Pyoseon | 33°19′30.34″N | 126°50′47.13″E | |
| 30 | Wimi | 33°16′18.15″N | 126°39′48.39″E | |
| 31 | Seogwipo | 33°14′23.44″N | 126°33′52.28″E | |
| 32 | Moseulpo | 33°12′58.15″N | 126°15′01.93″E | |
| 33 | Hallim | 33°24′44.97″N | 126°15′20.51″E | |
| 34 | Aewol | 33°28′54.67″N | 126°19′58.14″E | |
| 35 | Dodu | 33°30′27.14″N | 126°27′55.53″E |
© 2020 by the authors. Licensee MDPI, Basel, Switzerland. This article is an open access article distributed under the terms and conditions of the Creative Commons Attribution (CC BY) license (http://creativecommons.org/licenses/by/4.0/).
Share and Cite
Kim, P.; Yoon, T.J.; Shin, S. Environmental DNA and Specific Primers for Detecting the Invasive Species Ectopleura crocea (Hydrozoa: Anthoathecata) in Seawater Samples. Sustainability 2020, 12, 2360. https://0-doi-org.brum.beds.ac.uk/10.3390/su12062360
Kim P, Yoon TJ, Shin S. Environmental DNA and Specific Primers for Detecting the Invasive Species Ectopleura crocea (Hydrozoa: Anthoathecata) in Seawater Samples. Sustainability. 2020; 12(6):2360. https://0-doi-org.brum.beds.ac.uk/10.3390/su12062360
Chicago/Turabian StyleKim, Philjae, Tae Joong Yoon, and Sook Shin. 2020. "Environmental DNA and Specific Primers for Detecting the Invasive Species Ectopleura crocea (Hydrozoa: Anthoathecata) in Seawater Samples" Sustainability 12, no. 6: 2360. https://0-doi-org.brum.beds.ac.uk/10.3390/su12062360