Evaluation System: Evaluation of Smart City Shareable Framework and Its Applications in China

1
Chinese Academy of Surveying and mapping, Beijing 100830, China
2
e-NewMap co. LTD., Beijing 100043, China
*
Author to whom correspondence should be addressed.
Sustainability 2020, 12(7), 2957; https://0-doi-org.brum.beds.ac.uk/10.3390/su12072957
Submission received: 26 February 2020
/
Revised: 1 April 2020
/
Accepted: 6 April 2020
/
Published: 8 April 2020
(This article belongs to the Special Issue Smart Cities, City Dashboards, Planning and Evaluation of Urban Performances)
Abstract
:Smart city evaluation is a critical component in smart city construction and plays an important role in guiding and promoting smart development of cities. Currently, existing research and applications of smart city evaluation are still in the exploration stage. They mainly focus on evaluation of one single aspect, use indicators with distinct regional characteristics and poor extensibility, and cannot be well-integrated with common and shareable smart city frameworks; these limitations have led to biased evaluation results. Based on a common and shareable smart city framework, this paper proposes a well-integrated, universal, strongly practical, and highly extensible evaluation system. Then, using the above-mentioned evaluation system, 17 smart cities in China are assessed. This application demonstrates that the evaluation system plays an important guiding role for better understanding the overall smart city platform construction situation in China, performing horizontal comparisons and establishing benchmarks among smart cities. Comparative analyses of indicators demonstrate that future smart city construction in China should pay more attention to novel innovations, the construction of dynamic information resources and spatiotemporal big data.
1. Introduction
With the development of information and communication technologies (ICT) and applications of urban informatization, smart city construction has become a focus in urban development [1,2,3]. Based on research on the smart city conceptual framework and elements, practical studies on smart cities have been conducted, such as for an intelligent traffic system in Sweden and a smart community system in Germany. Since 2011, smart city construction in China has been developing rapidly. As smart cities are constructed extensively, it becomes particularly important to evaluate the construction levels of smart cities [4,5].
Based on the conceptual frameworks and constituent elements of smart cities, many studies have been conducted on smart city evaluation [6,7,8]. In 2007, Giffinger at the Vienna University of Technology became the pioneering researcher to establish indicators to evaluate the development of smart cities in Europe. A smart city evaluation system was developed based on six aspects and emphasized human comfort. In 2009, International Business Machines Corporation (IBM) suggested that smart city evaluation should be conducted based on seven dimensions, including people (education, health care, public safety, and quality of life), business, governance, transportation, communications, water, and energy [9]. For each dimension, there are four primary indicators, which are then further divided into sub-indicators. The evaluation criteria focus on the assessment of the construction levels and the optimal standards where much attention is paid to technological breakthroughs. Deng (2010) showed that smart city evaluation should be based on urban informatization and then established an evaluation system comprising 21 indicators covering four aspects: network interconnection, smart industry, smart services, and smart culture [10]. With the idea that the real purpose of smart cities is to respond to the needs of citizens, Branchi et al. (2014, 2015, 2017) developed an easy-to-use tool, the technology analysis matrix (TAM), for the evaluation of smart cities, which considered different variables, such as social, urban, environmental, and economic. With this tool, it is easy for public policy makers to evaluate the implementation of new technologies and evaluate how technologies can impact the physical space and natural environment, and then decide on the best option [11,12,13].
However, current research and applications of smart city construction evaluation are still in the exploratory stage. The existing evaluation studies are relatively scattered and based on local conditions, leading to a lack of a common and shareable comprehensive evaluation system for smart cities at the national level. There are three shortcomings in the existing research on smart city construction evaluation: (1) Most evaluation indicators mainly focus only on a certain aspect of a smart city, such as evaluation of software and hardware infrastructure or applications, which has a low degree of integration with a shareable smart city framework and is unable to reflect the overall construction situation of a smart city; additionally, they are general indicators measuring levels of urban informatization, economic development, and residents’ experiences; (2) The evaluation systems have distinct regional characteristics that are not shareable, universal, and scalable; (3) Lacking actual application analysis, most research remains theoretical, and limited case studies have been performed.
Therefore, based on the common and shareable smart city framework proposed by Li et al. (2019) [14] and the existing research on smart city construction evaluation [13], this paper proposes a universal and highly practical evaluation system that is well-integrated with a sharable smart city framework. Then, based on the proposed system, several smart city evaluations are conducted. This smart city evaluation system is an effective tool to understand the actual construction situations of different smart cities with respect to the same standard, which is important for analyzing the strengths and weaknesses of different smart cities. The system can also provide recommendations and references for establishing and adjusting policies relevant to smart city construction.
2. Literature Review
2.1. Smart City Framework
Research on smart city construction frameworks is important for guiding the establishment of evaluation systems. Smart city is a new concept and mode to promote the intellectualization of urban planning, management and services by using ICT, such as the Internet of Things (IoT), cloud computing, and geospatial information [14,15,16,17,18,19]. Li et al. (2011) believed that smart cities will change the interactions among governments, businesses, and the public by using a smart approach and involving new information technologies, with the IoT and cloud computing as cores, and this smart approach is actually an integrated system of multiple decision-making and service algorithms that play a foundational and pre-emptive role in the construction of smart cities [20]. Yin et al. (2015) and Nuaimi et al. (2015) proposed that smart cities involve the integration, correlation, mining and application of data, and information by using the IoT and cloud computing, emphasizing the importance of infrastructure and big data processing technologies [21,22]. Li et al. (2019) proposed a common, shareable, and integratable conceptual framework for smart cities. The authors believed that smart city construction mainly covers four aspects: software and hardware infrastructure, spatial and temporal big data, cloud platforms, and applications. Based on this sharable framework, this paper establishes a common and highly scalable smart city construction evaluation system [14].
2.2. Smart City Evaluation
Since the concept of smart cities was proposed, research on smart city construction evaluation has been conducted in countries with earlier IoT technology development. For example, studies have been conducted by the World Smart Cities Organization, the Center for International Development at Harvard University, international enterprises such as IBM and International Data Corporation (IDC) in the United States, and colleges such as the Vienna University of Technology. Countries such as the United States, Italy, Japan, and China have also conducted research on smart city construction evaluation [23,24,25].
Focusing on the characteristics of medium-sized cities in Europe, Giffinger et al. (2007) constructed a system to evaluate smart city construction based on six aspects of intelligence, including smart economy, smart governance, smart living, smart citizen, smart environment, and smart mobility, and these aspects are divided into 31 secondary indicators and 73 tertiary indicators [26]. This evaluation system covers various indicators and is reasonably comprehensive; however, because the system has characteristics highly unique to Europe (for example, the voter turnout rate in Europe), the results are relatively subjective. In 2008, according to the concept of a smart city, IBM suggested that smart city evaluation should contain seven dimensions, including the people, business, governance, transportation, communications, water, and energy of the city. The evaluation criteria suggested by IBM mainly focused on the construction levels and the optimal standards. Through studying the construction and realization of smart cities in 27 countries in the European Union, Caragliu et al. (2009) proposed that smart city development is related to factors such as the creative industries of the city, urban environmental quality and its awareness, education level of the public, multimodal accessibility of information, and use of ICT by public management, and then they proposed the establishment of new ways to evaluate smart cities and strategic plans in Europe [27]. In 2012, taking urban innovation and sustainable development as criteria and referencing innovative cities, regional green cities, quality of life, and digital governments, Cohen evaluated smart cities globally [28]. Ernst and Young (2016) created a smart city evaluation system consisting of nine primary indicators and 153 sub-indicators and employed this system to evaluate smart city construction in the capital cities of all provinces in Italy [29]. The indicators mainly assess the cities based on eight aspects: broadband region, smart mobility, smart health, smart education, smart management, smart energy, energy efficiency, and natural resources. Moreover, a smart city evaluation system suitable for small and medium cities was established by Dall’O’ et al. (2017). The indicators were selected based on the ISO 37120 standard, and the study emphasized the importance of environmental indicators such as sustainable energy [30].
After the publication of “Smart Cities in China” by IBM, based on research on urban informatization evaluation systems and comprehensive analyses on smart city elements, Deng (2010) formulated a smart city evaluation system based on four dimensions: network interconnection, smart industry, smart services, and smart culture. Subsequent smart city evaluation studies in China basically followed the same ideology [10]. Li and Deng (2011) developed a smart city evaluation system based on four aspects: ubiquitous networks, smart applications, public system supporting platforms, and value realization; the system includes 19 secondary indicators and 57 tertiary indicators [31]. Gu and Qiao (2012) constructed a smart city evaluation system based on seven dimensions: smart people, smart infrastructure, smart governance, smart livelihood, smart economy, smart environment, and smart planning and construction [32].
Furthermore, many researchers have assessed the construction levels of smart cities from other perspectives. Malek (2009) used the Informative Global Community (IGC) Development Index to evaluate the development of communities in smart cites [33]. Cohen et al. (2015) evaluated smart cities all over the world from the perspectives of urban innovation and sustainable development based on data such as the Innovation Cities Top 100 Index, the digital city rankings of Digital Community for cities in the United States, and the IDC smart city rankings of Spain [28]. In addition, Ahvenniemi et al. (2017) compared 16 smart city evaluation systems comprising 958 indicators in total and reported that the goal of smart city construction evaluation should be to assess the sustainability of the environmental, social, and economic components of a city [34].
2.3. Shortcomings of Existing Research
The smart city construction evaluation systems developed in previous studies consist of multilevel indicators, primary indicators and secondary indicators. Although diverse and complex indicators are used, there are still shortcomings: (1) The indicators mostly focus on a certain aspect of smart cities, such as the evaluation of software and hardware infrastructure or applications. However, according to the elements in the common and shareable smart city framework proposed by Li et al. (2019) [14], a smart city is a unified framework that covers infrastructure, data, cloud systems, and applications. Therefore, indicators measure merely one particular aspect, which cannot reflect the overall performance comprehensively and construction level of a smart city; (2) The one-sidedness of the aforementioned indicators limits the application scope of the evaluation systems, and these systems show distinct regional characteristics; there is a lack of a common and shareable comprehensive evaluation system; (3) Most research has focused on methodology, and research on the application and comparative analysis of multiple smart cities remains rare. To address these issues, this paper proposes a universal and highly practical evaluation system that is well-integrated with a sharable smart city framework and then applies this system to evaluate several smart cities in China. This approach effectively enables us to better understand the actual construction situations of different smart cities with respect to the same standard.
3. Smart City Evaluation System for a Sharable Framework
3.1. Criteria for Selecting Indicators
To promote the healthy development of smart cities, it is critical to establish a systematic and scientific smart city evaluation system, conduct necessary evaluations, assess the construction statuses of cities, make timely adjustments, and ensure the realization of the overall goals of smart cities. Yuan et al. (2014) pointed out that research on smart city construction evaluation systems is in its infancy. Although many organizations have formulated well-defined systems, these systems still have to be integrated with common smart city frameworks so that they can be used to comprehensively and systematically assess applications of smart city projects [35]. Therefore, to propose a well-integrated evaluation system with a shareable smart city framework, the following principles are fully taken into account: systematicness, fundamentality, humanism, innovativeness, and operability.
Principle of systematicness: a smart city evaluation system provides a comprehensive evaluation of how smart a city is. The evaluation system should sufficiently consider the elements of the smart city framework and assess the actual situation of the city comprehensively from multiple aspects and perspectives, such as infrastructure, data, cloud systems, and applications.
Principle of fundamentality: the evaluation system should emphasize the fundamental guarantees for data, services, and software and hardware environment in smart city construction. This principle corresponds to information resource acquisition, management services and cloud environment construction.
Principle of humanism: it should be noted that this principle is more inclined from the technical system aspect, such as evaluation of the interface friendliness, ease of use of the sharable system, etc. This principle corresponds to application performance and information security measures.
Principle of innovativeness: to reflect the unique innovative characteristics of the smartness of the city, indicators that can measure the artificial intelligence (AI) technologies of the city or its local characteristics should be included. This principle corresponds to the system guarantees and innovative characteristics of AI technologies.
Principle of operability: a smart city evaluation system should have widely representative indicators, and the data it covers should be collectable through realistic and achievable collection channels. Moreover, the majority of the selected indicators should be quantitative, supplemented by qualitative indicators.
3.2. Common Evaluation System
The evaluation system has to be established in such a way that it is able to reflect the characteristics of a city, including basic sensing, data acquisition, mining and analysis, open sharing, and smart applications.
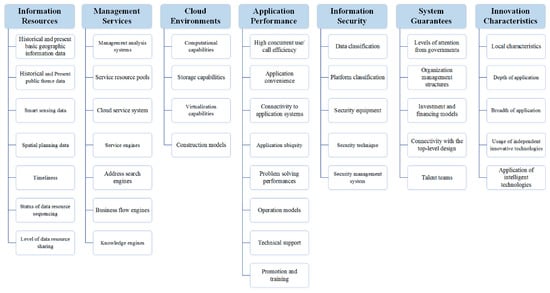
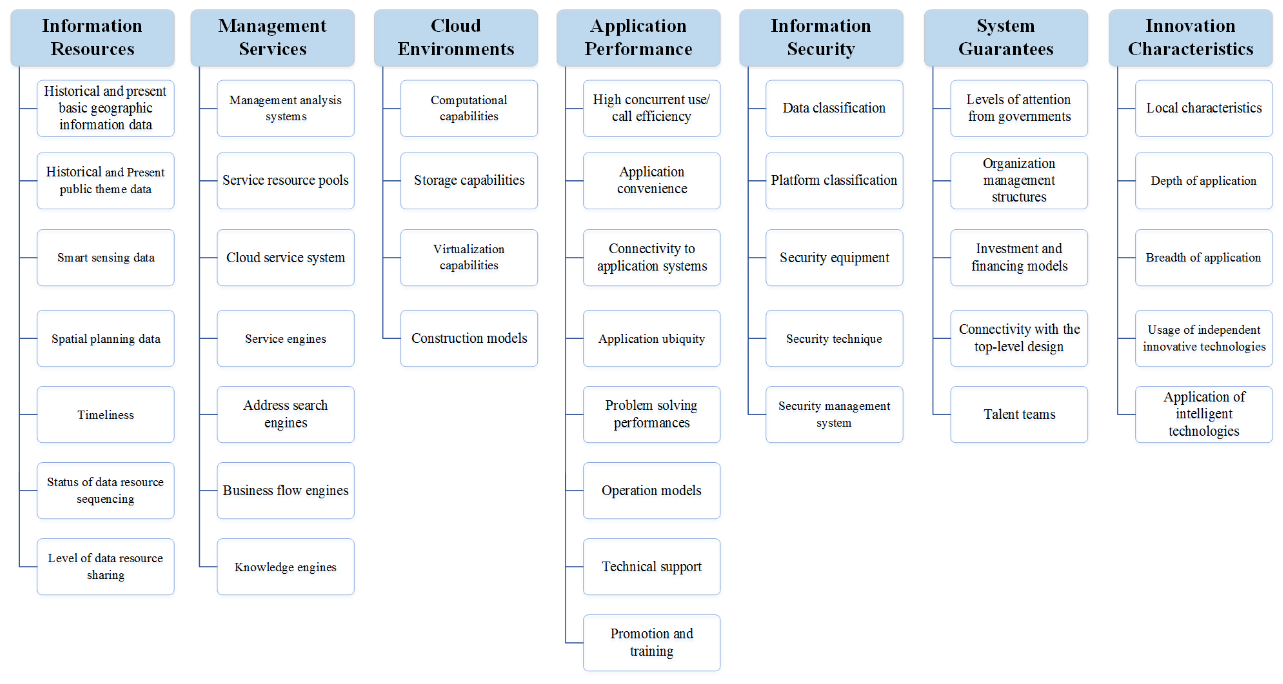
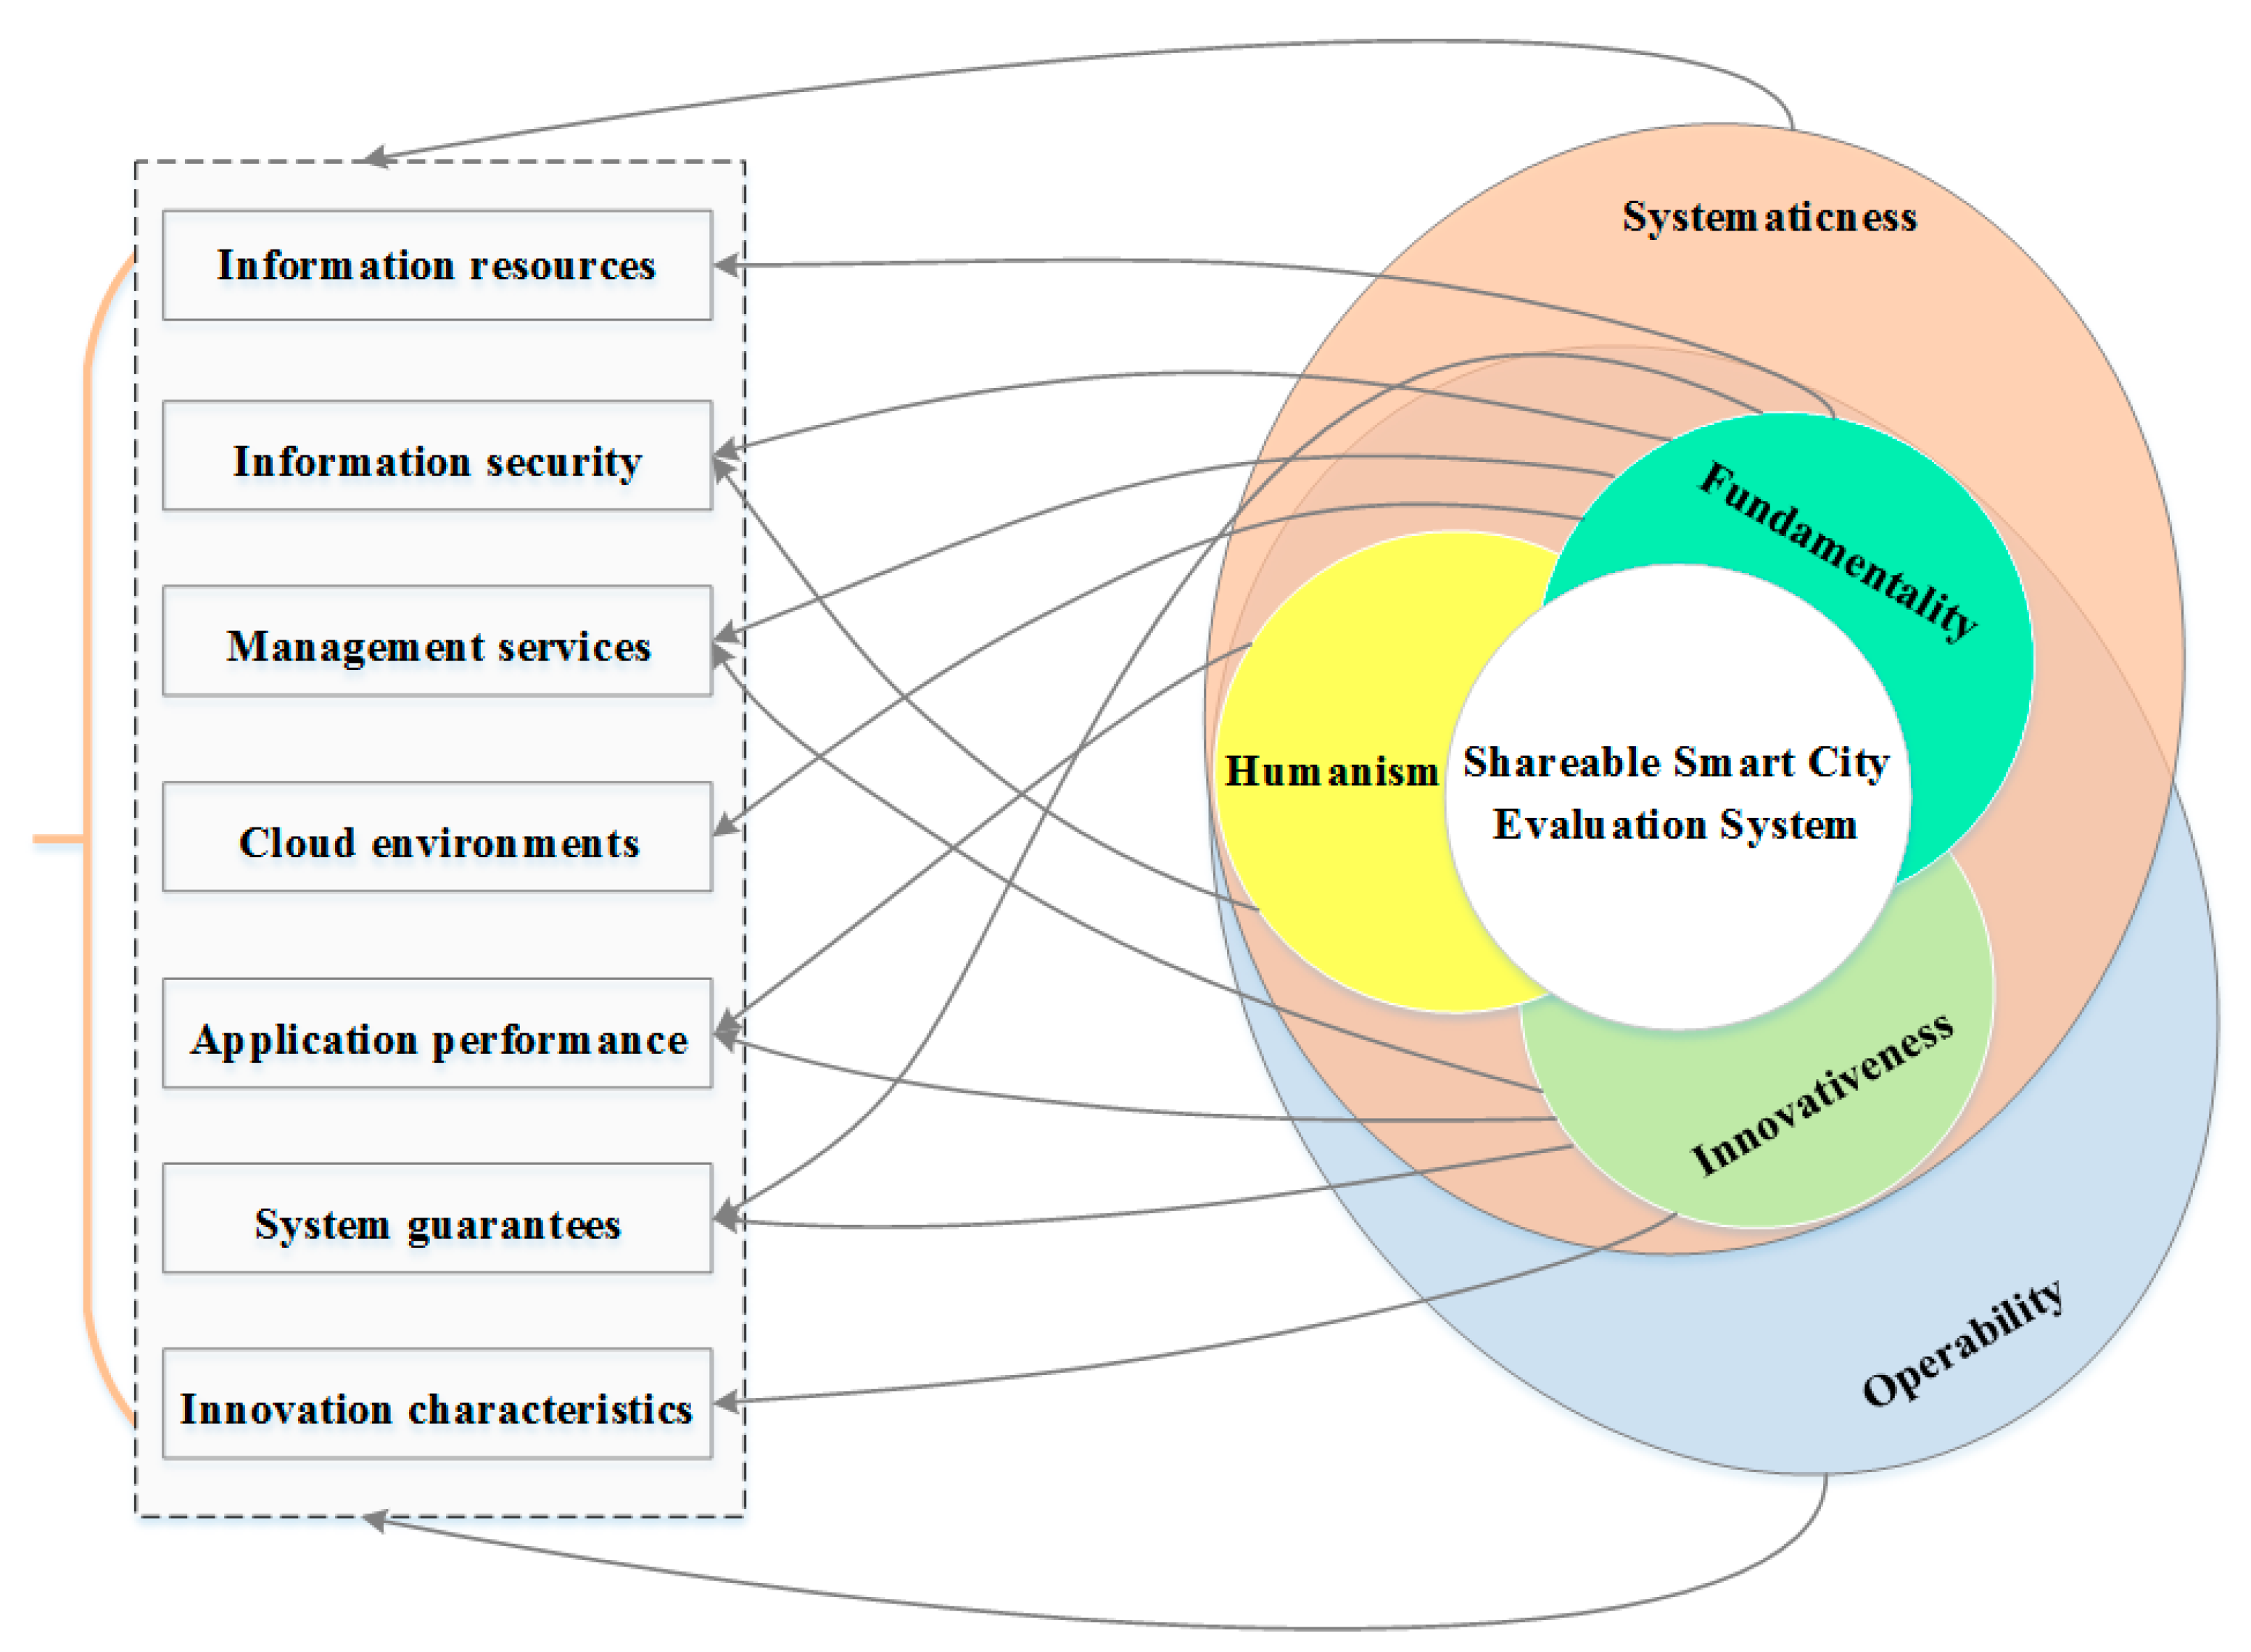
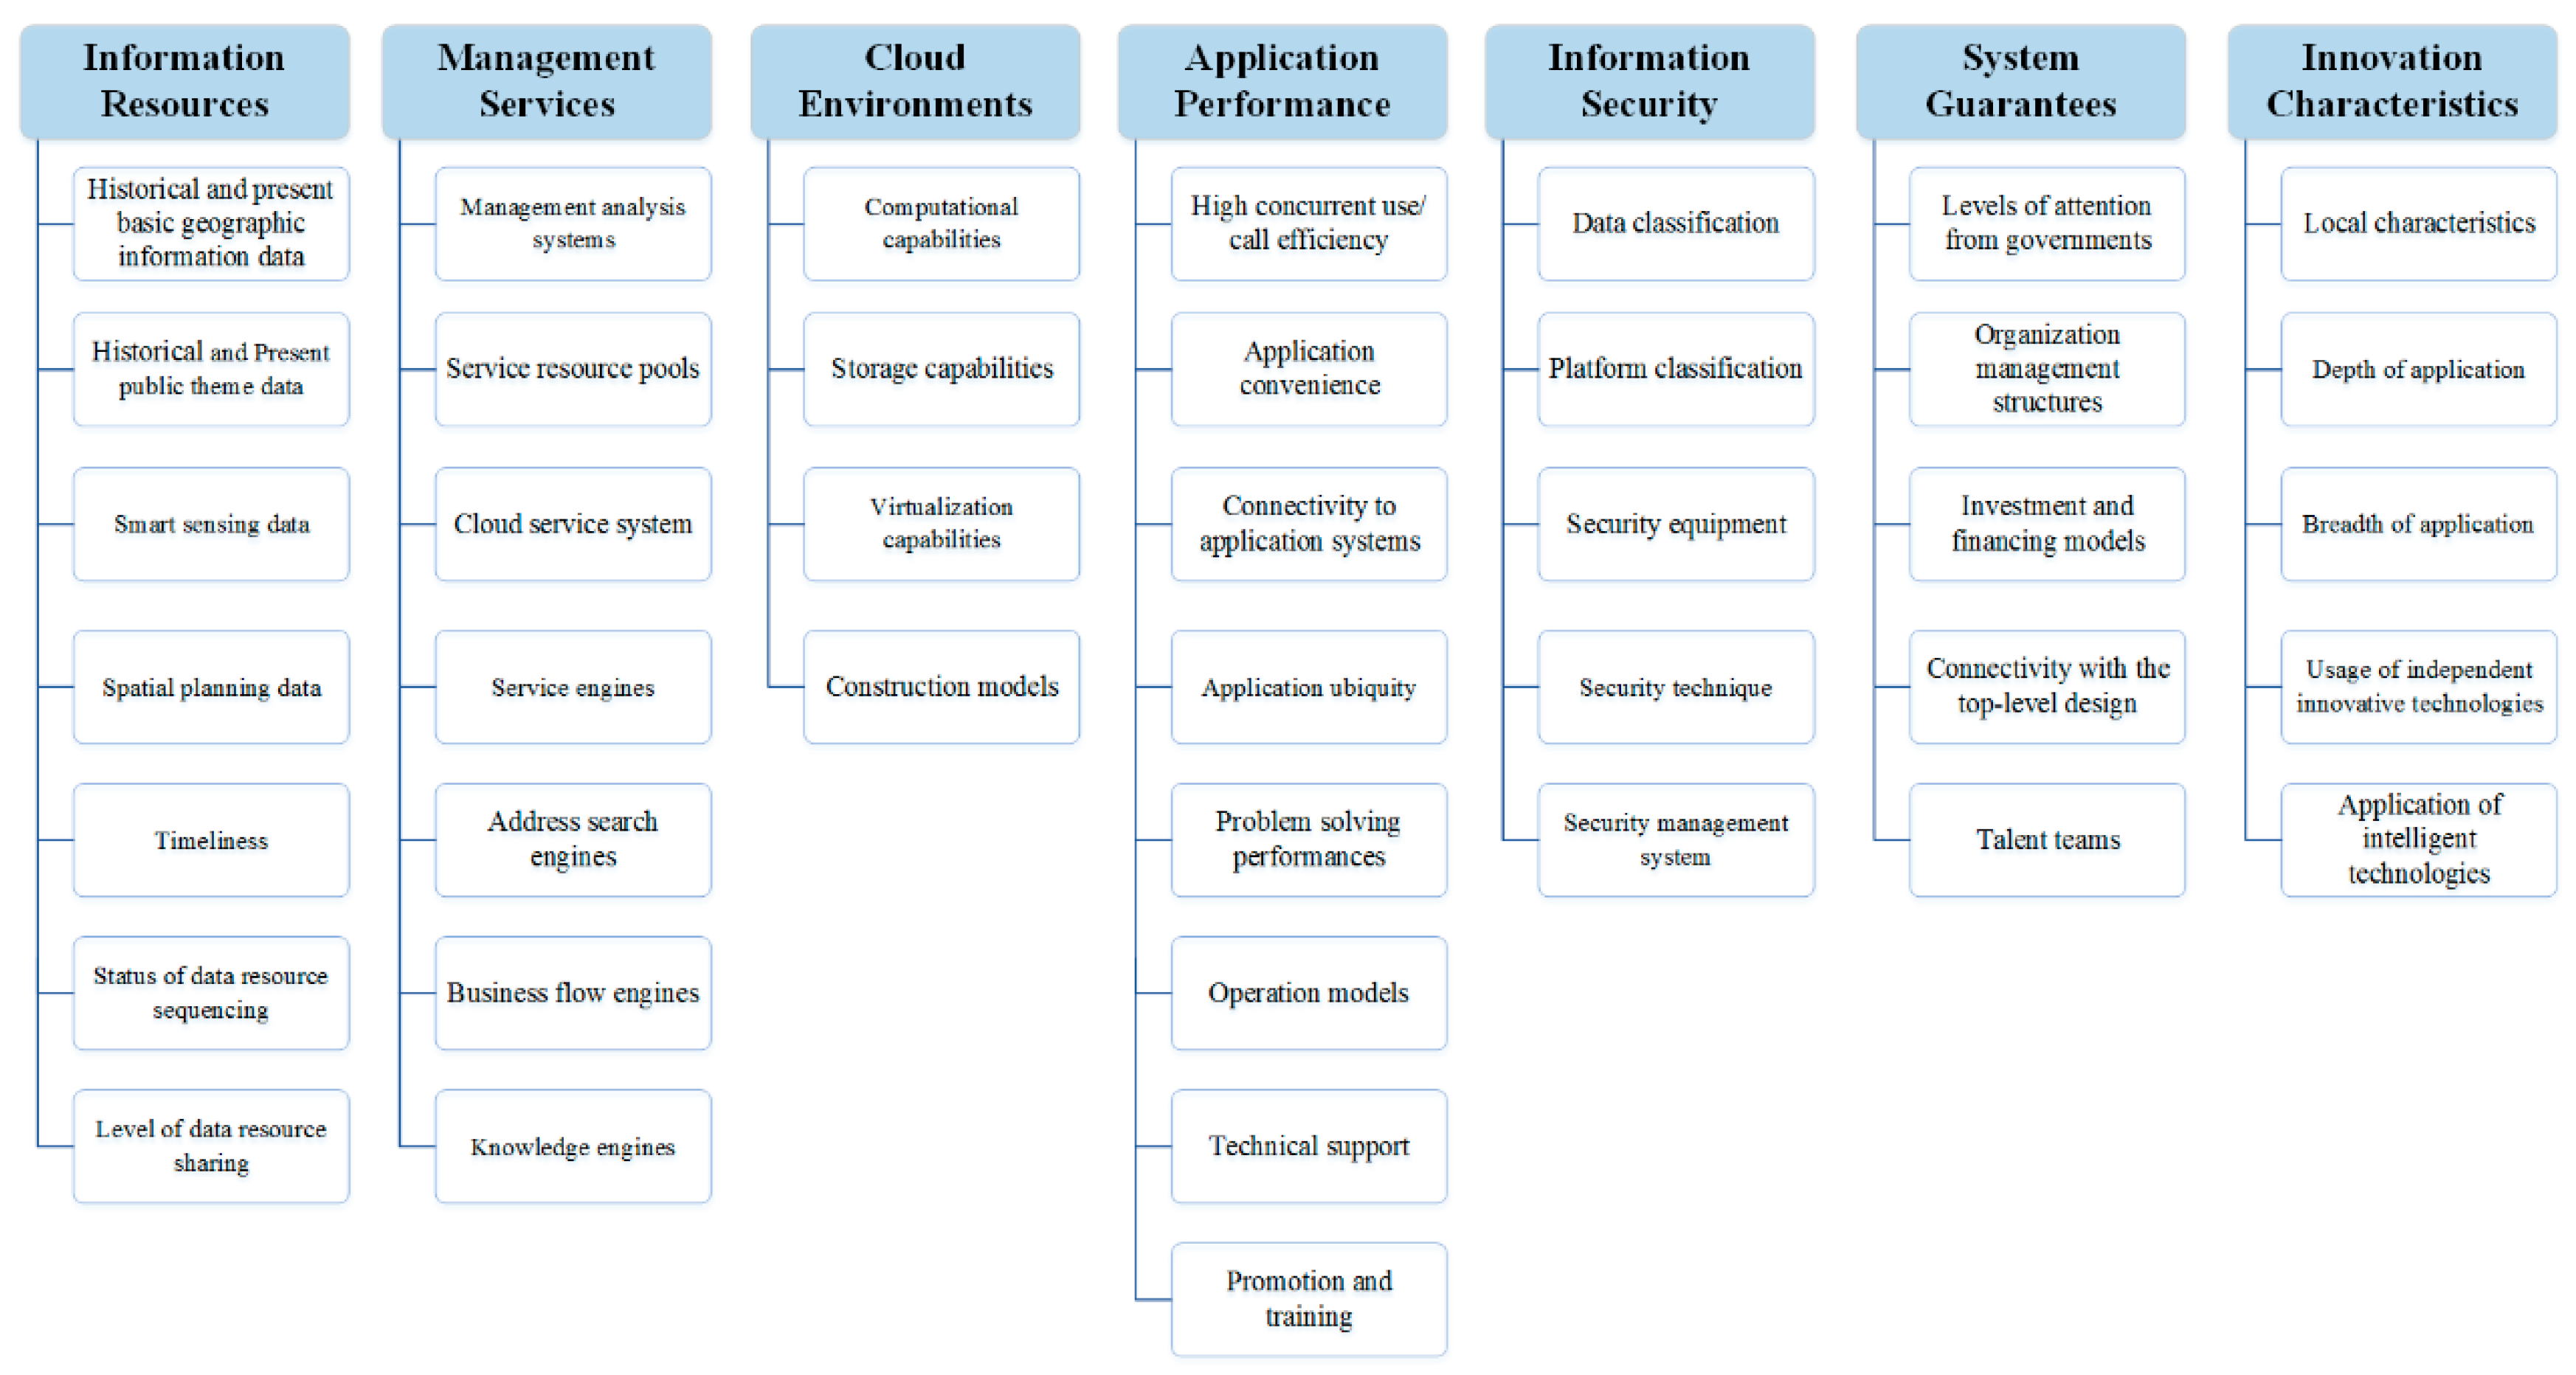
Based on the experience of leading the construction of 845 smart city or digital city platforms in China and writing 27 technical outlines and national standards, the core evaluation indicators with common characteristics in these cities were selected. Then, combing with the selection principle and the shared framework of smart city construction proposed by Li et al. (2019) [14], seven first-level indicators and 41 second-level evaluation indicators for smart city shareable framework were finally determined. Figure 1 illustrated the relationships between the principles of indicator selection and the primary indicators. The primary indicators are information resources, management services, cloud environments, application performance, information security, system guarantees, and innovation characteristics, which correspond to the elements in the smart city framework and cover four aspects: infrastructure, data, cloud systems, and applications. These indicators include not only objective indicators, such as real-time data, planning data, storage capacity, but also subjective indicators, such as the levels of attention from governments. The overall framework of the evaluation system is illustrated in Figure 2.
The indicators proposed in this paper can also be applied to other smart city frameworks or platform evaluation systems. Additionally, as the shareable smart city framework has been embedded in an important part of China’s new smart city construction, the proposed primary evaluation indicators can also be used as important indexes to evaluate the whole smart city construction. However, it is noteworthy that the evaluation system of this paper pays more attention to the evaluation of the sharable smart city framework [14]; therefore, the evaluation indicators in this paper mainly involved the elements of software and hardware infrastructure, temporal and spatial big data, cloud environment and application of the smart city, which are not all elements of a smart city. For instance, physical aspects of a city, such as buildings, streets, public transportation, and lamp-posts, as well as geographical elements, are not included in this paper. However, in the next stage of research, by combining the evaluation indicators of this paper, we will increase the evaluation indexes of some physical and geographical factors in smart cities, so as to realize the evaluation of the whole smart city construction.
The weights of these indicators are determined by rounding average values obtained from statistical surveys of 100 authoritative experts. Firstly, by calculating the average value of all scores given by 100 experts, scores of the top 20 experts that deviated from the average value were discarded; then by averaging the 80 remaining scores, the final weights of indicators were determined. The average of the standard deviations (SD) of weights is 0.926. It should be noted that in order to ensure the scientificity, reliability, and comprehensiveness of the expert scoring results, the 100 authoritative experts cover the fields of enterprise, government, and academia. Specifically, 35% of them are enterprise directors of smart city construction, 31 people are provincial smart city construction managers from 31 provinces in China, and the rest are researchers and technicians engaged in smart city research.
3.2.1. Information Resources
Information resources mainly refer to dynamic–static temporal and spatial data in the smart city framework and are basic data and essential fundamental guarantees for the unified construction of smart cities. The weight of information resources is 25%, and the descriptions and weights of the secondary indicators are as follows.
Historical and present basic geographic information data: this indicator refers to the basic geographic information data that reflect time characteristics such as historical periods and current situations (5%). Historical and present public thematic data: this refers to theme-specific data that reflect time characteristics such as historical periods and current situations and are strongly demanded by the public (5%). Smart sensing data: this indicator concerns real-time data with time indications, including at least basic geographic information data acquired in real time by using integrated space–air–ground sensory networks for ground observations (4%). Spatial planning data: this concerns data reflecting the planning of future spatial developments (3%). Timeliness: this indicator is measured by the present statuses of various data describing current situations and their update frequencies (3%). Status of data resource sequencing: this is determined by the temporal, spatial, and attribute consistencies among multiscale, multi-temporal, multi-type geographic entity data, image data, and three-dimensional models (2%). Level of data resource sharing: this is determined by the types and the amount of data that can be used in a government affairs network internally and are accessible by the public, after the data have been classified and processed in accordance with the relevant confidentiality policies (3%).
3.2.2. Management Services
Management services mainly concern the cloud platform in the sharable smart city framework, which are important in supporting smart city construction. Management service has a weight of 25%, and the descriptions and weights of the secondary indicators are provided below.
Management analysis systems: this indicator evaluates the effectiveness of integrated management analysis systems that are constructed to handle different data using both centralized physical storage and distributed storage (6%). Service resource pools: this indicator is determined by the collection and pooling of computational storage, data, interfaces, functions, and knowledge services involved in cloud platforms in cloud computing environments (3%). Cloud service systems: this indicator represents cloud centers that directly connect to users through the cloud service system to provide various types of platform services for different business applications (7%). Service engines: this indicator measures service engines that realize communications and transformations between services in a flexible manner; this type of connection is not associated with development environments and programming languages (3%). Address search engines: this indicator acts as a bridge between spatial information and other types of information and realizes the accurate positioning of big data in full spatial information models (2%). Business flow engines: according to the logic and rules, this indicator represents work in business processes by using suitable models and then implementing calculations to realize the automatic processing of these tasks (2%). Knowledge engines: this indicator measures the effectiveness of knowledge engines providing tools to analyze big data with different tomographic capabilities to facilitate deep mining of data (2%).
3.2.3. Cloud Environments
The cloud environment indicator basically evaluates infrastructure in the sharable smart city construction framework and represents a relevant software environment that ensures smooth and coordinated operations of various functions of a smart city. The cloud environment indicator is an important component for assessing the development level of a smart city. This indicator has a weight of 8%, and the descriptions and weights of the secondary indicators are explained as follows.
Computational capabilities: this indicator is measured by the available computational resources flexibly allocated to terminals by the cloud computing environments, in which spatiotemporal data and cloud platforms are present (2%). Storage capabilities: this is determined according to the available storage space flexibly allocated to terminals by cloud computing environments that support spatiotemporal data and cloud platforms (2%). Virtualization capabilities: this indicator assesses the capabilities to virtualize, intelligently manage, and flexibly allocate physical resources such as provided infrastructure, such as the CPU, internal memory, and network (2%). Construction models: this is determined according to whether platforms are built in government or department clouds (2%).
3.2.4. Application Performance
Application performance concerns the applications in the sharable smart city framework and is a direct reflection of the achievements of smart city construction. The weight of this indicator is 20%, and the secondary indicators are illustrated as follows.
High concurrent use/call efficiency: this is measured by the accuracy, average efficiency, and completeness of platform responses when there are high concurrent access requests by numerous users (4%). Application convenience: this refers to the convenience of using the platforms for users (3%). Connectivity to application systems: this refers to the platform’s ability to support the construction of professional application systems (3%). Application ubiquity: this is determined based on the abilities of the platforms to support different network environments, different operating systems, and different hardware devices (3%). Problem solving performance: this is measured by whether, after users have used the platforms, they can solve problems that could not be resolved previously, as well as the effectiveness of the solutions (2%). Operation models: this is determined according to the long-term operation models after platform construction (1%). Technical support: this is measured by the response rates and capabilities of the operation or maintenance teams to fulfill the needs of users after the platforms are complete and put into use (2%). Promotion and training: this is determined by the reports on the platforms by local media and the training provided to the platform users (2%).
3.2.5. Information Security
Information security mainly corresponds to data and platform security in the sharable smart city framework and comprises essential guarantees for secure construction. The weight of information security is 6%, and the associated secondary indicators are explained as follows.
Data classification: estimating whether the data comply with policies on security and confidentiality as well as security technologies and processing methods (for public use, for internal use, and for restricted use) (1.5%). Platform classification: evaluating whether, according to the sharing statuses of the data loaded on the platform, the platform includes public versions running on a public network, government affairs office versions running on an internal network, or basic versions running on a confidential network (1.5%). Security equipment: this indicator measures security equipment, including software and hardware as well as networks installed and used during the construction of spatiotemporal data and cloud platforms (0.5%). Security technique: this indicator concerns all kinds of security techniques and methods as well as disaster recovery methods (1.5%). Security management system: this concerns management systems, clear definitions of job responsibilities, security mechanisms and other management measures taken for the sake of security supervision (1%).
3.2.6. System Guarantees
System guarantees mainly correspond to policy standards and system security in the sharable smart city framework and are essential guarantees for legitimate construction. The weight of this indicator is 10%, and the associated secondary indicators are explained as follows.
Levels of attention from governments: this is measured based on whether the local governments have formulated relevant policies and long-term systems for infrastructure construction and operation during smart city evaluation (3%). Organization management structures: this assesses whether specific leadership teams, implementation teams, and promotion offices are established (1%). Investment and financing models: this indicator evaluates the capital investment and recovery methods during the construction and operation of cloud platforms (2%). Connectivity with the top-level design: this is measured by the connectivity between the temporal and spatial infrastructure and the top-level design of the smart city as well as the connectivity between functional themes (1%). Talent teams: this concerns technical teams for management, development, and services (3%).
3.2.7. Innovation Characteristics
Innovation characteristics mainly highlight areas where the city of interest is smarter than other cities. This indicator has a weight of 6%, and the descriptions and weights of the secondary indicators are provided as follows.
Local characteristics: this indicator evaluates whether smart city construction highlights local characteristics, such as investment and financing models and application demonstrations (2%). Depth of application: this is determined by the dependence of industry-specific applications on cloud platforms (1%). Breadth of application: this is measured by the number of industries having specific applications supported by cloud platforms (1%). Usage of independent innovative technologies: this is reflected by the proportions of domestic software and hardware as well as data collection equipment during platform construction, operation, and maintenance (1%). Application of intelligent technologies: this is measured by the depth and breadth of intelligent technology applications in processes such as the new generation of data collection and intelligent processing during platform construction, operation, and maintenance (1%).
3.3. Methods of Evaluation
After the indicators are determined, the actual statuses of the indicators are collected and processed through three methods: field surveys, questionnaire surveys, and third-party collection. For the field surveys, the indicators are acquired through the experts during the city’s achievement examination of smart construction. For the questionnaires surveys, the indicators are obtained through the self-scoring of each city by using the questionnaire. The third-party collection mainly obtains the policies for smart construction, residents’ awareness, and attention level of smart construction of a city through the network. After all the indicators are acquired, the Delphi method is used to evaluate and score the smart construction of the city through 100 authoritative experts, who are the same experts for indicator weights determination.
The comprehensive score for smart city construction is calculated according to Formula (1) as follows:
where i denotes the serial number of the secondary indicator, Wi is the weight of the i-th secondary indicator, and Si is the actual score for the i-th secondary indicator as a percentage. The value of E lies between 0 and 100 and can be used as a reference for comprehensive evaluation. When E ≥ 85, the comprehensive performance is outstanding. Good and acceptable performances are denoted by score ranges of 75 ≤ E < 85 and 60 ≤ E < 75, respectively.
4. Applications in China and Discussion
To validate the application of the proposed evaluation system, 17 smart cities with different characteristics in China were selected to conduct and compare smart city construction evaluations. The cities are Xuzhou, Taiyuan, Wuhan, Wuxi, Chongqing, Linyi, Zibo, Ningbo, Harbin, Liaocheng, Laohekou, Benxi, Weifang, Deqing, Xicheng, Nehe, and Deyang.
- (1)
- Analysis and comparison of smart development of different cities
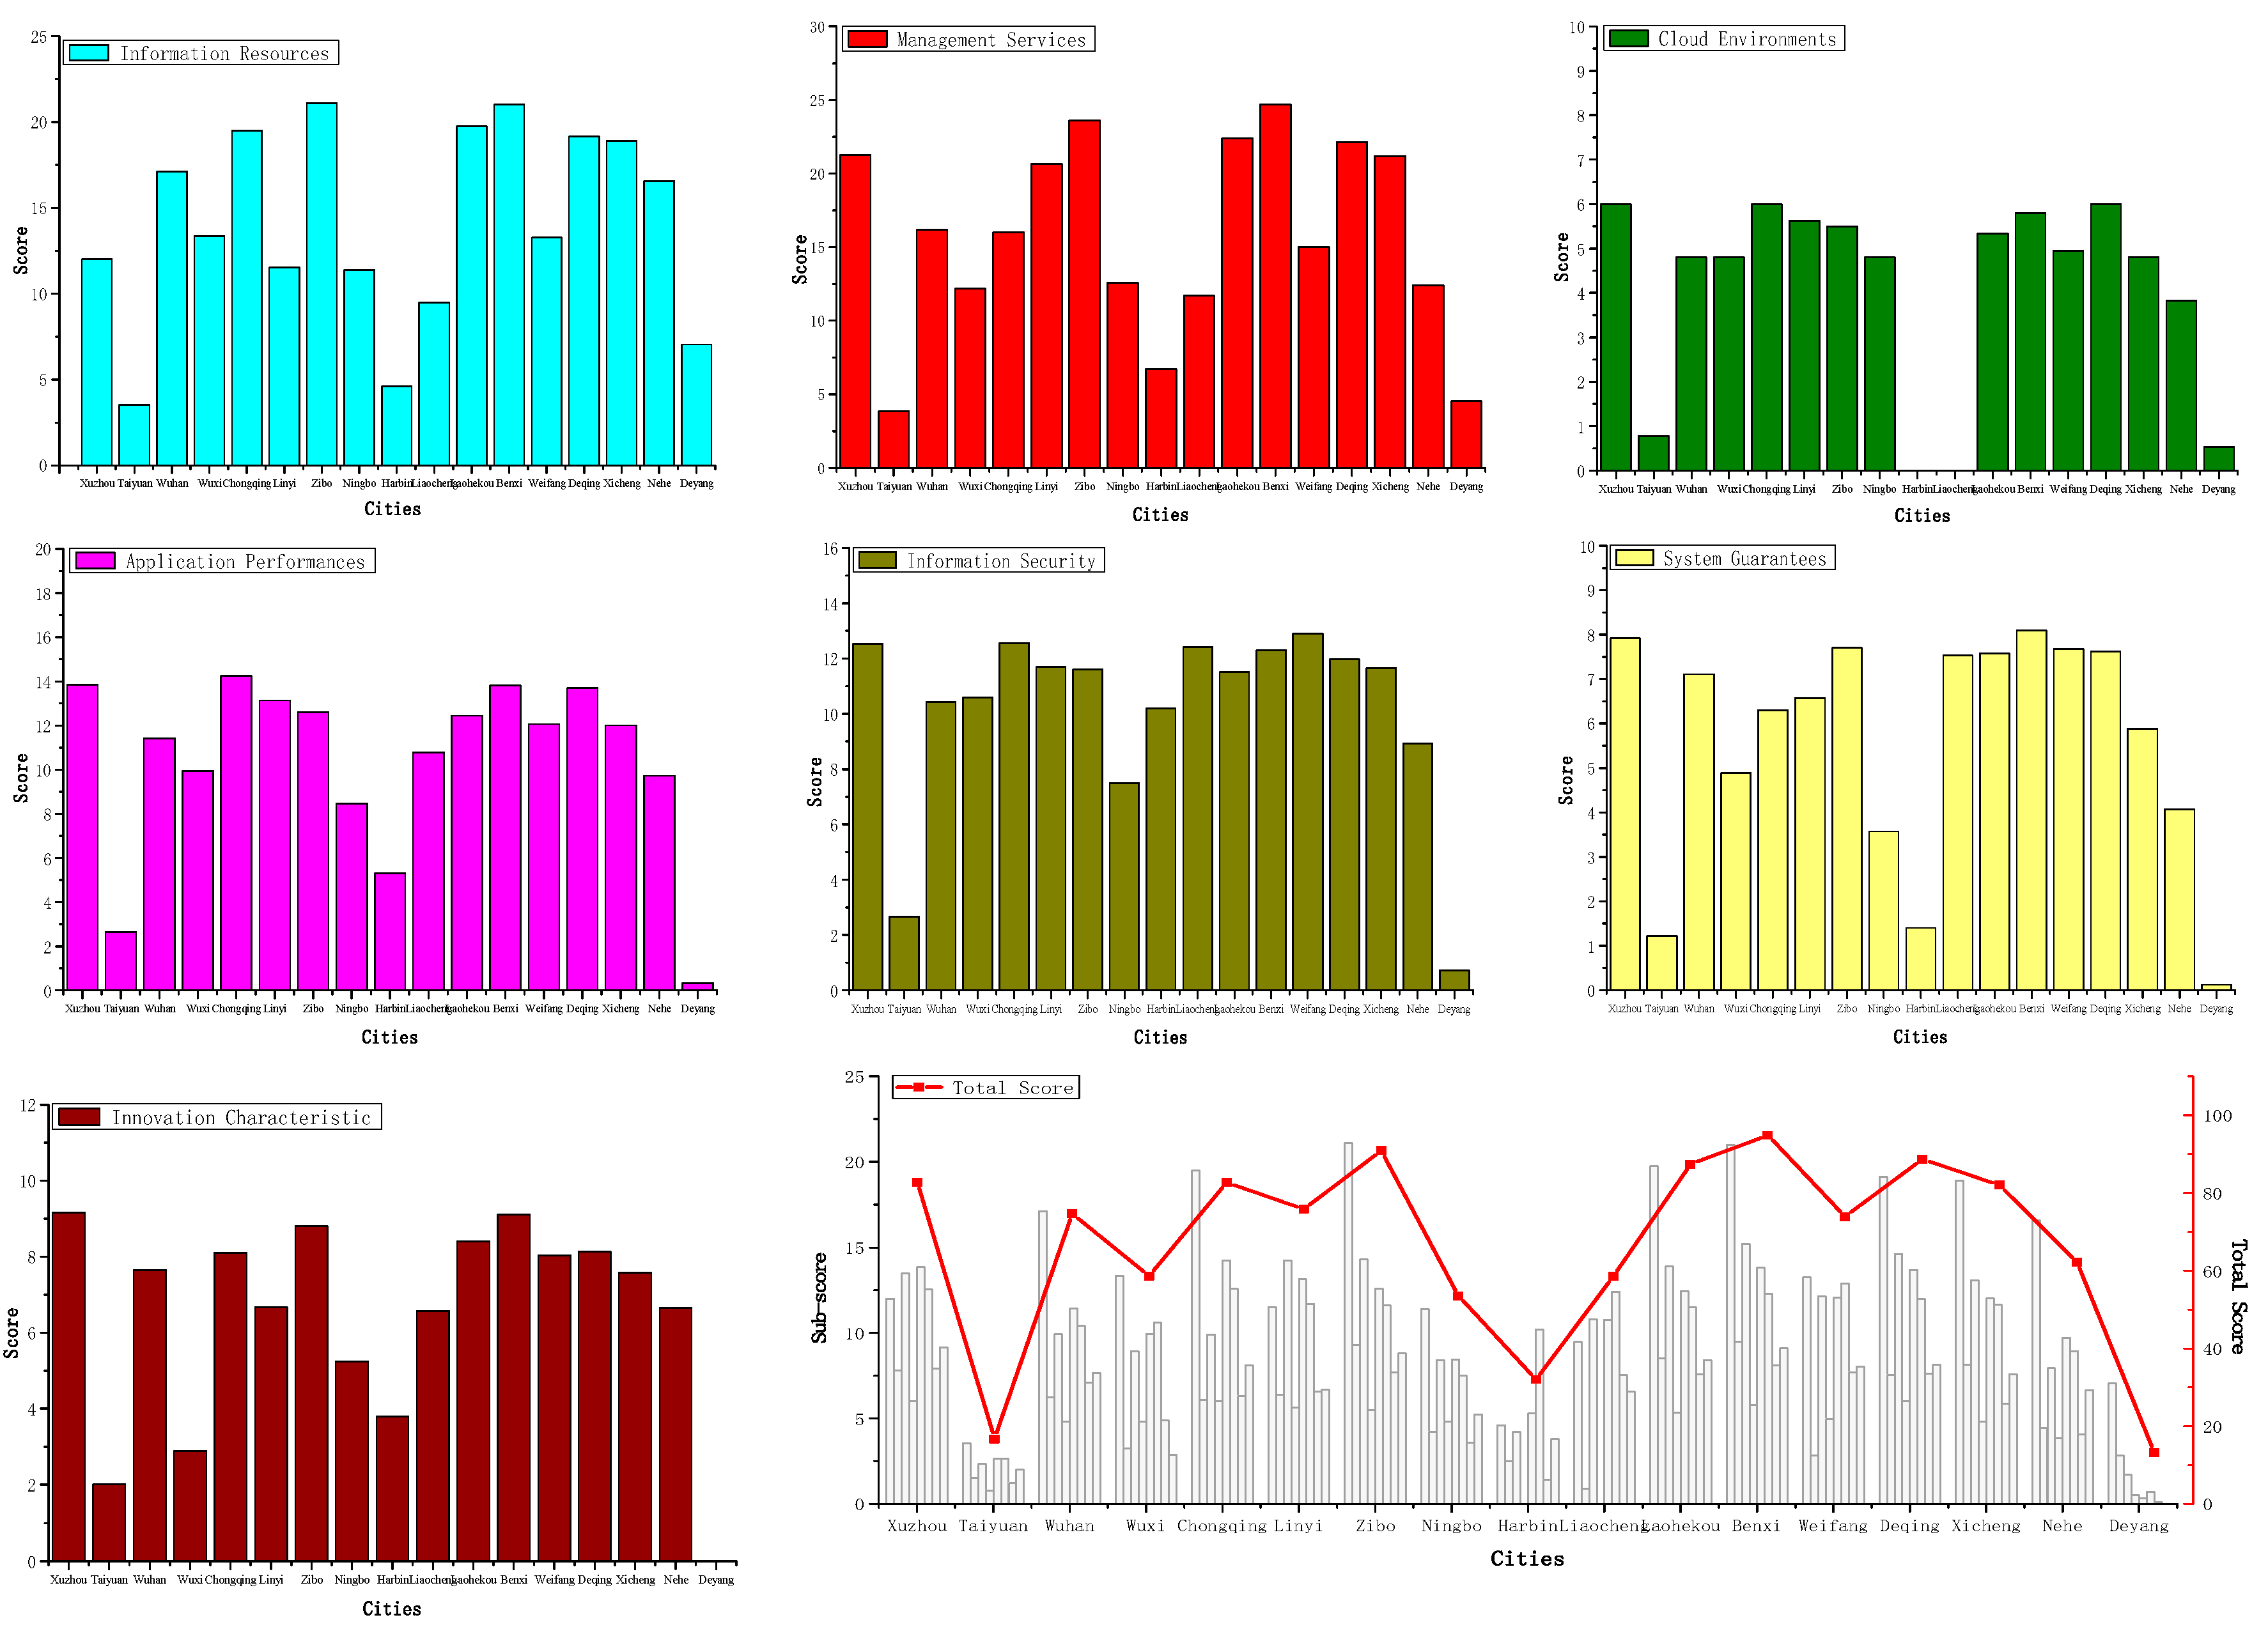
The indicator scores and comprehensive scores of the 17 smart cities clearly indicate the strengths and weaknesses of the cities in smart city construction. The standardized total scores and subscores of the cities are shown in Table 1 and Figure 3.
As shown in Table 1 and Figure 3, the average score of the 17 cities is 66.37. The highest score is 94.8, while the lowest is 13.26. Benxi, Zibo, and Deqing rank in the top three (their scores are 94.80, 90.90, and 88.68, respectively), while Deyang, Taiyuan, and Harbin rank in the bottom three.
In terms of information resources, Zibo, Benxi, and Chongqing have higher ranks. This indicates that these three cities have higher degrees of information resource integration and sharing. By contrast, Taiyuan, Harbin, and Denyang have lower degrees of information integration. For management services, the scores for spatiotemporal data and cloud platforms are similar to the total scores. Benxi, Zibo, and Deqing outperform the others, suggesting that they have better data, technology, and services. In terms of application performance, Chongqing has the highest score, which demonstrates that the city surpasses other cities in terms of application depth and breadth, technical support, and operation models. For system guarantees, better performance is noted in cities such as Benxi, Xuzhou, and Zibo. This finding reveals that these cities receive greater attention from the local governments regarding smart city construction and have better organization management structures. Finally, for innovation characteristics, Xuzhou has the highest score because of the significant depth of local theme-specific applications.
- (2)
- Analysis and comparisons of sub-indicators
To better examine the existing problems in current smart city construction in China, this paper analyzes the average scores of the seven primary indicators and the standard deviation coefficients of all sub-indicators in the proposed system. The results are illustrated in Table 2 and Figure 4. Smaller standard deviation coefficients indicate that the scores deviate less from the standard scores.
Table 2 and Figure 4 show that the indicators having scores closest to the standard values are integration and sharing and information security. This finding indicates that during smart city construction, the degree of sharing of information resources and the security measures in the process of cloud platform construction are better.
The indicators exhibiting the greatest score deviations from the standard values are dynamic information and spatiotemporal data. In particular, first, dynamic information includes real-time position information, position information of sensory equipment, real-time sensory abstract information, historical data, and long-shot data that are not involved in past digital city construction. Hence, the construction involving these data is harder, leading to low scores in general. However, as ICT develop, real-time acquisition of dynamic information has become a focus and hotspot in the construction of new smart city types. This aspect deserves more attention in future smart city construction. Second, temporal and spatial big data also bring difficulties to smart city construction. Not only the data and functions of the original basic geographic information databases but also new items, such as capabilities to manage and collect dynamic and static information, allow automatic generalization of maps, analyze big data, and provide data services, are needed. These are areas in which smart cities have to develop and improve. Similarly, there is an insufficient foundation for construction, so it is not an easy task.
For the other sub-indicators, including application performance, system guarantees, and innovation characteristics, their deviations from the standard values are similar and relatively small. This finding suggests that there is a certain foundation during construction, and the construction progress and measures taken are under good control. Application performance is mainly reflected by the depth and breadth of platform applications, technical support, problem solving performance, and operation models. Its scores suggest that during the pilot construction of smart cities, all cities pay attention to the capabilities of platforms to provide services and actually help solve problems for various departments. Additionally, system guarantees focus on the levels of attention from governments, organization management structures, talent team training, and connectivity with the top-level design. The results of this indicator reveal that, in all cities, pilot construction has been greatly supported by government departments, and there are guarantees for talent, systems, and teams. However, it should be noted that the scores for the secondary indicator “investment and financing models” under “system guarantees” show two extremes. This finding suggests that some cities still lack investment and financing models, and these cities have to proactively explore various possibilities during construction and look for diversified investment and financing methods. Moreover, innovation characteristics mainly reflect local characteristics, the usage of domestic technologies, the degree of intelligent technology application, and the depth and breadth of theme-specific applications. The score results show that during pilot construction, all cities focus on expansion and demonstration of applications to provide different departments with services based on temporal and spatial information resources. In addition, these cities support domestic technologies and proactively try to use intelligent technologies and methods. The construction processes exhibit local characteristics, giving rise to a variety of unique smart cities.
- (3)
- Reliability and sensitivity of the evaluation system
Based on the proposed evaluation system, the smart city platform system constructions in China are evaluated. The evaluation score can basically reflect the construction level of a smart city. To verify the reliability of the evaluation results in this paper, some cities with high scores were compared with their actual development situation. For the cities with high scores, such as Deqing, Benxi, etc., they are basically consistent with the excellent cities selected by the Ministry of Natural Resources in China, which partly proves the reliability of the evaluation system for smart city development evaluation.
The evaluation system plays an important role in guiding the horizontal and vertical comparison of smart city construction, suggesting the sensitivity of the evaluation system. This evaluation system has a high sensitivity in the vertical comparison of the city, and a modest sensitivity in the horizontal comparison. Specifically, in terms of horizontal comparison among cities, evaluation scores can be used to divide levels for smart city construction (such as good, medium, and poor), which is of great practical significance to find the gap between cities and establish benchmarks among smart cities. In the aspect of the vertical comparison of a city, the evaluation system can judge the intelligence development state of this city with high sensitivity by score recording. No matter how little the score changes, it means different development trends. For instance, even a small difference in the overall score or small difference in a certain index in a different period indicate the development trend of this index, which is particularly significant for the smart development and planning of a city.
- (4)
- Suggestions for the future
Future smart city construction in China should proactively seek innovation. More efforts should be made to construct dynamic information resources and spatiotemporal data. For example, new technologies and methods such as the IoT, mobile applications, and immersive 3D should be improved, and the levels of local smart city construction should be enhanced. Furthermore, during smart city construction, the depth of platform applications should be increased, and the depth and breadth of product applications should be enhanced. Different application directions in dynamic information and intelligent technology applications should be explored so that these applications can better and more greatly improve decision making by governments, department management, and the livelihoods of people.
In future research, the evaluation system proposed in this paper will evolve continuously. For instance, we will integrate the evaluation indexes of human needs and human capabilities factors, so as to improve the evaluation of the interaction between the human capabilities and technology systems and realize the evaluation of the whole smart city construction comprehensively. It should be noted that although this evaluation system has been adopted in China’s new smart city construction evaluation, the results should not be used as a performance evaluation and a finalized measure ready for widespread application, but as a technical guide to promote the construction of a common smart city platform.
5. Conclusions
As an increasing number of smart cities are being developed, it is particularly important to know how to evaluate their construction levels. This paper, based on a shareable smart city framework, proposes a well-integrated, universal, and highly practical common evaluation system. The investigation of the proposed system is of key significance to understand the actual construction situations of different smart cities with respect to the same standard. The main conclusions include: (1) Based on theoretical analyses of a common and shareable smart city framework, this paper summarizes principles in selecting indicators for smart city evaluation systems. A common, systematic, scalable, and highly practical smart city evaluation system is then proposed, including seven primary indicators and 41 secondary indicators. The system covers four aspects: infrastructure, data, cloud systems, and applications; (2) Using the proposed common evaluation system, 17 smart cities with various scales in China were evaluated. The evaluation results demonstrate that the proposed system facilitates the understanding of the actual construction situations of different smart cities in China with respect to the same standard, horizontal comparisons between cities, discovery of their differences, and establishment of benchmarks. From the overall rankings of different cities and their rankings based on sub-indicators, Benxi, Zibo, and Deqing show the most satisfactory construction, while the smart city construction in Deyang, Taiyuan, and Harbin lags behind.
Based on a common and shareable smart city framework, this paper studies a corresponding smart city evaluation system, which can also be applied to other smart city framework or platform evaluations in China. The proposed system is significant for understanding the actual construction situations of different smart cities in China. However, due to that, the evaluation system of this paper pays more attention to the evaluation for the sharable smart city framework [14] and smart city technology systems construction, which may have a weakness for evaluating the interactions between the human capabilities and technology systems. Therefore, in future research, we will integrate the evaluation indexes of some human needs factors, human capabilities, and physical and geographical features, so as to improve the smart city evaluation and realize the evaluation of the whole smart city construction. As different technologies and data emerge, more emphasis will be placed on updating and improving the evaluation system to ensure more optimized and reasonable smart city planning, design, and construction. Moreover, in the future, the proposed system should be applied for the evaluation of more cities to make the system more practical and to understand the actual construction situations of different smart cities in China with respect to the same standard.
Author Contributions
C.L. conceived the original idea for the study, and all coauthors conceived and designed the methodology; Z.D., X.L., and W.S. conducted the processing and analysis of the data; C.L., Z.D. and X.L. drafted the manuscript. All authors have read and agree to the published version of the manuscript.
Funding
This research was funded by the National Natural Science Foundation of China under grant number 41871375, the National basic surveying and mapping project of China (A2003).
Conflicts of Interest
The authors declare no conflict of interest.
References
- Neirotti, P.; De Marco, A.; Cagliano, A.C.; Mangano, G.; Scorrano, F. Current trends in Smart City initiatives: Some stylised facts. Cities 2014, 38, 25–36. [Google Scholar] [CrossRef] [Green Version]
- Anthopoulos, L.G. Understanding the Smart City Domain: A Literature Review. Transforming City Governments for Successful Smart Cities; Springer International Publishing: Cham, Switzerland, 2015. [Google Scholar]
- Walravens, N.; Ballon, P. Platform business models for smart cities: from control and value to governance and public value. IEEE Commun. Mag. 2013, 51, 72–79. [Google Scholar] [CrossRef]
- Caragliu, A.; DelBo, C.; Kourtit, K.; Nijkamp, P. Comparative performance assessment of Smart Cities around the North Sea basin. Netw. Ind. Q. 2011, 13, 15–17. [Google Scholar]
- Giffinger, R.; Haindlmaier, G. Smart cities ranking: An effective instrument for the positioning of cities? Archit. City Environ. 2010, 4, 7–26. [Google Scholar]
- Walravens, N. Mobile Business and the Smart City: Developing a Business Model Framework to Include Public Design Parameters for Mobile City Services. J. Theor. Appl. Electron. Commer. Res. 2012, 7, 121–135. [Google Scholar] [CrossRef] [Green Version]
- Giffinger, R.; Haindlmaier, G.; Kramar, H. The role of rankings in growing city competition. Urban Res. Pr. 2010, 3, 299–312. [Google Scholar] [CrossRef]
- Díaz-Díaz, R.; Muñoz, L.; Pérez-González, D. The Business Model Evaluation Tool for Smart Cities: Application to SmartSantander Use Cases. Energies 2017, 10, 262. [Google Scholar] [CrossRef] [Green Version]
- Dirks, S.; Keeling, M.; Dencik, J. How Smart is Your City? Helping Cities Measure Progress; IBM Institute for Business Value: Somers, NY, USA, 2009. [Google Scholar]
- Deng, X. Study on the evaluation system of Smart City. Dev. Res. 2010, 12, 111–116. [Google Scholar]
- Branchi, P.E.; Fernandez-Valdivielso, C.; Matias, I.R. Analysis Matrix for Smart Cities. Futur. Internet 2014, 6, 61–75. [Google Scholar] [CrossRef]
- Branchi, P.E.; Fernandez-Valdivielso, C.; Matias, I.R. Methodology to define a technology assessment tool for smart-cities. Soc. Change Dev. 2015, 90, 285–293. [Google Scholar]
- Branchi, P.E.; Fernandez-Valdivielso, C.; Matias, I.R. An Analysis Matrix for the Assessment of Smart City Technologies: Main Results of Its Application. Systems 2017, 5, 8. [Google Scholar] [CrossRef]
- Li, C.; Liu, X.; Dai, Z.; Zhao, Z. Smart City: A Shareable Framework and Its Applications in China. Sustainability 2019, 11, 4346. [Google Scholar] [CrossRef] [Green Version]
- Belissent, J. Getting Clever About Smart Cities: New Opportunities Require New Business Models; Forrester Research Inc.: Cambridge, MA, USA, 2010. [Google Scholar]
- Jin, J.; Gubbi, J.; Marusic, S.; Palaniswami, M. An Information Framework for Creating a Smart City Through Internet of Things. IEEE Internet Things J. 2014, 1, 112–121. [Google Scholar] [CrossRef]
- Mitton, N.; Papavassiliou, S.; Puliafito, A.; Trivedi, K.S. Combining Cloud and sensors in a smart city environment. EURASIP J. Wirel. Commun. Netw. 2012, 2012, 247. [Google Scholar] [CrossRef] [Green Version]
- Peris-Ortiz, M.; Bennett, D.R.; Yábar, D.P.-B. Sustainable Smart Cities: Creating Spaces for Technological, Social and Business Development; Springer: Berlin/Heidelberg, Germany, 2016; ISBN 9783319408958. [Google Scholar]
- Su, K.; Li, J.; Fu, H. Smart city and the applications. In Proceedings of the 2011 International Conference on Electronics, Communications and Control (ICECC); Institute of Electrical and Electronics Engineers (IEEE), Ningbo, China, 9–11 September 2011; pp. 1028–1031. [Google Scholar]
- Li, X.; Deng, X. Research on smart city evaluation index systems [in Chinese]. Telecommun. Technol. 2011, 10, 61–67. [Google Scholar]
- Yin, C.; Xiong, Z.; Chen, H.; Wang, J.; Cooper, D.; David, B. A literature survey on smart cities. Sci. China Inf. Sci. 2015, 58, 1–18. [Google Scholar] [CrossRef]
- Al Nuaimi, E.; Al Neyadi, H.; Mohamed, N.; Al-Jaroodi, J. Applications of big data to smart cities. J. Internet Serv. Appl. 2015, 6, 1. [Google Scholar] [CrossRef] [Green Version]
- Dawkins, R. What is an intelligent Community. Intell. Community Forum 2006, 115–119. [Google Scholar]
- Kominos, N. Intelligent Cities and Globalization of Innovation Networks; Routledge: London, UK, 2009; pp. 77–79. [Google Scholar]
- Kominos, N. Intelligent cities: towards interactive and global innovation environments. Int. J. Innov. Reg. Dev. 2009, 1, 337–355. [Google Scholar] [CrossRef]
- Giffinger, R.; Fertner, C.; Kramar, H.; Kalasek, R.; Milanović, N.P.; Meijers, E. Smart Cities-Ranking of European Mediumsized Cities; Vienna University of Technology: Vienna, Austria, 2007. [Google Scholar]
- Caragliu, A.; Chiara, D.; Perter, N. Smart Cities in Europe. 3rd Central European Conference in Regional Science. J. Urban Technol. 2009, 18, 45–59. [Google Scholar]
- Cohen, B.; Muñoz, P. Toward a Theory of Purpose-Driven Urban Entrepreneurship. Organ. Environ. 2015, 28, 264–285. [Google Scholar] [CrossRef]
- Ernst & Young Global Limited. Rapporto Smart City Index 2016. Available online: http://www.ey.com/Publication/vwLUAssetsPI/EY-smart-city-index-2016/$FILE/2016-EY-smart-city-index.pdf/ (accessed on 13 January 2017).
- Dall’O’, G.; Bruni, E.; Panza, A.; Sarto, L.; Khayatian, F. Evaluation of cities’ smartness by means of indicators for small and medium cities and communities: A methodology for Northern Italy. Sustain. Cities Soc. 2017, 34, 193–202. [Google Scholar] [CrossRef]
- Li, X.Y.; Deng, X.F. Study on the evaluation system of Smart City. Telecommun. Netw. Technol. 2011, 10, 61–67. [Google Scholar]
- Gu, D.D.; Qiao, W. Study on the Construction of Evaluation Index System of China’s Smart City. Future Dev. 2012, 12, 74–78. [Google Scholar]
- Malek, J. Informative Global Community Development Index of Informative Smart City. In Proceedings of the 8th WSEAS International Conference on Education and Educational Techonology, Genova, Italy, 17–19 October 2009; pp. 32–48. [Google Scholar]
- Ahvenniemi, H.; Huovila, A.; Pinto-Seppä, I.; Airaksinen, M. What are the differences between sustainable and smart cities? Cities 2017, 60, 234–245. [Google Scholar] [CrossRef]
- Yuan, Y.; Liu, T. Evaluation Model and Indicator System of Informationization Applications and Services in Smart Cities. In Proceedings of the 2014 International Conference on Intelligent Environments, Institute of Electrical and Electronics Engineers (IEEE), Dublin, Ireland, 8–11 June 2014; pp. 95–101. [Google Scholar]
Figure 1.
Principles of indicator selection for the proposed smart city evaluation system and their correspondence relationships with primary indicators.
Figure 1.
Principles of indicator selection for the proposed smart city evaluation system and their correspondence relationships with primary indicators.

Figure 2.
Overall framework of the proposed common smart city evaluation system.

Figure 3.
Evaluation scores of different smart cities. (Note: the order of the seven primary indicators in the bottom right panel is information resources, management services, cloud environments, application performance, information security, system guarantees, and innovation characteristics)
Figure 3.
Evaluation scores of different smart cities. (Note: the order of the seven primary indicators in the bottom right panel is information resources, management services, cloud environments, application performance, information security, system guarantees, and innovation characteristics)

Figure 4.
Scores of various sub-indicators.


Table 1.
Evaluation scores of different smart cities.
| Primary Indicators | Information Resources | Management Services | Cloud Environments | Application Performance | Information Security | System Guarantees | Innovation Characteristics | Total | |||
|---|---|---|---|---|---|---|---|---|---|---|---|
| Secondary Indicators | Dynamic Information | Static Information | Integration and Sharing | Spatiotemporal Data | Cloud Platforms | Cloud Environments | Application Performance | Information Security | System Guarantees | Innovation Characteristics | |
| S-score | 10.20 | 7.80 | 4.80 | 10.50 | 16.20 | 6.00 | 14.70 | 12.90 | 8.40 | 9.60 | |
| Xuzhou | 4.56 | 2.82 | 4.62 | 7.80 | 13.47 | 6.00 | 13.85 | 12.54 | 7.92 | 9.15 | 82.73 |
| Taiyuan | 1.52 | 1.31 | 0.71 | 1.52 | 2.33 | 0.78 | 2.64 | 2.66 | 1.22 | 2.00 | 16.69 |
| Wuhan | 6.90 | 6.59 | 3.63 | 6.24 | 9.93 | 4.80 | 11.42 | 10.43 | 7.11 | 7.65 | 74.69 |
| Wuxi | 5.28 | 4.11 | 3.96 | 3.24 | 8.94 | 4.80 | 9.93 | 10.59 | 4.89 | 2.88 | 58.62 |
| Chongqing | 9.06 | 6.20 | 4.23 | 6.09 | 9.90 | 6.00 | 14.24 | 12.57 | 6.30 | 8.10 | 82.68 |
| Linyi | 1.89 | 5.13 | 4.50 | 6.39 | 14.25 | 5.63 | 13.14 | 11.70 | 6.57 | 6.66 | 75.85 |
| Zibo | 9.60 | 7.00 | 4.50 | 9.30 | 14.30 | 5.50 | 12.60 | 11.60 | 7.70 | 8.80 | 90.90 |
| Ningbo | 4.97 | 3.80 | 2.61 | 4.20 | 8.40 | 4.80 | 8.45 | 7.50 | 3.57 | 5.24 | 53.52 |
| Harbin | 3.00 | 0.70 | 0.90 | 2.50 | 4.20 | 0.00 | 5.30 | 10.20 | 1.40 | 3.80 | 32.00 |
| Liaocheng | 2.16 | 2.88 | 4.44 | 0.90 | 10.80 | 0.00 | 10.77 | 12.42 | 7.53 | 6.57 | 58.47 |
| Laohekou | 8.46 | 6.96 | 4.32 | 8.51 | 13.88 | 5.33 | 12.44 | 11.51 | 7.58 | 8.40 | 87.36 |
| Benxi | 9.50 | 7.20 | 4.30 | 9.50 | 15.20 | 5.80 | 13.80 | 12.30 | 8.10 | 9.10 | 94.80 |
| Weifang | 2.82 | 6.24 | 4.20 | 2.85 | 12.15 | 4.95 | 12.06 | 12.90 | 7.68 | 8.04 | 73.89 |
| Deqing | 8.10 | 6.57 | 4.47 | 7.53 | 14.61 | 6.00 | 13.68 | 11.97 | 7.62 | 8.13 | 88.68 |
| Xicheng | 7.67 | 6.93 | 4.31 | 8.12 | 13.08 | 4.80 | 12.01 | 11.66 | 5.88 | 7.58 | 82.01 |
| Nehe | 6.92 | 5.91 | 3.74 | 4.46 | 7.95 | 3.83 | 9.72 | 8.93 | 4.07 | 6.65 | 62.15 |
| Deyang | 1.08 | 2.61 | 3.36 | 2.82 | 1.71 | 0.53 | 0.32 | 0.72 | 0.12 | 0.00 | 13.26 |
Table 2.
Scores of various sub-indicators.
| Primary Indicator | Secondary Indicator | Standard Score | Average Score | Standard Deviation Coefficient |
|---|---|---|---|---|
| Information resources | Dynamic information | 10.2 | 5.499 | 0.21 |
| Static information | 7.8 | 4.879 | 0.14 | |
| Integration and sharing | 4.8 | 3.693 | 0.05 | |
| Management services | Spatiotemporal data | 10.5 | 5.409 | 0.24 |
| Cloud platforms | 16.2 | 10.300 | 0.13 | |
| Cloud environments | Cloud environments | 6 | 4.090 | 0.10 |
| Application performance | Application performance | 14.7 | 10.373 | 0.09 |
| Information security | Information security | 12.9 | 10.128 | 0.05 |
| System guarantees | System guarantees | 8.4 | 5.603 | 0.11 |
| Innovation characteristics | Innovation characteristics | 9.6 | 6.396 | 0.11 |
© 2020 by the authors. Licensee MDPI, Basel, Switzerland. This article is an open access article distributed under the terms and conditions of the Creative Commons Attribution (CC BY) license (http://creativecommons.org/licenses/by/4.0/).
Share and Cite
MDPI and ACS Style
Li, C.; Dai, Z.; Liu, X.; Sun, W. Evaluation System: Evaluation of Smart City Shareable Framework and Its Applications in China. Sustainability 2020, 12, 2957. https://0-doi-org.brum.beds.ac.uk/10.3390/su12072957
AMA Style
Li C, Dai Z, Liu X, Sun W. Evaluation System: Evaluation of Smart City Shareable Framework and Its Applications in China. Sustainability. 2020; 12(7):2957. https://0-doi-org.brum.beds.ac.uk/10.3390/su12072957
Chicago/Turabian StyleLi, Chengming, Zhaoxin Dai, Xiaoli Liu, and Wei Sun. 2020. "Evaluation System: Evaluation of Smart City Shareable Framework and Its Applications in China" Sustainability 12, no. 7: 2957. https://0-doi-org.brum.beds.ac.uk/10.3390/su12072957
Note that from the first issue of 2016, this journal uses article numbers instead of page numbers. See further details here.