Marginality Assessment: Computational Applications on Italian Municipalities


Department of Civil and Environmental Engineering, University of L’Aquila, 67100 L’Aquila, Italy
*
Author to whom correspondence should be addressed.
Sustainability 2020, 12(8), 3250; https://0-doi-org.brum.beds.ac.uk/10.3390/su12083250
Submission received: 15 March 2020
/
Revised: 13 April 2020
/
Accepted: 14 April 2020
/
Published: 16 April 2020
(This article belongs to the Special Issue Computational Planning Support Systems for Sustainable Cities)
Abstract
:Inner areas are the most peripheral Italian municipalities and they are characterized by clear loss of both public and private services. They represent one of the relevant elements in national and regional planning policy and the Italian government has made available a fund (€ 100 million) for small municipalities up to 5000 inhabitants (Law n. 158/2017). These areas have gradually seen an evident process of marginalisation, which is difficult to evaluate because it is the result of several factors. This work describes an applied methodology for this marginality assessment on the Italian inner areas, which was developed through the quantification of eight criteria selected from Law n. 158/2017. The analysis carried out two different simulations for elaborating and mapping territorial disadvantages, with the use of GIS software and MATLAB. The analysis highlights an evident clustering in specific geographic areas. Moreover, this result confirms that there is a significant chaining of some typical issues of the small municipalities. This research represents a first analytical approach to evaluating the intervention priorities of regulatory instruments and national strategies and it is proposed as an innovative approach that introduces a profound change of attitude moving from an equality-based model to an equity-based model.

1. Introduction
In recent decades, European peripheral areas have faced new challenges linked to their role in a more globalized and interconnected world. On the one hand, their socio-demographic as well as economic decline and environmental fragility, on the other, the opportunities related to greater mobility and the role of the technologies of information and communication, which have led to different perceptions on development policies [1].
Only few European Countries (UE), including Italy, have developed policies and allocated resources for inner areas. They started to be an object of study from the 1990s, as inner periphery, in the New Economic Geography’s categories [2]. Mapping these less-favoured areas at a larger scale, as the European context is [3,4], risks being a complex problem. Indeed, states tend toward adopting specific types of classification strongly based on local geography and history [5,6,7]. If something associates less-favoured areas, it is a clear marginality from central hubs, which provide services and resources. In many cases, marginality comes from lack of connectedness with the economic, social and manufacturing processes of the country [8,9,10,11]. This disconnection has increasingly affected the segregation of peripheral areas, as highlighted in some of the latest European reports on the subject [12]. The reports point out that geographic data is insufficient for understanding the complexity of the theme. Instead, possible resolutions have to come from a structural approach.
In September 2012, the Italian government launched a National Strategy for Inner Areas’ development (SNAI). The SNAI, intercepting and removing obstacles to social, institutional and economic innovation, aims at improving the quality of life and economic wellbeing of people living in inner areas and in the long term reversing and improving demographic trends by sustaining local development [13,14,15]. Inner areas represent one of the key territorial factors in regional planning policy 2014−2020. A definition for inner areas includes places evidently distant from points of interest for services (i.e., school, healthcare, mobility) and areas that are rich in environmental and cultural resources [16]. Moreover, it includes a broad variety of urban landscapes created by long historical processes throughout centuries [17]. Such a definition comprehends also those regions that during the post-war period have gradually seen a process of marginalization as well as a decrease in employment and in land use due to a decrease in inhabitants. Furthermore, if on the one hand these areas observe a clear loss of both public and private services, on the other hand an increase in national social costs for hydrogeological instability and growing degradation of the cultural and landscape heritage have been registered [18]. Other negative effects come from some public and private interventions such as quarries, landfills, energy production plants and improper management of forests. All these interventions generally extract natural resources from the land without stimulating any sort of process of innovation or benefit. If local administrations agree to these practices, it is due to weakness in negotiation that goes along with lack of financial resources. In some other instances, all attempts at innovation have been stopped by enduring attitudes such as localism, which is closed to any external supply [19].
This is the context for Law 6 October 2017, n. 158, which introduces “support measures for promotion of small municipalities and regulations for redevelopment and restoration of historical centres of the mentioned municipalities”. The law provides for € 100 million. The funds go to structural, economic and social development of small municipalities up to 5000 inhabitants [20,21]. In detail, the measure concerns almost 5500 local institutions. They represent around 70% of Italian municipalities (7998 in 2017) and 54% of the national area. About 11 million inhabitants live in small municipalities, which means approximately 18% of the national population. The remaining 82% of the Italian population live in 46% of the territory that mainly consists of metropolitan cities and surrounding areas [22]. Evidences from the Italian National Institute of Statistics (ISTAT) data about taxable income has highlighted the disparity between metropolitan areas and small municipalities, because the latter represents only 15% of national taxable income. This condition arises also from a range of visible disadvantages in spite of maintaining adequate socio-economic living conditions.
As SNAI highlighted, the regional governance and policy in force consider national development dependent also from inner areas’ development [23]. Therefore, strategies and regulations attempt to define a bunch of criteria that can typify urban distress of local communities. However, on the other hand, the necessity to realize a comprehensive knowledge framework on the individual situation of each municipality compared to the complex range of disease conditions has increased. The framework that identifies diseases on the territory is composite. It requires a further level of knowledge because the marginality’s degree of small municipalities is differential. It is also necessary to identify precisely the geography that these degrees describe. Therefore, the aim of the present work is to expand the topic’s background. The outstanding question left is about a specific definition of selection criteria for eligible municipalities. This task has been hard to address also because the majority of those criteria are not analytically quantifiable. In light of this, the aim of this work is to implement a set of data related to the selection criteria required in Law n. 158/2017; then, to develop a territorial definition of major critical issues in order to provide a sort of embryonic order of priorities for government intervention. The work will use an evaluation of disease factors for elaborating on and mapping territorial disadvantages. The starting point is represented both by some criteria selected from Law n. 158/2017 and by an analysis on the relationship between efficiency of funding measures and the inner areas’ redevelopment (Figure 1).
2. Materials and Methods
Law n. 158/2017 is a funding measure that is based on a total amount of € 100 million (lately increased to € 160 million). Its aim is a structural, economic and social development of municipalities and it is usable for seven years (with the last term in year 2023). As an actual measure, the fund addresses municipalities (up to 5000 inhabitants) that also have at least one of the following criteria:
- (a)
- municipalities included in areas affected by hydrogeological instability;
- (b)
- municipalities affected by strong economic backwardness;
- (c)
- municipalities affected by strong population decrease compared to the general census of 1981;
- (d)
- municipalities affected by housing distress. Data computed on a series of indicators such as aging index, percentage of employed compared to local population and rurality index;
- (e)
- municipalities affected by inadequacy of essential welfare services;
- (f)
- municipalities located in areas characterised by communication distress and remoteness from urban centres;
- (g)
- municipalities characterised by a residential density lower than 80 inhabitants per km2;
- (h)
- municipalities that include fractions having characteristics as in conditions (a), (b), (c), (d), (f) or (g). In this case, funds disposed, according to art.3, must cover interventions in the mentioned fractions only;
- (i)
- municipalities that are part of a mountain community (as mentioned in art.14, comma 28, legislative decree 31 May 2010, n. 78, later converted with amendments as Law 30 July 2010, n. 122) or municipalities that implement together the basic functions (in accordance with the mentioned article, comma 28);
- (l)
- municipalities partially or totally included in a national park, a regional park or other protected areas;
- (m)
- municipalities created by fusion;
- (n)
- municipalities included in peripheral or ultra-peripheral areas, as defined by National Strategy for Inner Areas (SNAI) (according to art.1, comma 13, Law 27 December 2013, n. 147).
Currently, the mentioned law provides criteria for identifying the profile of an area affected by a disadvantaged economy, depopulation and issues connected to hydrogeological instability and to territory in general. However, the law does not provide any directions for a possible order of priorities. The question is more complex if considering that is not possible to discern in how many criteria each municipality is involved. Indeed, only one (out of twelve) requirements is a necessary and sufficient condition for accessing the funds. Evidently, if only one match with one criterion is sufficient, then funds would be equally spread, but not through a strategy. A notable consequence would be pulverizing economic resources. The total amount should be around € 30,000 per municipality in seven years [24] or € 10 million per year if considering the law update in 2018.
The selection of criteria that provides analytical data both at local scale and at national level are (a), (b), (c), (g), (i), (l), (m) and (n).
- (a)
- Municipalities included in areas affected by hydrogeological instability
Data on hydrogeological instability of Italian municipalities, for the entire country, are provided by the inventory of Italian landslide phenomena [25]. It is the official national database on landslides, and is a product of the Italian Institute for Environmental Protection and Research (ISPRA), Regions and Autonomous Provinces (art. 6, comma g, in Law n. 132/2016). Municipalities affected by hydrogeological instability have been selected if involved in at least one landslide event. Moreover, data on land take have been added. This dataset resulted from elaborating data of ISPRA (http://www.isprambiente.gov.it/it/temi/suolo-e-territorio/il-consumo-di-suolo/i-dati-sul-consumo-di-suolo) [26].
- (b)
- Municipalities affected by strong economic backwardness
Taxable income data come from an analysis of available information on the Ministry of Economy and Finance website (MEF, http://www.mef.gov.it/). In particular, income considered refers to the years 2012 and 2017. Taxable income is chosen as data because it is effectively taxed, in spite of the total income. The latter comprehends deductions (security and healthcare) and other incomes (i.e., maintenance payments for separated partners and supplementary pension scheme). Another calculation is about income from pension and number of retired, again for the mentioned years. In this part it is possible to know the incidence, in percentage, of this type of income on the total amount. Income data are available in table form for each Italian municipality and comprehend every type of income (i.e., building, employment work, pension, self-employment).
- (c)
- Municipalities affected by strong population decrease compared to the general census of 1981
Population trend of municipalities up to 5000 inhabitants is calculated for 1981−2017 using census data from the Italian National Institute of Statistics (ISTAT, https://www.istat.it/). As happened before, there is not a clear quantification for the “strong population decrease” mentioned. Therefore, it is possible to decide where to put a threshold of significance. In this work, the thresholds are both −10 and −25 % for each for the two simulations later described.
- (g)
- Municipalities characterised by a residential density lower than 80 inhabitants per km2
Residential density data come from population according to the census of 2017 in a given area, that is, the municipality considered in the same year. Data are collected from ISTAT database.
- (i)
- Municipalities that are part of a mountain community (as mentioned in art.14, comma 28, legislative decree 31 May 2010, n. 78, later converted with amendments as Law 30 July 2010, n. 122) or municipalities that implement together the basic functions (in accordance with the mentioned article, comma 28)
Unions of municipalities are here identified as specified in art.14, comma 28, legislative decree 31 May 2010, n.78, later converted with amendments as Law 30 July 2010, n. 122. The law also refers to art.32 (part of legislative decree 18 August 2000, n. 267 and successive amendments), which defines characteristics of unions. Successively, the variation in municipality number is taken into account for 2010−2017. After counting the unions, only those included in mountain municipalities (Law n. 1102/1971) were selected.
- (l)
- Municipalities partially or totally included in a national park, a regional park or other protected areas
The dataset comes from the Ministry of Environment, Land and Sea through Open Geospatial Consortium service (OGC) on the national geo-portal. It gathers all protected areas, marine and terrestrial, which correspond to the following criteria. The ministry is actually making a new update. The one in force now is the sixth update and it was approved with the deliberation of the State–Region Conference on 17 December 2009, published on the official bullet n. 125 on 31 May 2010.
- (m)
- Municipalities created by fusion
The main reference is the mentioned law about unions of municipalities (art.14, comma 28, legislative decree 31 May 2010, n. 78, later converted with amendments as Law 30 July 2010, n. 122). In addition, the data used are the available ones at the ISTAT database, taking into account the difference between municipality number in 2010 and 2017. In the entirety of municipalities selected, the selection favours municipalities that have the pre-condition requests of Law n. 158/2017, that is, having less than 5000 inhabitants.
- (n)
- Municipalities included in peripheral or ultra-peripheral areas, as defined by National Strategy for Inner Areas (SNAI) (according to art.1, comma 13, Law 27 December 2013, n. 147)
Inner areas are the most remote Italian municipalities in terms of essential services (i.e., healthcare, school, mobility). Defining which inner areas need funding requires first defining which municipalities are “hub”. These sites offer a range of services at the same time (alone or together with bordering places). As examples: A full choice for upper secondary education (at least one high school, one technical school and one professional institute), at least one hospital (Emergency Department—Acceptance DEA I level, DPR 27/03/1992), at least one silver-type station. Municipalities that are less than 20 min travel time from the nearest hub are called “belt”. Those more distant represent inner areas. These areas in turn are divided according to growing distance as intermediate, peripheral and outermost.
For points (g), (i), (l), (m) and (n) an arbitrary threshold is not necessary for expressing positivity or not in comparison to a specific criterion. Therefore, positivity can be easily expressed. For points (a), (b) and (c) it is not possible to discover a threshold for expressing positivity in an analytical way. Then, municipalities can meet the criteria due to a method with a certain range of discretion. For the above letters, two different methods of selection of thresholds are here considered. They will be implemented through two simulations, which will be analyzed successively.
Simulation Data 1 (S1):
- Selection of municipalities affected by hydrogeological instability took into account territories involved in at least one landslide event.
- Selection involved municipalities with decreasing income trend between 2012 and 2017.
- Variation of population considered significant is equal to −10%.
Simulation Data 2 (S2):
- Selection of municipalities affected by hydrogeological instability took into account territories that arise with at least one event in hazard classes P3 or P4 and that run into urban areas or infrastructure.
- Selection involved municipalities with both negative income trend and negative contribution from pension income between 2012 and 2017.
- Variation of population considered significant is equal to −25%.
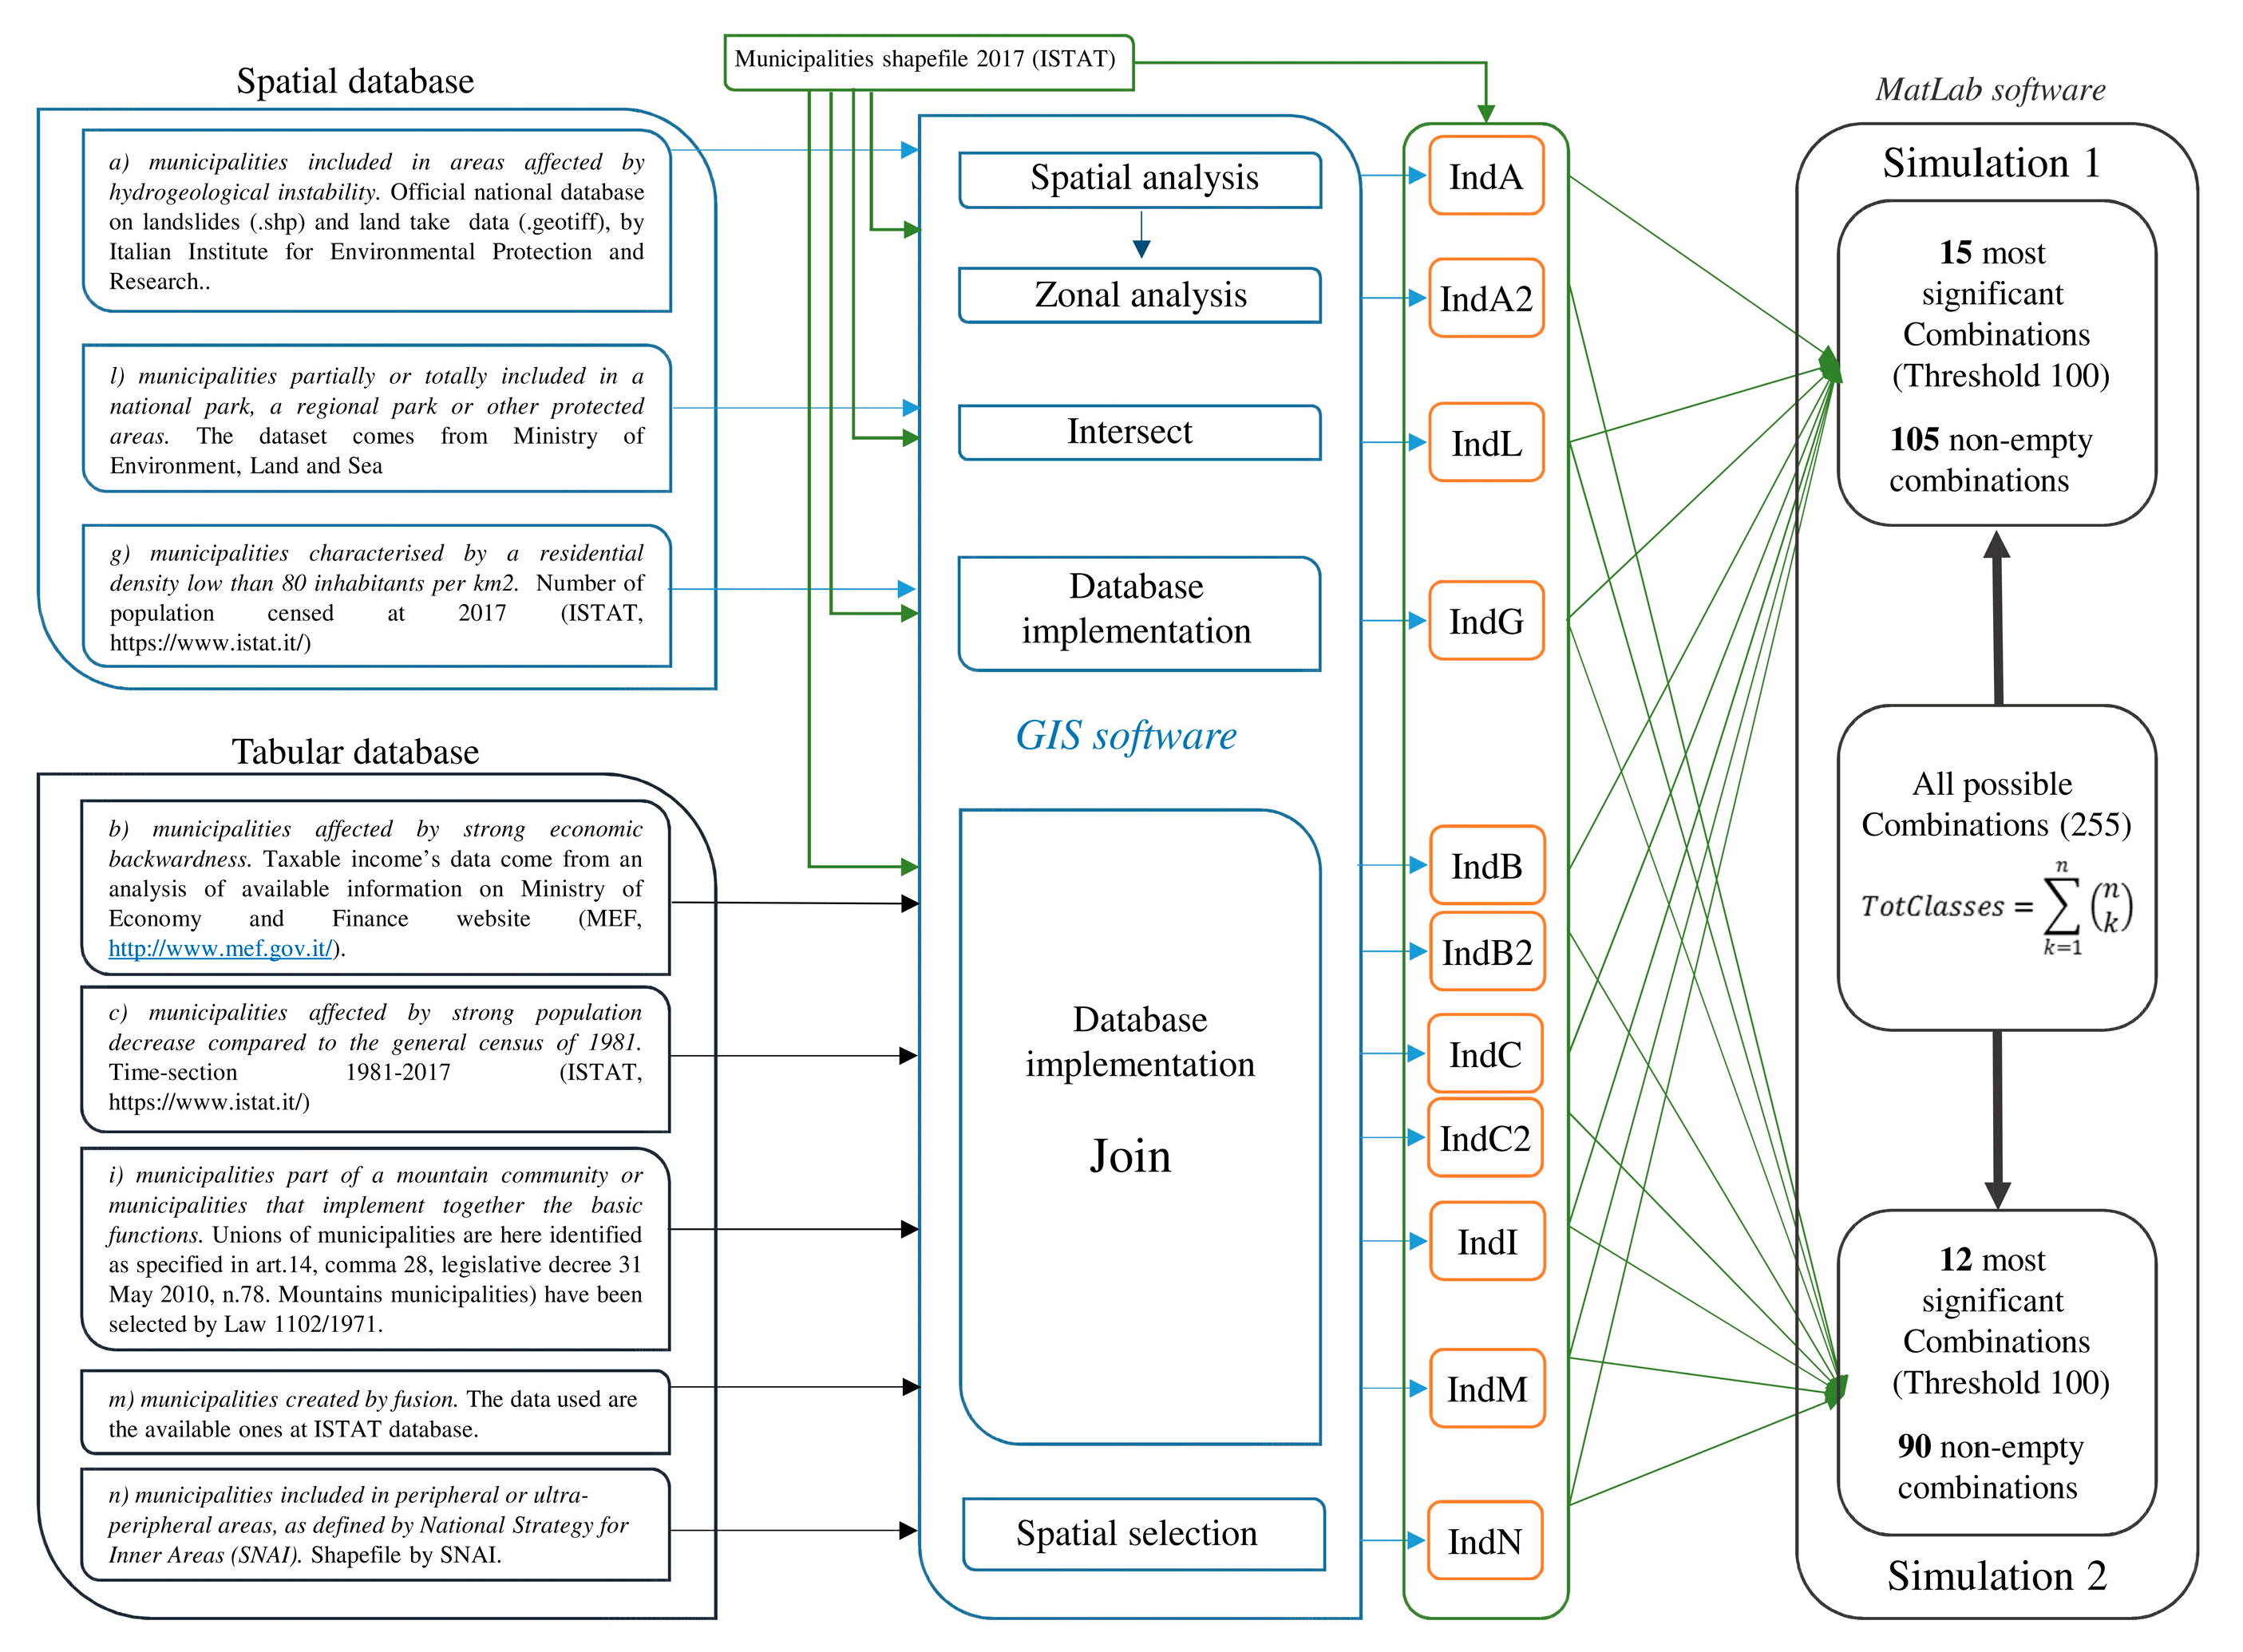
Criteria analyses carried out with open source software (QGis), having as base layer the Italian municipalities in 2017. GIS technology (Figure 2) offers a powerful set of tools for the input, management and output of data, whereas a computational tool as used for the analysis and the classification of the data [27,28]. As the first intervention, there was the selection of municipalities up to 5000 inhabitants, as defined in Law n. 158/2017. These are the territorial referees for the present work (5482 municipalities shown in Figure 1). In the following phase, information research began in order to collect, where possible, data for analytically quantifying phenomena expressed in the criteria. The operation was complex for a variety of reasons. Even if real, the regional dataset is just a mosaic and presents techniques and structures sometimes very different [29]. Secondly, it is not even possible to define thresholds or margins of discretion clearly and in an analytical way. This is evident for points (a), (b), (e) and (c). Consequently, a range was defined. In this range, a variability of results can be evaluated and an analysis method for both simulations can be tested.
Data collected were standardized in a single database through which it was possible to evaluate the matches between the municipalities selected in the initial dataset with one or more criteria established by law. In the database, each criterion was expressed through a series of indexes (IndA, IndB, IndC, IndG, IndI, IndL, IndM and IndN) associated, respectively, with the selected criteria ((a), (b), (c), (g), (i), (l), (m) and (n)) and a table was created with the following rules for each municipality (Table 1):
The indicators shown in Table 1 are related to simulation S1. For simulation S2 the criteria IndA, IndB and IndC have been changed into IndA2, IndB2, and IndC2, while the notation is the same for the remaining criteria (Figure 2).
This allowed a first spatial definition of the areas with the highest concentration of territorial, social and economic issues and consequently a first mapping of the Italian municipalities with the highest correspondence with the legal criteria.
Through this binary criterion, the compliance of the municipalities was assessed through the verification of the individual indices and therefore the correspondence with the following criterion: Negative 0; positive 1.
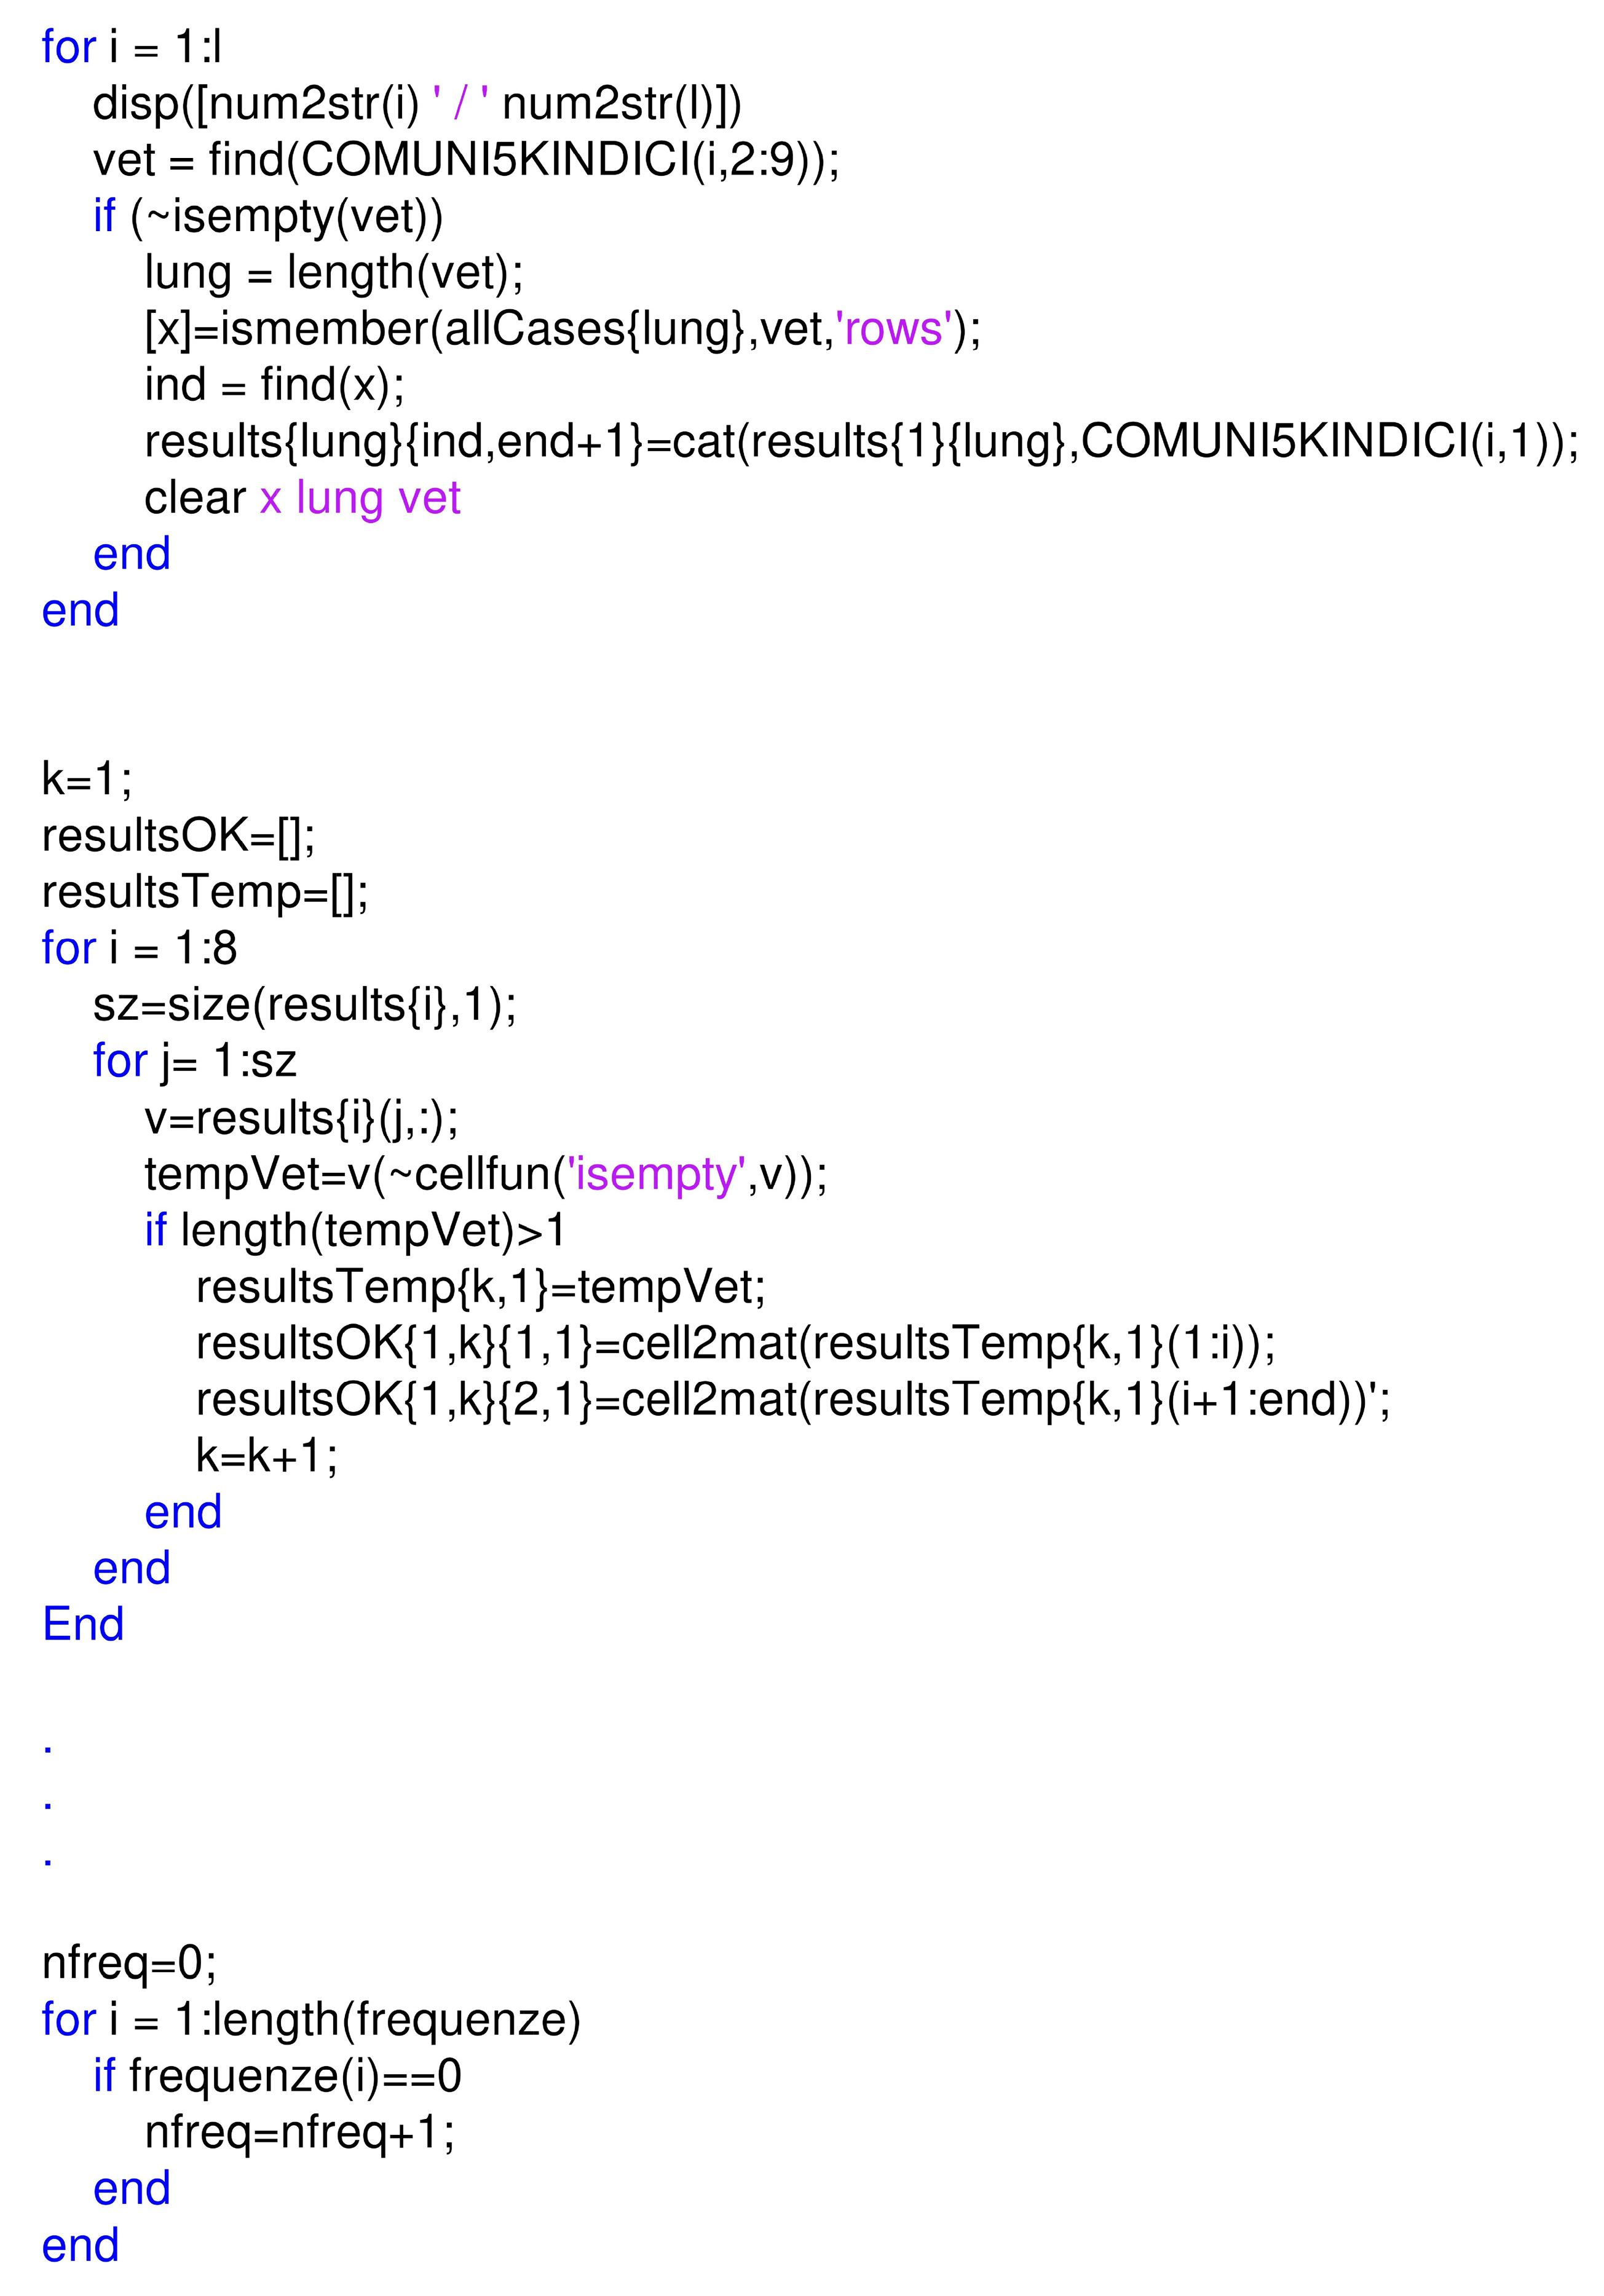
Moreover, the analysis of the data obtained from the previous phase was carried out in MATLAB (2019a) (The MathWorks, Inc., Natick, MA, USA). Starting from the datasets obtained for S1 and S2, regarding the satisfaction of the calculated indices for each municipality, all the possible combinations (or classes) without repetitions were computed and the total number of such combinations can be obtained with Equation (1), where the total number of indicators (n = 8) are taken in groups of k = 1,2, … 8. In this way a total of 255 classes were identified.
Subsequently, a scan of all the municipalities present in the databases was performed. Among the 255 combinations previously identified, a class of combination of indices was assigned to each of these municipalities, based on the fulfilment of the considered criteria.
A simple count of the municipalities included in each class allowed one to:
- exclude all empty classes, i.e., those for which no one municipality satisfies the combination of indices generated;
- automatically extract the number of municipalities for each class;
- select only the municipalities that satisfy the criteria of belonging to single classes of combinations of indices.
Finally, the script created made it possible to plot a graph showing the distribution of the number of municipalities for each class (Figure 3), with also the possibility of filtering and excluding those that have a minimum number of municipalities that can be set as a threshold, by entering it as input.
In the worst case (i.e., if you want to plot all 255 classes), the total computation time is on average less than 4 s using a commercial computer (Apple Macbook Pro equipped with processor 2.6 GHz Intel Core i7, 6 core and 16 GB of RAM) (Apple Inc., Cupertino, CA, USA).
3. Results
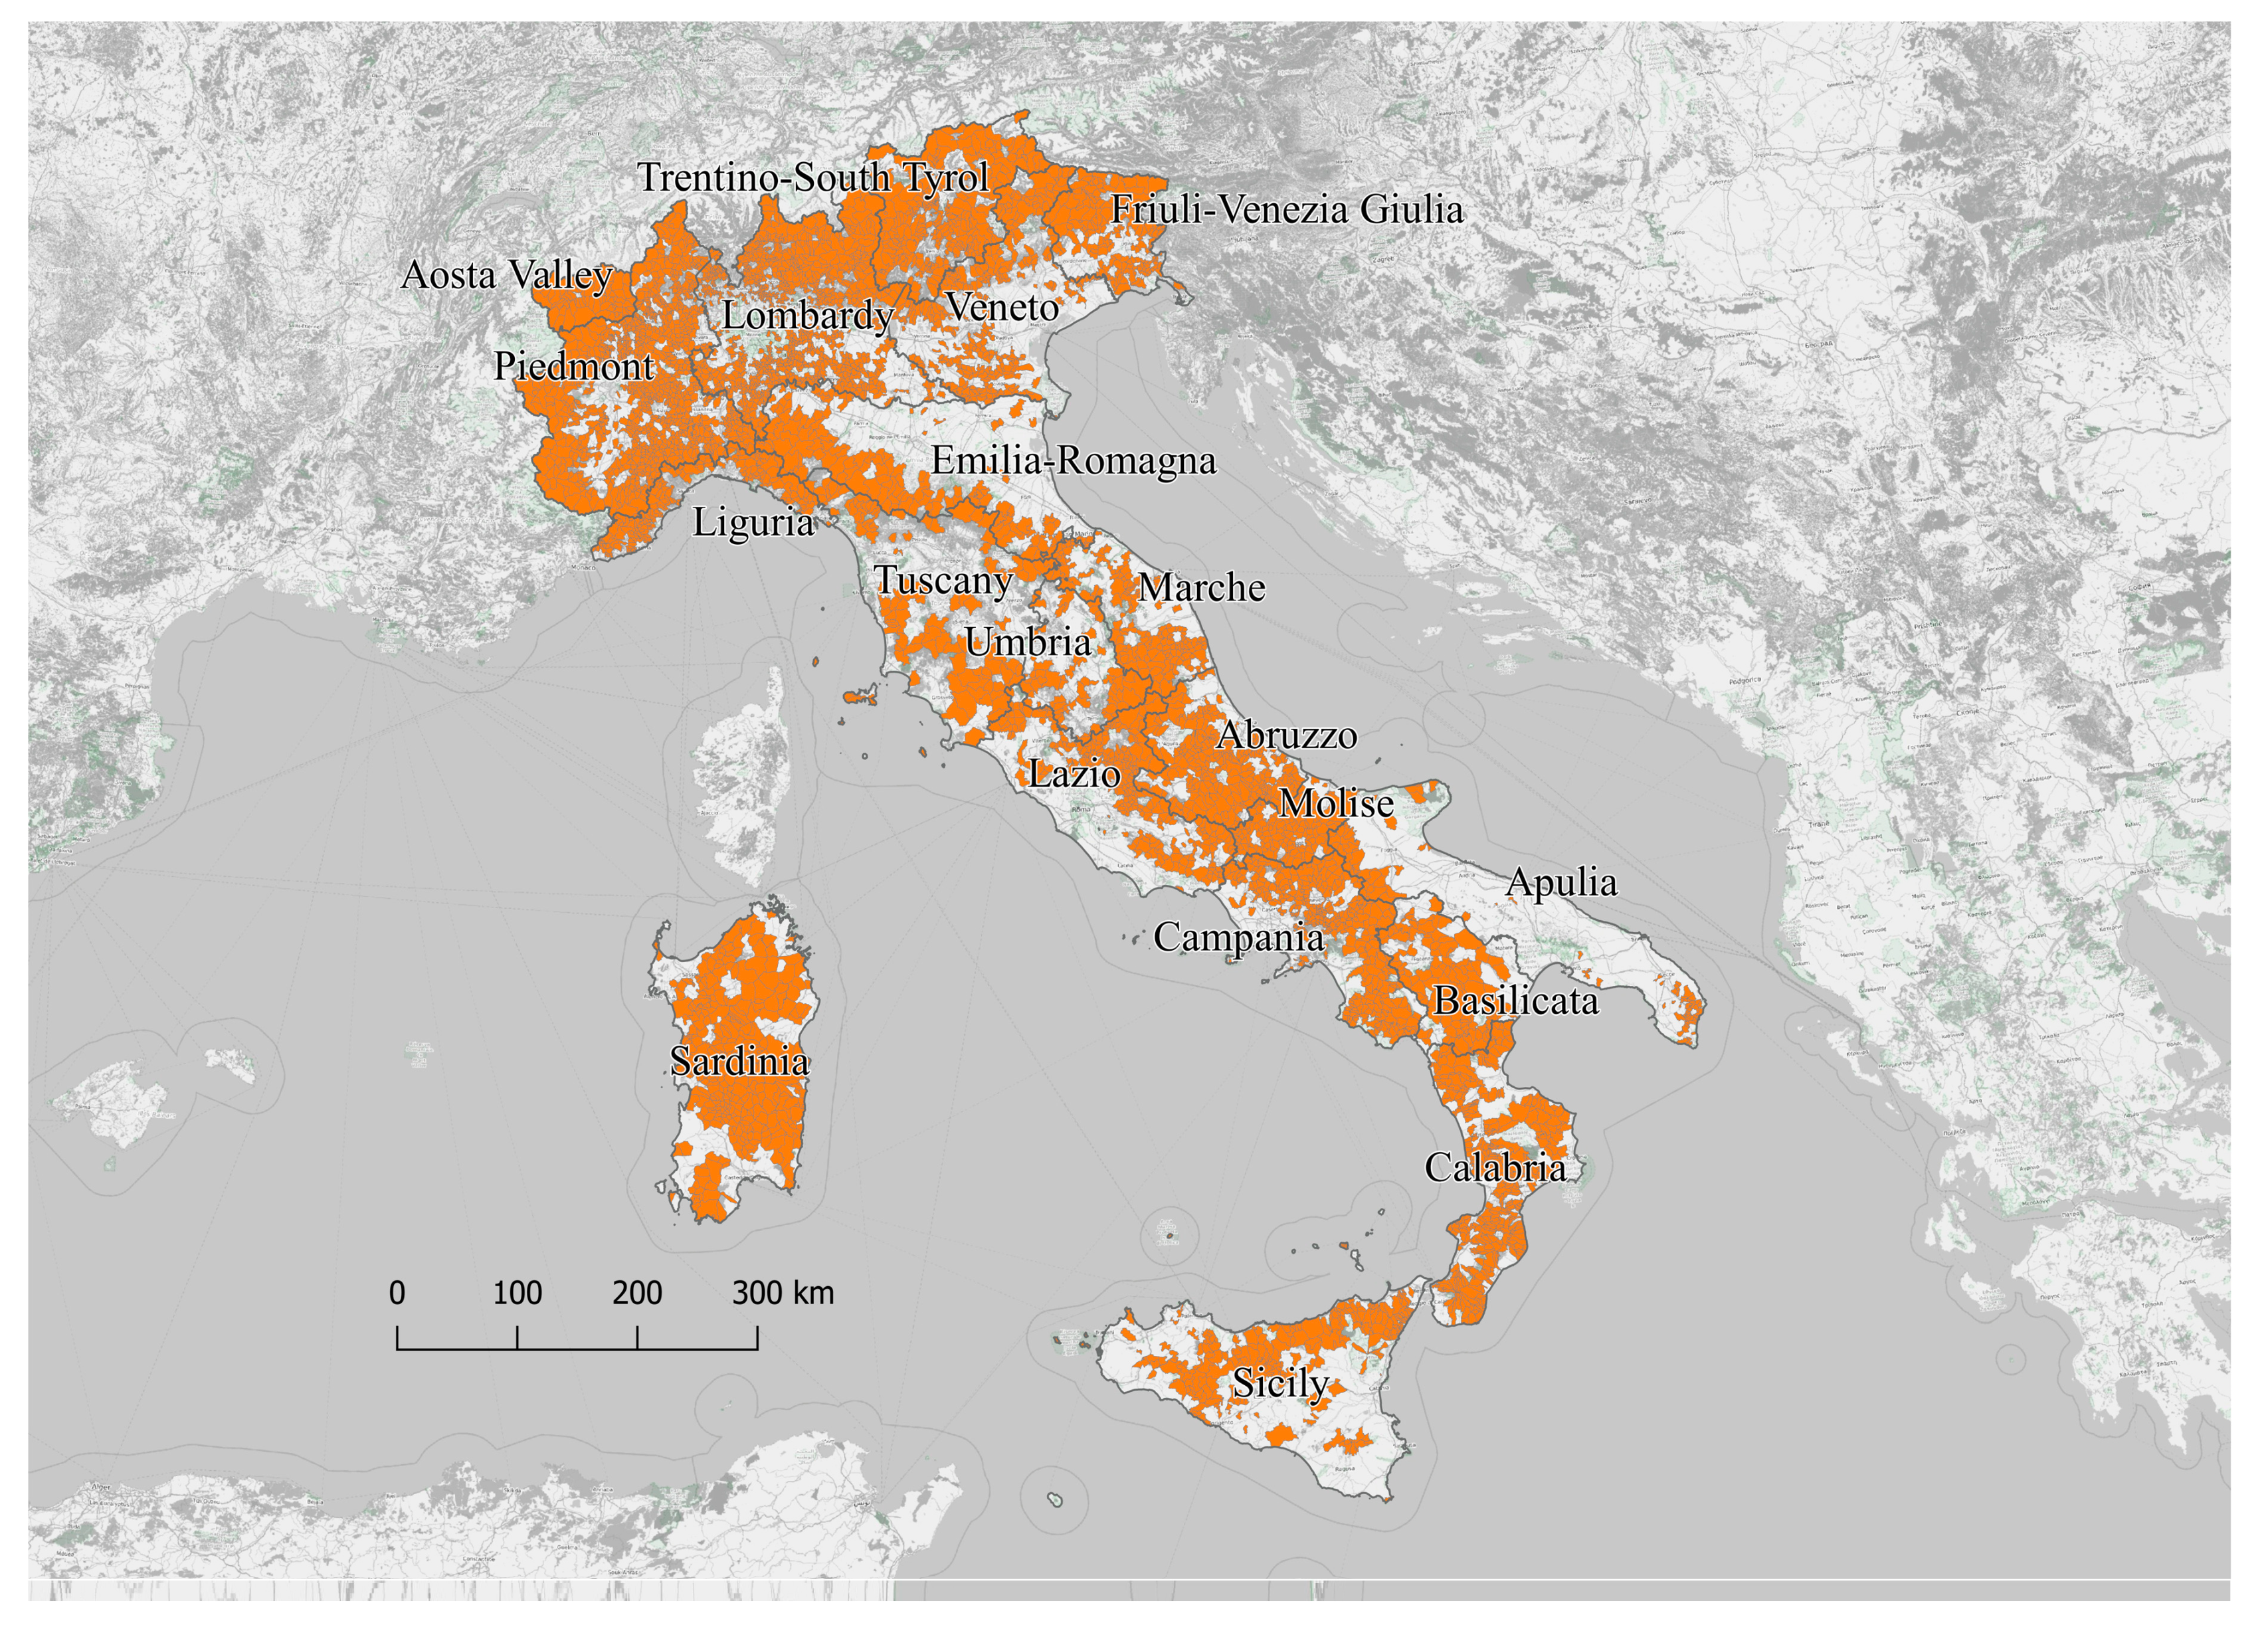
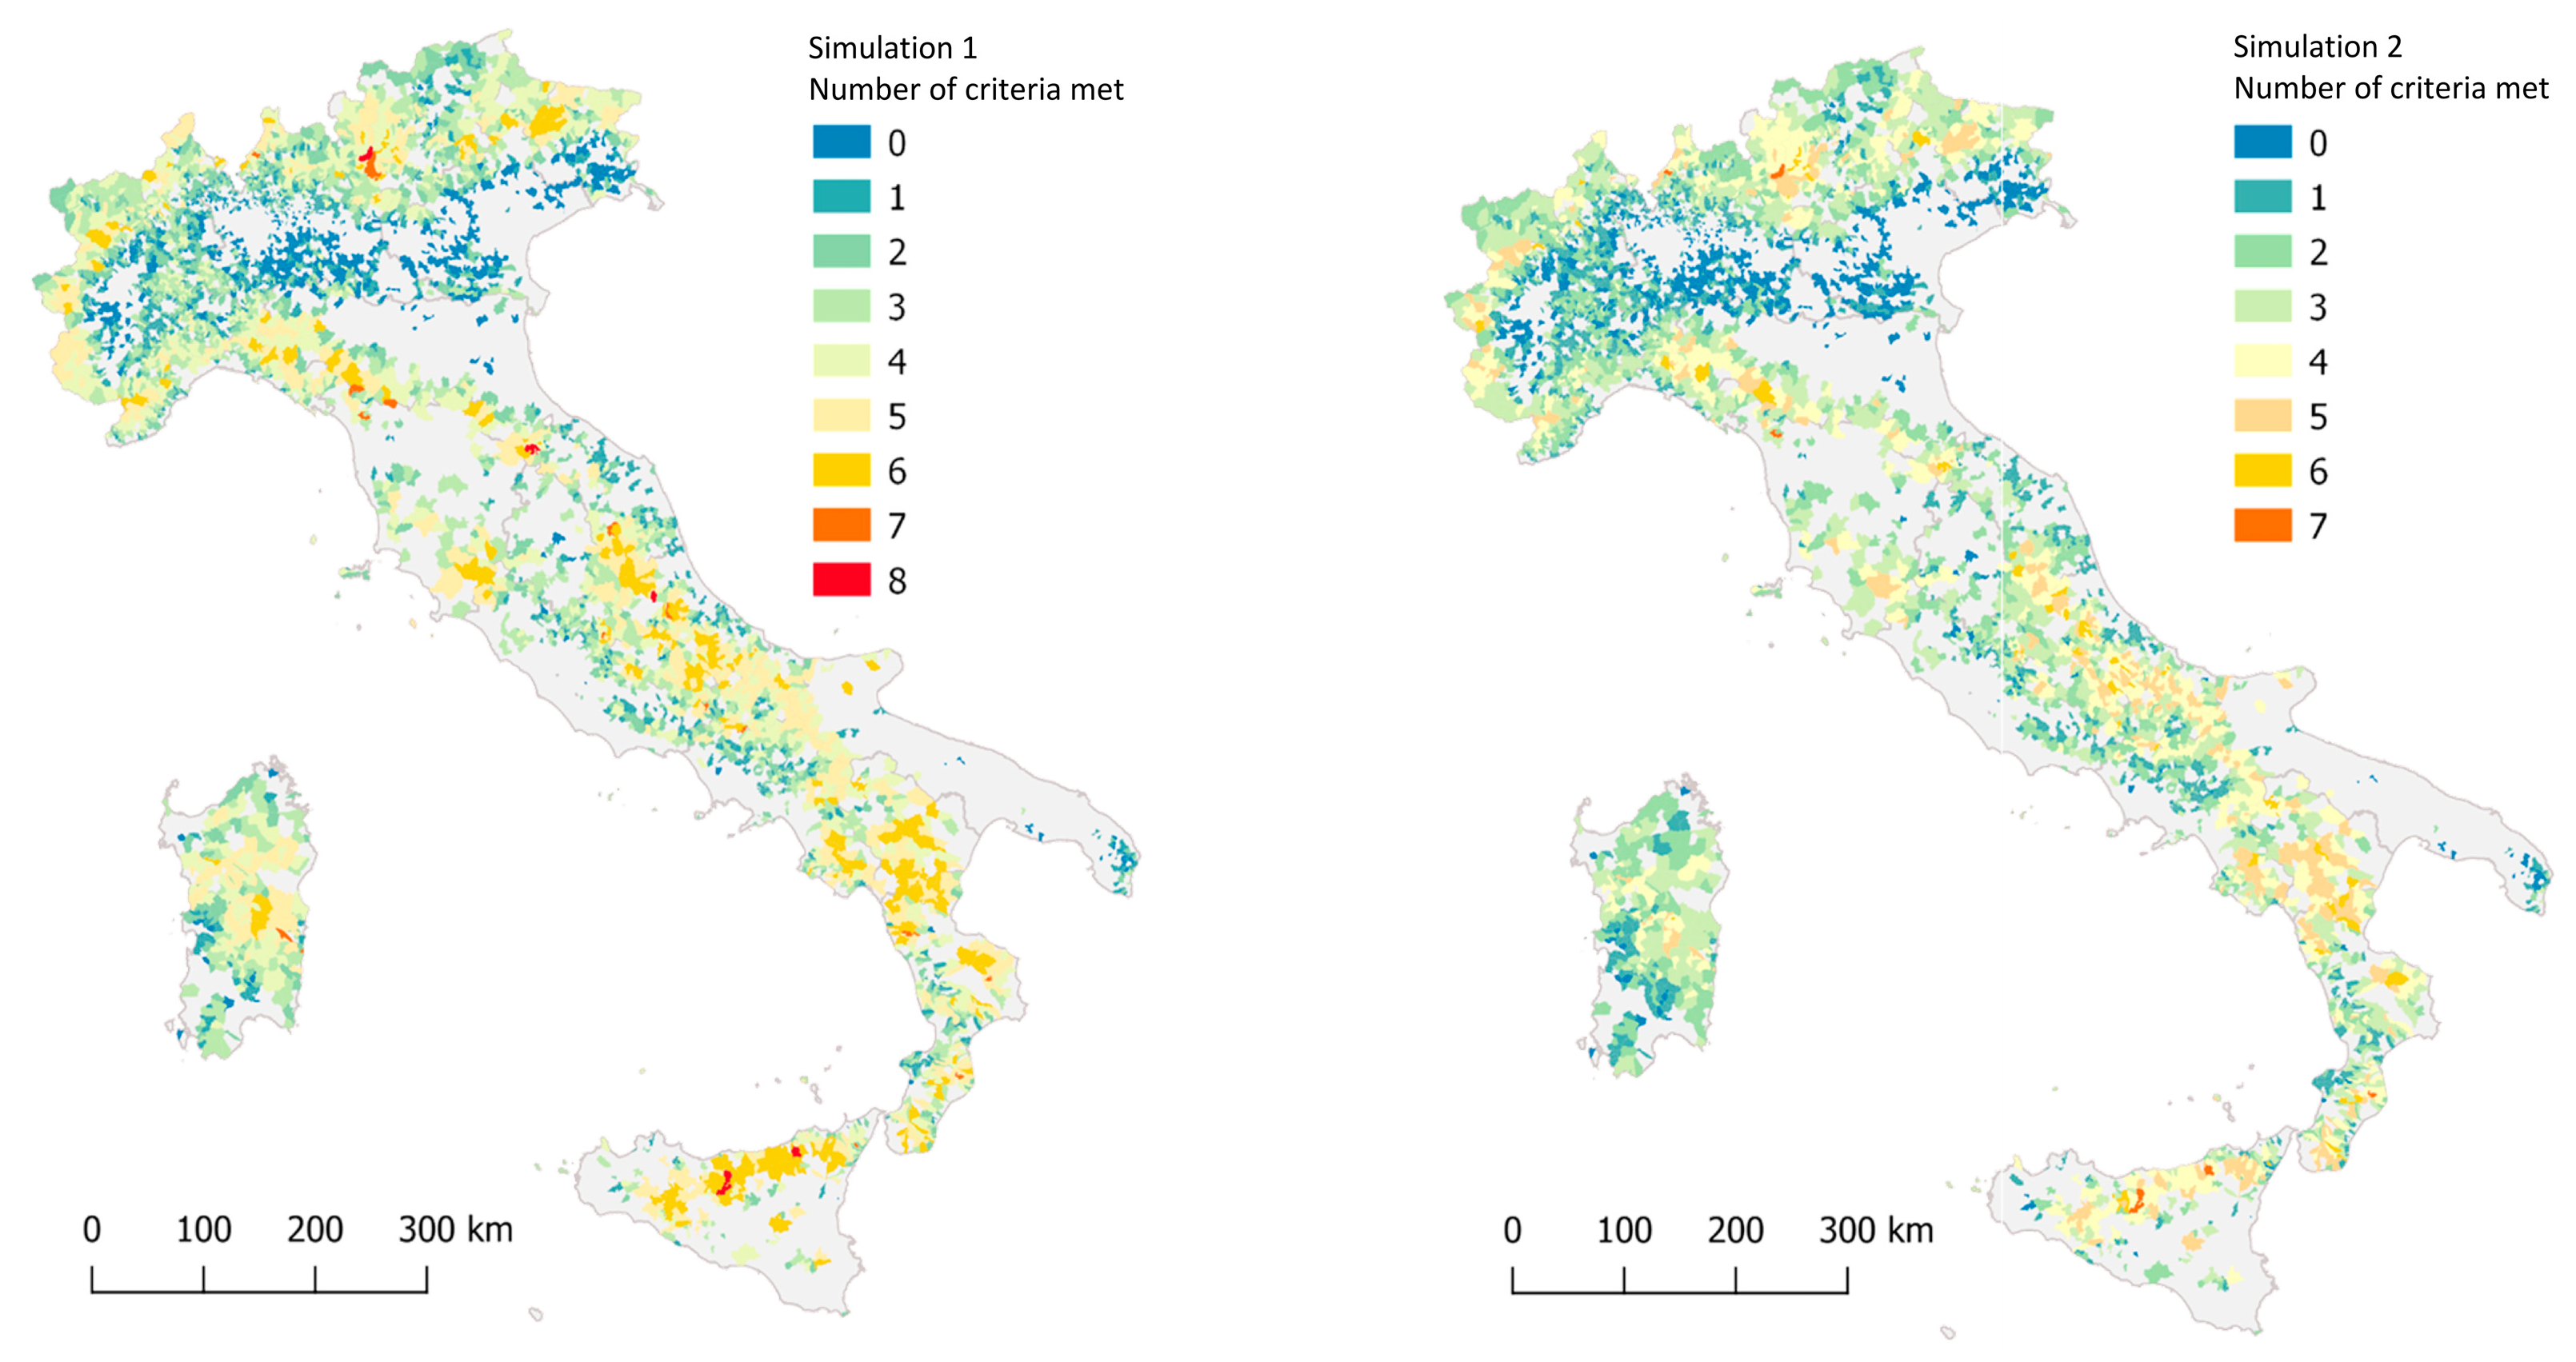
The processing of these data produced a first level of information relating to the location of the Italian municipalities that have a certain number of criteria. Figure 4 shows the results for simulations S1 and S2 which are expressed as the sum of all considered indices for each municipality.
The analysis highlights an evident clustering in specific geographic areas. This result also confirms that there is a significant settling of some typical issues of the small municipalities.
From a first qualitative evaluation of the number of criteria per municipality, it is already clear that some areas are strongly characterized by the coexistence of several factors of distress. The most affected areas are the central Apennines, in particular between Marche, Abruzzo and Molise regions, as well as Basilicata, Calabria and the northern part of Sicily. While, in northern Italy the most affected areas are the Tuscan-Emilian Apennines, the remote areas of the Alps and the eastern part of Friuli Venetia Giulia region.
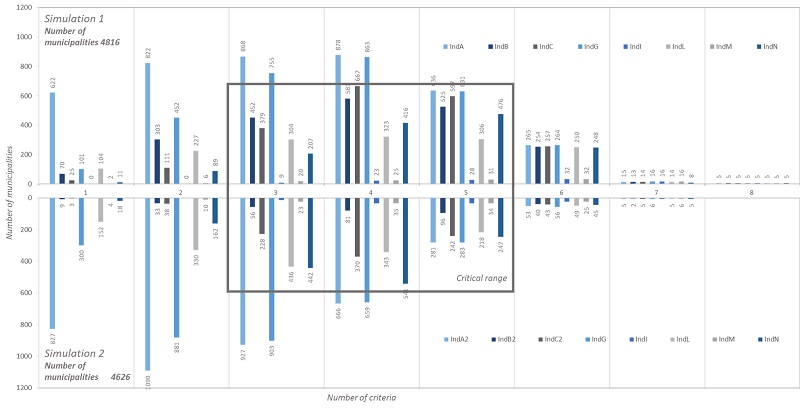
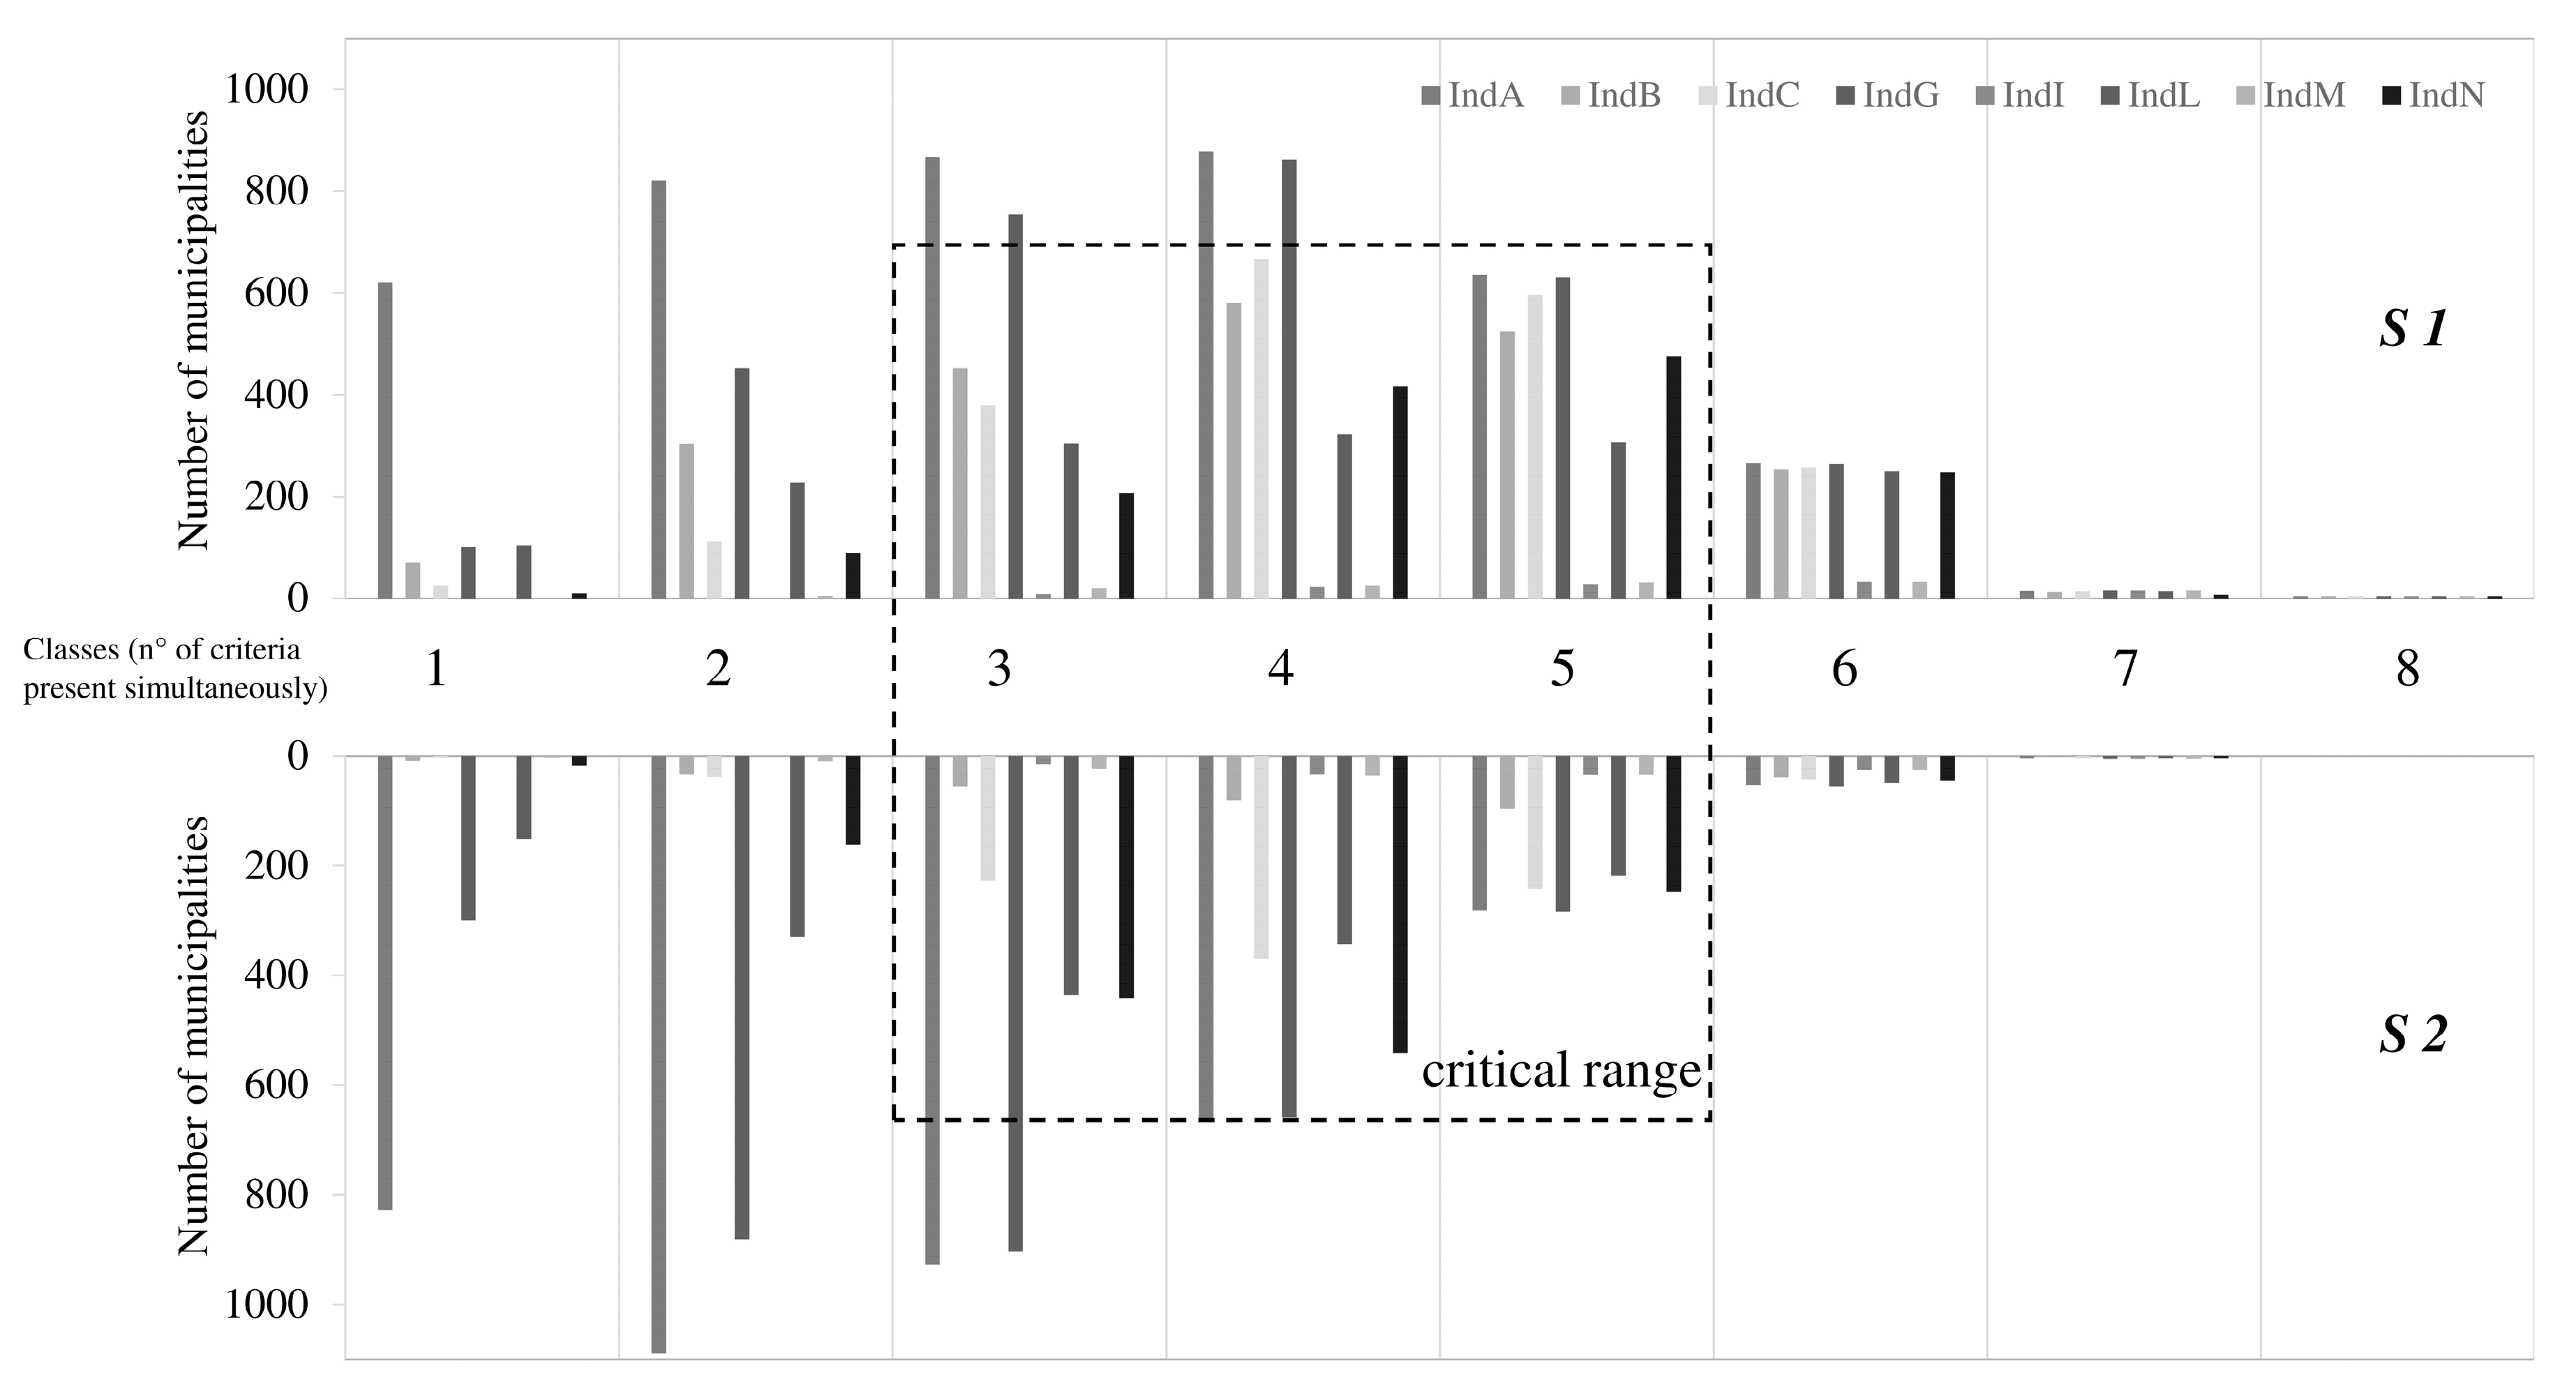
The graph below (Figure 5) compares the results for the two simulations proposed through the frequency of the indices in the number of classes, i.e., the various configurations where one or more criteria are present simultaneously (class 1 = 1 criterion, class 2 = 2 criteria). The hydrogeological instability (IndA in S1 and IndA2 in S2) is recurrent in all classes with very high values. Therefore, it appears to be a generalist parameter and, in fact, it is an expression of a national problem, which evidently makes no substantial contribution to the identification of hotspots of urban distress in the Italian territory. Moreover, the low population density (d < 80 inhab/km2), represented by the IndG index for both simulations, appears to be a recurring factor for the small municipalities, with the exception of the municipalities belonging to the class with a single criterion (class 1). Excluding the indices previously mentioned (IndA-IndA2 and IndG) from the graph below (Figure 4), it is evident that classes 3–5 represent the area where the main critical issues investigated in this study are concentrated. Moreover, the graph also highlights that S2, for which criteria (a), (b) and (c) have been identified through more stringent thresholds compared to S1, returns clusters which are territorially more defined and with well-located geographical locations.
The result obtained (highlighted with the bold box in Figure 5) could represent the critical range where the analyses could be deepened and both the strategies and the extent of the actions could be evaluated to try to change the current trend, under the assumption of a scale of intervention priorities for support to local communities based on real needs.
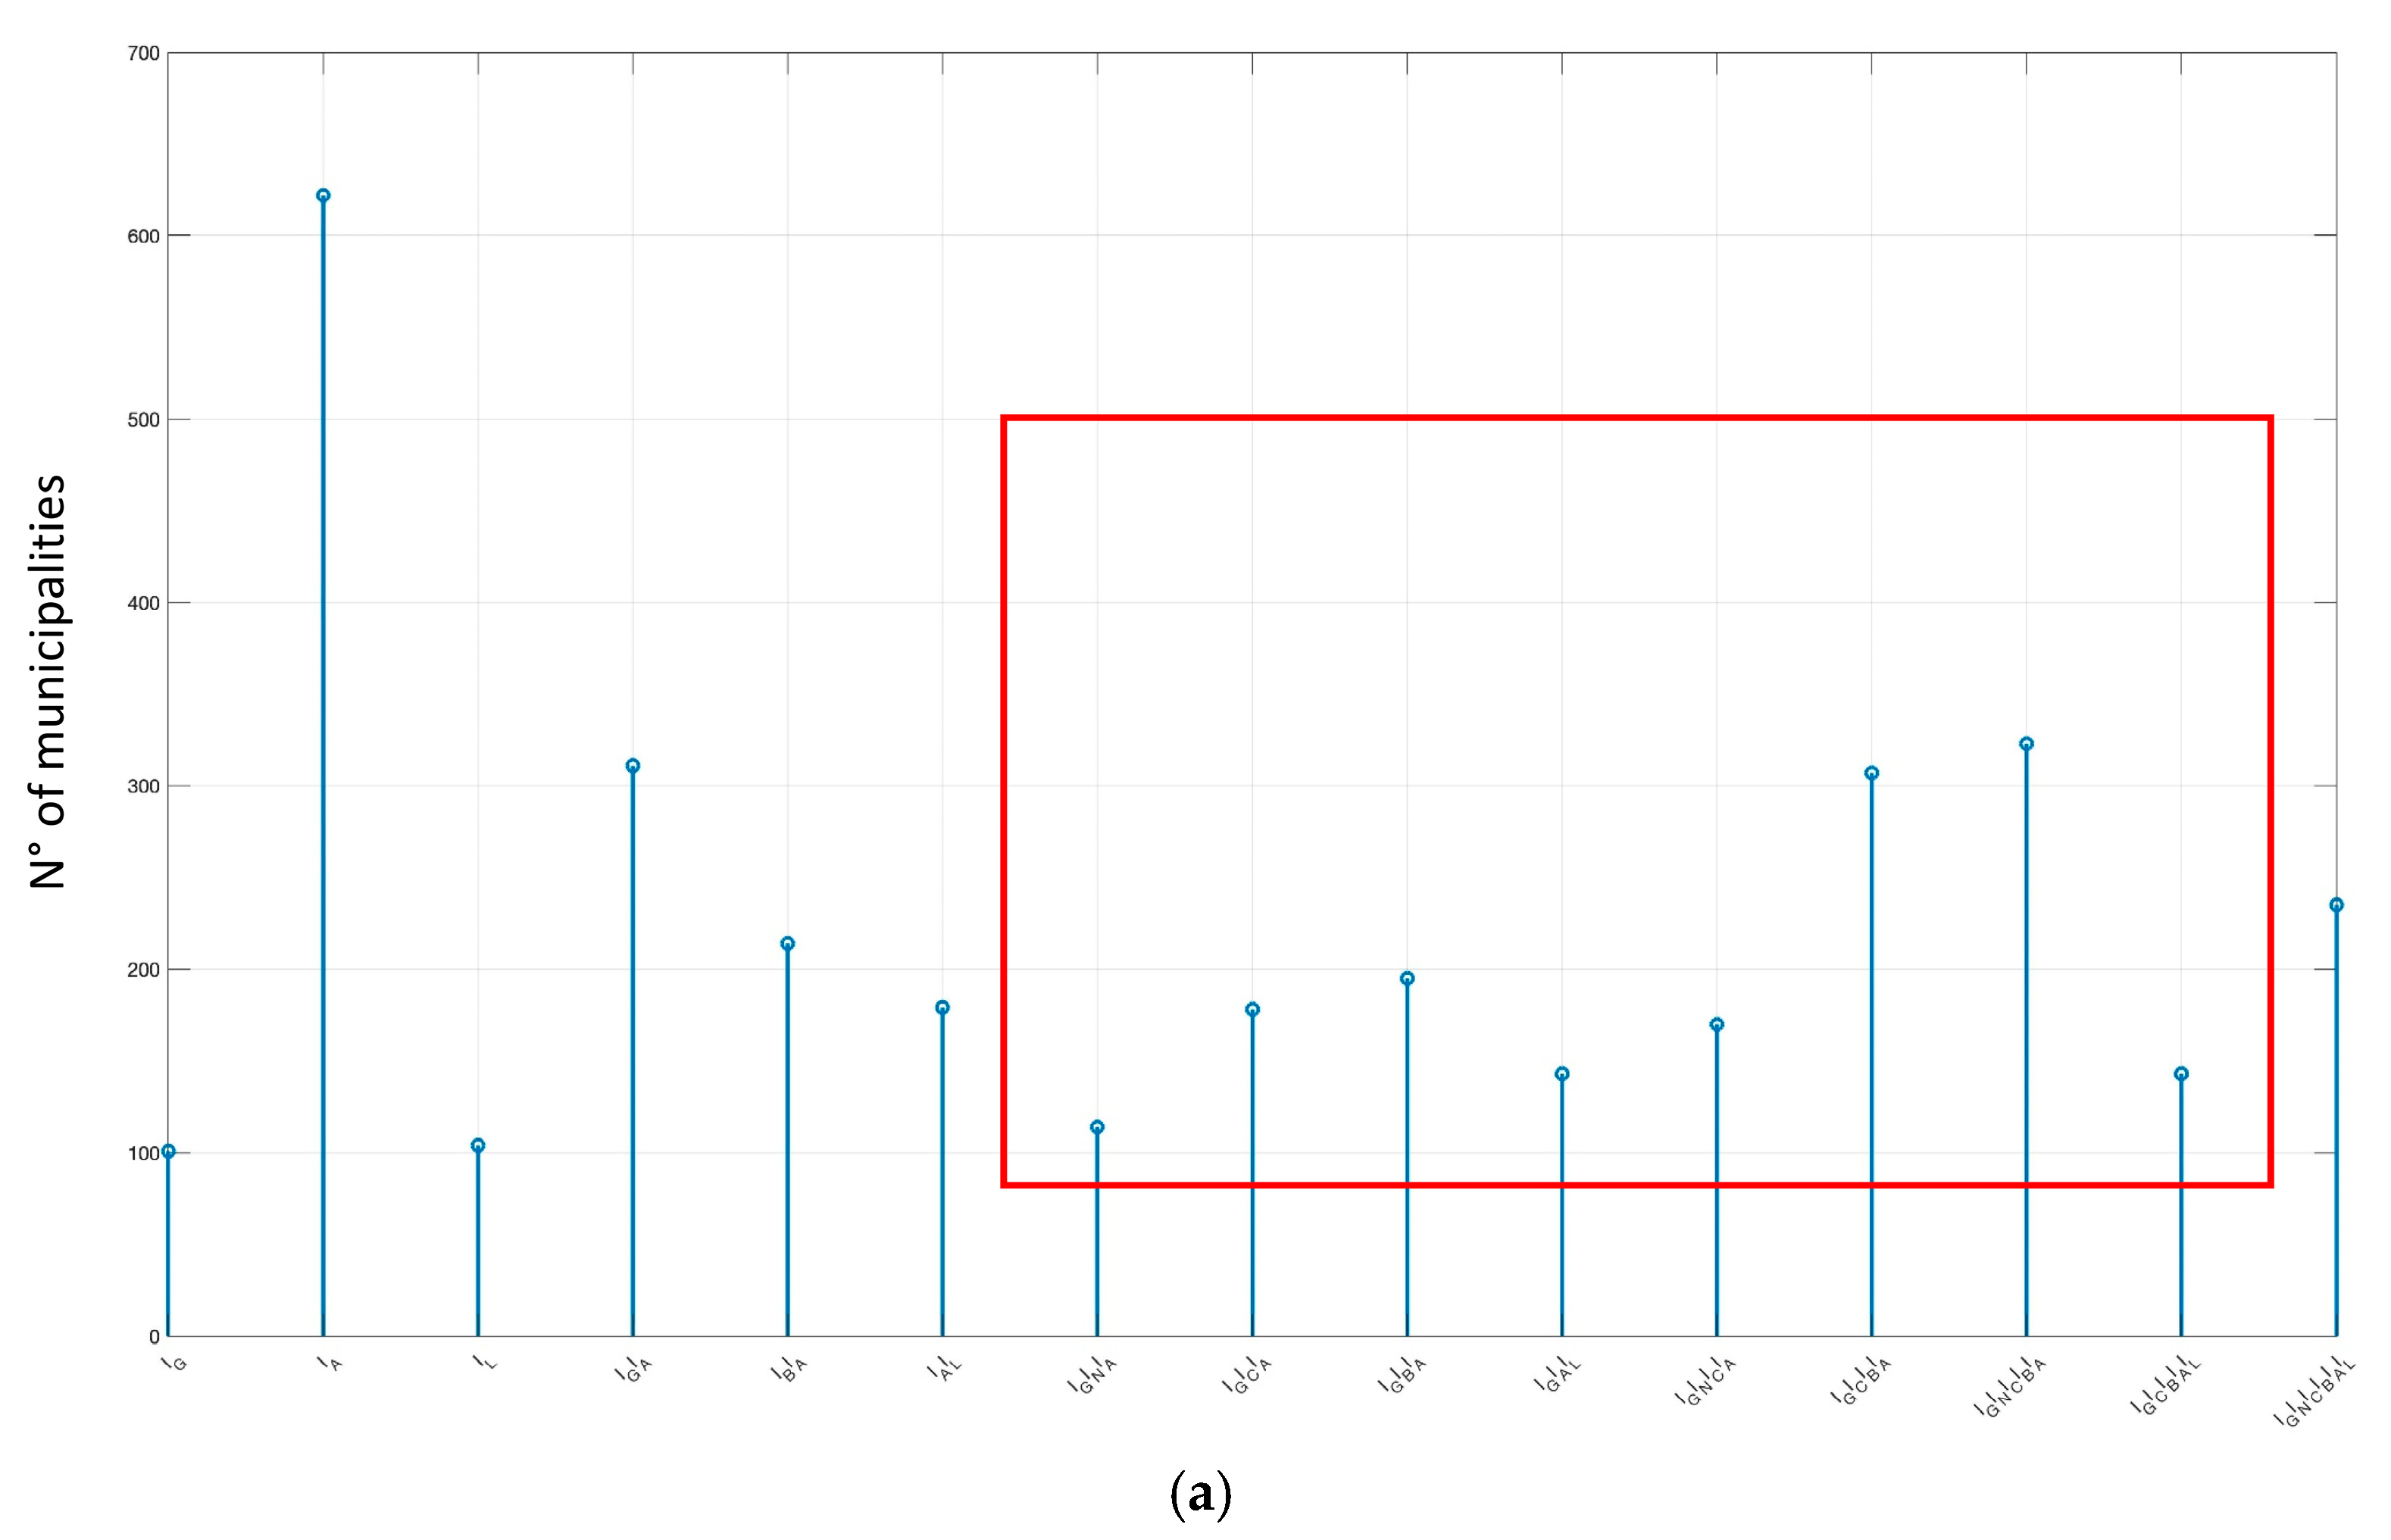
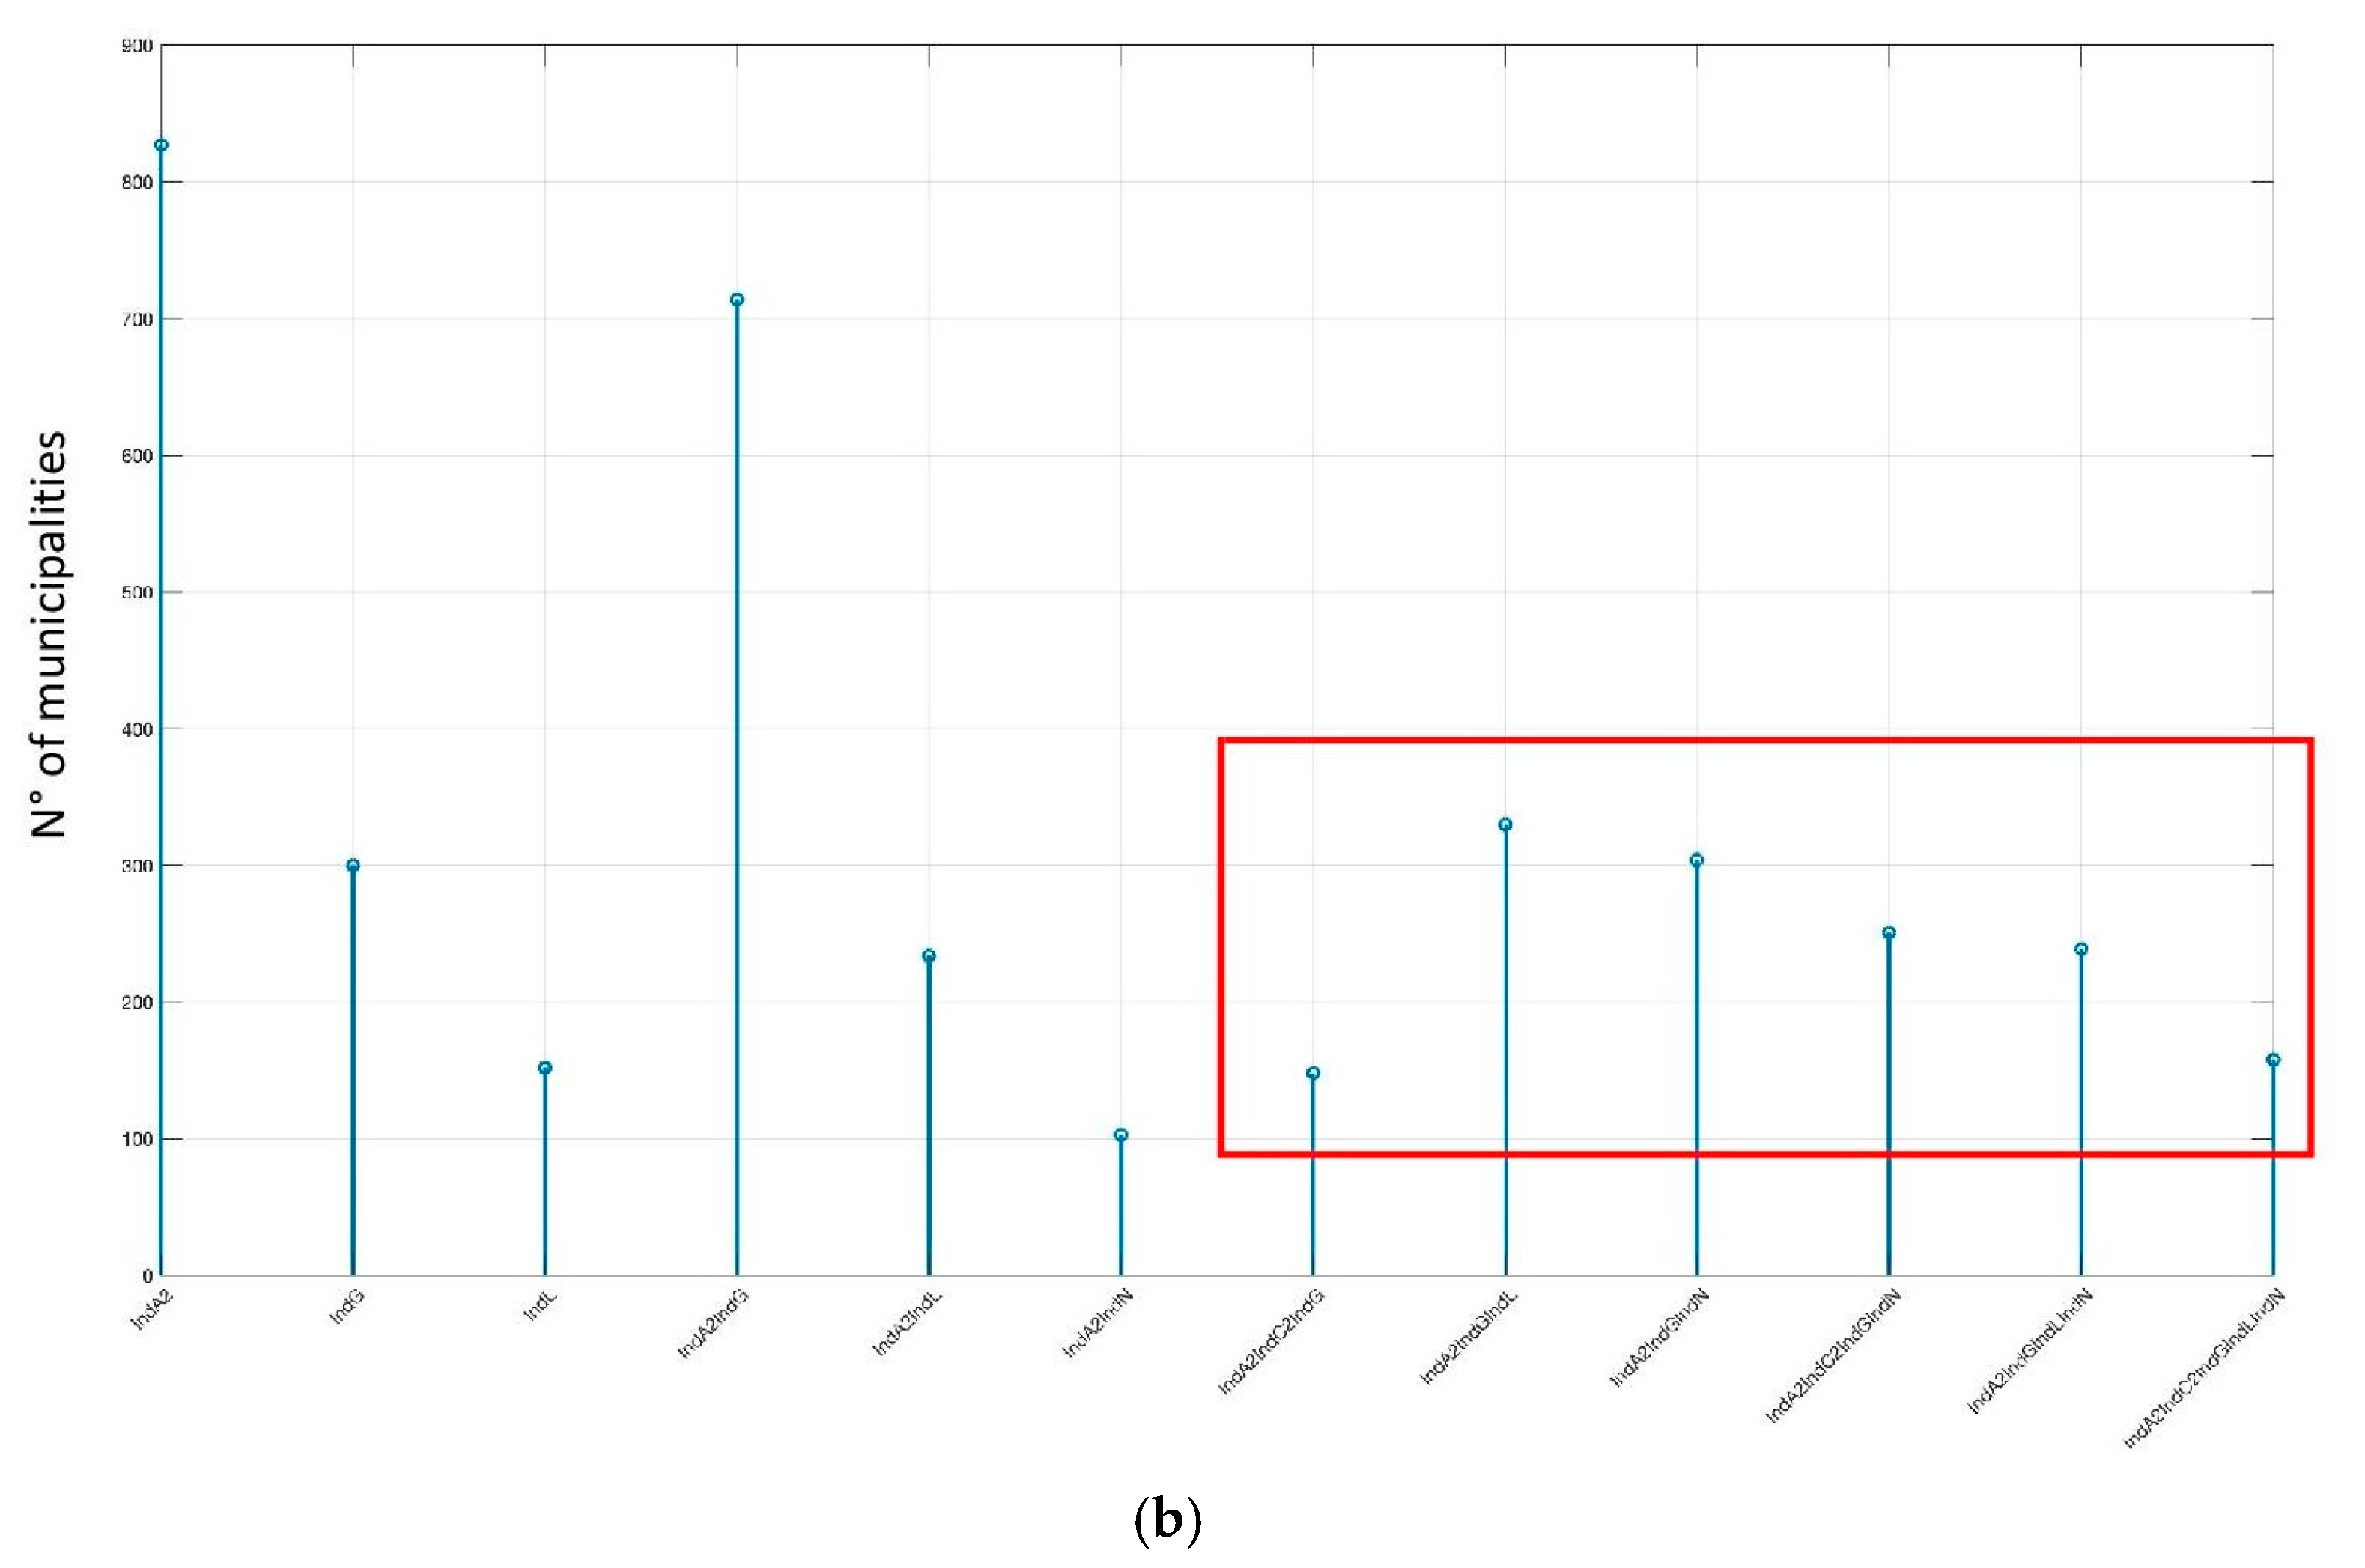
After this first part of the research where just a quantification of the criteria and the definition of the critical range was obtained, a deeper analysis of the obtained data was carried out with the MATLAB software in order to optimize the process of classifying the degree of disadvantages of the small municipalities. The proposed procedure, as already described in the previous section (Materials and Methods), made it possible to extract 105 values for S1 and 90 for S2. These represent the combinations of existing criteria and they were obtained by excluding all the null results.
Plots in Figure 6 show the combinations with frequency values greater than 100. Such a threshold was chosen because the average number of municipalities for each class is 45 for S1 and 51 for S2 and for this reason the most significant combinations have been identified through Equation (2), as the double of the previous average number:
The result of this operation was the selection of 15 combinations for S1 and 12 combinations for S2. Such combinations represent 70% of municipalities for S1 (3339 out of 4816) and 82% of municipalities for S2 (3760 out of 4626), as shown in the following table (Table 2a):
The sequences shown in Table 2b are all the configurations found considering the eight initial criteria and the threshold of 100 for both simulations (S1 and S2). By reducing the selection, it is possible to extrapolate eight configurations for S1 and six configurations for S2, considering only those that are into the critical range (i.e., those combinations of 3, 4 and 5 indices).
Table 3 shows the aggregated data at the nation level. In this way, 1808 Municipalities were selected for S1 and 1430 Municipalities for S2, which represent, respectively, 22% and 18% of all Italian municipalities. The values of the area concerned vary from 70 to 75 km2 and intercept a range between 23.5% and 25% of the national territory. As for the population concerned, the percentage varies between 3.3% and 3.5% with a number of inhabitants that stands at around 2 million for both simulations.
The results of the work were subsequently aggregated on a regional scale as reported in Table 4, Table 5 and Table 6. Moreover, for the regions, parameters were calculated such as: Number of municipalities, municipality surface, percentage of regional area, inhabitants and percentage of regional population. The S2 simulation was deliberately forced on the economic parameter (IndB2) compared to the S1 (IndB), therefore it clearly expresses the distribution of local realities characterized by a high economic crisis.
The results obtained for the two simulations underline that about one-fifth of the country is in a demographically and economically less-favoured condition. Molise, Basilicata and Aosta Valley regions embody the highest percentage of regional population involved in the less-favoured condition as expressed in Law n. 158/2017. In particular, Molise’s intercepted inhabitants in S1 (90,042) represent 29% of the regional population. This percentage is comparable to Lombardy’s result, despite the fact that the same number of inhabitants represents only 1% of the regional population. Similarly, Sardinia and Calabria show more than 210,000 inhabitants affected by marginality. Following them are Abruzzo and Trentino–South Tyrol with 10% of the population. On average, the parameter considered does not exceed 5% elsewhere. Considering the percentage regional area parameter, the same observations remain valid.
4. Discussion
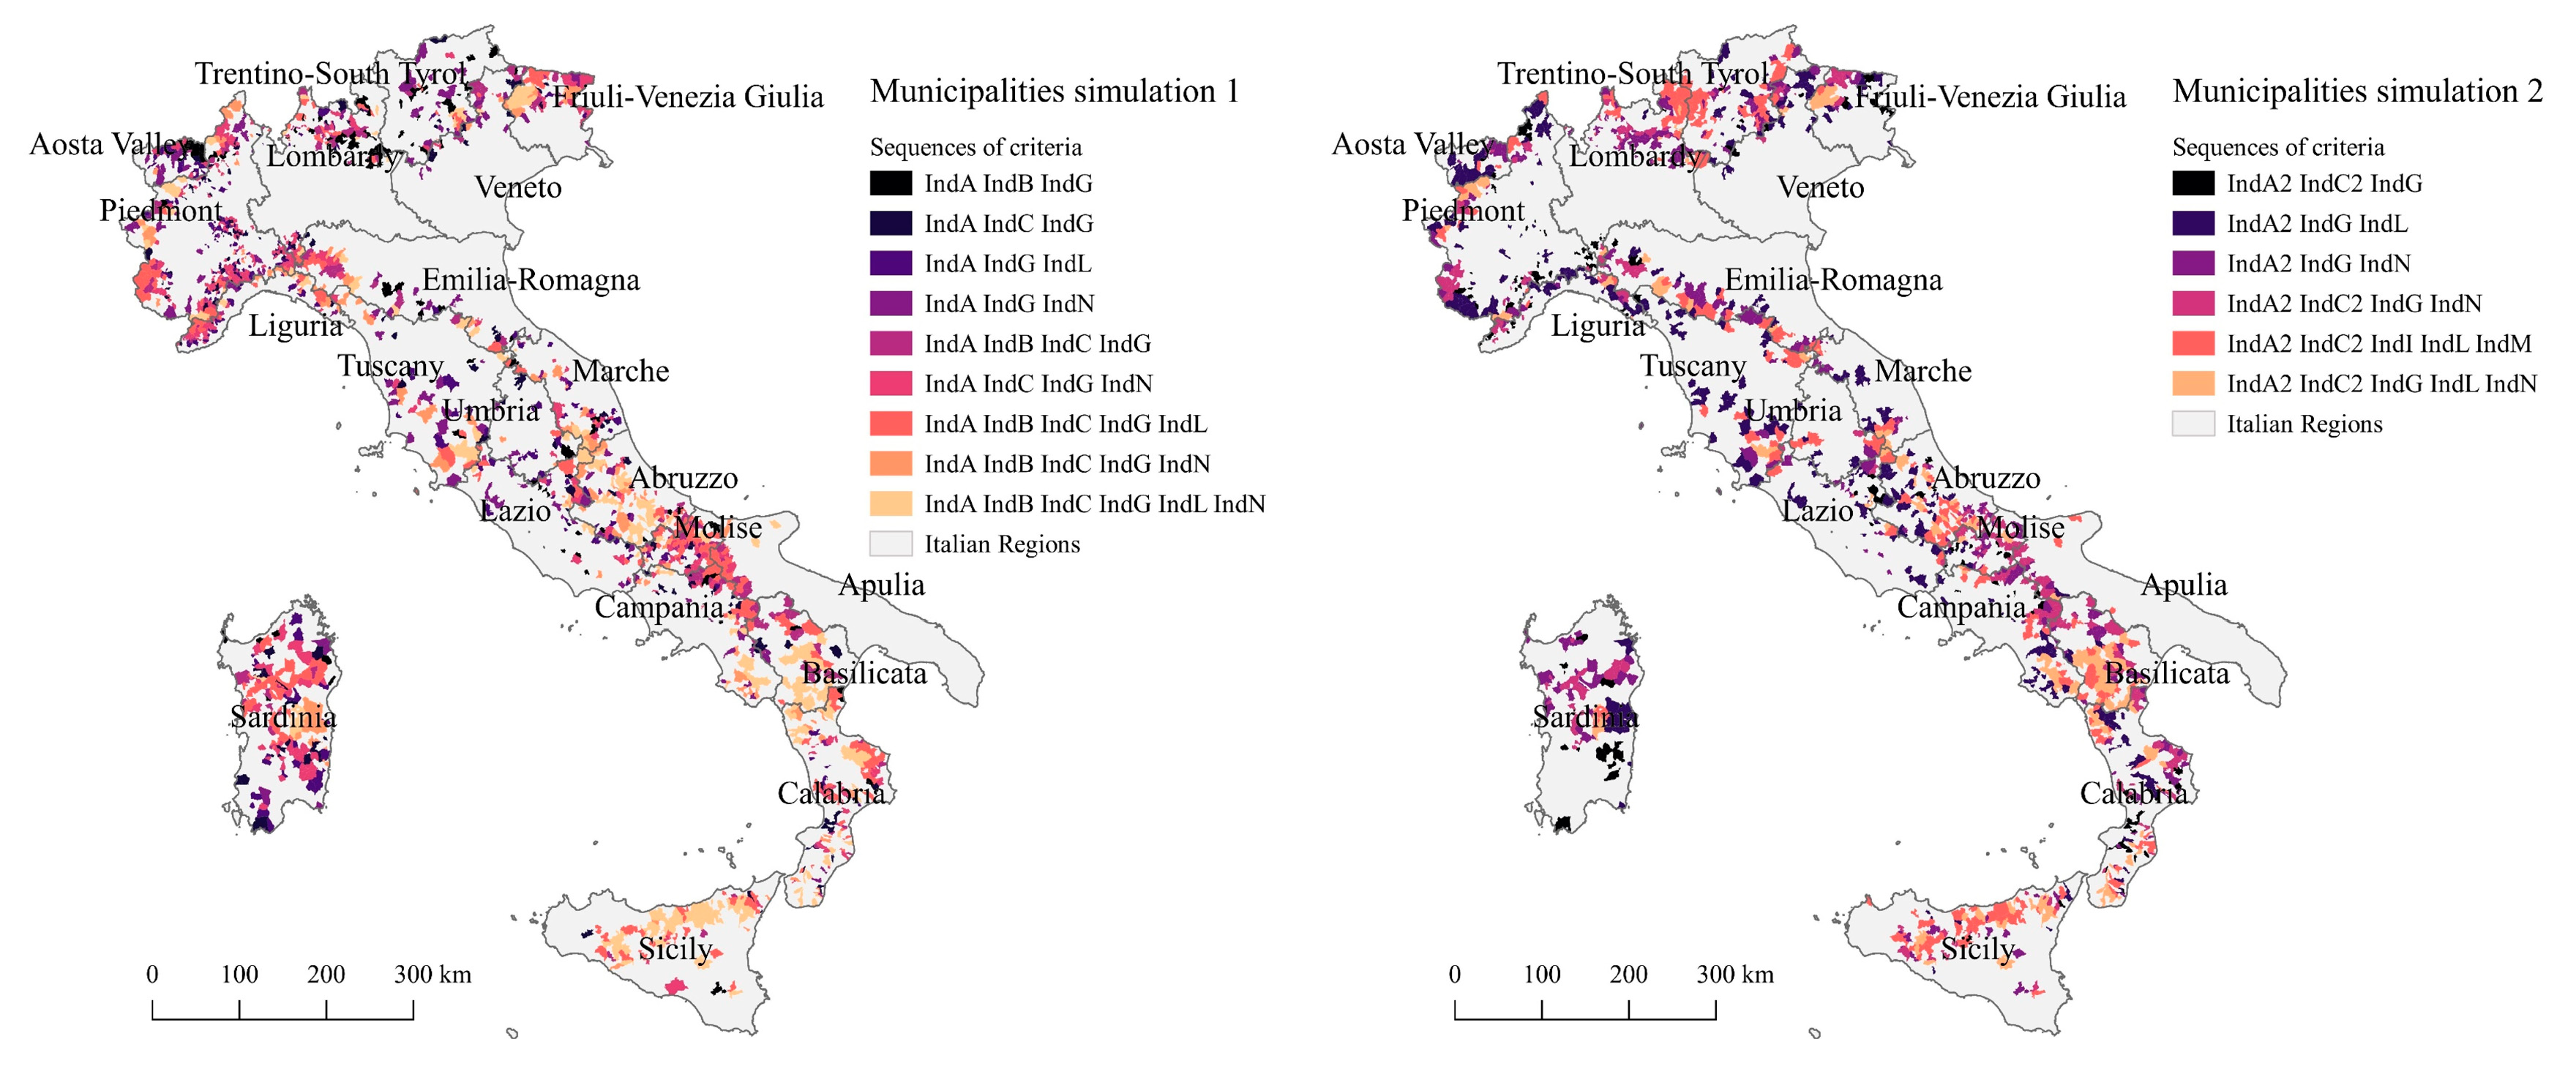
By comparing the two simulations, a general contraction of analysed values in S1 and S2 can be noted. Exceptions are Lombardy and Veneto, where results are stable in both simulations. In these regions, small municipalities in a less-favoured condition have low incidence in the regional system. Instead, variations are assimilated from territorial contexts, which have particularly advanced socio-economic conditions with regard to the national level. Against the trend, some other regions such as Basilicata and Trentino–South Tyrol show raised parameters in S2. In general, those are contexts to be explored in depth in order to understand possible causes of such diversities and their correlation to marginality. From the results of the previously developed analysis, it is also possible to identify some critical districts with territorial continuity (Figure 7). The first area includes Abruzzo, Molise, Campania, Basilicata and Calabria, which actually constitute a macro region (Macro region 1). The macro region covers 27,000 Km2 in S1 (21,500 Km2 in S2) and it involves around 920,000 inhabitants (741,000 in S2). The most evident results are varied: Firstly, the high quantity of intercepted inhabitants, equal to half of the total population considered in the simulations; secondly, municipalities highlighted in the simulations constitute 50% of those initially selected based on Law 158/2017. In addition, the major part of the areas identified in the first district concerns peripheral and ultra-peripheral areas. These areas are the most affected by persistent difficulties in accessing services and lack of energy in economic processing.
The second district (macro region 2) is composed of Piedmont, Aosta Valley, Liguria and Emilia Romagna. While a much smaller surface is covered (around 15,000 Km2), here the quantity of population involved is significantly less than the previous, which means 8−9% of the total population in the macro region in its entirety.
The third district is composed of Friuli–Venezia Giulia, Veneto, Trentino and Lombardy (macro region 3). This case provides a clear gap compared with previous macro regions. Indeed, results from both simulations do not produce relevant variations in terms of involved inhabitants and implicated municipalities. Quite the opposite, the criteria alternation does not produce remarkable results. Values analysed remain nearly the same, despite any criteria variation. The presence of a lower level of marginality should represent a reason. On the contrary, a notable level of marginality is relevant in macro region 2. The driving force of the regional economies (macro and micro economies) probably partially help to balance the problem of progressive abandonment of the territory. Moreover, the third district is composed of a larger number of municipalities in the intermediate areas, and then the less disadvantaged [15]. Therefore, territorial diversity that affects the districts is a main factor. It has a high-impact role in funds management and then it influences the common agricultural policy’s effects on local socio-economic development [30,31]. With equal Utilised Agricultural Area (UAA), intermediate areas spend in CAP (Common Agricultural Policy) per hectare 33% more than peripheral areas and 92% more than ultra-peripheral areas [32]. It should be noted also that peripheral and ultra-peripheral areas in the first district are part of less developed regions (in detail, Basilicata, Campania, Calabria, Sicily and Puglia, with Gross Domestic Product (GDP) per person less than 75% of the EU-27 average) and regions in transition (in detail, Abruzzo, Molise and Sardinia, with GDP per person between 75% and 90% of the EU average).
According to the criteria of Law n. 158/2017, the attempt to quantify the degree of disadvantages that affects local communities represents a first analytical approach to evaluating the intervention priorities of regulatory instruments and national strategies. This approach involves a profound change of attitude that requires the transition from one model based on equality to another model based on equity. To apply this approach to the simulation carried out, and therefore considering the municipalities in the critical range as a priority, it could be assumed to allocate the entire budget of 2017−2020, which is equal to € 85 million, only for these selected municipalities. In this case, for each of them the economic support would be around € 60,000 in five years (considering the 1430 municipalities resulting from S2). The concentration of resources, obtained following a priority model, increases the economic availability for each municipality selected, but it cannot be the only solution. The economic support, even if assigned on the basis of priorities, does not guarantee the maintenance of the minimum vital conditions through small interventions because local resources, for the maintenance of the minimum functions and for the regulation of the settlement structure, would continue to be insufficient.
Unfortunately, since the 1960s and the 1970s, strong internal migratory flows caused a large gap between urban growth and depopulation. This process has bequeathed very high public costs to the country, and the generalized forms of economic support implemented so far have proved to be insufficient.
5. Conclusions
The proposed study is a further confirmation that Italy is a deeply divided country, highly disconnected and lacking a strategic plan of intervention for economically disadvantaged areas. These areas are largely composed of small municipalities. Municipalities that currently represent the suburban zones of the main metropolitan areas are exceptions and, as has already been verified, they are mainly concentrated in northern Italy. Moreover, both simulations show a significant convergence and show that most of the municipalities, which do not match any of the legal criteria, are distributed longitudinally in northern Italy. This highlights that the definition of “small municipality”, i.e., the municipalities with a population less than or equal to 5000 inhabitants, is an unsatisfactory threshold for evaluating the access to public funds for economic support. Figure 2 shows that the same considerations are still relevant also for all municipalities that match a single legal criterion.
Analytical identification of a critical range, following the procedure proposed in this paper, confronts us with important questions. The first issue relates to the need to clarify what are the criteria that clearly define the socio-economically less-favoured conditions of small Italian municipalities. Hydrogeological instability, as demonstrated, is a problem affecting most of the national territory; therefore, it is not a specific criterion. Similarly, low residential density does not necessarily correspond to a penalizing factor but can certainly be considered a minor criterion. Furthermore, some criteria, such as (b) (municipalities affected by strong economic backwardness), are difficult to quantify since such general definitions identify a very wide range of values. Therefore, although eight out of 12 criteria were considered for the analysis, their ambiguous nature does not allow a clear and defined diagnosis of the problems of inner areas. Another issue concerns the thresholds beyond which economic support to small municipalities can still be considered acceptable. The National Strategy for Internal Areas defines the same thresholds as fundamental elements for the economic development of the entire country. However, what is the limit beyond which economic measures in favor of a territory are unproductive in view of a possible recovery? This question is legitimate considering that state measures, such as Law n. 158/2017, are for sustenance but non-structural. In other terms, such measures should instead act on administrative and economic reorganization of small municipalities in order to trigger some recovery dynamics. The strategies of SNAI focus on an increased centrality of the role of local actors, mediated by the regional and national level in a multi-governance model, simultaneously providing essential services and fostering local development [33].
Defining the critical range with more accuracy could be a first step towards evaluating different tools (structural or supportive) according to well-defined difficulty thresholds. Rather than a single answer to the policy problem, different sets of argument ideas should be associated with different design, producing different types of intervention [34]. Furthermore, it is necessary to identify a new territorial dimension of economically depressed territories in order to develop effective intervention policies.
Author Contributions
Conceptualization, A.M.; methodology, A.M., L.F. and C.D.D.; validation, F.Z. and L.F.; formal analysis, A.M., L.F. and F.Z.; investigation, A.M., L.F., C.D.D. and F.Z.; original draft preparation, A.M..; review and editing, L.F. and C.D.D. All authors have read and agreed to the published version of the manuscript.
Funding
This research received no external funding.
Acknowledgments
We thank for his precious collaboration Giovanni Domenico Di Girolamo, Department of Information Engineering, Computer Science and Mathematics of the University of L’Aquila.
Conflicts of Interest
The authors declare no conflicts of interest.
References
- Basile, G.; Cavallo, A. Rural Identity, Authenticity, and Sustainability in Italian Inner Areas. Sustainability 2020, 12, 1272. [Google Scholar] [CrossRef] [Green Version]
- Prezioso, M. Aree interne e loro potenzialità nel panorama italiano e europeo. Introduzione al tema. Geotema 2017, 3, 68–75. [Google Scholar]
- Eliasson, Å.; Jonesb, R.J.; Nachtergaelec, F.; Rossiterd, D.G.; Terres, J.-M.; Van Orshovene, J.; Van Velthuizenf, H.; Böttchera, K.; Haastrupa, P.; Le Basg, C. Common criteria for the redefinition of Intermediate Less Favoured Areas in the European Union. Environ. Sci. Policy 2010, 13, 766–777. [Google Scholar] [CrossRef]
- Dax, T. The Redefinition of Europe’s Less Favoured Areas. 2005. Available online: https://mpra.ub.uni-muenchen.de/id/eprint/711 (accessed on 25 March 2020).
- European Union Committee—Thirteenth Report: The Review of the Less Favoured Areas Scheme; House of Lord: London, UK, 2009.
- Gray, J. Less Favoured Areas in the European Union: Pretty and [Un]Economic Landscapes in the Scottish Borders. In Landscape, Heritage, and Conservation Farming Issues in the European Union; Stewart, P., Ed.; Carolina Academic Press: Durham, NC, USA, 2010; pp. 45–73. ISBN 9781594607745. [Google Scholar]
- Lazzeroni, M.; Bellini, N.; Cortesi, G.; Loffredo, A. The territorial approach to cultural economy: New opportunities for the development of small towns. Eur. Plan. Stud. 2013, 21, 452–472. [Google Scholar] [CrossRef]
- Rudow, K. Less Favoured Area payments—Impacts on the environment, A German perspective Agricultural Economics. Agricecon 2014, 60, 260–272. [Google Scholar] [CrossRef] [Green Version]
- Dax, T.; Hellegers, P. Policies for Less-Favoured Areas. In CAP Regimes and the European Countryside, Prospects for Integration between Agricultural, Regional and Environmental Policies; CAB International: Wallingford, UK, 2000; pp. 179–197. [Google Scholar]
- Pawlewicz, K. Differences in development levels of urban gminas in the Warmińsko-Mazurskie voivodship in view of the main components of sustainable development. In Bulletin of Geography. Socioeconomic Series; Szymańska, D., Środa-Murawska, S., Eds.; No. 29; Nicolaus Copernicus University Press: Toruń, Poland, 2015; pp. 93–102. [Google Scholar] [CrossRef] [Green Version]
- Harjunen, O.; Saarimaa, T.; Tukiainen, J. Political representation and effects of municipal mergers. Political Sci. Res. Methods 2019, 1–17. [Google Scholar] [CrossRef] [Green Version]
- Van Orshoven, J.; Terres, J.M.; Toth, T. Updated Common Bio-Physical Criteria to Define Natural Constraints for Agriculture in Europe. Definition and Scientific Justification for the Common Criteria; Technical Factsheets; Office for Official Publications of the European Communities: Luxembourg, 2012; p. 75, EUR 25203 EN–2012; ISBN 978-92-79-23066-0. [CrossRef]
- Bertolini, P.; Pagliacci, F. Quality of life and territorial imbalances. A focus on Italian inner and rural areas. Bio-Based Appl. Econ. 2017, 6, 183–208. [Google Scholar]
- Meloni, B. Aree Interne e Progetti D’area; Rosenberg & Sellier: Torino, Italy, 2015; p. 296. ISBN 9788878853720. [Google Scholar]
- Ministry of Economic Development. A Strategy for Inner Areas in Italy: Definition, Objectives, Tools and Governance; Materiali UVAL: Rome, Italy, 2014. Available online: http://old2018.agenziacoesione.gov.it/opencms/export/sites/dps/it/documentazione/servizi/materiali_uval/Documenti/MUVAL_31_Aree_interne_ENG.pdf (accessed on 20 February 2020).
- Lucatelli, S. La strategia nazionale, il riconoscimento delle aree interne. Territorio 2015, 74, 80–86. [Google Scholar] [CrossRef]
- Gubert, R. Il Ruolo Delle Comunità Montane Nello Sviluppo Della Montagna Italiana; Franco Angeli Edizioni: Milan, Italy, 2000; p. 432. ISBN 9788846420640. [Google Scholar]
- Bermond, R. L’avvenire Della Montagna. Dalla Legge 1102/71 Alla Direttiva CEE per le Zone Svantaggiate; Reda: Roma, Italy, 1977. [Google Scholar]
- Montani, A.R. Teorie e Ricerche Sulle Comunità Locali; Franco Angeli Edizioni: Milan, Italy, 2004; p. 176. ISBN 9788846426116. [Google Scholar]
- Boscariol, G.P. La legge n. 158 del 2017 sui piccoli comuni. Riv. Giuridica Del Mezzog. Trimest. Della Svimez 2018, 1, 203–238. [Google Scholar]
- Carbonara, S.; Stefano, D. An Operational Protocol for the Valorisation of Public Real Estate Assets in Italy. Sustainability 2020, 12, 732. [Google Scholar] [CrossRef] [Green Version]
- Romano, B.; Zullo, F.; Fiorini, L.; Marucci, A. Molecular no Smart-planning in Italy 8000 Municipalities in Action throughout the Country. Sustainability 2019, 11, 6467. [Google Scholar] [CrossRef] [Green Version]
- Punziano, G. Salute, mobilità, istruzione: Strategie per le aree interne. Ital. J. Reg. Sci. 2019, 1, 65–92. [Google Scholar]
- Romano, B.; Fiorini, L. Abbandoni, costi pubblici, dispersione. Alla ricerca di risposte migliori. Sentieri Urbani 2018, 26, 66–73. [Google Scholar]
- ISPRA. Dissesto Idrogeologico in Italia: Pericolosità e Indicatori di Rischio—Rapporto 2015; ISPRA: Rome, Italy, 2015; p. 162. ISBN 978-88-448-0751-1.
- ISPRA. Consumo di Suolo, Dinamiche Territoriali e Servizi Ecosistemici. Rapporto 288/2018; ISPRA: Rome, Italy, 2018; p. 292. ISBN 978-88-448-0902-7.
- Hatzichristos, T. Delineation of Demographic Regions with GIS and Computational Intelligence. Environ. Plan. B Plan. Des. 2004, 31, 39–49. [Google Scholar] [CrossRef]
- Mollica, E. Valutazione degli investimenti sul territorio e strumenti GIS. Aestimum 2009, 32, 710–757. Available online: https://oaj.fupress.net/index.php/ceset/article/view/6489/6489 (accessed on 29 January 2020). [CrossRef]
- Romano, B.; Zullo, F.; Marucci, A.; Fiorini, L. Vintage urban planning in Italy: Land management with the tools of the mid-twentieth century. Sustainability 2018, 10, 4125. [Google Scholar] [CrossRef] [Green Version]
- Mantino, F. Employment effects of the CAP in Italian agriculture: Territorial diversity and policy effectiveness. Eurochoices 2017, 16, 12–17. [Google Scholar] [CrossRef]
- Galluzzo, N. A long-term analysis of the common agricultural policy financial subsidies towards Italian farms. Ukr. J. Vet. Agric. Sci. 2019, 2, 12–17. [Google Scholar] [CrossRef]
- Sotte, F. La PAC e Le Aree Interne. Agriregionieuropa anno 12 n°45, Associazione Alessandro Bartola. 2016, pp. 20–22. Available online: https://agriregionieuropa.univpm.it/it/content/article/31/45/la-pac-e-le-aree-interne (accessed on 17 March 2020).
- Urso, G. Polycentric Development Policies: A Reflection on the Italian “National Strategy for Inner Areas”. Procedia Soc. Behav. Sci. 2016, 223, 456–461. [Google Scholar] [CrossRef] [Green Version]
- Peters, B.G. Advanced Introduction to Public Policy; Edward Elgar Publishing: Cheltenham, UK; Northampton, MA, USA, 2015; p. 224. ISBN 978-1781955772. [Google Scholar]
Figure 1.
Municipalities selected from Law n. 158/2017. Basemap by © OpenStreetMap contributors.

Figure 2.
Flow chart of the implemented methodology.

Figure 3.
Script implemented in MATLAB software.

Figure 4.
Number of criteria met in simulation data S1 and S2.

Figure 5.
Comparative analysis of the simulation results.

Figure 6.
Plot of significant sequences for S1 (a) and S2 (b).


Figure 7.
Spatial distribution of sequences.


Table 1.
Selected criteria for each municipality.
| Municipalities | IndA | IndB | IndC | IndG | IndI | IndL | IndM | IndN |
|---|---|---|---|---|---|---|---|---|
| Municipality 1 | 0 | 0 | 1 | 0 | 0 | 0 | 1 | 1 |
| Municipality 2 | 1 | 0 | 0 | 0 | 0 | 0 | 1 | 0 |
| …… | …… | …… | …… | …… | …… | …… | …… | …… |
| Municipality i | 0 | 1 | 1 | 0 | 0 | 1 | 0 | 0 |
Note: 0 if the Municipality does not meet the reference criterion; 1 if the Municipality meets the reference criterion.
Table 2.
Degree of representativeness for Simulation 1 (S1) and Simulation 2 (S2) (a). Sequence configuration for S1 and S2 (b).
Table 2.
Degree of representativeness for Simulation 1 (S1) and Simulation 2 (S2) (a). Sequence configuration for S1 and S2 (b).
| (a) | |
| Municipalities with Populations Less than 5000 Inhabitants | 5482 |
| Total selected Municipalities for S1 | 4816 |
| Total selected Municipalities for S2 | 4626 |
| Number of Municipalities S1 with threshold 100 | 3339 |
| Number of Municipalities S2 with threshold 100 | 3760 |
| Threshold 100 for S1 | 70% |
| Threshold 100 for S2 | 82% |
| (b) | |
| Simulation 1 | Simulation 2 |
| IndA | IndA2 |
| IndG | IndG |
| IndL | IndL |
| IndA IndB | IndA2 IndG |
| IndA IndG | IndA2 IndI |
| IndA IndL | IndA2 IndN |
| IndA IndB IndG | IndA2 IndC2 IndG |
| IndA IndC IndG | IndA2 IndG IndL |
| IndA IndG IndL | IndA2 IndG IndN |
| IndA IndG IndN | |
| IndA IndB IndC IndG | IndA2 IndC2 IndG IndN |
| IndA IndC IndG IndN | IndA2 IndC2 IndI IndL IndM |
| IndA IndB IndC IndG IndL | IndA2 IndC2 IndG IndL IndN |
| IndA IndB IndC IndG IndN | |
| IndA IndB IndC IndG IndL IndN | - |
Table 3.
Aggregated results at national level.
| Simulation | Number of Municipalities | Municipalities Surface (Km2) | % National area | Inhabitants | % National Population | Population Change in the Last 20 Years | Population Change in the Last 50 Years |
|---|---|---|---|---|---|---|---|
| S1 | 1808 | 75,886 | 25 | 2,158,831 | 3.5 | −13% | −30% |
| S2 | 1430 | 70,839 | 235 | 1,992,370 | 3.3 | −11% | −27% |
Table 4.
Aggregated results at regional level, S1.
| Simulation 1 Italian Regions | Number of Municipalities | Municipalities Surface (Km2) | % Regional Area | Inhabitants | % Regional Population |
|---|---|---|---|---|---|
| Piedmont | 352 | 8516 | 34% | 200,702 | 5% |
| Aosta Valley | 39 | 1783 | 55% | 34,489 | 27% |
| Lombardy | 136 | 3464 | 15% | 101,216 | 1% |
| Trentino-South Tyrol | 61 | 2697 | 20% | 87,523 | 8% |
| Veneto | 38 | 1611 | 9% | 48,263 | 1% |
| Friuli V.G. | 49 | 2914 | 37% | 46,642 | 4% |
| Liguria | 78 | 2159 | 40% | 53,581 | 3% |
| Emilia Romagna | 48 | 3363 | 15% | 96,925 | 2% |
| Tuscany | 59 | 5134 | 22% | 122,966 | 3% |
| Umbria | 19 | 1247 | 15% | 37,525 | 4% |
| Marche | 54 | 2314 | 25% | 71,564 | 5% |
| Lazio | 75 | 3263 | 19% | 101,624 | 2% |
| Abruzzo | 121 | 4314 | 40% | 114,080 | 9% |
| Molise | 94 | 2796 | 63% | 90,042 | 29% |
| Campania | 102 | 3572 | 26% | 159,093 | 3% |
| Apulia | 26 | 1513 | 8% | 46,837 | 1% |
| Basilicata | 69 | 4413 | 44% | 121,094 | 21% |
| Calabria | 148 | 5184 | 34% | 210,050 | 11% |
| Sicily | 86 | 5381 | 21% | 179,859 | 4% |
| Sardinia | 154 | 10239 | 42% | 234,756 | 14% |
Table 5.
Aggregated results at regional level, S2.
| Simulation 2 Italian Regions | Number of Municipalities | Municipalities Surface (Km2) | % Regional Area | Inhabitants | % Regional Population | |
|---|---|---|---|---|---|---|
| Piedmont | 175 | 6639 | 26% | 105,711 | 2% | |
| Aosta Valley | 27 | 1594 | 49% | 29,369 | 23% | |
| Lombardy | 124 | 4211 | 18% | 122,720 | 1% | |
| Trentino-South Tyrol | 85 | 3966 | 29% | 122,495 | 12% | |
| Veneto | 37 | 1871 | 10% | 56,914 | 1% | |
| Friuli V.G. | 36 | 2213 | 28% | 38,127 | 3% | |
| Liguria | 52 | 1889 | 35% | 45,220 | 3% | |
| Emilia Romagna | 55 | 4033 | 18% | 119,064 | 3% | |
| Tuscany | 57 | 5524 | 24% | 125,754 | 3% | |
| Umbria | 15 | 1254 | 15% | 31,659 | 4% | |
| Marche | 34 | 1720 | 18% | 512,86 | 3% | |
| Lazio | 66 | 2975 | 17% | 84,804 | 1% | |
| Abruzzo | 110 | 4016 | 37% | 120,597 | 9% | |
| Molise | 60 | 1917 | 43% | 57,771 | 19% | |
| Campania | 98 | 3921 | 29% | 171,652 | 3% | |
| Apulia | 21 | 1219 | 6% | 39,393 | 1% | |
| Basilicata | 78 | 5004 | 50% | 140,077 | 25% | |
| Calabria | 128 | 5424 | 36% | 211,412 | 11% | |
| Sicily | 82 | 5232 | 20% | 184,659 | 4% | |
| Sardinia | 90 | 6218 | 26% | 133,685 | 8% | |
Table 6.
Aggregated results at macro regional level.
| Macro Region | Simulation | Number of Municipalities | Municipalities Surface (Km2) | Inhabitants | % Population | % Municipalities Sn/Municipalitie Law 158 |
|---|---|---|---|---|---|---|
| Macro region 1 | S1 | 646 | 27,173 | 921,055 | 14% | 54% |
| S2 | 495 | 21,500 | 740,902 | 13% | 48% | |
| Macro region 2 | S1 | 517 | 15,821 | 385,697 | 9% | 42% |
| S2 | 309 | 14,155 | 299,364 | 8% | 31% | |
| Macro region 3 | S1 | 284 | 10,686 | 283,644 | 4% | 21% |
| S2 | 282 | 12,261 | 340,256 | 4% | 21% |
© 2020 by the authors. Licensee MDPI, Basel, Switzerland. This article is an open access article distributed under the terms and conditions of the Creative Commons Attribution (CC BY) license (http://creativecommons.org/licenses/by/4.0/).
Share and Cite
MDPI and ACS Style
Marucci, A.; Fiorini, L.; Di Dato, C.; Zullo, F. Marginality Assessment: Computational Applications on Italian Municipalities. Sustainability 2020, 12, 3250. https://0-doi-org.brum.beds.ac.uk/10.3390/su12083250
AMA Style
Marucci A, Fiorini L, Di Dato C, Zullo F. Marginality Assessment: Computational Applications on Italian Municipalities. Sustainability. 2020; 12(8):3250. https://0-doi-org.brum.beds.ac.uk/10.3390/su12083250
Chicago/Turabian StyleMarucci, Alessandro, Lorena Fiorini, Chiara Di Dato, and Francesco Zullo. 2020. "Marginality Assessment: Computational Applications on Italian Municipalities" Sustainability 12, no. 8: 3250. https://0-doi-org.brum.beds.ac.uk/10.3390/su12083250
Note that from the first issue of 2016, this journal uses article numbers instead of page numbers. See further details here.