Access and Forms of Urbanity in Public Space: Transit Urban Design Beyond the Global North


1
Welsh School of Architecture, Cardiff University, Cardiff CF10 3NB, UK
2
School of Geography and Planning, Cardiff University, Cardiff CF10 3WA, UK
*
Author to whom correspondence should be addressed.
Sustainability 2020, 12(8), 3495; https://0-doi-org.brum.beds.ac.uk/10.3390/su12083495
Submission received: 5 March 2020
/
Revised: 20 April 2020
/
Accepted: 20 April 2020
/
Published: 24 April 2020
Abstract
:There has been an emerging interest in the study of urban design dimensions associated with Transit-Oriented Developments (TODs). However, addressing the question of how TOD principles laid out in the international literature can be explored in the context of the global South remains in an incipient stage. In this paper, we investigate the nexus between station walkable catchments and forms of urbanity around transit nodes by adopting an assemblage approach to cut across any separation of sociality and spatiality. Drawing on empirical research from two case studies in Tehran, this paper contributes to studies on transit urban design by developing two measures of accessibility—the Catchment of Accessible Public Spaces (CAPS) and Accessible Interfaces (AI). We found that the combination of high CAPS and high AI within a given time can enable streetlife intensity, which is also linked to a synergistic effect of a larger assemblage, including the number of entries and diversity of functions. We argue that a focus on both measures is critical to understand the performance and potential transformation of street networks in a TOD.
1. Introduction
A critical response to the challenge of transforming car-dependent cities has been to build dense, functionally mixed and walkable urban areas around transit nodes to reduce the reliance on the motorised private travel modes by making public transport more accessible—what can be broadly defined as Transit-Oriented Development (TOD) [1,2,3,4]. TODs are seen as significant contributors to successful urban design through interconnecting transport networks, built form, and functional mix at multiple scales as well as creating public spaces with a certain level of urbanity [5,6,7]. TODs then need to be considered as key nodes of local communities, a ‘place to be’ rather than only a ‘place to pass through’ [8]. This paper contributes to the emerging body of knowledge on transit-oriented urban design and engages with the following gaps in the related literature.
Much of the discourse concerning TODs in the academic literature has been at the scale of policy or planning [9,10]. There has been far less focus on urban design dimensions associated with TODs. Of the limited studies that have constructed a good foundation for ‘ideal’ TOD models, often with a practical interest in their possible application through urban design, many originate from the North American cities [1,5,6,11,12]. Developing such an understanding and specifying capacities for transformational change have also been identified as crucial in many cities beyond the West, particularly Asian cities [13,14,15]. There are limited empirical investigations in cities of the global South, which struggle with the challenges of coordinating rapid transit networks and walkable neighbourhoods [16,17,18,19,20,21]. The gap between mobilities and designing places around new and existing transport infrastructure in the global South has been further outlined in a recent study as well [22].
There have been a number of prescriptive studies of policies to date in relation to TODs. However, limited comparative and systematic studies appear with the focus on fine-grained urban design issues [7,12,23,24]. While these studies at urban design scale offer valuable insights on future TOD projects, emphasizing social, formal and functional diversities in the design process, their applicability beyond cities of the global North lacks empirical investigation. The mobility challenges in the rapidly urbanising cities are different from those in Western cities, and so are the challenges to integrating urban design issues and transport networks [17]. This is in part due to the issues of political economy, urban informality (e.g., street trading and informal transport within station areas) and socio-cultural contexts [17,25]. As argued by Ewing and Cervero [26], the 5 Ds—density (a measure of interest variable per areal unit), design (street network features in a given area), distance to transit (a measure of the average shortest walkable route from the living spaces or workplaces to the nearest station), destination accessibility (a measure of the ease of pedestrian access from any given location over a given time span) and diversity (a measure of different functions and the extent to which they occur equally in a certain territory)—have gained popularity over the past decade for investigating the ways in which built environment can have impacts on travel behaviour, especially in cities in the US. However, far less is known on this subject in more congested and less formal cities.
The main objective of this paper is to explore the relationships between station catchments (with a focus on the accessible public spaces and public/private interfaces within walking distance) and forms of urbanity within transit-oriented urban assemblages by drawing on empirical research in the context of global South. The key questions are the following: What are the existing morphologies in terms of accessible public spaces and urban interfaces within walkable proximity to metro stations? What are the existing forms of urbanity in station areas? What are the synergies between accessible public spaces and forms of urbanity within the walkable catchment of transit nodes?
1.1. Access Network
Accessibility answers the key question of how people navigate the urban movement network. Since urban morphology mediates flows, it is critical to understand the spatial structure of the access network. This is parallel to what Hillier [27] calls ‘movement economies,’ in which the visibility and nature of spatial relations condition movements, with the latter generating socio-economic activities. The correlation between the spatial configuration of the access network and urban movements contributes to socio-economic initiatives. At the neighbourhood scale, building footprints and public open space networks mediate walkable access. Marshall [28] outlines permeability as the degree to which a particular urban area is ‘permeated’ by publicly accessible space. This conception refers to the ease of pedestrian movement within the urban fabric and ensures that pedestrians have multiple route choices between any two places.
For Jacobs [29], access is more about the permeability enabled by ‘short blocks’, which mediates walkable access to diverse urban attractions; from her point of view, multiple options of public spaces with intensive interconnections encourage intensities of streetlife and economic productivity. Permeability is linked to the notion of ‘pools of use’ [29] to indicate the functions accessible within a walkable catchment of a specific location measured by time or distance. An effective urban pedestrian network is often normatively identified by block length of about 60–90 metres [30] and a maximum of about 100 metres [29]. Very small block lengths can also inhibit potentials for density and active urban frontages [31].
The early attempts to measure the accessibility of a pedestrian network incorporated the average block area [32,33,34], perimeter [35], length [36], diagonal [37] and the number of blocks within a given area. Other popular metrics for measuring the connectivity of the walkable environments indicate the total length of streets per area (or ‘network density’) [38] and the total number of intersections per area (or ‘intersection density’) [36,39]. The former has been criticised for not differentiating between various types of access networks in terms of their interconnectivity levels and the latter for not differentiating between various intersection types [31].
Another measure has been introduced by Pafka and Dovey [31] as the ‘area-weighted average perimeter’, which is calculated by multiplying each block’s perimeter by its area and then averaging the outcome across a given area. More recently, the method has been adopted within station areas to explore capacities of movement at the neighbourhood scale within metropolitan agglomerations [24]. This method considers both the block’s area and perimeter and minimises the impact of obscured long impermeable blocks in the average. To calculate permeability, dead ends need to be excluded from the analysis. Hence, urban morphologies with many dead ends will be treated the same as the ones with limited or no dead ends [25]. Since the method focuses on the impacts of block area and perimeter to describe a given area’s permeability, it is not possible to differentiate between various types of open space such as parks, lanes and streets. Focusing merely on permeability, especially around transit nodes, is not sufficient, given the fact that the level of permeability will be the highest within an area with no blocks. Pafka and Dovey [31] argued that any attempt to quantify permeability needs to consider measuring what they termed ‘interface catchments’ to understand the capacity of a pedestrian network to enable or inhibit access to urban attractions.
While there has been an emerging body of literature studying and measuring the accessibility of the station areas, less focus has been placed on detailed examination and calculation of access networks and walkability of neighbourhoods around transit nodes [12]. The spatial structure of access networks and their patterns of connectivity offer different densities of the interface between public spaces and various premises, and therefore different opportunities to walk from/to the major stations. Cervero and Gorham [40] argue that ‘transit neighbourhoods’, built in proximity to major rail stations with higher degrees of grid networks, encouraged more walking than did their car-oriented counterparts. Hence, people are less likely to use private cars and more likely to walk, cycle and use public transport in well-structured and more accessible street layouts. In another study, it has been found that rail-based accessibility is higher in the TODs with the concentration of jobs and inhabitants around transit network and in a lesser measure in neighbourhoods with a higher value of railway network connectivity [41]. While the morphological dimensions of permeability and pedestrian catchments would seem to be rather simple, the metrics applied to capture the spatial complexity of actual access networks vary across different studies.
The catchment is a primary focus of the studies researching the accessibility of TODs [23,42,43]. Pedestrian catchments or ‘pedsheds’ [44] are captured within a specific timeframe from a transit node to measure the station connectivity to the surrounding street network. A metric of pedshed is the total length of streets that are accessible within a given area or time from a specific location. This is often termed ‘metric reach’ [45]. A problem here is that the differentiation between a highway and a laneway is not identified. Porta and Renne [23] have mapped pedestrian catchments around transit nodes using 400-metre and 800-metre circles. In this study, the pedshed indicates the percentage of each circle that can be accessed based on street layouts and sidewalk connectivity [23]. This method treats all streets the same and does not take into account the effect of different block morphologies. Schlossberg and Brown [42] introduced a detailed method combining a visual spatial analysis along with a quantification of morphological characteristics to evaluate the walkability of TODs. This approach incorporates the classification of the access network, mapping catchments over 5 and 10 min from rail stations, and identification of impedances to pedestrian access to compare levels of accessibility in different TODs. Nevertheless, any approach for analysing access to transit must consider both time and space elements.
1.2. Forms of Urbanity in Public Space
An approach towards a TOD requires not only the integration of the built form to public transport but also the attainment of a certain degree of urbanity within public spaces around major transit nodes [5,46,47]. Public spaces serve as places where strangers often gather together and diversify the uses of the streets due to the flows of various public transport modes. Hence, exposure to new experiences and capacities of urbanity through a wide range of actions and appropriations is likely within station areas. This is particularly the case in the station areas of the global South cities where spontaneous activities such as street trading variously emerge from outside state control [48].
When urban public spaces are open to a wide range of actions beyond the ones intended, looseness is likely to emerge. It is often in these areas that cities exhibit the primary conditions of urbanity: freedom of use [49], accessibility and a diversity of users and uses [25]. For Franck and Stevens [50], the emergence of looseness is reliant on, firstly, individuals’ recognition of the possibilities in a public space, and secondly, the degree of spontaneity and creativity in making use of what is present and the possibilities for alterations to the existing elements in public space. People explore the potentials that are offered by the physical features of public space to structure their interactions in space; many fixed objects placed in a public setting for a specific purpose can make it possible to serve and stimulate others [51]. Fences, bollards and walls that are intended to constrain some particular behaviours can be leaned on, climbed over and appropriated to show goods and products for sale. This condition also creates looseness in space, which is linked to the affordances such boundaries may offer.
The concept of ‘affordance’ was coined by Gibson [52] to explain the links between physical features of an environment, the perception of those features and human action. Affordances are always there to be perceived by observers, whether the observers act on their perceptions or not [53]. As Heft [54] puts it, affordance may either encourage or constrain actions, without triggering a certain outcome. The role of urban design within the context of TODs is then to maximize affordances in public space rather than determining them [25,55]. According to the interactions between humans, the ‘richest’ affordance is the one offered by other humans—’behaviour affords behaviour’ [56]. Nonetheless, Gibson and much of the subsequent studies often focused on physical affordance, and thus social affordance remains subject to debate [53]. Different groups of users may observe and use urban spaces in ways that are beyond the expected norms.
It is critical to focus on how public spaces around major transit nodes are accessed, used and appropriated. Territorial claims are often made in the use of public spaces in two manners: control and contest. The idea of spatial control has been explored by Lynch [57], identifying different forms of spatial rights associated with the degree of spatial control: ‘presence’, ‘use and action’, ‘appropriation’ and ‘modification’. The right of presence is a precondition for the other three. Rights to action and appropriation are seen as seminal to the emergence of intensive streetlife as they are often associated with questions of socio-political freedom and contestation of formal and informal codes in public space. Control may not necessarily be in congruence with the users [57,58]. Public space is also a site of contested activities and meanings where a particular activity or a meaning can predominate. Spatial, behavioural and representational possibilities and constraints in public space often result from constant negotiations and contestations as users perform actions and as state authorities allow or forbid those actions [59]. With different people exercising control over the same space, contest and conflict among individuals and groups seem unavoidable. While the attainment of a certain degree of urbanity within station areas has been noted in the literature [17,46,47], there has been less scholarly focus on the empirical investigation of forms of urbanity emerging within public spaces around transit nodes. To bridge this gap, one of our particular interests in this paper lies in exploring existing forms of urbanity, particularly in relation to the questions of access, use and action within station areas.
2. Methods
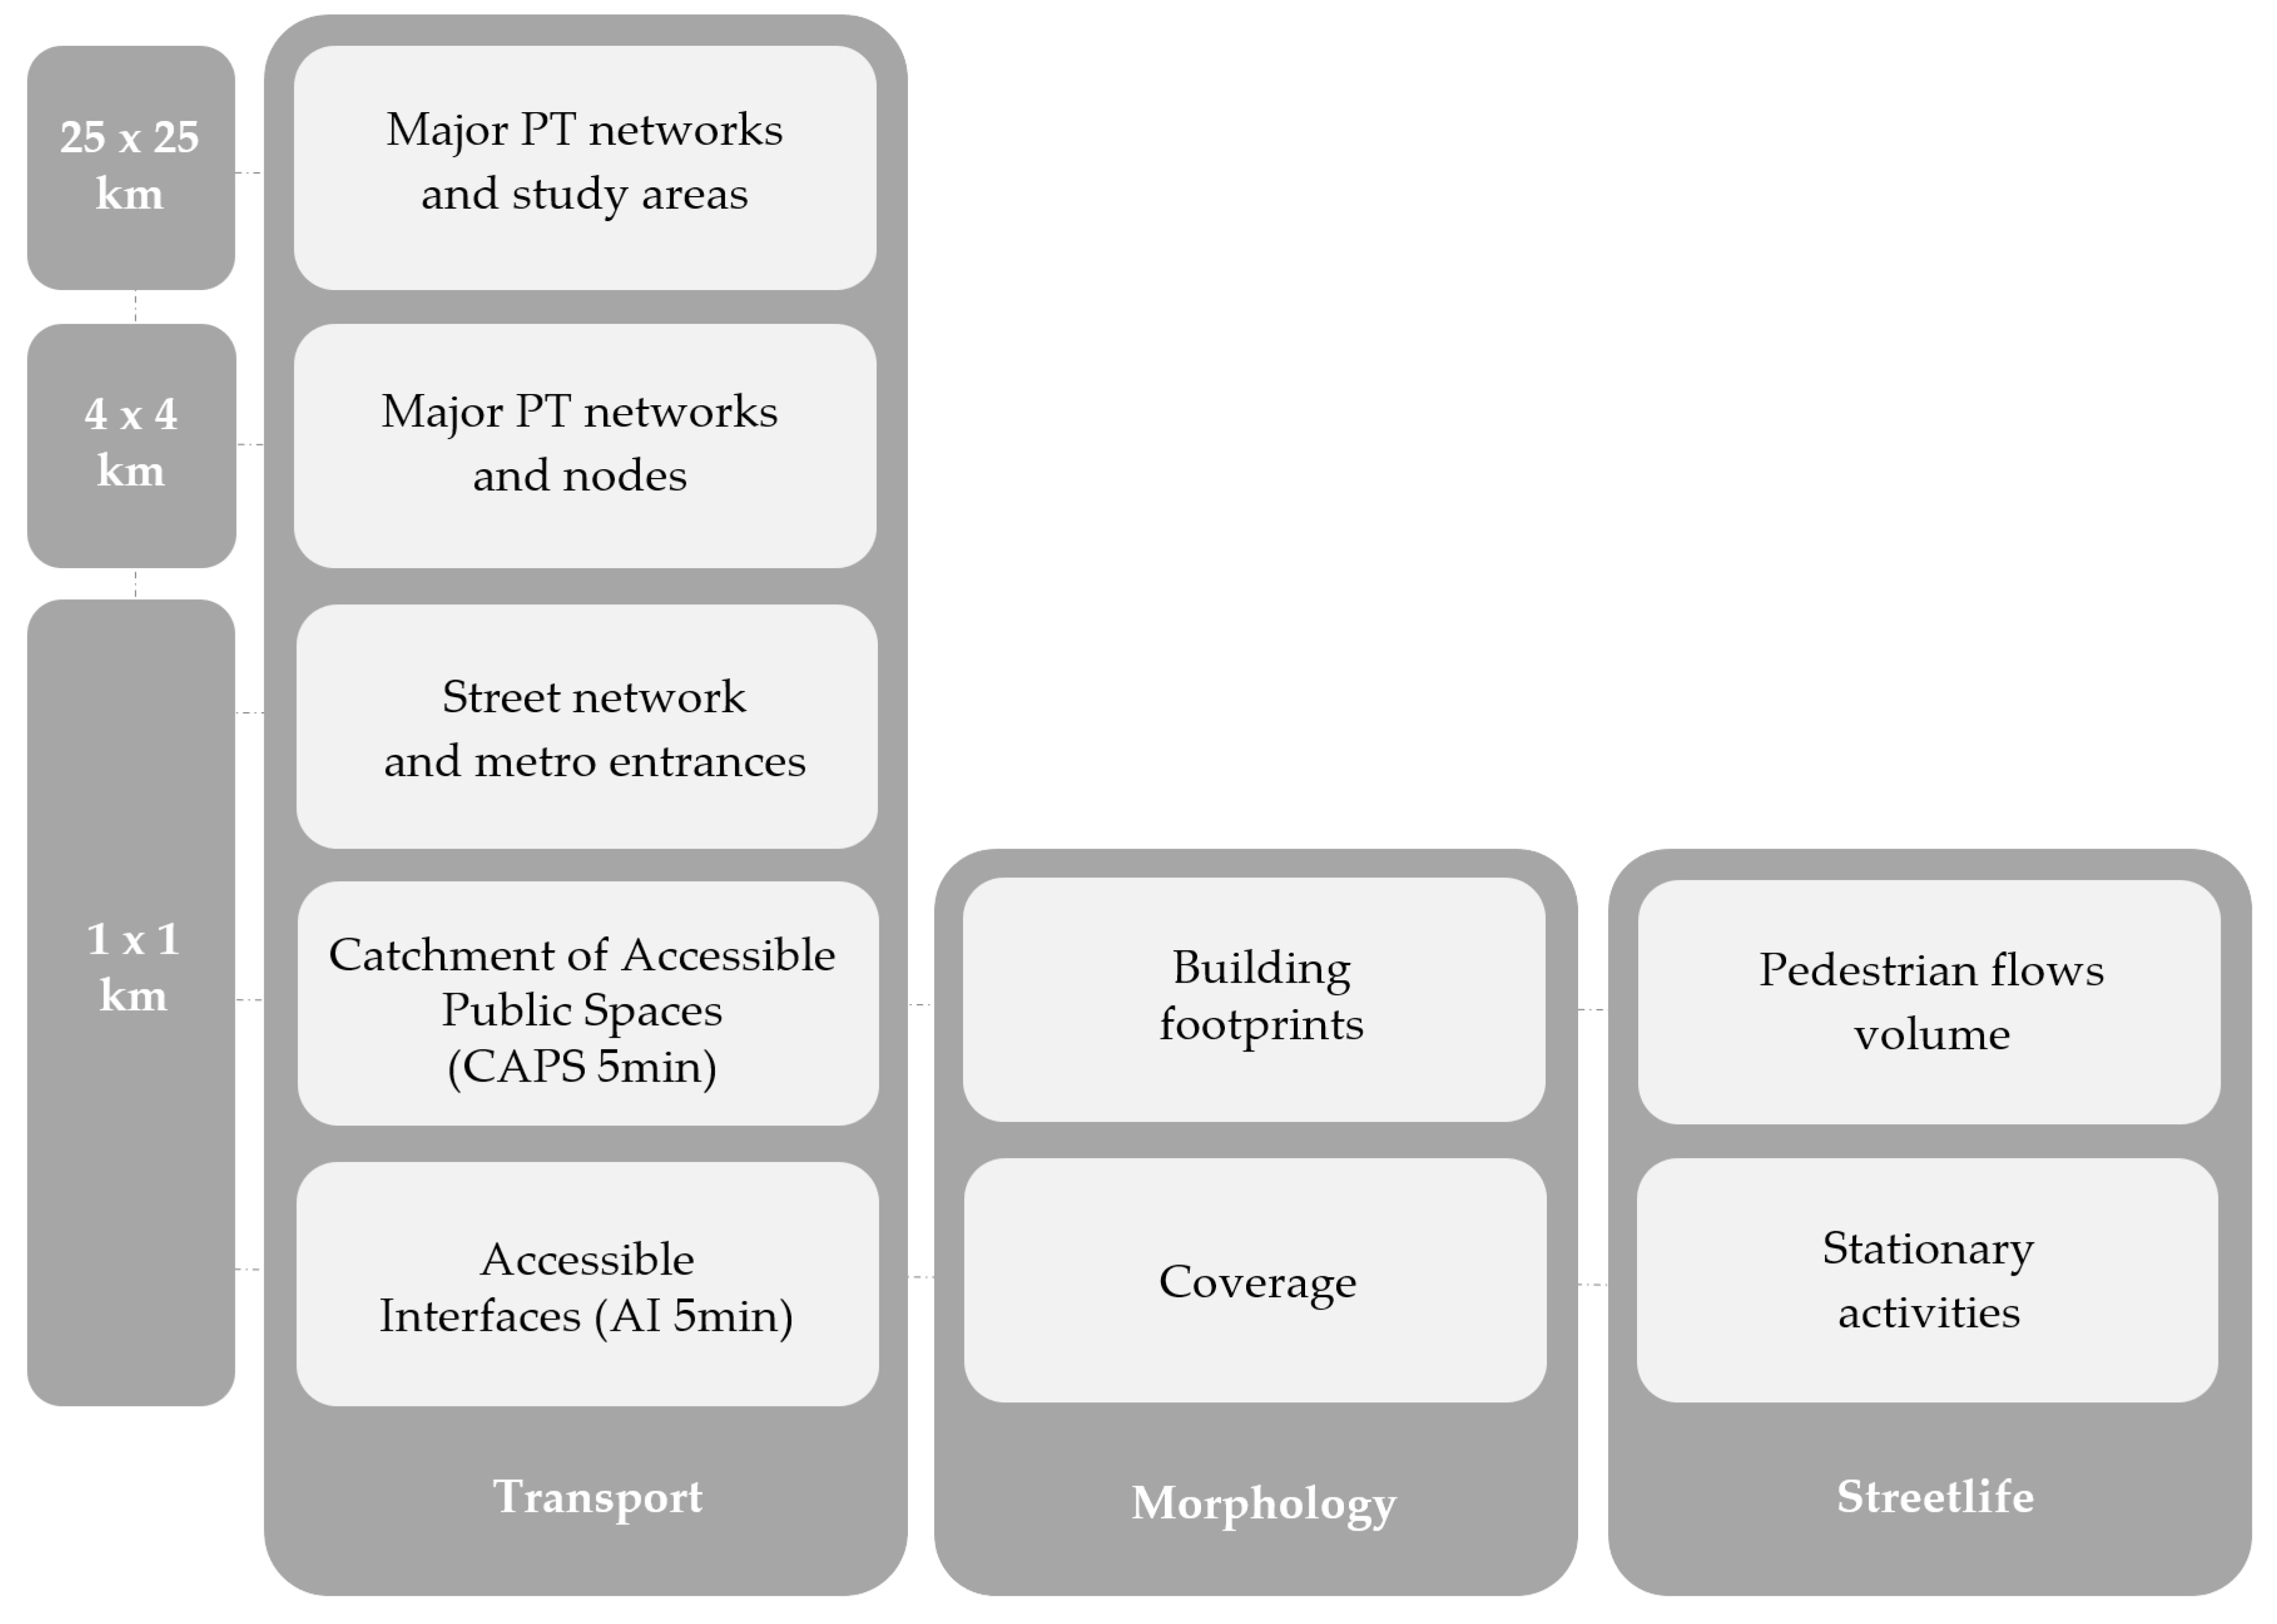
The methods of data collection and analysis incorporate non-participant observation, fieldwork notes, photographing, filming, archival records and urban mapping. The lack of publicly available data on study areas increased the importance of non-participant observation as a primary diagnostic tool. Non-participant observation [60,61,62] was also used to gather data on the volume of pedestrian flows within public spaces. Observations with the main purpose of counting have been traditionally used in the studies of time-geography to represent the ebb and flow of the spatiotemporal patterns of everyday activities [63,64,65]. This paper accumulates observation and counting of pedestrians passing the specified street sections (approximately 50 metres from each intersection, marked on a map before the fieldwork) during midday peaks on weekdays. For the aim of this study, total pedestrian flows in both directions were recorded. To compare the peak time pedestrian flows, a 10-min period was selected as a random sample. Behavioural observation was also used to capture stationary activities, including standing, sitting, informal trading, street performance and playing in public space during the midday peaks. Photographing and filming were used as supplementary methods to fill the possible gaps of direct observation [30,60,62]. The midday rush hour (12 p.m.–2 p.m.) represents Tehran’s peak of streetlife when there is a broad range of stationary activities [25]. In addition, exceptional high-peaks (intersecting metro lines) and low peaks (end lines) have been excluded. We used urban mapping as a primary method to enable comparative urban analysis across study areas and to understand how places work [66,67,68]. Figure 1 shows the diagram of urban mapping across different scales in this study.
To map the intensity of streetlife activities and the volume of pedestrian flows, the non-participant observational fieldwork was carried out between September and October 2014. The reason behind selecting the first months of autumn was to avoid the periods of unfavourable climatic conditions. Hence, this timeframe for fieldwork incorporated mild climate (i.e., without rain and strong wind) to minimise the short-term distortions or interruptions of pedestrian activity documentation, especially stationary activities. We also avoided large crowds caused by certain events (e.g., religious demonstrations) or annual rhythms (e.g., Nowruz Persian festival), which have impacts on the ordinary pattern of pedestrian movements and activities. Comparative study of pedestrian flows and streetlife activities over time (i.e., time of day, week and year with different weather conditions and temperature) was beyond the scope of this paper. The embedded study areas are analysed within a walkable catchment of stations to explore the questions of the access network, urban interfaces, and intensities of streetlife. The average radius of 400–800 m is recommended as an easily walkable scale for TODs [1,5], thus well framed by a square of 1 × 1 km.
To analyse access, we developed measures of the catchment of accessible public spaces (CAPS) and accessible interfaces (AI). The AI5min measure indicates the total length of public/private interfaces that can be reached from the metro station within a 5-min walking distance. This measure is similar to what is called ‘interface catchment’ (IC) [31], with a difference that it considers travel time instead of distance. Hence, it accounts for the micro-scale barriers in the total time period travelled. The CAPS5min measure used in this study indicates the total accessible public spaces for pedestrians, excluding the blocks, high-speed and high-volume road networks and impermeable open spaces. This measure is centred on metro stations and calculates the scope of the catchment by land area for a 5-min average walking time. This measure is adapted from the previously developed metric of IPCAs (impedance pedestrian catchment areas) [42]. We selected 5 min as an easy walking time as it corresponds to about 400–500 m average walking distance. It has been suggested that this average is highly reliant on the quality of pedestrian space [69] and its users [70].
For behavioural mapping, we focused on activities that encourage people to stay in public open spaces around stations as places to be rather than places to get to a destination. Such activities are often stationary in a way that can be considered as a kind of temporal appropriation of public space for possible face-to-face interactions between different humans and for stepping out from daily routines, possibly just for a short time. To analyse the collected data from observational fieldwork and visual recordings, we used dots with different colour codes based on various forms of stationary activities and the number of users engaged in public open space.
3. Study Area
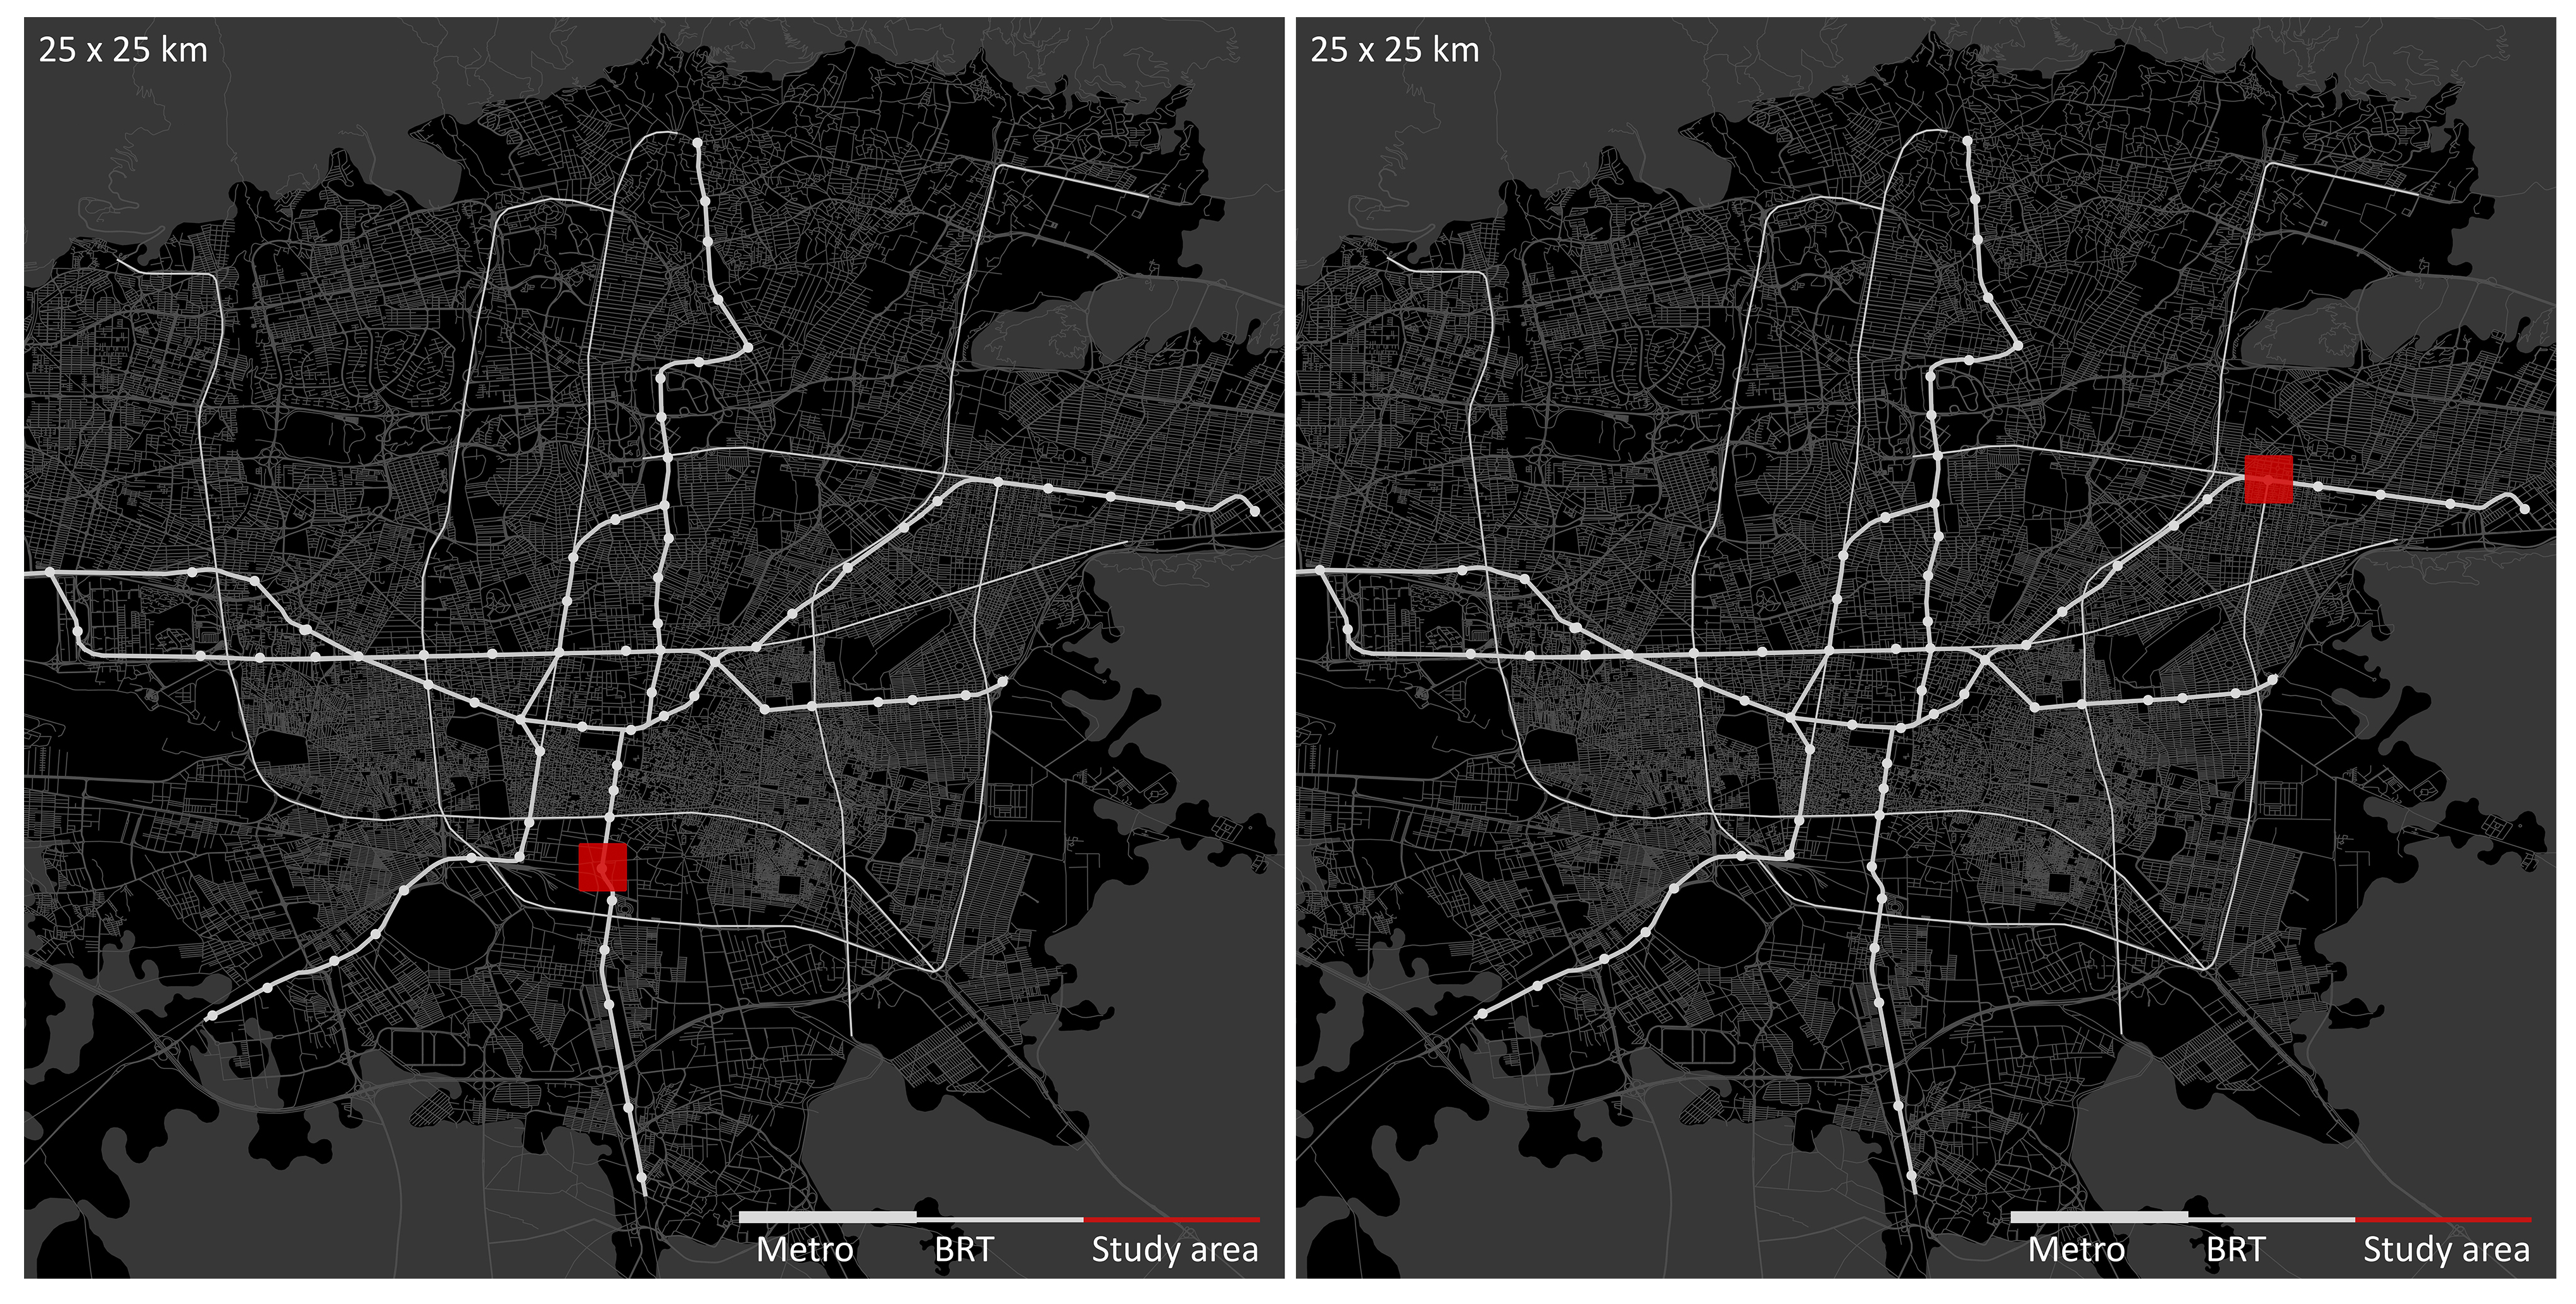
There has been an emerging view among urban scholars for reimagining the city by learning from the cities of the global South. This way of thinking argues against any attempts that have remained entrenched in studying the cities of the global North, which often act as a framework against which other cities are judged. The questions that become important are then related to the ways in which learning from cities beyond the global North can contribute to the debates in transit urbanism. Such cities, from Asian metropolises to small, rapidly urbanizing regional hubs in Africa, vary significantly in relation to transit mobilities and walkable urban form [22]. This degree of variation can complicate any generalisation about the global South or any categorisation into transit city types according to geography, urban morphology, size or intensification pattern. However, demonstrating trends by transit city type as well as categorising by urban morphology can not only outline some of such differences but also create a framework based on which mobilities and walkable station areas can be discussed in the global South. This research adopts an ‘information-oriented’ approach [71] for selecting Tehran as a ‘critical’ case in the context of the rapidly urbanising cities that face significant challenges of coordinating rapid transit networks and walkable neighbourhoods [72,73,74]. Two study areas were selected, comprising a 100-hectare district within walkable distance of the metro stations. This selection aimed at building a framework based on the ‘maximum variation’ rationale [71], incorporating a broad range of transport modes/networks, urban morphologies, and streetlife intensity. The study areas are located in different parts of the city (Figure 2)—Shoosh in the South and Sarsabz in the East. This links to how a north–south divide in Tehran has been manifested in its social and physical structures.
Tehran is home to about 9 million people within its main boundaries. The city exhibits a distinctive spatial structure, which is linked in part to its geographical, socio-political and historical context. Tehran’s spatial structure is expressed not only in its urban form and land use mix but also in its practices of everyday public life. For instance, the north–south downward slope has had major implications for the process of social stratification. This has been a long-established practice in Tehran’s spatial structure due to which the residents of the northern end of the city have often been privileged in terms of better access to urban resources and visual supremacy over the southern end [74]. The north–south divide also has reasserted itself in Tehran’s urban morphology. The northern edge of the city is dominated by large-grain single dwellings, high residential densities and high-rise luxury apartment buildings, tree-lined street networks, high green space concentration, modern facilities and infrastructure and a more diverse skyline [73,75]. By contrast, the south is located at the opposite end of the spectrum.
The metro system in Tehran has operated since the 1990s. However, metro ridership distribution varies markedly by station and time of the day. Local buses and minibuses travel in mixed traffic with cars. The bus rapid transit (BRT) network, inaugurated in 2008, plays an increasingly significant role in providing access across the city. The integration of transport and land-use development at metro stations has not been high on the agenda of local government [76]. The developments around key transit nodes have been notably constrained by the availability of TOD-supportive local policies and zoning [77]. Despite decades of planning regulations to address the problems of car dependency and low efficiency of public transport, the urban environments within walkable proximity to the metro stations have rarely been the focus of research. In what follows, we analyse the two embedded study areas (Shoosh in the South and Sarsabz in the East) in turn to explore the synergies between transit and forms of urbanity in public space around transit nodes.
4. Analysis
4.1. Shoosh (South)
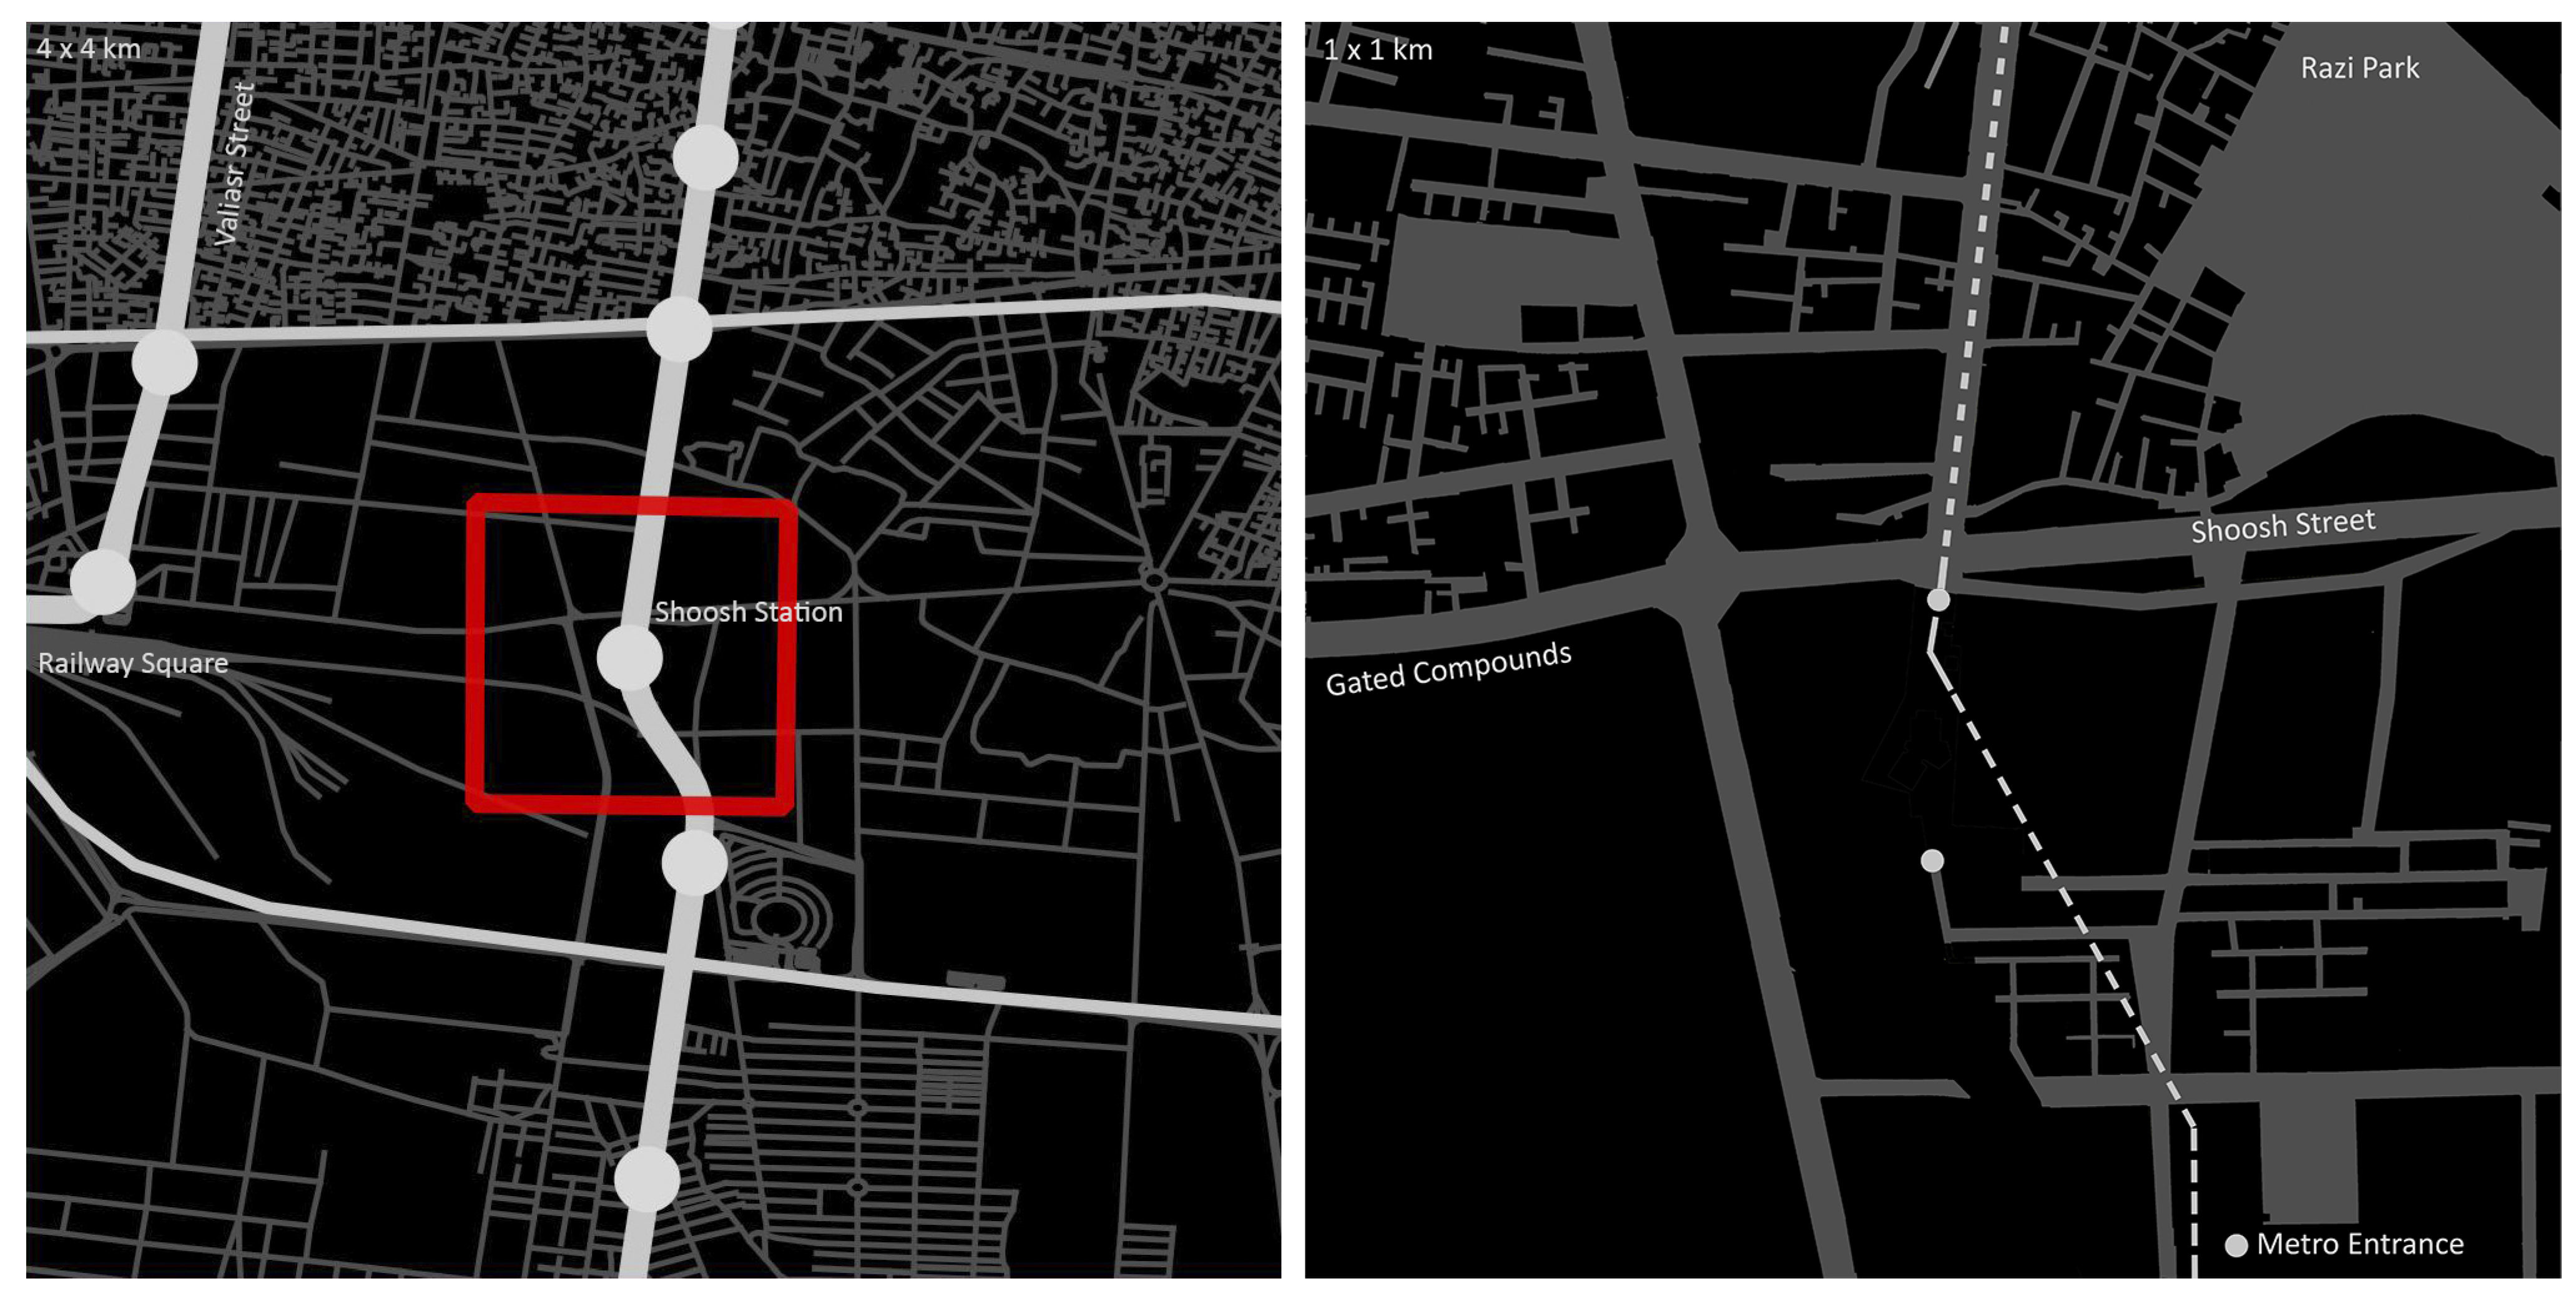
Shoosh station is located in the southern part of Tehran, about 1.5 km east of the city’s main railway station and less than 1 kilometre away from the southern terminal of the city, which operates as a key bus hub for intercity travel (Figure 3). The population density in the station area is lower than the average in the city, which is about 92 people per hectare [78]. To the southwest, Tehran’s main intercity train line passes through the area, adjacent to a large area of the train depot. While the reference area is close to Tehran’s beating heart, it is on the periphery of society. Its network of twisting lanes is generally filled with deprived and impoverished buildings occupied by lower-middle-class and working-class people; the poorer residents of the area, such as families of illegal immigrants and gipsies often squat in abandoned and dilapidated houses. It has been argued that this is a piece of the dysfunctional station area, often characterised by a low mix of mixes—mono-functional areas, low building and residential densities, the impermeable structure of urban spatial networks and low intensity of streetlife [25].
While historically the site’s development can be traced back to the 19th century, urban transformation in this part of the city has been considerably slow. This has also been evidenced within station areas. The key east–west arterial road within the reference area, Shoosh Street (Figure 3), runs along the southern section of the old city wall built in the 1880s. Following the rapid urban growth of the late 19th century, the construction works carried out in the city attracted a large number of unskilled labourers from the rural areas to the south of the city. Most of these new rural migrants remained in the lower stratum of the civil society, which was likely to have the greatest impact on the socio-spatial stratification of the capital. Due to the surge of migration in the 1920s and 1930s, many people, especially tradesmen, relocated to the northern and western suburban sections. Since then, the central and southern parts of the city have been subject to various degrees of deterioration.
4.1.1. Access
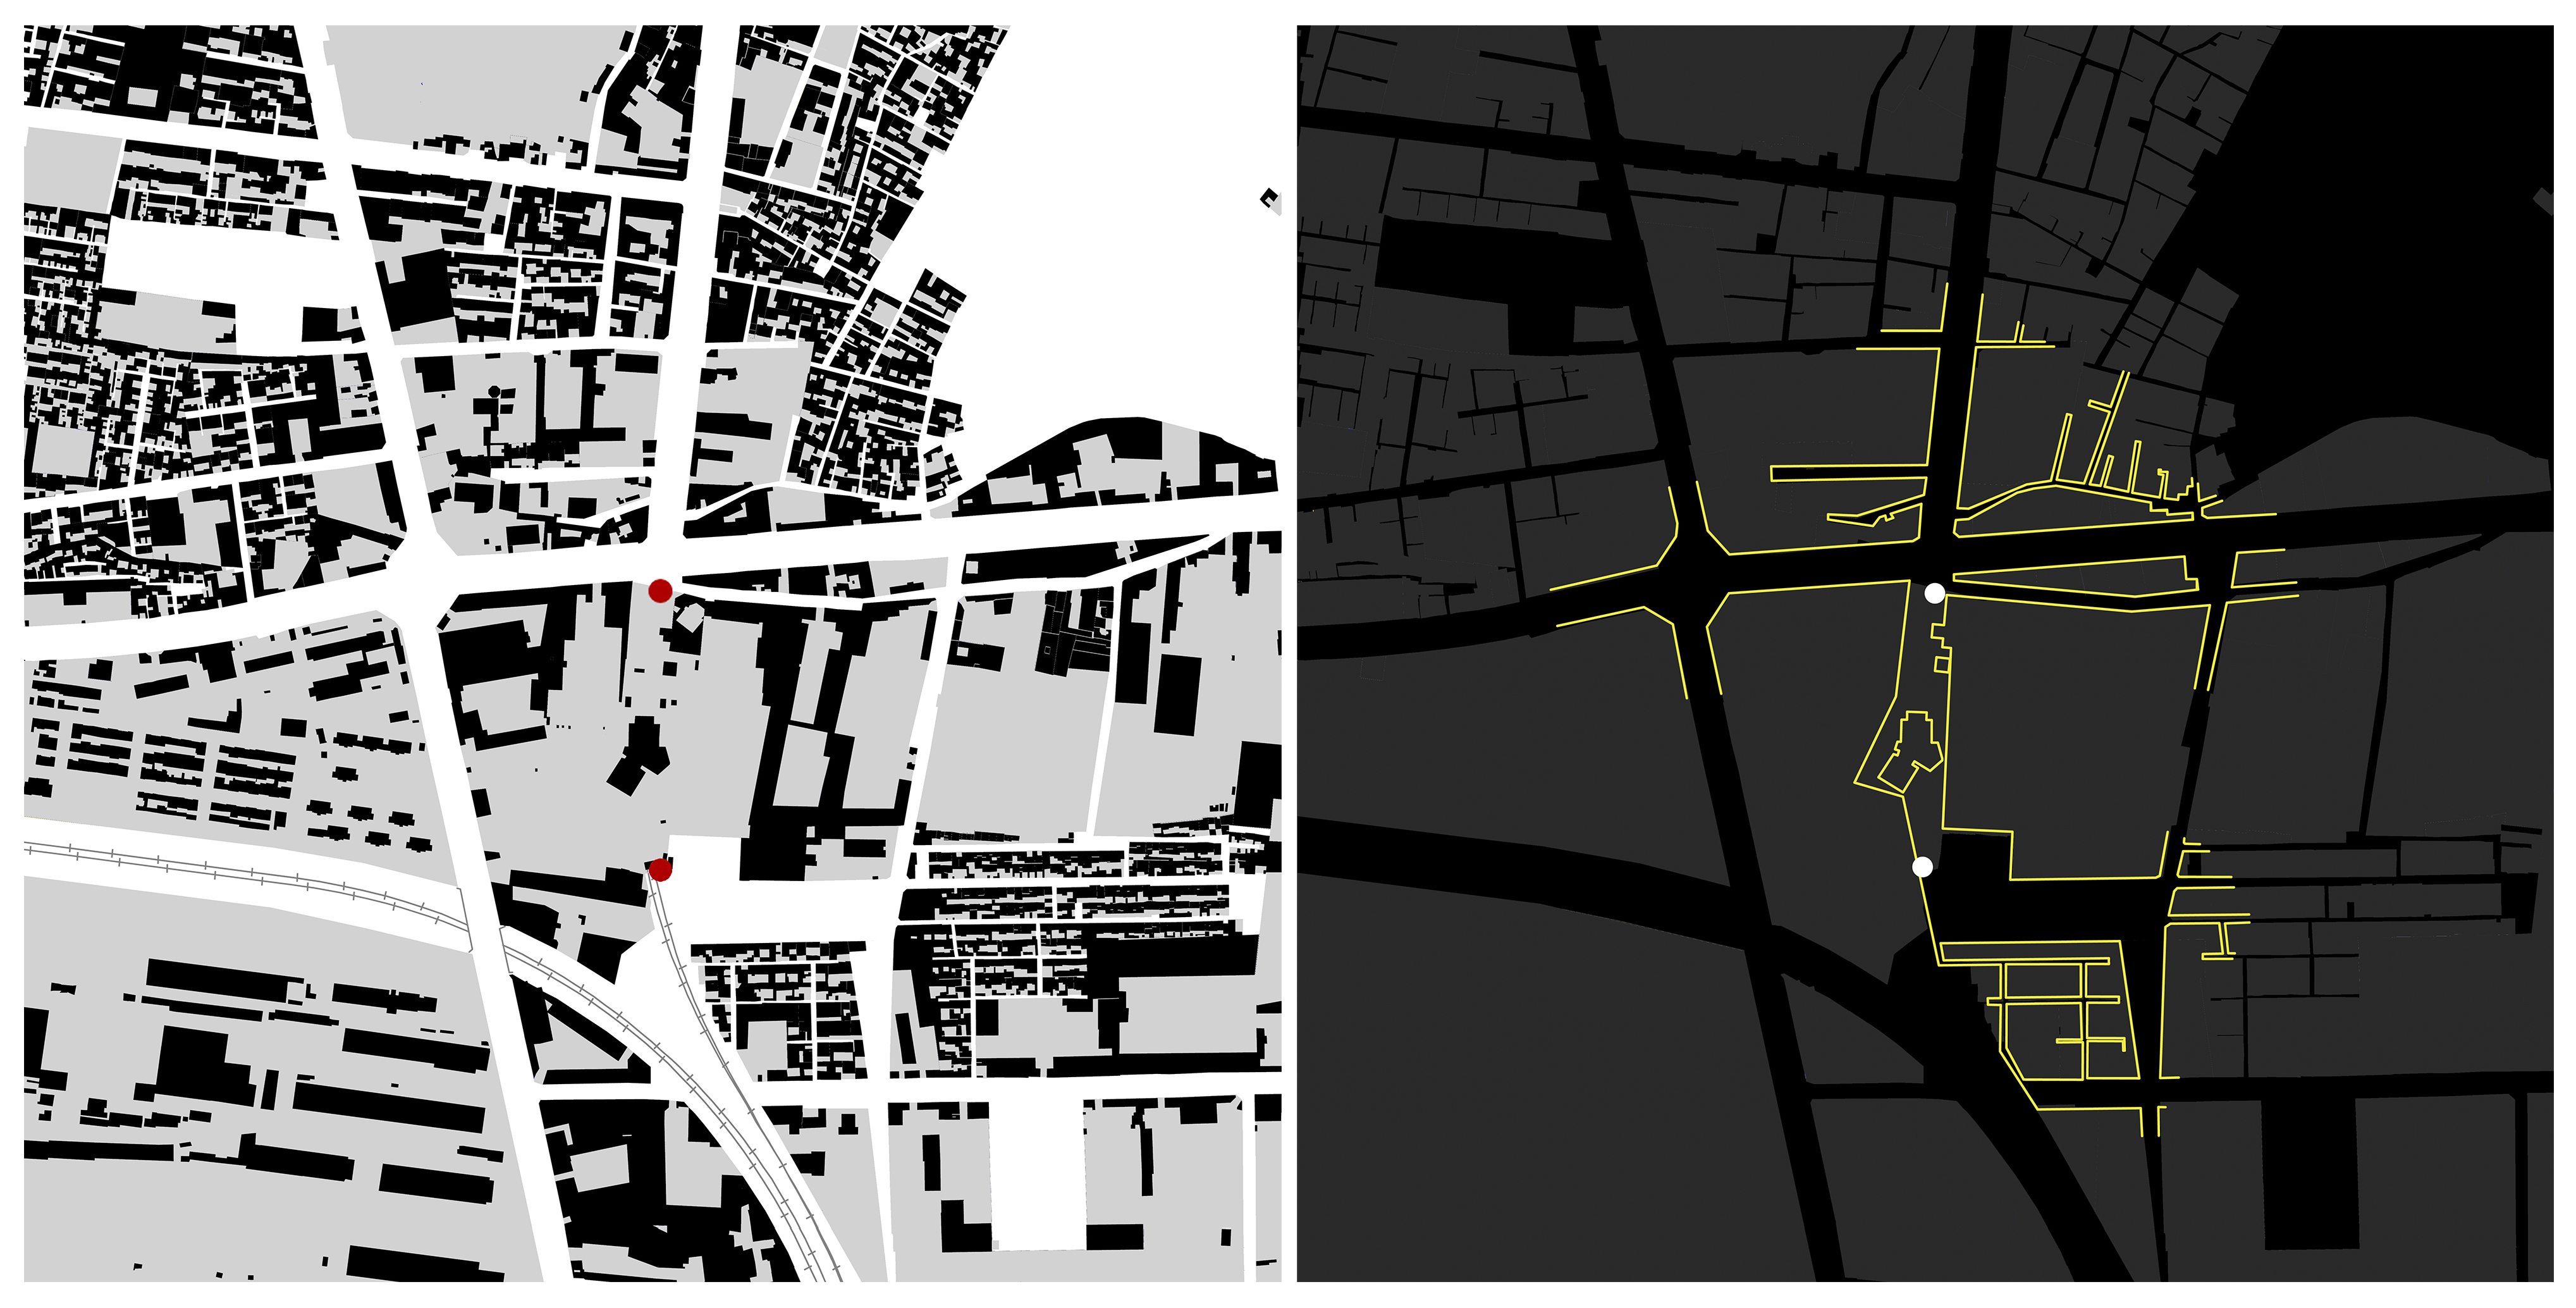
The accessibility from the Shoosh station to the surrounding areas is generally low, with the CAPS5min of about 6.5 hectares (Figure 4). The pedestrian network is disconnected between the north and south of the study area. The connection is facilitated over Shoosh Street by a bridge. However, the pedestrian bridge is rarely used, thus resulting in a large number of informal crossings along this axis. To the north, different areas connect through an irregular street network, including numerous dead ends and narrow lanes. Figure 3 shows a large park to the east of the northern half to which access is provided by some narrow laneways. If the analysis timeframe was extended to beyond 5 min to incorporate this large open space, this could increase the total value of CAPS within this station area. To the southwest, the impermeable network constrains pedestrian access from the metro station as a result of large gated compounds and a train depot. Urban blocks greater than 200 m in length mostly characterise the southern half of the station area, where the urban morphology is not permeated by publicly accessible space (Figure 4). The large gated compounds generally accommodate residential apartment buildings, which are poorly connected to the surrounding street networks. Thus, such areas, together with walled and impermeable blocks of industrial sites, act as cul-de-sacs in Shoosh’s urban fabric; they are obstructions to pedestrian traffic and accessibility to the major transit node. The total length of public/private interfaces that can be reached over a 5-min time range (AI5min) from the station is about 7320 m (Figure 4), which is linked to the low capacity of the urban fabric to incorporate a mix of attractions (e.g., entries to buildings with mixed functions).
The street layout in the station area includes street widths varying between 2.5 and 30 m, with some exceptions of less than 2 m wide. The connections with the most common patterns of dead ends and narrow laneways predominate the northern half of the study area. The dead ends are not often accessible to cars. Traffic on many streets is one-way, and few of these streets partially incorporate dedicated lanes for local buses passing in opposite directions. However, other buses run in mixed traffic with cars on the main streets.
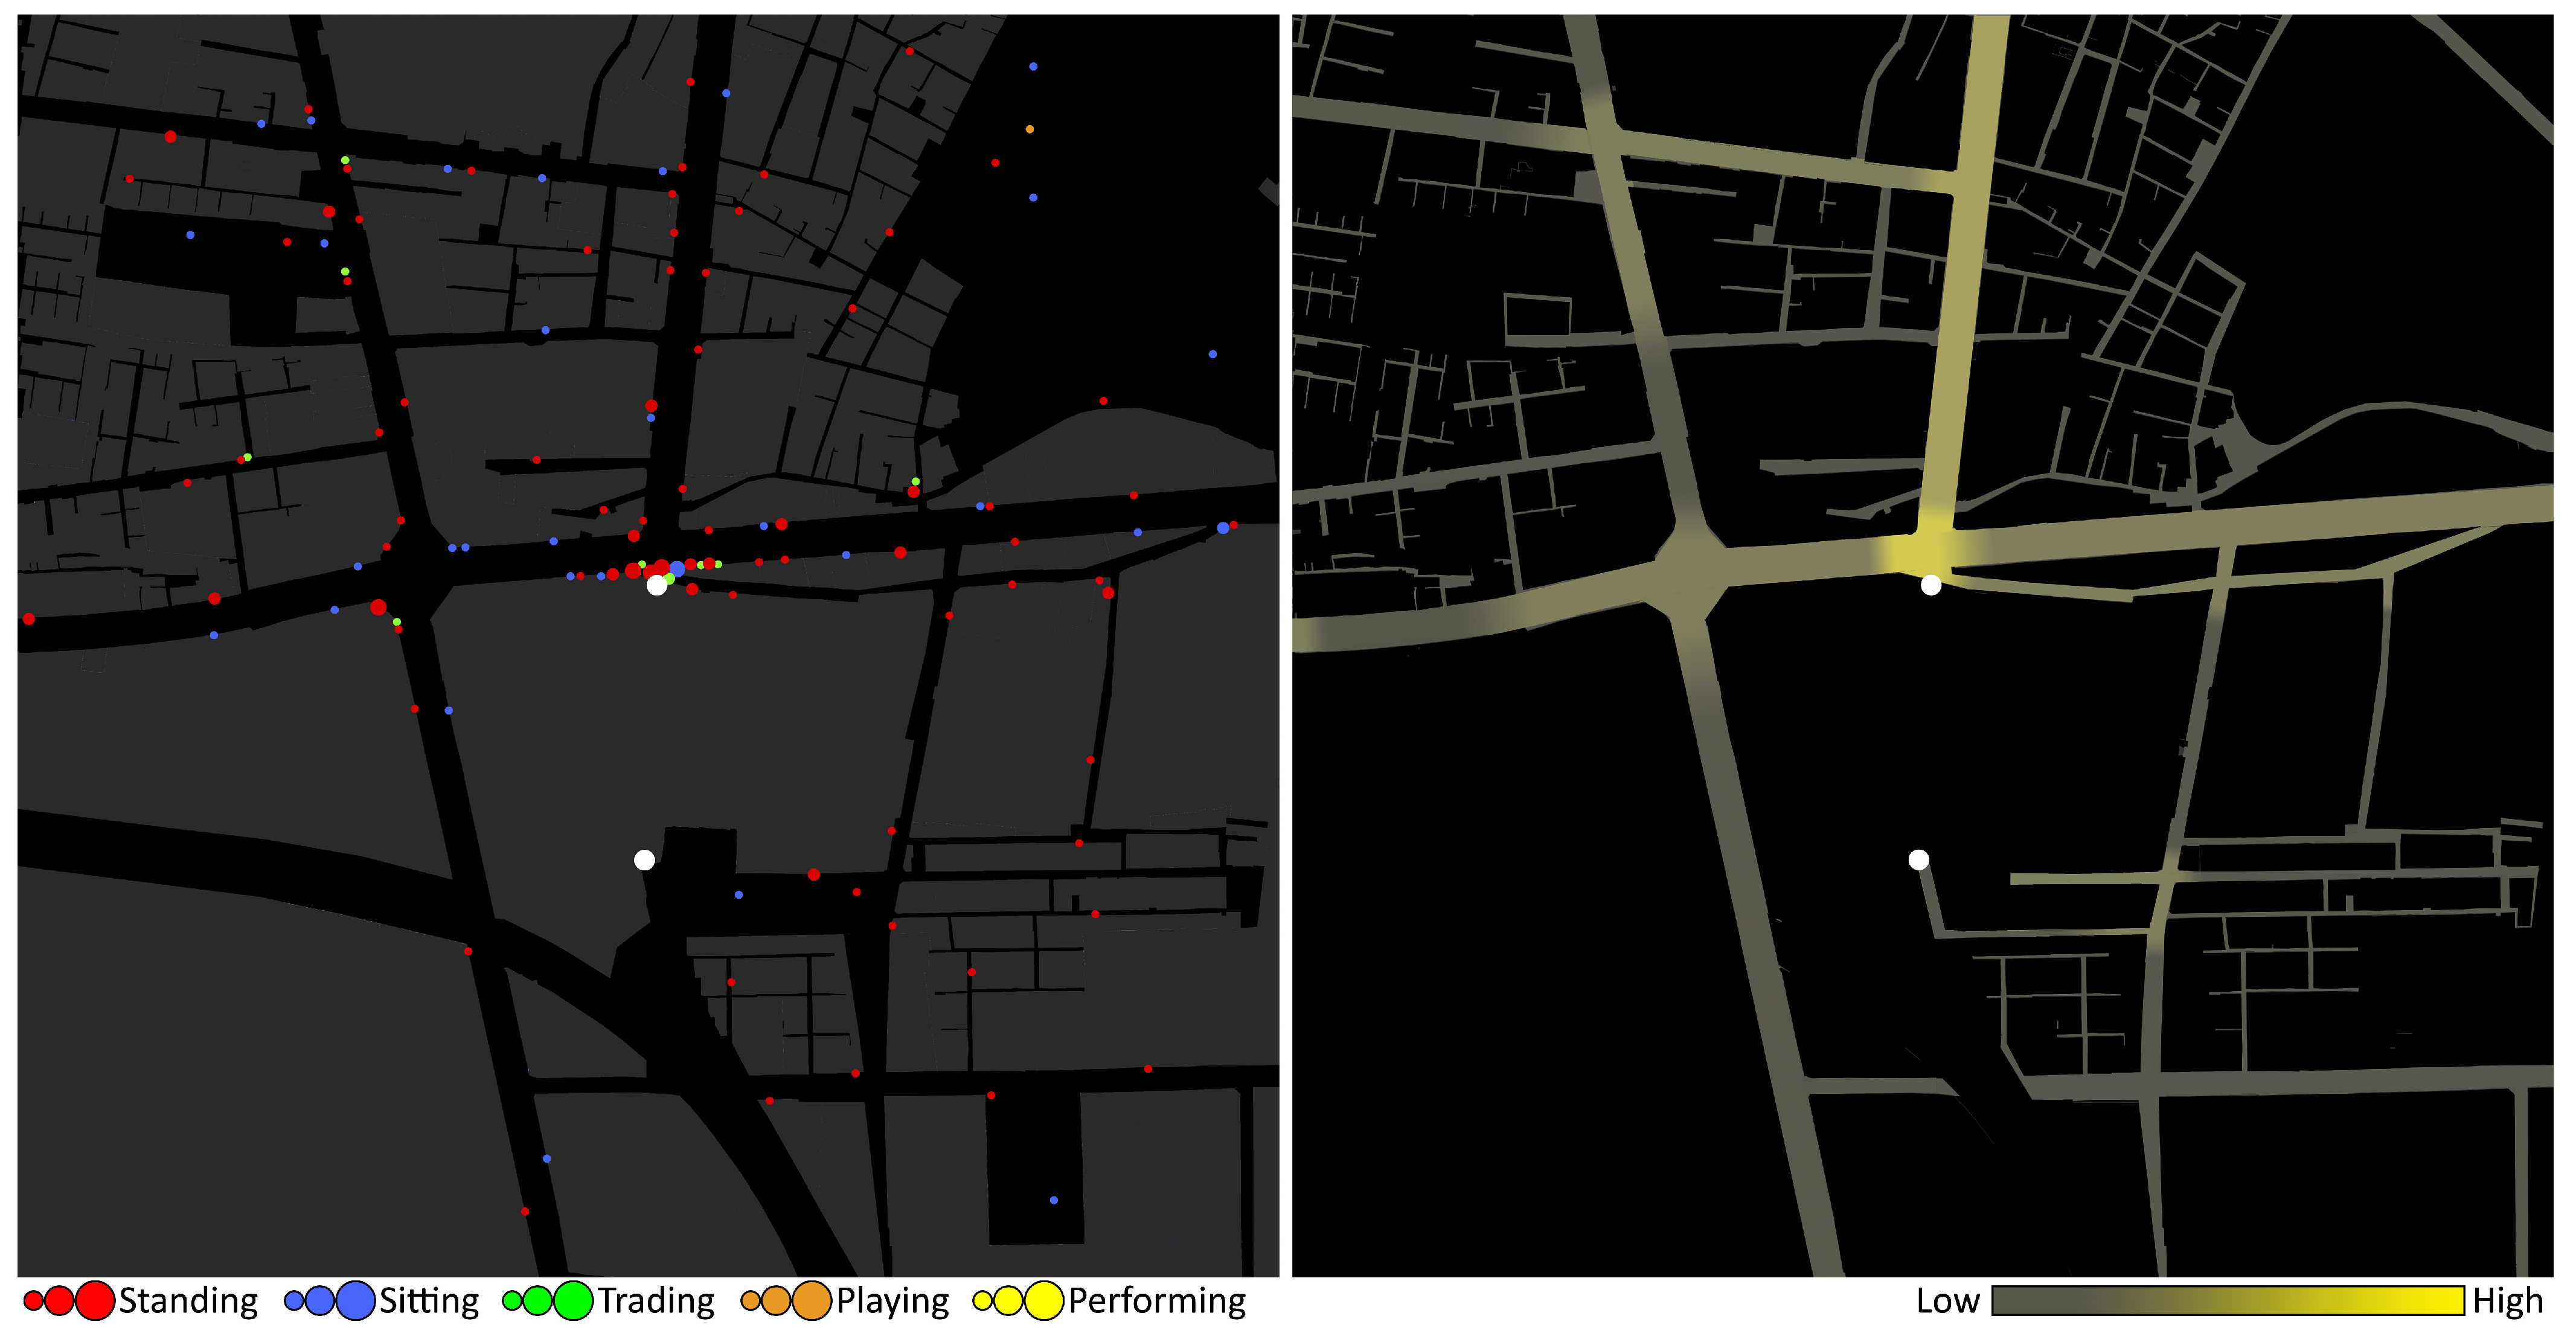
4.1.2. Streetlife
Figure 5 shows that flows of people and their everyday activities are rather concentrated in the immediate vicinity of the station. The density of flows captured during the midday peak indicates a pattern with high fluctuation across different public spaces. Field observations suggest that people are not generally present in public space unless they have to be. Examples of this are the people getting to or from the metro station during rush hours, particularly when they are being dropped off and waiting to catch other modes of transport. The high station use here might be linked to local bus, car-taxi, or motorcycle-taxi interchanges to the city’s main railway station. While there is a limited range of stationary activities taking place around the metro station, the rest of the area does not accommodate much everyday use and activity. The observed stationary activities often vary between sitting, standing and street trading, which grow remarkably as one gets closer to the metro entrance (Figure 5). Such activities are often performed by a different range of users such as vendors, storekeepers and everyday commuters. By contrast, within a few blocks from the metro, sidewalks become relatively empty of social activities and pedestrian flows (often varying between 50 and 140 people per 10 min during midday peaks). Observation shows that there is negligible use of public space for performance or play throughout this station area. The use of space does not generally take place in designated areas such as parks, even though fixed furniture and play equipment are placed to stimulate and make some playful social activities possible. The areas along the rail track and industrial developments are empty of pedestrian flows in most hours of the day (Figure 5). It became clear in observation of public spaces and their social life that individuals do not often take a break from their daily routines and fixed schedules for lingering and performing non-instrumental social interactions—either spontaneously or pre-planned.
As shown in Figure 5, there is a low use of public space for street trading throughout the reference area. The observations indicate that there is nearly no competition between the formal market and informal traders. Nevertheless, informal traders negotiate their use and appropriation of public space close to the station entrance with each other and motorcycle-taxies, among others. The limited presence of street traders is often geared to those parts of the access network with a high density of pedestrian flows (Figure 5), which is, in turn, mediated by major attractors (i.e., metro station). Hence, the spatial distribution of metro stations is critical in understanding the everyday rhythms of street vending.
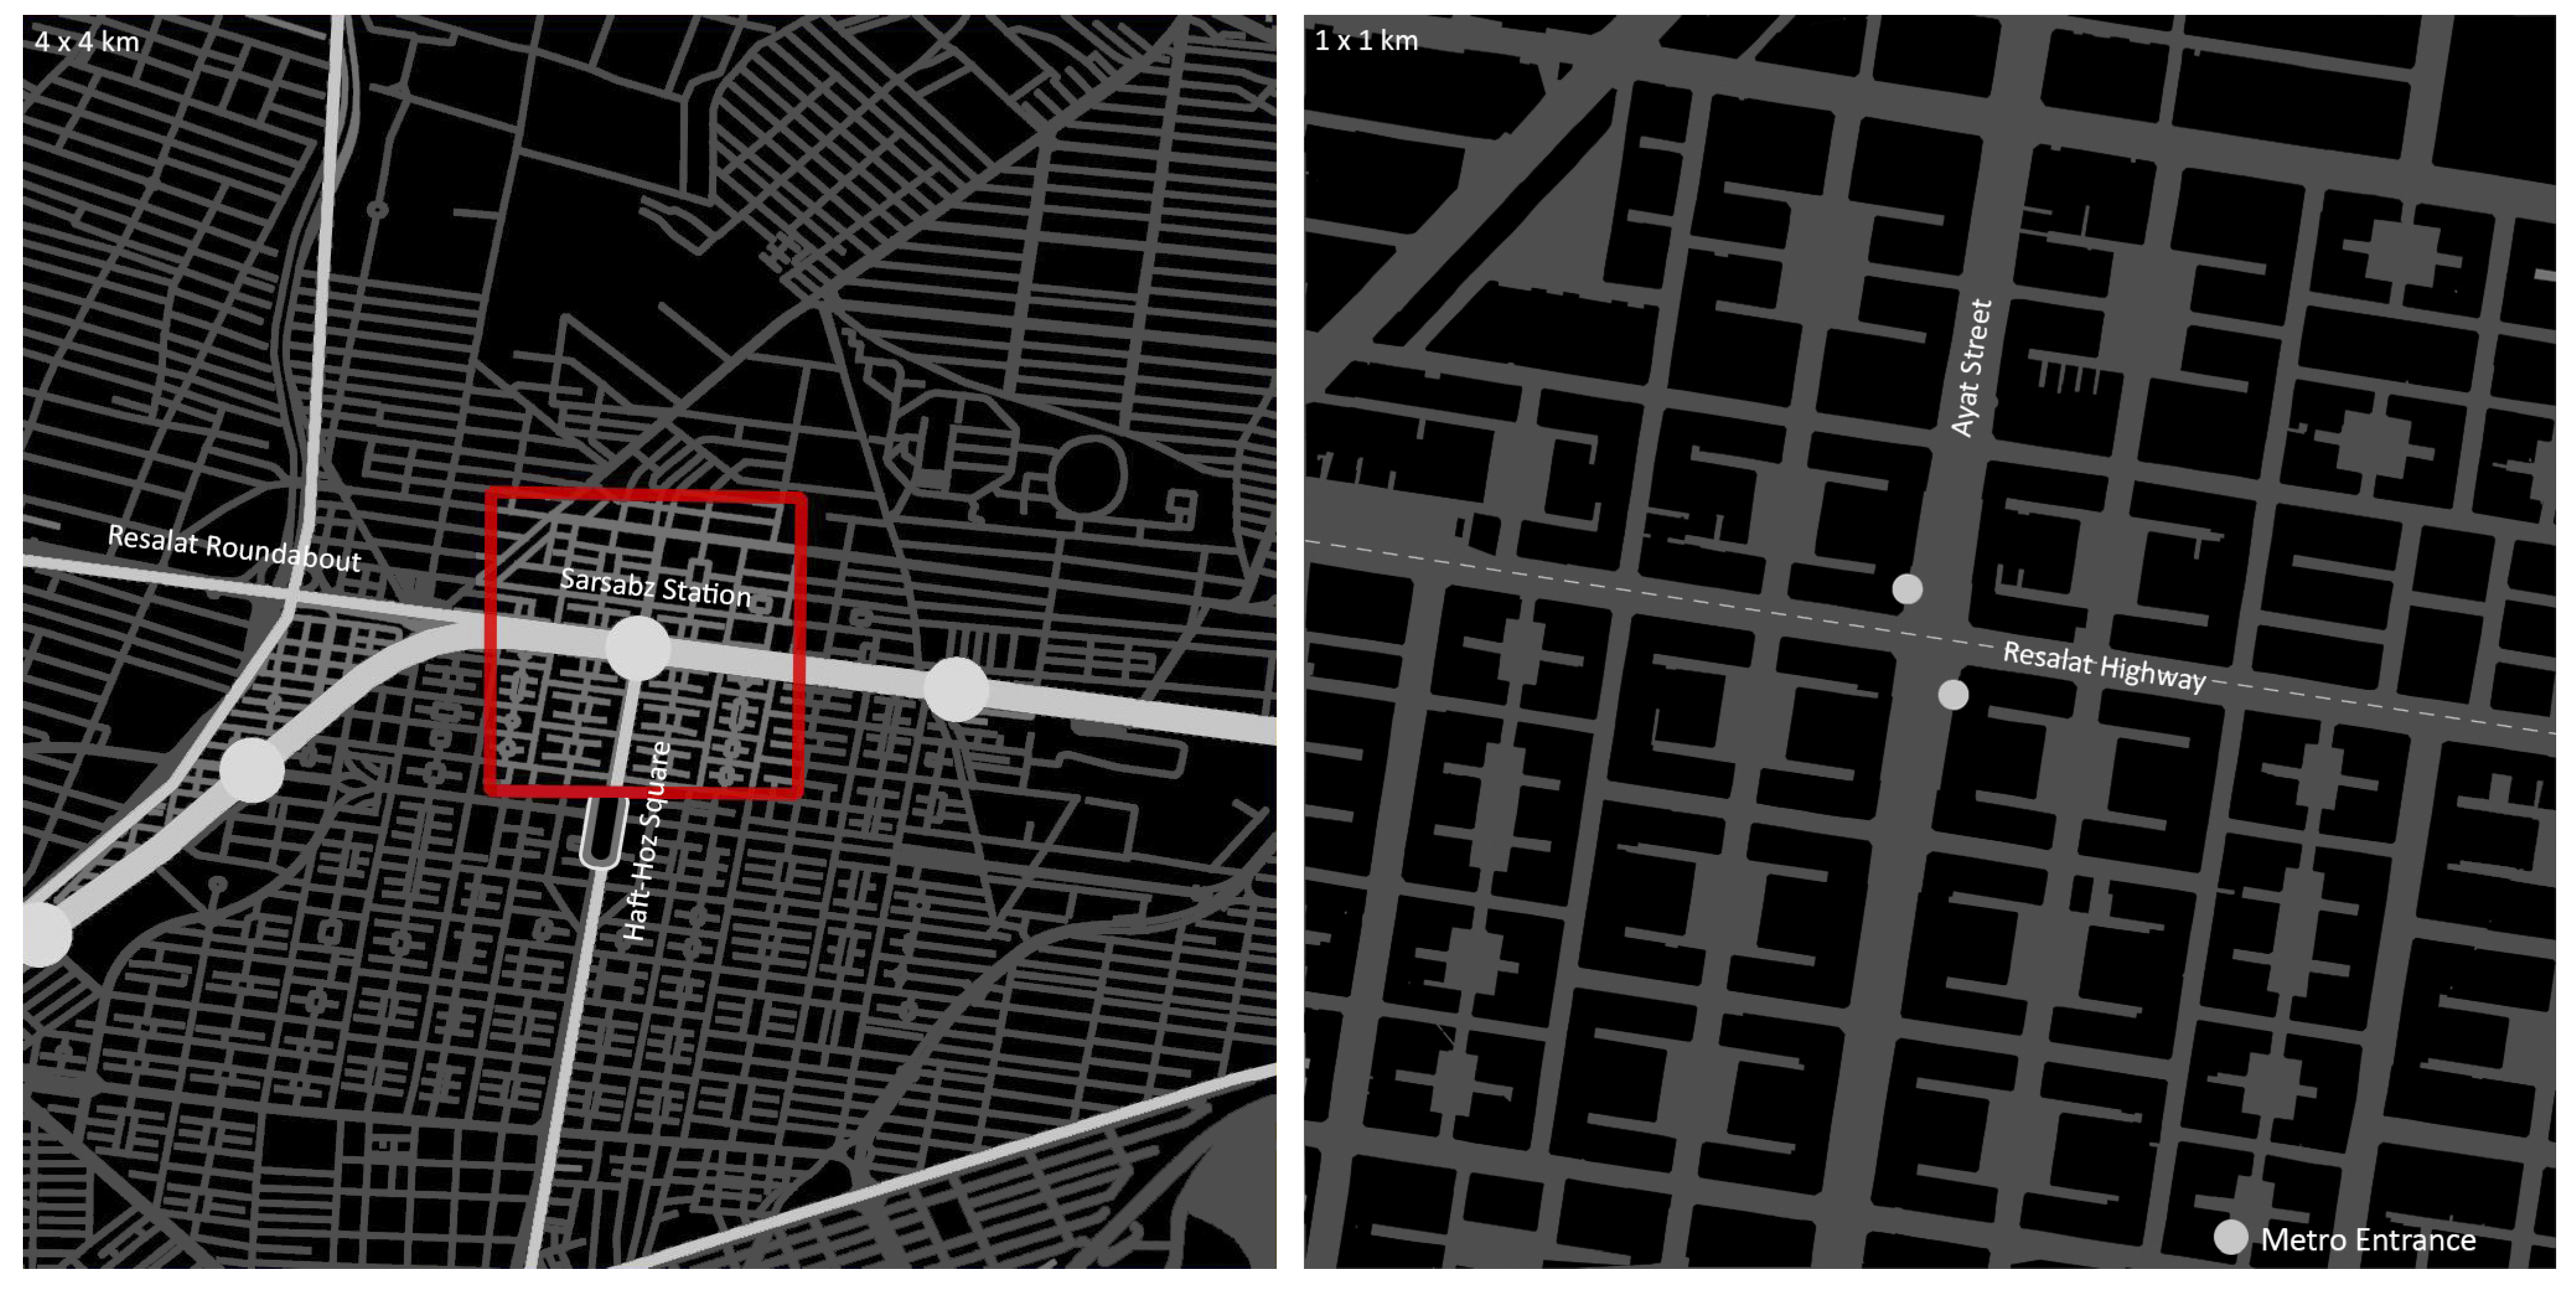
4.2. Sarsabz (East)
The study area was primarily planned in the 1950s as a part of the first eastern suburb, Narmak, for middle-class people. This period witnessed the fast-growing middle class and the development of modern urban planning. Narmak was the first state-planned new township following a modern approach. According to this plan, a 400-hectare land was divided into nearly 8000 plots with varying sizes of 200 to 500 square metres for single-storey houses [79]. In addition to that, a further 200 hectares were planned to incorporate public open space networks (Figure 6). The population of the district increased to about 336,000 people by 1996 and about 378,000 in 2006. The population density in the station area is higher than the average density in the city, which is 92 people per hectare [78].
The metro network was extended through the subject area in 2005 and is located in the eastern part of the urban metro network. The area is divided from north to south by the former Resalat Highway and east to west by Ayat Street. Close to the intersection of the highway with Ayat Street is Sarsabz metro station with two entrances about 100 metres apart. As Figure 6 shows, metro entrances are located along Ayat Street, divided by the highway. The highway runs east to the centre of the city, conveying a large volume of vehicular traffic. As a key transport node in the city, Resalat Roundabout sits close to the reference area from the west (Figure 6). To the south of the study area, Ayat Street connects with Haft-Hoz Square, which is one of the most vibrant public open spaces in the city.
4.2.1. Access
The standardised access network in the Sarsabz station area is a result of formal modernist planning, according to which urban blocks and several neighbourhood parks connect through a regular grid structure (Figure 7). Streets were laid out in the 1950s following a rigid hierarchical network where each neighbourhood park branched into two or four cul-de-sacs. Urban blocks do not incorporate many variations in terms of configuration, with perimeters ranging from 250 to 550 m and block lengths varying between 60 and 140 m. The accessibility from the metro station to the surrounding areas is relatively high, with the CAPS5min of about 11 hectares (Figure 7). This catchment resulted in part from a large number of parks distributed across the study area. At smaller scales, pedestrian networks are disconnected by numerous cul-de-sacs, despite the fact that a property may have less than 20 m distance from the closest main street, and one should walk 300 m to get to the same spot. This becomes a more critical issue when the block length is at its highest range. The pedestrian movements are constrained along southern Ayat Street and Resalat Highway by the fences along the BRT lanes. The access between two parts of the road is only enabled via a pedestrian bridge or small gaps at least every 500 m along the fences. People often informally cross the Resalat Highway without using the pedestrian bridge with long stairways. The AI5min is about 11,970 m (Figure 7), which relates to the fairly high capacity of the urban fabric to enable access to and between urban attractions, particularly entries to buildings with mixed functions along the main streets.
Streets in the station area vary broadly from cul-de-sacs and minor streets to main streets and highways. Cul-de-sacs, with a width of nearly 8 m, generally exist within residential blocks. Minor streets, with an average width of 10–20 m, are generally enclosed by residential blocks, with a few exceptions where blocks incorporate a mix of different functions. A highway, with an average width of 25 m, carries heavy vehicular traffic. This type often accommodates both residential and multi-functional buildings. Some main streets have an average width of 50–60 m, which are often enclosed by multi-functional developments.
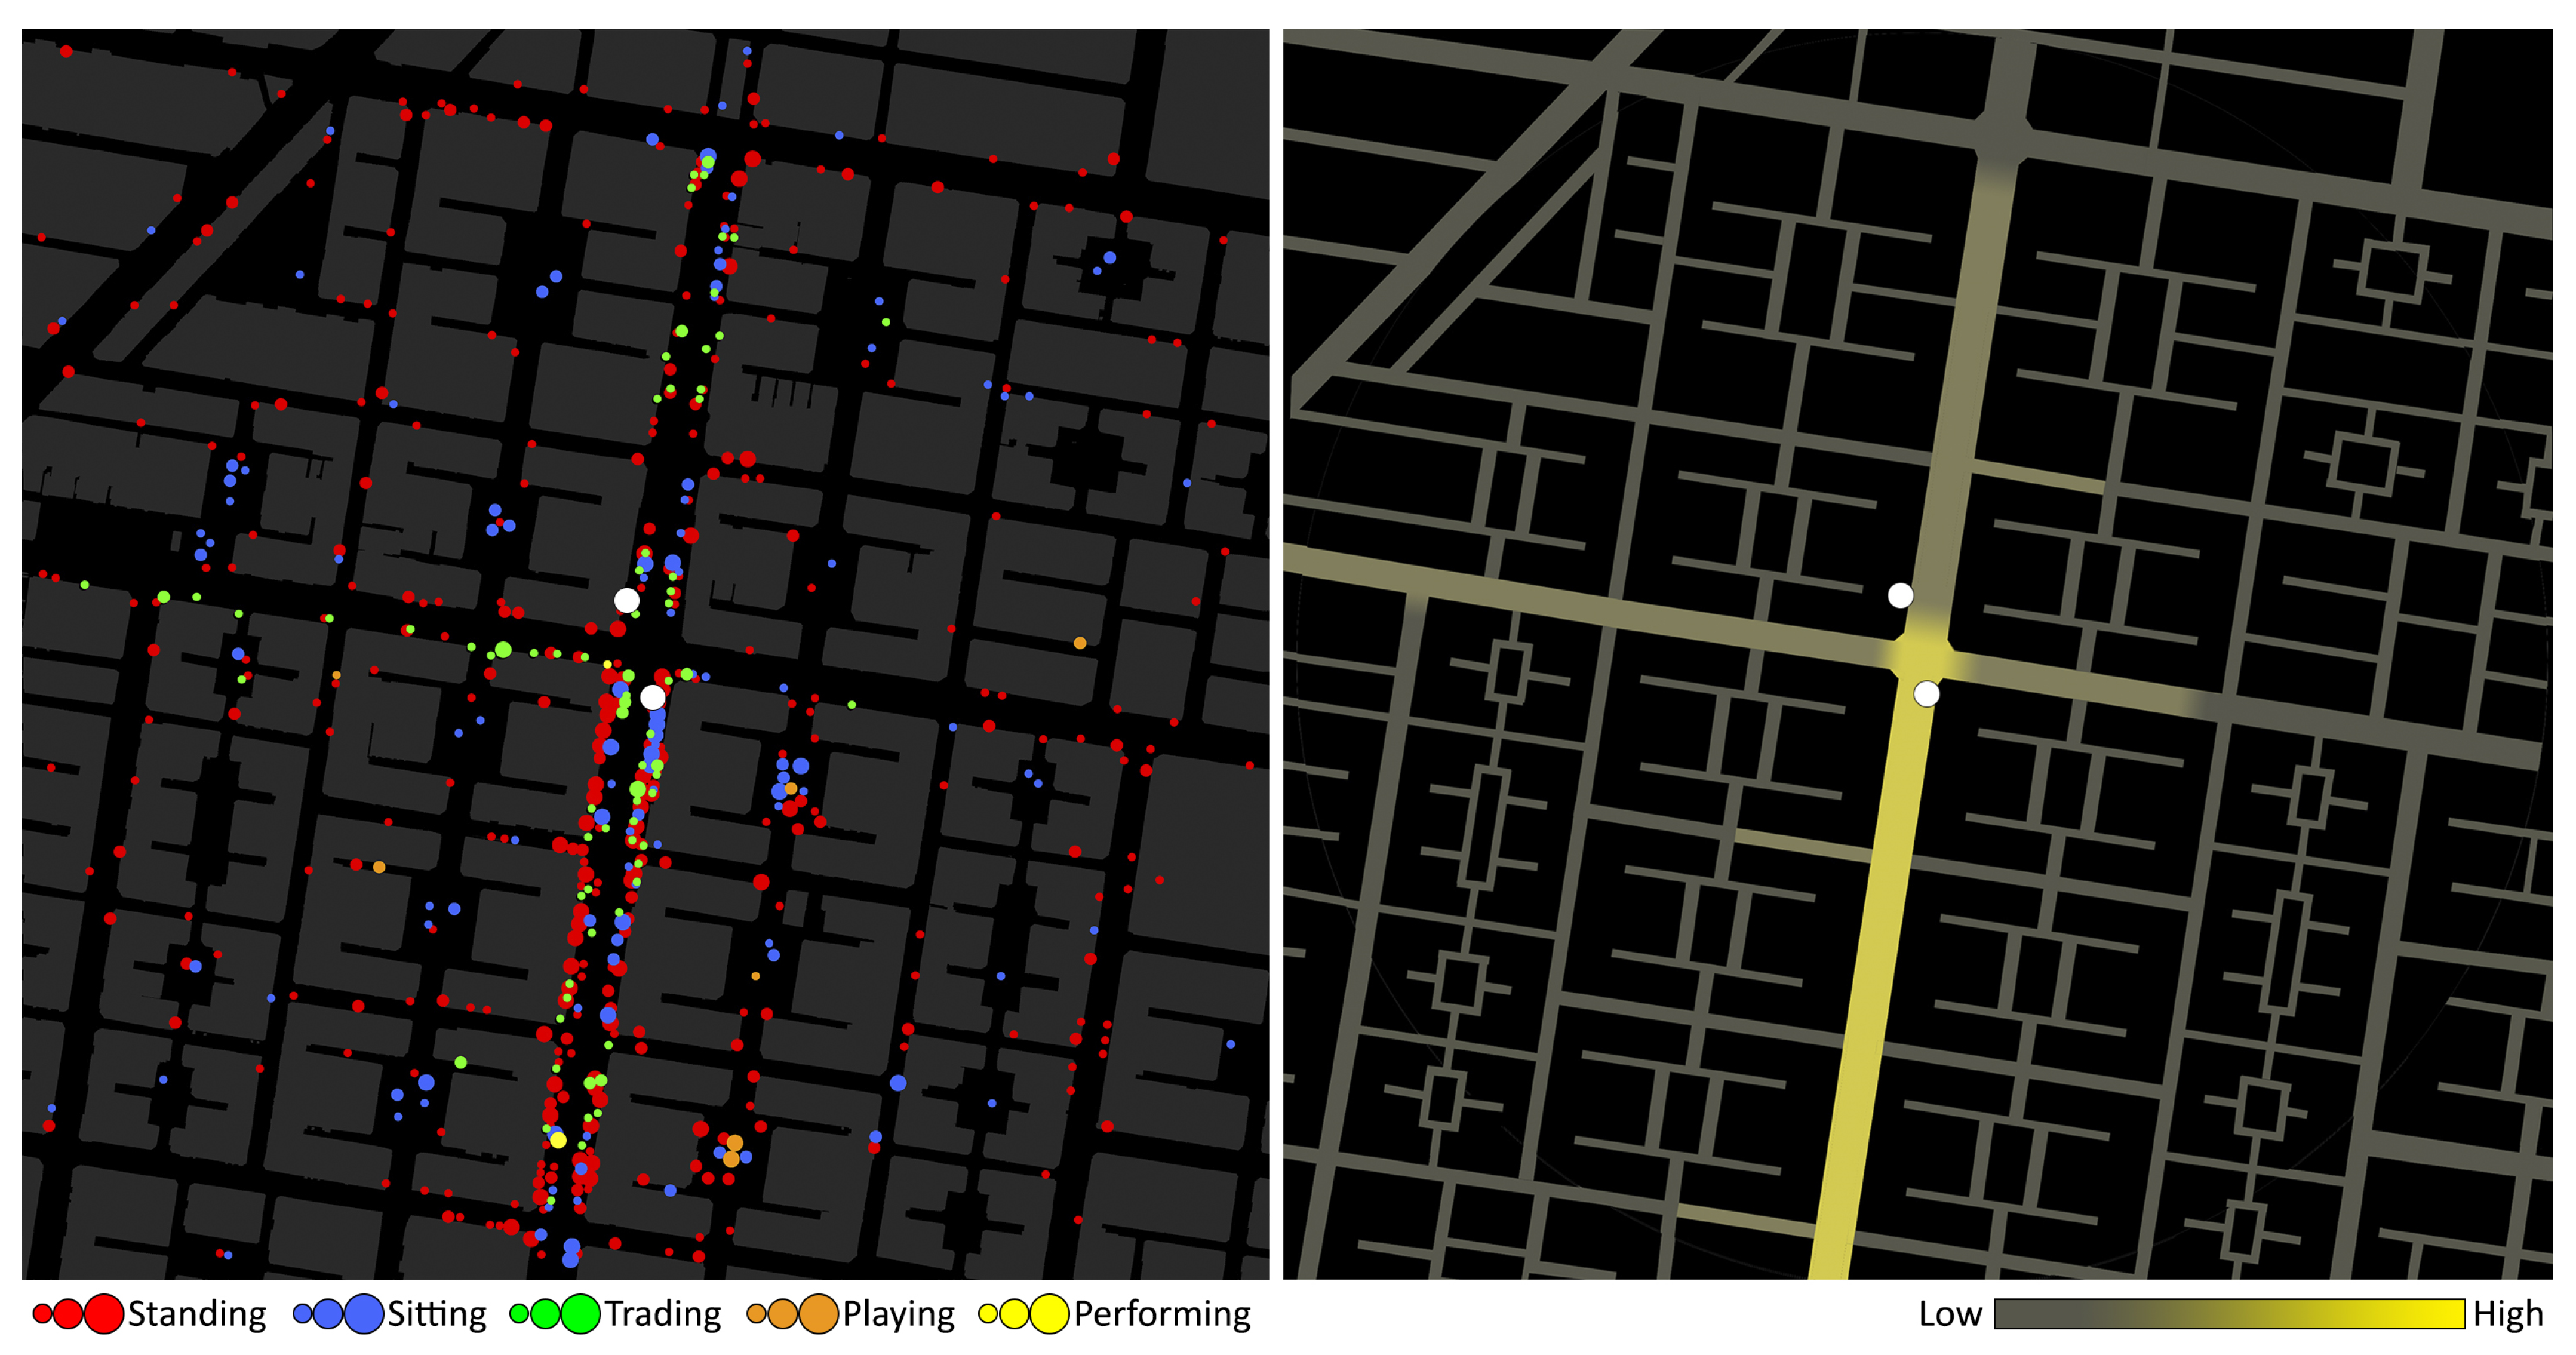
4.2.2. Streetlife
A fine-grained analysis of activities shows that while some public spaces in the station area are appropriated for a wide range of public activities, others (such as residential streets further afield from the station) do not accommodate this variation. Figure 8 shows that the highest volume of stationary activities and pedestrian flows (nearly 500 pedestrians over 10 min) is in the southern section of Ayat Street where sidewalks (10–16 m wide) are meeting places for different groups of users (e.g., varying by gender and age); they are public realms for women doing shopping or interacting with informal street traders, male individuals standing along the pathways and watching the passing pedestrian scene, and children sitting with their peers after school time.
What contributes vitality to Ayat Street is the public space onto which most of the shops, services and informal food stalls extend their business. As one gets closer to the immediate vicinity of the metro entries, streets become informally encroached and urban codes become transgressed by numerous retailers using and appropriating sidewalks to put their goods and products on view. Similarly, merchants hang an array of clothes and handbags on racks in front of their stores, encroaching upon the public domain; food retailers display dry food, vegetables and spices in buckets or open shelves; outside the formal stores, street traders display glass boxes and buckets for different perfumes and ask passersby to try them; and young musicians carry out street performance close to the retail edges during the midday and evening rush hours where a high volume of streetlife flows on the sidewalks.
By contrast, the former Resalat Highway does not accommodate a wide range of stationary activities or groups of users along its sidewalks (there are less than 200 people per 10 min during midday peaks) (Figure 8). The lower volume of pedestrian flows here corresponds with the narrow sidewalks (about 3–4 m) and lack of street furniture, which involve a significant change in the patterns of stationary activities (Figure 8). The stationary activities are often limited to street trading. Observation suggests that street traders mostly concentrate on the corner of the blocks where there is a higher volume of pedestrian flows. During the working hours, motorcycles are often parked along the sidewalks adjacent to the work-related functions, negotiating their use and appropriation of space with street traders and shopkeepers, among others.
Street traders generally set up their business along the sidewalks where the volume of pedestrian flows is relatively high (Figure 8). They engage with public spaces to meet their needs by using urban furniture and loose parts to signify their territories and display their wares. Most street traders can easily move, except for those with more fixed food stalls. The density of street trading and its capacity to make use of loose elements reach their highest levels in the midday peaks along the sidewalks of Ayat Street. This can contribute to the flexibility of use and attract high volumes of pedestrian traffic within the station area. While this is seen as a win–win situation for both storekeepers and informal street traders, the excessive appropriation of public space, as well as severe competitions between formal and informal activities, can escalate to the blockage of pedestrian flows within the walkable proximity of the station.
5. Discussion
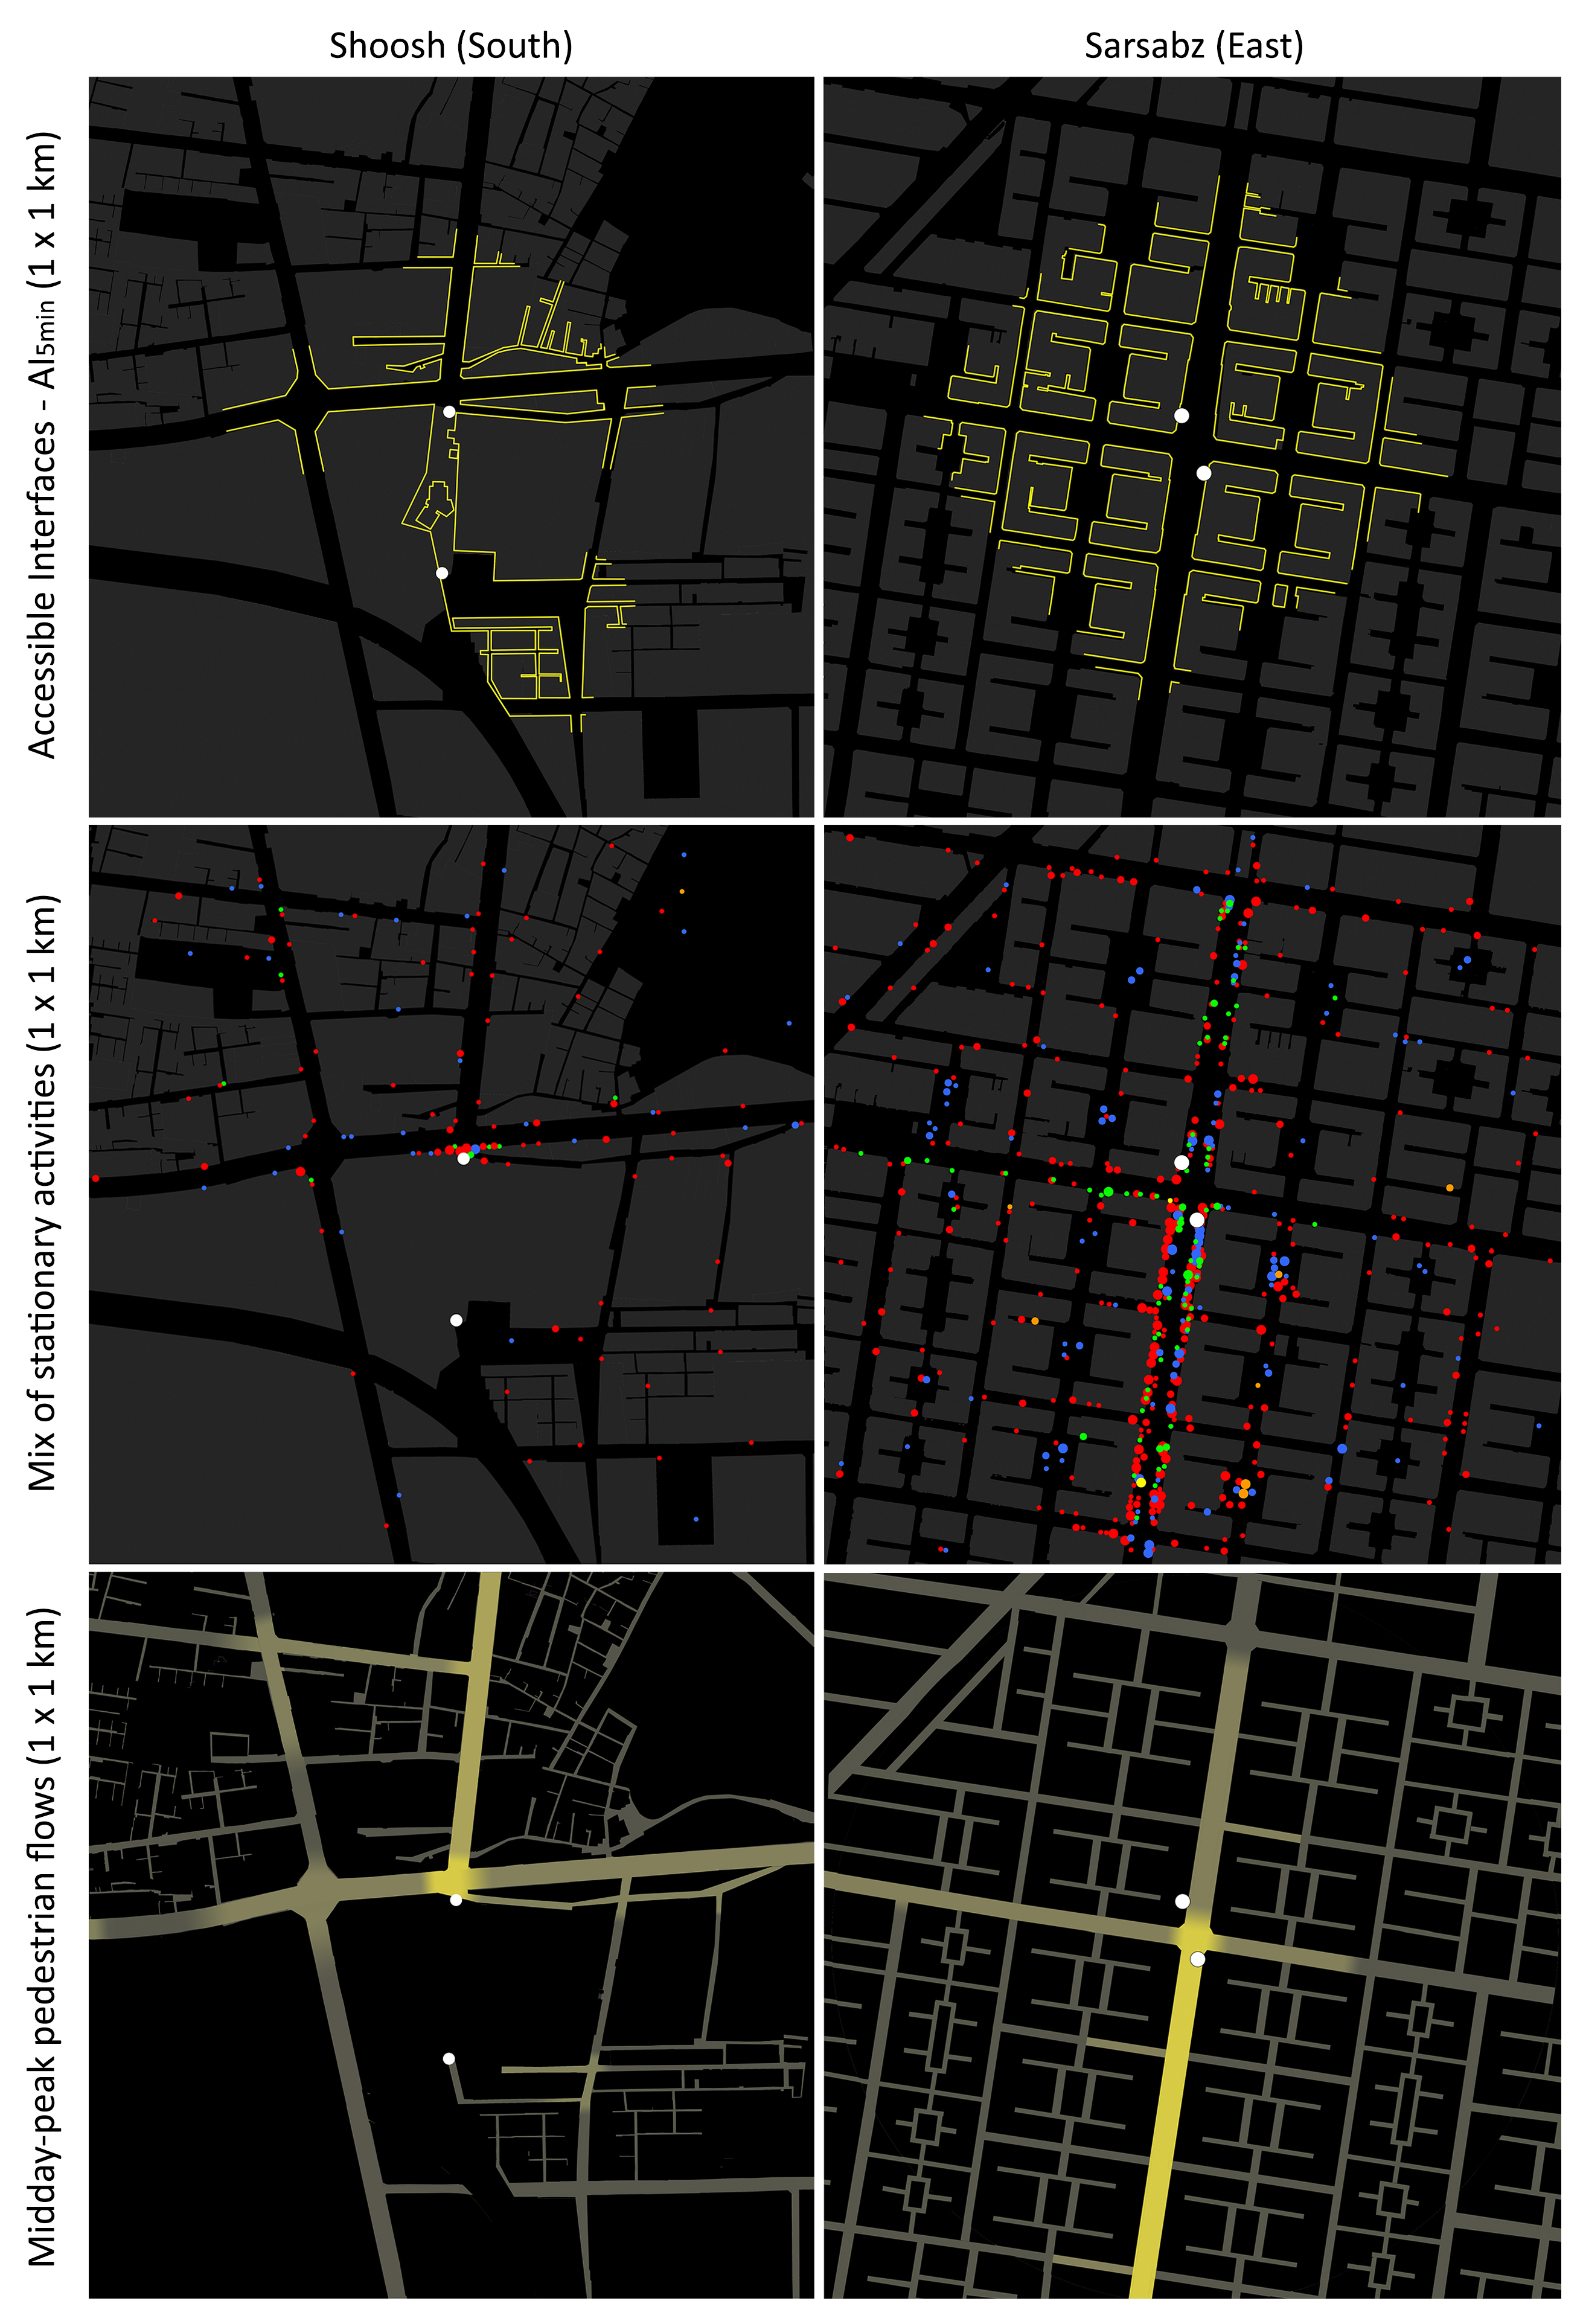
Figure 9 shows the comparative analysis of the public spaces one can walk to within 5 min in relation to the AI5min—the measure of what one gets access to. The industrial South (Shoosh) is the least walkable transit node, which is due to the predominance of large impermeable blocks as well as gated open spaces. This condition has also produced a lower AI5min, which, together with the low volume of pedestrian flows and the low intensity of activities within a 5-min catchment, define the real catchment of the Shoosh station. The combination of low CAPS and low AI within a given time can constrain streetlife intensity. By contrast, the eastern study area (Sarsabz) with its regular grid network has a larger CAPS5min and AI5min. We argue that the combination of high CAPS and high AI within a given time can enable a higher volume of pedestrian flows, which is also linked to a synergistic effect of a larger assemblage, including the number of entries and diversity of functions. Thus, to better understand the real catchment of stations, we need to focus on the emergent effect of the relationships between the catchment of public spaces, accessible interfaces, the intensity of activities and pedestrian flows.
The two measures of CAPS and AI developed in this paper demonstrate that the high value of catchment of accessible public spaces around the station is not consistent with the concept of a TOD when there is not much to catch within a catchment. While higher CAPS indicates a larger area of public open space, it may not necessarily be associated with greater AI. This is particularly the case in the Southern station area if we extend the analysis timeframe beyond 5 min to incorporate the large green open space to the Northeast of the station area. Although the related CAPS becomes larger, the AI starts to shrink. This condition subsequently constrains what Jacobs [29] refers to as ‘pools of use’. The global literature has long recognised public/private interfaces as a key issue in urban design and planning [80,81,82,83], yet there have not been any attempts focusing on urban interfaces within TODs. We argue that a focus on both measures of CAPS and AI is critical to understand the performance and potential transformation of street configuration within walkable proximity to transit stations.
The urban ecology of the study area in the east comprises both formal and informal economies. This shows how forms of self-organised activities can loosen up the spatial striation of the public space and maximise its physical and social affordances, which are linked to the emergence of vibrant urbanity and economic productivity. Forms of street trading are often attracted to pedestrian flows that are, in turn, mediated by urban attractions and access networks [84]. These activities are clustered in proximity to the busy nodes such as metro entries and shopping centres and along the most accessible public spaces from stations. This is linked to how such self-organised activities are associated with the urban DMA (density, mix and access) as outlined by Dovey [55]—they are attracted to those areas where the morphology and functional mix afford possibilities.
Most street traders in the eastern station area (Sarsabz) can easily move, except for those with more fixed food stalls. This issue becomes important when the state exercises control over public space through practices of ‘street cleansing’ due to which many traders are evicted from sidewalks. There is a further key issue here regarding the ways the concentration of informal activities and loose parts on the sidewalks generate congestion of pedestrians in the already congested areas in proximity to transit stations. This lends itself to what Bromley [85] calls ‘the problem’, arguing that the traders are concentrated in the areas with pre-existing flows, and their agglomeration attracts more flows and congestion. Street traders benefit from keeping pedestrian traffic open, which may otherwise produce severe competition and gridlocks due to which many traders will leave their territories. The negotiation for the use of public space between different forms of street traders, shopkeepers, motorcycle-taxis and state entities within station areas of the global South opens up further questions for research.
6. Conclusions
Studies on TOD and its associated socio-spatial dimensions can be stretched to incorporate a wider range of cities, especially more densely populated and less formal cities beyond the global North. One key question in transport and urban design studies is to address the relationships between different forms of urbanity, public transport patronage and neighbourhood morphologies. While there have been recent attempts to address similar questions in the cities of the global North [24], far less has been empirically investigated in the context of the rapidly urbanising cities. Drawing on empirical research in two case studies in Tehran, this paper contributes to a better understanding of the nexus between station walkable catchments and forms of urbanity within transit-oriented assemblages by developing two measures of accessibility—the Catchment of Accessible Public Spaces (CAPS) and Accessible Interfaces (AI). There have been several studies on the accessibility of TODs, yet less scholarly focus has been given to the micro-scale analysis of urban design dimensions and the capacity to walk within the immediate vicinity of transit stations.
This study serves as an early step in measuring the physical accessibility of transit nodes in relation to forms of urbanity within rapidly growing cities and contributes to the emerging accent on urban design dimensions associated with TODs. To explore how TODs work, we adopt an assemblage approach, which cuts across any separation of sociality and spatiality [86,87]. Such an approach that grapples with the complexities and multiple adaptations taking place around the transit stations has remained underexplored in the studies of transit urban design beyond the global North. We found that the combination of high CAPS and high AI within a given time can enable streetlife intensity, which is also linked to a synergistic effect of a larger assemblage, including the number of entries and diversity of functions. We also argued that a focus on both measures is critical to understand the performance and potential transformation of street networks in a TOD.
Certain limitations and future research directions have also been identified in this study. Our attempt in this paper has been to explore how public space works in the context of rapidly urbanising cities with a focus on the synergies between physical accessibility, public/private interfaces, and forms of urbanity within the walkable catchment of transit nodes. Nonetheless, engaging with the associated cultural, economic, and political dynamics or analysing other aspects of accessibility (e.g., economic, social, or visual) remains a limitation of our work and a task for future research. Accessing fine-grained population density data and public transport patronage data in relation to neighbourhood morphologies and forms of urbanity remains a key limitation of this study and warrants further research. The impacts of variables other than the ones addressed above and understanding the potential synergies between them can also be explored. Investigating the applicability of the methods developed in this paper to other case studies in the context of the global South and beyond also remains an area for future research.
The paper concludes by highlighting some key points raised by this study. While there are benefits in providing public open spaces—including parks—in proximity to transit nodes, such interventions might not necessarily encourage streetlife intensity where there is not much to catch within the immediate vicinity of a transit node. As shown in this paper, a higher Catchment of Accessible Public Spaces (CAPS) indicates a larger area of public open space, yet it is not necessarily associated with greater Accessible Interfaces (AI). Further research can provide a more nuanced understanding of the relations between CAPS and AI in TODs. Exploring the dynamics of transit urban design beyond the global North requires a critical engagement with the synergies and contradictions between informal and formal processes of urban transformation. As outlined in the account provided here, transit nodes in rapidly urbanising cities also become places of intersection between informal/formal flows of transport, social and economic exchange. The question of informality cuts across the constructed boundaries between the cities of the global North and those of the global South. Nonetheless, it requires particular attention when it comes to the ways in which TODs work beyond the global North. In this paper, we pointed to the emergence and possible escalation of street trading in proximity to transit nodes. Ongoing research by the authors explores the synergies and contradictions between forms of street trading, informal transport and urban morphology within the catchment of accessible public space around transit nodes in more congested and less formal cities.
Author Contributions
Conceptualization, N.P. and H.K.; methodology, N.P.; writing—original draft preparation, N.P.; writing—review and editing, H.K. and N.P.; visualization, N.P.; project administration, N.P.; funding acquisition, N.P. All authors have read and agreed to the published version of the manuscript.
Funding
The first author received MIRS and MIFRS scholarships from the University of Melbourne.
Acknowledgments
This paper is derived in part from a broader study by the first author at the University of Melbourne [25]. The authors wish to thank Kim Dovey and Elek Pafka for their insightful comments on the broader research and the anonymous reviewers for their time and helpful suggestions on this paper.
Conflicts of Interest
The authors declare no conflict of interest. The funders had no role in the design of the study; in the collection, analyses, or interpretation of data; in the writing of the manuscript, or in the decision to publish the results.
References
- Calthorpe, P. The Next American Metropolis: Ecology, Community, and the American Dream; Princeton Architectural Press: New York, NY, USA, 1993. [Google Scholar]
- Cervero, R. The Transit Metropolis: A Global Inquiry; Island Press: Washington, DC, USA, 1998. [Google Scholar]
- Duany, A.; Plater-Zyberk, E. (Eds.) Towns and Town-Making Principles; Rizzoli: New York, NY, USA, 1991. [Google Scholar]
- Newman, P.; Kenworthy, J. Sustainability and Cities: Overcoming Automobile Dependence; Island Press: Washington, DC, USA, 1999. [Google Scholar]
- Dittmar, H.; Potichia, S. Defining transit-oriented development: The new regional building block. In The New Transit Town: Best Practices in Transit-Oriented Development; Dittmar, H., Ohland, G., Eds.; Island Press: Washington, DC, USA, 2004; pp. 19–40. [Google Scholar]
- Dunphy, R.T.; Myerson, D.; Pawlukiewicz, M. Ten principles for successful development around transit. In Developing around Transit: Strategies and Solutions that Work; Dunphy, R.T., Cervero, R., Dock, F.C., McAvery, M., Porter, D.R., Swenson, C.J., Eds.; Urban Land Institute: Washington, DC, USA, 2004. [Google Scholar]
- Jacobson, J.; Forsyth, A. Seven American TODs: Good practices for urban design in transit-oriented development projects. J. Transp. Land Use 2008, 1, 51–88. [Google Scholar] [CrossRef] [Green Version]
- Bertolini, L.; Spit, T. Cities on Rails: Redevelopment of Railway Stations Areas; Spon Press: New York, NY, USA, 1998. [Google Scholar]
- Curtis, C.; Renne, J.L.; Bertolini, L. (Eds.) Transit Oriented Development: Making it Happen; Ashgate: Farnham, UK, 2009. [Google Scholar]
- Mees, P. Transport for Suburbia: Beyond the Automobile Age; Earthscan: London, UK, 2010. [Google Scholar]
- Ewing, R.; Bartholomew, K. Pedestrian- and Transit-Oriented Design; Urban Land Institute and American Planning Association: Washington, DC, USA, 2013. [Google Scholar]
- Loukaitou-Sideris, A.; Higgins, H.; Cuff, D.; Oprea, D. Up in the Air: Urban Design for Light Rail Transit Stations in Highway Medians. J. Urban Des. 2013, 18, 313–339. [Google Scholar] [CrossRef]
- Loo, B.P.; Chen, C.; Chan, E.T. Rail-based transit-oriented development: Lessons from New York City and Hong Kong. Landsc. Urban Plan. 2010, 97, 202–212. [Google Scholar] [CrossRef]
- Yang, P.P.-J.; Lew, S.H. An Asian model of TOD: The planning integration in Singapore. In Transit Oriented Development: Making it Happen; Ashgate: Farnham, UK, 2009; pp. 91–106. [Google Scholar]
- Zacharias, J.; Zhang, T.; Nakajima, N. Tokyo Station City: The railway station as urban place. Urban Des. Int. 2011, 16, 242–251. [Google Scholar] [CrossRef] [Green Version]
- Bocarejo, J.P.; Portilla, I.; Pérez, M.A. Impact of Transmilenio on density, land use, and land value in Bogotá. Res. Transp. Econ. 2013, 40, 78–86. [Google Scholar] [CrossRef]
- Kong, W.; Pojani, D. Transit-oriented street design in Beijing. J. Urban Des. 2017, 22, 388–410. [Google Scholar] [CrossRef]
- Lyu, G.; Bertolini, L.; Pfeffer, K. Developing a TOD typology for Beijing metro station areas. J. Transp. Geogr. 2016, 55, 40–50. [Google Scholar] [CrossRef] [Green Version]
- Sung, H.; Oh, J.T. Transit-oriented development in a high-density city: Identifying its association with transit ridership in Seoul, Korea. Cities 2011, 28, 70–82. [Google Scholar] [CrossRef]
- Peimani, N. Transit-Oriented Morphologies and Forms of Urban Life: A Case Study. Contour 2016, 1, 1–11. [Google Scholar]
- Peimani, N.; Dovey, K. Motorcycle mobilities. In Mapping Urbanities: Morphologies, Flows, Possibilities; Dovey, K., Pafka, E., Ristic, M., Eds.; Routledge: London, UK, 2018; pp. 119–128. [Google Scholar]
- Cervero, R.; Guerra, E.; Al, S. Beyond Mobility: Planning Cities for People and Places; Island Press: Washington, DC, USA, 2017. [Google Scholar]
- Porta, S.; Renne, J.L. Linking urban design to sustainability: Formal indicators of social urban sustainability field research in Perth, Western Australia. Urban Des. Int. 2005, 10, 51–64. [Google Scholar] [CrossRef] [Green Version]
- Pafka, E.; Peimani, N. Multi-scalar mapping of transit-oriented assemblages: Metropolitan mobilities, neighbourhood morphologies and station design. Presented at ISUF 2019 XXVI International Seminar on Urban Form, Nicosia, Cyprus, 2–6 July 2019. [Google Scholar]
- Peimani, N. Transit and urbanity in Tehran; The Univeristy of Melbourne: Melbourne, Australia, 2017. [Google Scholar]
- Ewing, R.; Cervero, R. Travel and the built environment. J. Am. Plan. Assoc. 2010, 76, 265–294. [Google Scholar] [CrossRef]
- Hillier, B. Space Is the Machine: A Configurational Theory of Architecture; Cambridge University Press: Cambridge, UK, 1996. [Google Scholar]
- Marshall, S. Streets and Patterns; Spon Press: London, UK, 2005. [Google Scholar]
- Jacobs, J. The Death and Life of American Cities; Random House: New York, NY, USA, 1961. [Google Scholar]
- Whyte, W.H. The Social Life of Small Urban Spaces; Conservation Foundation: Washington, DC, USA, 1980. [Google Scholar]
- Pafka, E.; Dovey, K. Permeability and interface catchment: Measuring and mapping walkable access. J. Urban. 2017, 10, 150–162. [Google Scholar] [CrossRef]
- Hess, P.M. Measures of connectivity. Places 1997, 11, 58–65. [Google Scholar]
- Krizek, K.J. Pretest-Posttest Strategy for Researching Neighborhood-Scale Urban Form and Travel Behavior. Transp. Res. Record 2000, 1722, 48–55. [Google Scholar] [CrossRef]
- Schmidt, C.G. Influence of land use diversity upon neighborhood success: An analysis of Jacobs’ theory. Ann. Reg. Sci. 1977, 11, 53–65. [Google Scholar] [CrossRef]
- Fowler, E.P. Street management and city design. Soc. Forces 1987, 66, 365–389. [Google Scholar] [CrossRef]
- Cervero, R.; Kockelman, K. Travel demand and the 3Ds: Density, diversity, and design. Transp. Res. Part D Transp. Environ. 1997, 2, 199–219. [Google Scholar] [CrossRef]
- Stangl, P. Block size-based measures of street connectivity: A critical assessment and new approach. Urban Des. Int. 2015, 20, 44–55. [Google Scholar] [CrossRef]
- Berghauser Pont, M.; Haupt, P. Spacematrix: Space, Density and Urban Form; NAi Publishers: Rotterdam, The Netherlands, 2010. [Google Scholar]
- Handy, S. Urban form and pedestrian choices: Study of Austin neighborhoods. Transp. Res. Record 1996, 1552, 135–144. [Google Scholar] [CrossRef]
- Cervero, R.; Gorham, R. Commuting in transit versus automobile neighborhoods. J. Am. Plan. Assoc. 1995, 61, 210–225. [Google Scholar] [CrossRef]
- Papa, E.; Bertolini, L. Accessibility and transit-oriented development in European metropolitan areas. J. Transp. Geogr. 2015, 47, 70–83. [Google Scholar] [CrossRef] [Green Version]
- Schlossberg, M.; Brown, N. Comparing transit-oriented development sites by walkability indicators. Transp. Res. Record 2004, 1887, 34–42. [Google Scholar] [CrossRef]
- Vale, D.S. Transit-oriented development, integration of land use and transport, and pedestrian accessibility: Combining node-place model with pedestrian shed ratio to evaluate and classify station areas in Lisbon. J. Transp. Geogr. 2015, 45, 70–80. [Google Scholar] [CrossRef]
- The Language of Towns & Cities: A Visual Dictionary; Thadani, D.A. (Ed.) Rizzoli: New York, NY, USA, 2010. [Google Scholar]
- Peponis, J.; Bafna, S.; Zhang, Z. The connectivity of streets: Reach and directional distance. Environ. Plan. B Plan. Des. 2008, 35, 881–901. [Google Scholar] [CrossRef]
- Jensen, O.B. Designing Mobilities; Aalborg University Press: Aalborg, Denmark, 2014. [Google Scholar]
- Bertolini, L. Fostering urbanity in a mobile society: Linking concepts and practices. J. Urban Des. 2006, 11, 319–334. [Google Scholar] [CrossRef]
- Bell, J.S.; Loukaitou-Sideris, A. Sidewalk Informality: An Examination of Street Vending Regulation in China. Int. Plan. Stud. 2014, 19, 221–243. [Google Scholar] [CrossRef]
- Proshansky, H.M.; Ittelson, W.H.; Rivlin, L.G. (Eds.) Freedom of choice and behavior in a physical setting. In Environmental Psychology: Man and His Physical Setting; Holt, Rinehart & Winston: New York, NY, USA, 1974; pp. 170–181. [Google Scholar]
- Franck, K.; Stevens, Q. Tying Down Loose Space. In Loose Space: Possibility and Diversity in Urban Life; Franck, K., Stevens, Q., Eds.; Routledge: London, UK, 2007; pp. 1–33. [Google Scholar]
- Whyte, W.H. City: Rediscovering the Center; Doubleday: New York, NY, USA, 1988. [Google Scholar]
- Gibson, J. The theory of affordances. In Perceiving, Acting, and Knowing; Shaw, R.E., Bransford, J., Eds.; Lawrence Erlbaum Associates: Hillsdale, MI, USA, 1977; pp. 67–82. [Google Scholar]
- Townshend, T.G.; Roberts, M. Affordances, young people, parks and alcohol consumption. J. Urban Des. 2013, 18, 494–516. [Google Scholar] [CrossRef]
- Heft, H. The relevance of Gibson’s ecological approach to perception for environment-behavior studies. In Toward the Integration of Theory, Methods, Research, and Utilization; Plenum Press: New York, NY, USA, 1997; Volume 4, pp. 72–108. [Google Scholar]
- Dovey, K. Urban Design Thinking: A Conceptual Toolkit; Bloomsbury: London, UK, 2016. [Google Scholar]
- Gibson, J. The Ecological Approach to Visual Perception; Psychology Press: New York, NY, USA, 1979. [Google Scholar]
- Lynch, K. A Theory of Good City Form; MIT Press: Cambridge, MA, USA, 1981. [Google Scholar]
- Habraken, J. The Structure of the Ordinary: Form and Control in the Built Environment; MIT Press: Cambridge, MA, USA, 1998. [Google Scholar]
- Mitchell, D. The Right to the City: Social Justice and the Fight for Public Space; The Guilford Press: New York, NY, USA, 2003. [Google Scholar]
- Gehl, J.; Svarre, B. How to Study Public Life; Island Press: Washington, DC, USA, 2013. [Google Scholar]
- Jacobs, A. Looking at Cities; Harvard University Press: Cambridge, MA, USA, 1985. [Google Scholar]
- Pafka, E. Urban Density Rhythms: How Does Urban Morphology Mediate Streetlife Intensity Over Time; The Univeristy of Melbourne: Melbourne, Australia, 2014. [Google Scholar]
- Kearns, R.A. Being there: Research through observing and participating. In Qualitative Research Methods in Human Geography; Hay, I., Ed.; Oxford University Press: Melbourne, Australia, 2000; pp. 103–121. [Google Scholar]
- Shapcott, M.; Steadman, P. Rhythms of urban activity. In Human Activity and Time Geography; Carlstein, T., Parkes, D., Thrift, N., Eds.; John Wiley and Sons: New York, NY, USA, 1978; pp. 49–74. [Google Scholar]
- Walmsley, D.J.; Lewis, G.J. Human Geography: Behavioural Approaches; Longman: New York, NY, USA, 1984. [Google Scholar]
- Zakariya, K.; Mansor, M.; Harun, N.Z. Mapping: A Speculative and Creative Design Tool. Creat. Space 2015, 3, 1–12. [Google Scholar] [CrossRef]
- Dovey, K.; Pafka, E.; Ristic, M. Mapping as Spatial Knowledge. In Mapping Urbanities: Morphologies, Flozws, Possibilities; Dovey, K., Ristic, M., Pafka, E., Eds.; Routledge: London, UK, 2018; pp. 1–16. [Google Scholar]
- Peimani, N.; Kamalipour, H. Where gender comes to the fore: Mapping gender mix in urban public spaces. Spaces Flows 2016, 8, 19–30. [Google Scholar] [CrossRef]
- Gruen, V. The Heart of Our Cities: The Urban Crisis: Diagnosis and Cure; Thames and Hudson: London, UK, 1965. [Google Scholar]
- Gehl, J. Life between Buildings: Using Public Space; Van Nostrand Reinhold: New York, NY, USA, 1987. [Google Scholar]
- Flyvbjerg, B. Five misunderstandings about case-study research. Qual. Inquiry 2006, 12, 219–245. [Google Scholar] [CrossRef] [Green Version]
- Atash, F. The deterioration of urban environments in developing countries: Mitigating the air pollution crisis in Tehran, Iran. Cities 2007, 24, 399–409. [Google Scholar] [CrossRef]
- Bayat, A. Tehran: Paradox City. New Left Rev. 2010, 66, 99–122. [Google Scholar]
- Madanipour, A. Tehran: The Making of a Metropolis; John Wiley and Sons: Chichester, UK, 1998. [Google Scholar]
- Costello, V.F. The morphology of Tehran: A preliminary study. Built Environ. 1998, 24, 201–216. [Google Scholar]
- Allen, H. An Integrated Approach to Public Transport; UITP Iran: Tehran, Iran, 2013; pp. 1–20. [Google Scholar]
- Bertaud, A. Tehran Spatial Structure: Constraints and Opportunities for Future Development; Ministry of Housing and Urban Development Tehran: Tehran, Iran, 2003.
- TMICTO. Atlas of Tehran Metropolis; Tehran Municipality Information & Communication Technology Organisation (TMICTO): Tehran, Iran, 2011. [Google Scholar]
- Costello, V.F. Planning problems and policies in Tehran. In Urban Development in the Muslim World; Amirahmadi, H., El-Shakhs, S.S., Eds.; Center for Urban Policy Research: New Brunswick, NJ, USA, 1993; pp. 137–163. [Google Scholar]
- Kamalipour, H. Mapping Urban Interfaces: A Typology of Public/Private Interfaces in Informal Settlements. Spaces Flows 2017, 8, 1–12. [Google Scholar] [CrossRef]
- Bobić, M. Between the Edges: Street-Building Transition as Urbanity Interface; Thoth: Amsterdam, The Netherlands, 2004. [Google Scholar]
- Dovey, K.; Wood, S. Public/private urban interfaces: Type, adaptation, assemblage. J. Urban. 2015, 8, 1–16. [Google Scholar] [CrossRef]
- Alian, S.; Wood, S. Stranger adaptations: Public/private interfaces, adaptations, and ethnic diversity in Bankstown, Sydney. J. Urban. 2019, 12, 83–102. [Google Scholar] [CrossRef]
- Kamalipour, H.; Peimani, N. Negotiating Space and Visibility: Forms of Informality in Public Space. Sustainability 2019, 11, 4807. [Google Scholar] [CrossRef] [Green Version]
- Bromley, R. Street vending and public policy: A global review. Int. J. Soc. Soc. Policy 2000, 20, 1–28. [Google Scholar] [CrossRef]
- Kamalipour, H.; Peimani, N. Assemblage Thinking and the City: Implications for Urban Studies. Curr. Urban Stud. 2015, 3, 402–408. [Google Scholar] [CrossRef] [Green Version]
- Kamalipour, H.; Peimani, N. Towards an Informal Turn in the Built Environment Education: Informality and Urban Design Pedagogy. Sustainability 2019, 11, 4163. [Google Scholar] [CrossRef] [Green Version]
Figure 1.
Multiscale urban mapping.

Figure 2.
Major public transport networks in Tehran in relation to selected study areas. Maps: Nastaran Peimani.
Figure 2.
Major public transport networks in Tehran in relation to selected study areas. Maps: Nastaran Peimani.

Figure 3.
Shoosh study area. Maps: Nastaran Peimani.

Figure 4.
Building footprints, street network, and accessible interfaces within a 5-min timeframe (red and white dots: station entries)—(1 × 1 km). Maps: Nastaran Peimani.
Figure 4.
Building footprints, street network, and accessible interfaces within a 5-min timeframe (red and white dots: station entries)—(1 × 1 km). Maps: Nastaran Peimani.

Figure 5.
The mix of stationary activities and the midday-peak volume of pedestrian flows (1 × 1 km). Maps: Nastaran Peimani.
Figure 5.
The mix of stationary activities and the midday-peak volume of pedestrian flows (1 × 1 km). Maps: Nastaran Peimani.

Figure 6.
Sarsabz study area. Maps: Nastaran Peimani.

Figure 7.
Building footprints, street network and accessible interfaces within a 5-min timeframe (red and white dots: station entries)—(1 × 1 km). Maps: Nastaran Peimani.
Figure 7.
Building footprints, street network and accessible interfaces within a 5-min timeframe (red and white dots: station entries)—(1 × 1 km). Maps: Nastaran Peimani.

Figure 8.
The mix of stationary activities and the midday-peak volume of pedestrian flows (1 × 1 km). Maps: Nastaran Peimani.
Figure 8.
The mix of stationary activities and the midday-peak volume of pedestrian flows (1 × 1 km). Maps: Nastaran Peimani.

Figure 9.
Comparative mapping of the study areas. Maps: Nastaran Peimani.

© 2020 by the authors. Licensee MDPI, Basel, Switzerland. This article is an open access article distributed under the terms and conditions of the Creative Commons Attribution (CC BY) license (http://creativecommons.org/licenses/by/4.0/).
Share and Cite
MDPI and ACS Style
Peimani, N.; Kamalipour, H. Access and Forms of Urbanity in Public Space: Transit Urban Design Beyond the Global North. Sustainability 2020, 12, 3495. https://0-doi-org.brum.beds.ac.uk/10.3390/su12083495
AMA Style
Peimani N, Kamalipour H. Access and Forms of Urbanity in Public Space: Transit Urban Design Beyond the Global North. Sustainability. 2020; 12(8):3495. https://0-doi-org.brum.beds.ac.uk/10.3390/su12083495
Chicago/Turabian StylePeimani, Nastaran, and Hesam Kamalipour. 2020. "Access and Forms of Urbanity in Public Space: Transit Urban Design Beyond the Global North" Sustainability 12, no. 8: 3495. https://0-doi-org.brum.beds.ac.uk/10.3390/su12083495
Note that from the first issue of 2016, this journal uses article numbers instead of page numbers. See further details here.