Article

Effects of Supercritical CO2 Treatment Temperatures on Mineral Composition, Pore Structure and Functional Groups of Shale: Implications for CO2 Sequestration

1
National and Local Joint Engineering Research Center of Shale Gas Exploration and Development, Chongqing Institute of Geology and Mineral Resources, Chongqing 400042, China
2
School of Resources and Safety Engineering, Chongqing University, Chongqing 400030, China
3
State Key Laboratory of Nuclear Resources and Environment, School of Earth Sciences, East China University of Technology, Nanchang 330013, China
4
Engineering Research Centre for Waste Oil Recovery Technology and Equipment, Ministry of Education, Chongqing Technology and Business University, Chongqing 400067, China
*
Authors to whom correspondence should be addressed.
Sustainability 2020, 12(9), 3927; https://0-doi-org.brum.beds.ac.uk/10.3390/su12093927
Submission received: 18 March 2020 / Revised: 29 April 2020 / Accepted: 6 May 2020 / Published: 11 May 2020
(This article belongs to the Special Issue Geological Storage of CO2 and Climate Control)

Abstract

:
Research on the physicochemical reactions between supercritical carbon dioxide (Sc-CO2) and shale at different temperature is essential for geological CO2 sequestration. In this paper, shale from the Longmaxi formation in Sichuan basin of China was collected to study the changes in mineral composition, pore structure, and organic functional groups treated with Sc-CO2 at fixed pressure 8 MPa and temperatures 40 °C to 80 °C. Samples were analyzed with x-ray diffraction, CO2/N2 gas adsorption, and Fourier transform infrared spectroscopy. The results show that the dissolution of clay minerals by Sc-CO2 first declined, but then increased when the temperature increased; dissolution reached a minimum at 60 °C. The specific surface area, total pore volume, predominant pore type (mesopores), and fractal dimension of the shale pore structure first increases and then decreases with increasing temperature. The destruction of hydroxyl structures by Sc-CO2 is related to the destruction of OH–N and ring hydroxyls. As the temperature increases, the hydroxyl destruction first increases and then decreases. The aromatic hydrocarbons are mainly dominated by 3H and 2H, and their abundances increase significantly as temperature increases, whereas the 4H shows a decreasing trend; the 1H abundance does not change appreciably. The relative abundances of aromatic and aliphatic hydrocarbons decrease linearly as the temperature increases. These research results provide theoretical support for the geological storage of Sc-CO2 in shale at different temperatures.

1. Introduction

While the global climate comtimes to warm, carbon dioxide (CO2) emissions from the burning of fossil fuels continually attracts attention from many countries. The British Petroleum Corporation released the “World Energy Statistics Yearbook 2019” and pointed out that in 2018, oil is still the world’s largest source of fuel for the primary energy market; oil accounts for more than a third (33.6%) of total energy consumption. Coal fell to 27.2% of total consumption, and the natural gas proportion rose to 23.8%. CO2 capture and storage (CCS) is a process consisting of the separation of CO2 from industrial and energy-related sources, transport to a storage location and long-term isolation from the atmosphere. Some scholars also suggest to capture CO2 emissions from carbon-rich sources, such as steel plants, in order to produce useful chemicals [1,2,3]. Changing the energy structure, developing clean energy, and sequestering CO2 in geological storage are the main proposals for mitigating the global greenhouse gas effects of energy consumption [4,5]. Shale gas, as unconventional energy, has attracted much attention and development in many countries [6]. Shale gas global recoverable reserves have reached 207 × 1012 m3 [7]. China’s recoverable shale gas reserves are around 25.08 × 10¹² m3 [8], 12.1% of the global recoverable reserves. It is clear that Chinese shale gas has great commercial value [9]. The porosity of shale is generally 6–10%, and the permeability is lower than 0.001 × 10⁻³ μm2. Because of their extremely low porosity and permeability, shale gas reservoirs can provide an ideal environment for CCS [10,11,12,13].
Drilling horizontal wells and employing hydraulic fracturing is the main technology used for enhanced shale gas recovery (ESGR). Although hydraulic fracturing can effectively increase reservoir permeability, it has a number of disadvantages, such as consuming a large amount of water and causing fracturing fluid pollution, reservoir damage, and clay mineral expansion [14]. Many researchers in China and elsewhere have proposed using supercritical carbon dioxide (Sc-CO2) for ESGR [15,16,17,18,19]. The Sc-CO2 fracturing method has a lower stratum initial breakdown pressure and can generate a more complex fracture network than hydraulic fracturing owing to the Sc-CO2′s low viscosity and high dispersion [16,20]. Carbon dioxide has a better adsorption capacity than methane (CH4), so it is easier for the CO2 to be adsorbed in shale pores and thereby drive CH4 out [21]. This is a great help from both economic and environmental aspects [22].
Extensive theoretical and experimental studies have been carried out to identify the interactions between Sc-CO2 and shale. When Sc-CO2 is injected into shale, the shale’s mechanical and adsorption-induced deformation will be macroscopically affected [23,24,25,26,27]. Many researchers have found that the uniaxial compressive strength and elastic modulus of shale decrease after it is saturated with Sc-CO2, but the shale’s ductility increases [24,25,28,29]. The shale’s deterioration is caused by changes in its pore structure and mineral composition. Changes in pore volume and specific surface area (SSA) further affect the rock’s capacity for adsorption, and this plays an important role in CH4 and CO2 adsorption that affects both ESGR and CCS [30,31]. Yin et al. studied the physical and structural changes in shale after exposing their shale samples to Sc-CO2 at a single temperature (40 °C). Their study indicated that both the total pore volume (TPV) and SSA decreased—especially the pore volume and SSA of the micropores [32]. Zhou et al. [8] also documented the TPV, SSA, and functional group variations influenced by pressurized Sc-CO2 treatment at a single temperature (35 °C). Pan et al. [33] showed that Sc-CO2 can change the shale’s pore structure more than subcritical CO2 can change it, and that this was true for both marine and terrestrial shales. Bakhshian et al. [34] proposed a model that combined lattice density functional theory with finite element formulations to compute the induced gas adsorption swelling for different shale pore sizes and pore geometries at temperatures between 31.28 °C and 90 °C. These changes in the microscopic pore structure will affect the adsorption and desorption of CH4 in the shale, as well as affecting the fluid flow, migration states, and subsequent geological CO2 sequestration.
In addition to altering the mechanical properties and microstructure of the shale, some organic substances show solubility in Sc-CO2(Tc = 31.06 °C, Pc = 7.38 MPa), which will also affect the shale’s chemical makeup by affecting the hydroxyls, aromatic hydrocarbons, aliphatic groups, and other functional groups. These functional group changes will also have an effect on the shale’s adsorbability. Palma et al. [35] found that under 80 °C and 21.7 MPa experimental condition, n-aliphatic hydrocarbons can be extracted from shale by Sc-CO2. Lu et al. [36] documented that the adsorption of CO2 and CH4 on carbon materials were affected by –COOH, –OH, and –H abundances. Zhang et al. [37] reported that the weakly polar functional groups in coal can be extracted more easily by Sc-CO2 than the polar functional groups and that the polar functional groups remain essentially unchanged when the extraction is attempted. It has been noted that the toxic material extracted by Sc-CO2 is one of the factors that must be considered when evaluating long-term CCS in shale reservoirs.
Fourier transform infrared spectroscopy (FTIR) is a fast and nondestructive method for the analysis and measurement of the chemical structure of solid fossil fuels. The changes in functional groups in shale affected by Sc-CO2 have been studied using FTIR [8,32]. However, these investigations just studied the absorption peak changes incidentally and only reached qualitative conclusions. Therefore, there is a lack of quantitative research on the chemical structure of shale exposed to Sc-CO2.
Shale is a complex heterogeneous material composed of inorganic and organic matter, and both the mineral composition and pore structure of the shale significantly influence Sc-CO2 fracturing and long-term geological CO2 sequestration. Hydrocarbons extracted from shale may be toxic, which is significant regarding the evaluation of CCS safety. At present, only a few studies have investigated the influence of Sc-CO2 treatment temperatures on the pore structure and functional groups of shale.
This paper reports the results of a study of the physical and chemical changes in shale samples treated with Sc-CO2 at different temperatures. The changes to the shale’s mineral composition, pore structure, and organic functional groups were determined using x-ray diffraction (XRD), low pressure CO2 and N2 gas adsorption, and FTIR methods. The chemical structure of the shale samples was semi-quantitatively analyzed by curve fitting. The results provide a comprehensive analysis of the physicochemical reactions between Sc-CO2, and shale can help to reveal the mechanisms that underlie both ESGR and CCS.

2. Experimental Methods

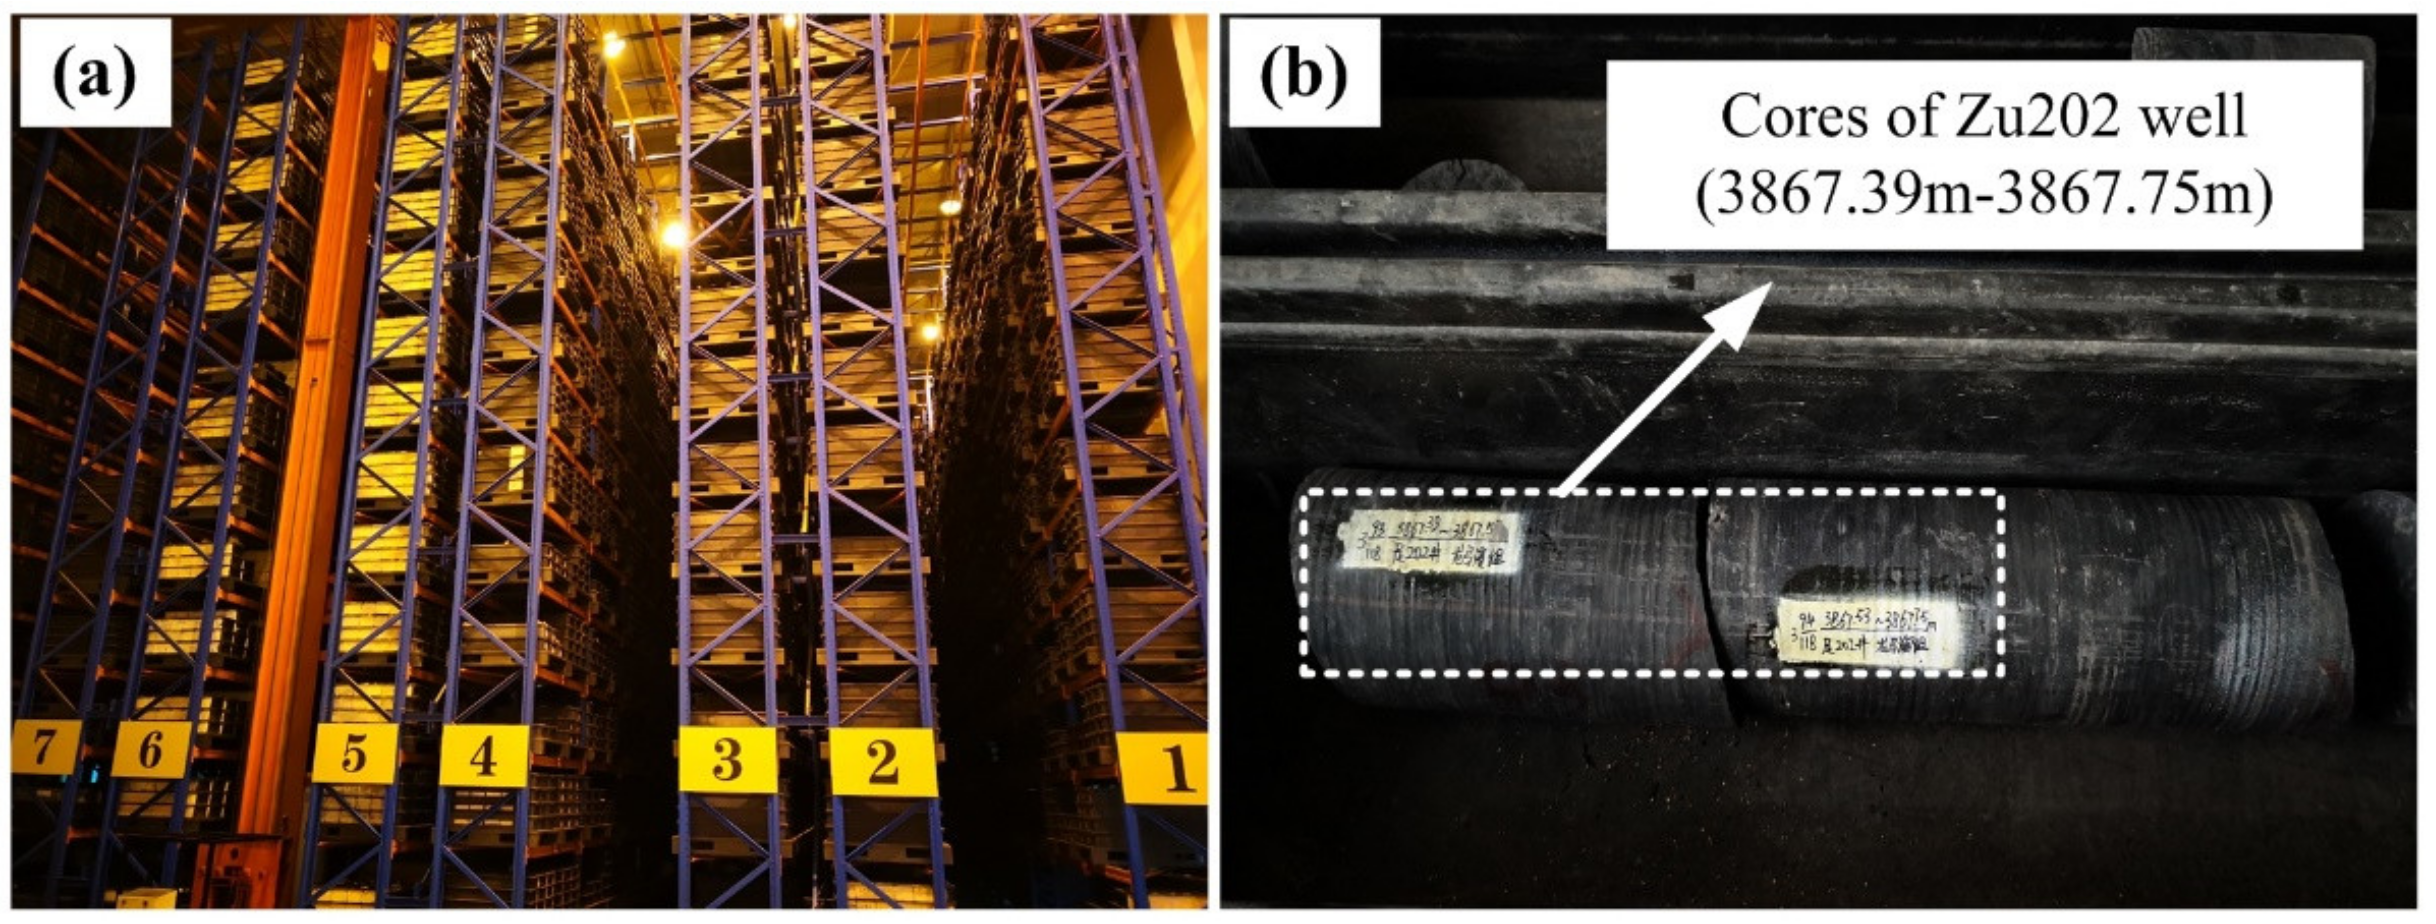
2.1. Sample Collection, Preparation, and Analytical Equipment

When CO2 is sequestered in the formation, the state of the rock material (such as in-situ stress, temperature, and pore pressure) has a great influence on the effect of CO2. Due to the limitation of the experimental conditions, experiments in this paper is carried out in the laboratory to study the shale changes after depressurization. The samples used in this study are black shale collected from drill core from well Zu202 (Figure 1) drilled in Chongqing, China. Well Zu202 penetrates the Silurian Longmaxi Formation, a marine shale. The whole core is approximately 3867 m in length. The average vitrinite reflectance (Ro) and total organic carbon (TOC) of untreated shale are 2.55% and 0.67%, respectively. To meet the needs of different tests, ten shale cores of Φ25 mm × 50 mm were crushed and evenly mixed after sieving it into different size fractions.
Samples between 20 and 60 mesh (250–840 μm) were used for pore structure test by low pressure CO2 and N2 gas adsorption, performed at 0 °C and −196.15 °C, respectively. These tests were performed using a Micromeritics Surface Area and Porosimetry System (ASAP2020, Micromeritics Instruments Corporation, Norcross, GA, USA). Samples smaller than 200 mesh (<75 μm) were used for mineral composition and functional group tests. The mineral compositions of samples were determined with a Bruker x-ray diffractometer (Bruker D8 Advance, Billerica, MA, USA) in Chongqing Institute of Geology and Mineral Resources. The XRD device was used with Cu Kαradiation at 40 mA and 40 kV, and carried out in a 2θ range of 3° to 45° with a step size of 0.02° and a scanning speed of 2°/min. Quantification phase analysis was conducted with the value K method, following the Chinese oil and gas industry standard SY/T 5163-2018 [38,39,40], in which the relative deviation of test results is less than 10%, when mineral content is more than 40%. When the mineral standard and corundum are formulated into a two-phase mixture in a ratio of 1:1 by mass, the reference strength of the mineral i can be calculated as Equation (1). Therefore, the percentage of the mineral i can be described by Equation (2).
K i = I i I c o r
X i = I i K i I i K i × 100
where Ki is the reference intensity of mineral i; Ii is the intensity of a diffraction peak of mineral i; Icor is the intensity of a diffraction peak of corundum; Xi is the percent content of mineral i; Ii is the integral intensity of selected diffraction peaks of mineral i; Ki is the reference intensity of mineral i.
The functional groups were tested using a Nicolet iS50 type Fourier infrared spectrometer (Thermo Fisher Scientific, Waltham, MA, USA). The traditional KBr pellet method was used for FTIR measurement. The shale samples and the dried KBr were ground at a mass ration of 1:160 for 2 min and pressed into pellets in an evacuated die under 10 MPa pressure for 2 min. Samples were analyzed at ambient temperature, from a collection of 32 scans, with the scan range of 400–4000 cm−1, at a resolution of 4 cm−1.

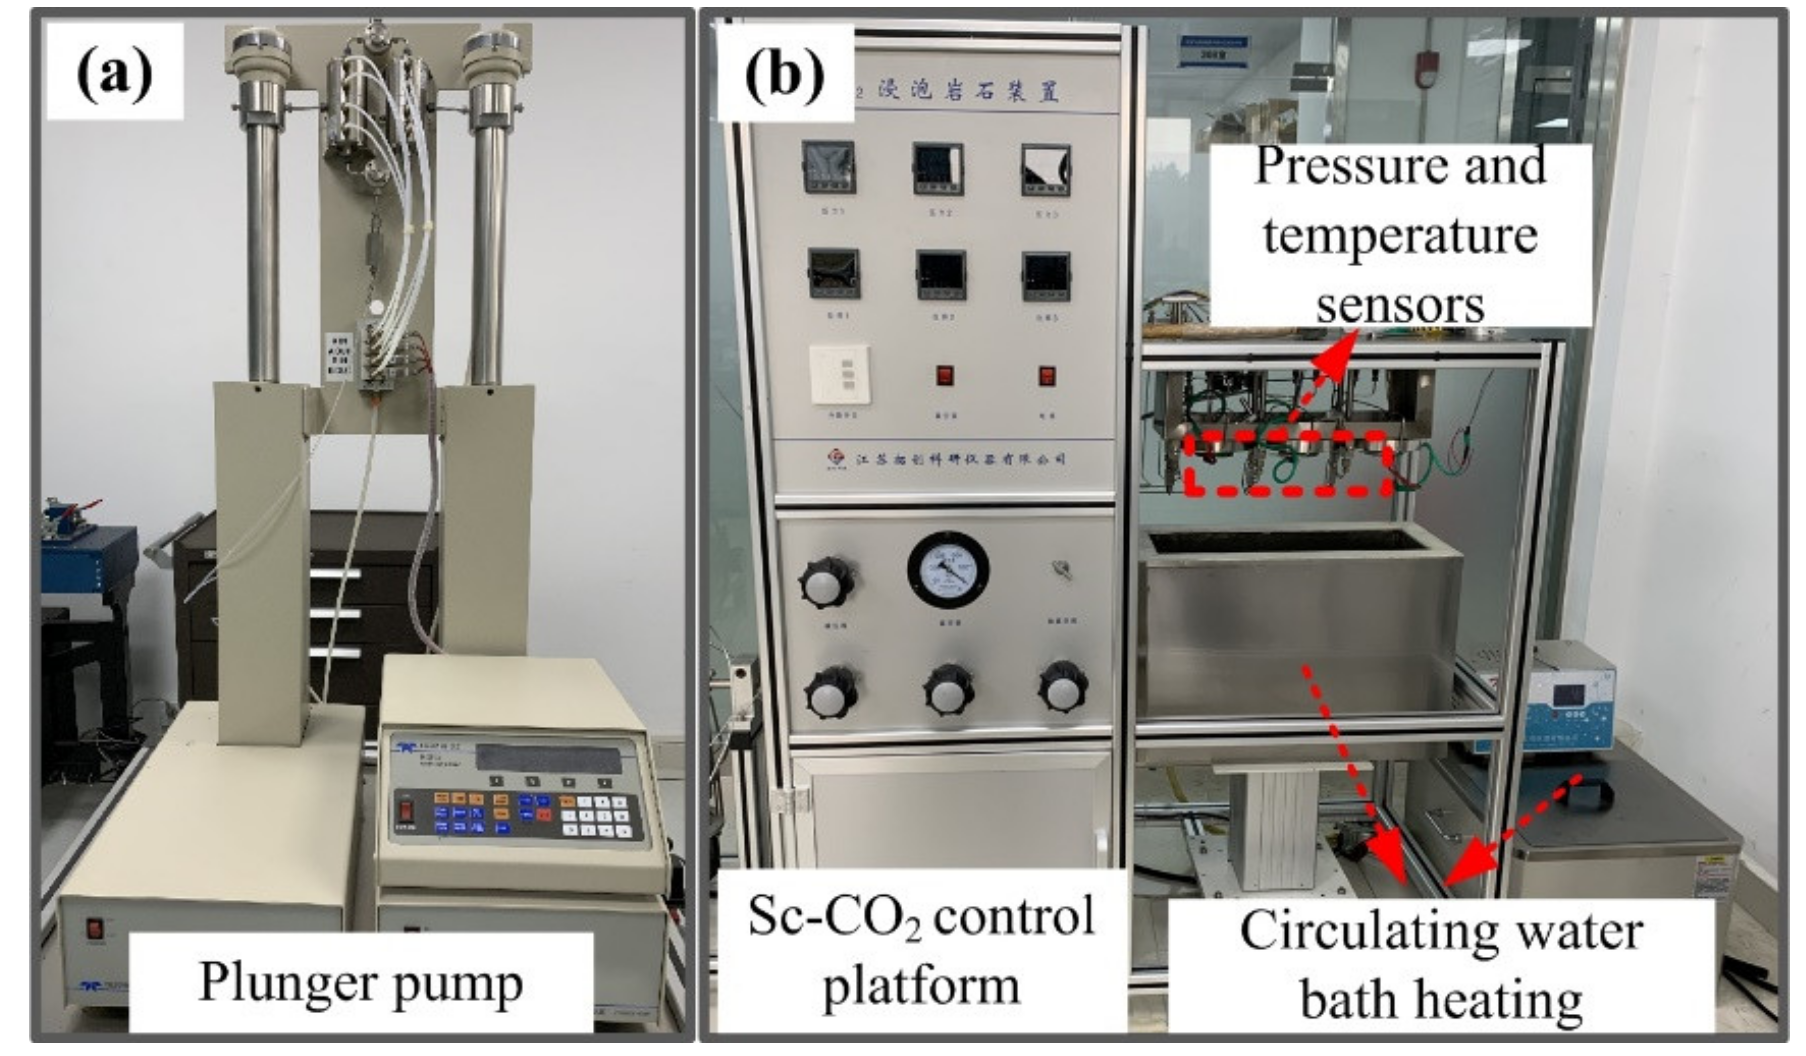
2.2. Experimental Design and Equipment

To study the influence of Sc-CO2 on the shale, samples under natural moisture content state were soaked in Sc-CO2 at different temperature and a fixed pressure. The average porosity of samples is 3.38%, and the average water saturation is 28.82%. The average geothermal gradient of Sichuan basin is 22.8 °C/km. According to the burial depth of the Longmaxi formation (1.5–4 km), the temperature range of shale reservoirs in Longmaxi formation is 34.2–91.2 °C. In this study, the influence of Sc-CO2 treatment temperature was mainly concerned, so the pressure performed was set at a fixed value to maintain its supercritical state. After crushing and sieving, the samples were divided into six groups—one of which, sample #1, was the raw sample used as a blank control. The other five groups of samples, #2–#6, were soaked at 40, 50, 60, 70, and 80 °C, respectively, for 96 h (4 days) at 8 MPa.
The equipment for the Sc-CO2 soaking experiments included an ISCO 260D plunger pump (Teledyne ISCO, Lincoln, NE, USA) and a circulating water bath heating system and control platform (Tuochuang, Haian, Jiangsu, China), (Figure 2). Sensors monitored the temperature and pressure in the immersion chamber with an accuracy of 0.01 MPa and 0.01 °C, respectively. In the experiments, samples are placed in the immersion chambers to be sealed, the water bath is heated to the appropriate experimental temperature, and then 99.99% purity CO2 is injected using the constant pressure mode of the ISCO plunger pump until the pressure is stable at 8 MPa. After an Sc-CO2 pressurization and soaking process, the tank was depressurized slowly to avoid pores change induced by a sudden depressurization, and samples were wrapped in polyethylene cling film and immediately sent for analysis.

3. Results and Discussion

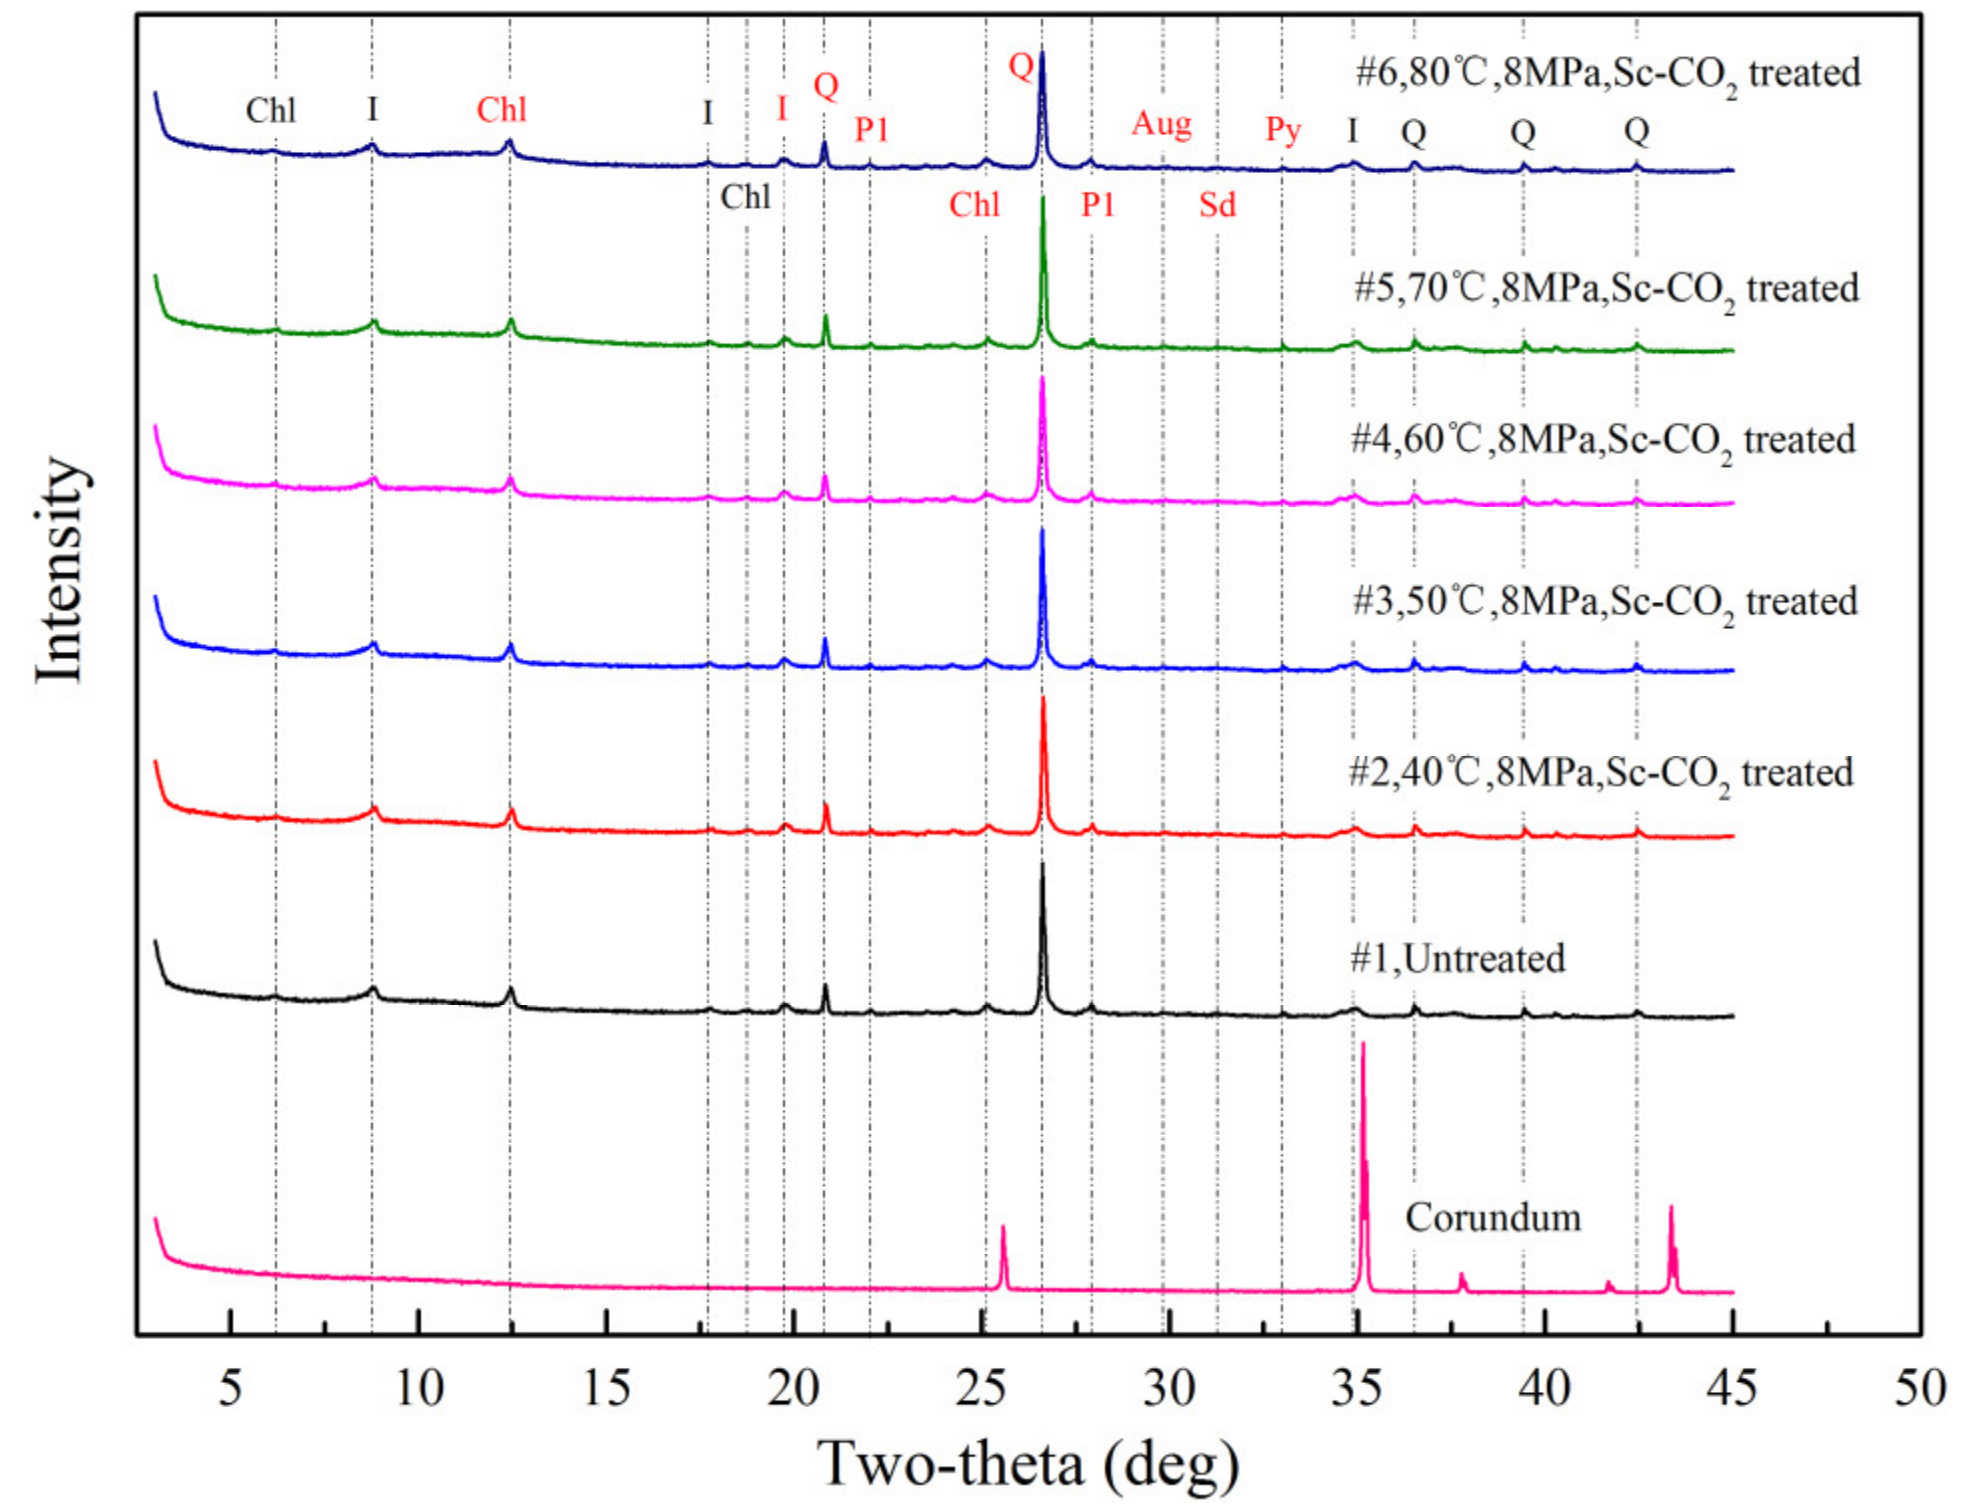
3.1. Mineral Abundances

Figure 3 shows the diffraction patterns of shale samples and the reference pattern of corundum. The diffraction peaks marked by red characters are those involved in the quantitative calculation. Therefore, the relative percentage of mineral content in shale samples can be obtained directly from the XRD result. As can be seen from Figure 3, the positions of the diffraction peaks of the minerals did not change substantially. The main peak changes were concentrated in quartz, followed by clay minerals (chlorite and illite). The proportions of each mineral based on the diffraction pattern were calculated as shown in Table 1, the minerals that constituted the shale before Sc-CO2 soaking were 48.2% clay, 41.4% quartz, and 6.1% plagioclase. Total calcite + dolomite + siderite + pyrite + augite amounted to only 4.3%; the authors consider this percentage to be negligible.
After the samples were treated with Sc-CO2 at the different temperatures, the abundances of quartz and clay in the samples changed. In general, the proportion of quartz increased and the proportion of clay minerals decreased. Specifically, as the treatment temperature increased from 40 °C to 80 °C, the clay content first decreased and then increased, whereas quartz content first increased and then decreased. Because Sc-CO2 does not react with quartz and the amounts of carbonate and other minerals in the samples were very low, it can be assumed that when the CO2 entered the nanoscale pores in the shale, it dissolved in the films of water between the grains to form H2CO3, carbonic acid. This would dissolve the kaolinite, illite, and chlorite in the shale and leave quartz. In addition, the acid would reduce clay minerals. Specifically, as shown in chemical Equations (3–6) [21], the original chlorite and kaolinite would dissolve to produce quartz. When illite dissolves, new kaolinite and quartz grains form. Because the newly generated quartz is stable in a weakly acidic environment, the newly generated kaolinite can consume H+ to be further dissolved. This is why, as shown in Table 1, the quartz percentage increased and the clay percentage decreased. Concerning the clay mineral reduction, in the 40–80 °C temperature range, as the Sc-CO2 treatment temperature increases, the Sc-CO2 first weakens and then augments the dissolution of the clay minerals. Clay mineral dissolution is weakest at 60 °C, so the clay content is lowest at this temperature.
CO 2 +   H 2 O     H 2 CO 3     H + +   HCO 3     CO 3 2 + 2 H +
  Illite   + 1.1 H +     0.77 kaolinite   + 0.6 K + + 0.25 Mg 2 + + 1.2 quartz   + 1.35 H 2 O
Kaolinite   + 6 H +     5 H 2 O   + 2 Al 3 + + 2 quartz
Chlorite   + 16 H +     2 Al 3 + + 5 Fe 2 + + 3 quartz + 12 H 2 O

3.2. Low-Pressure Gas Adsorption Analyses

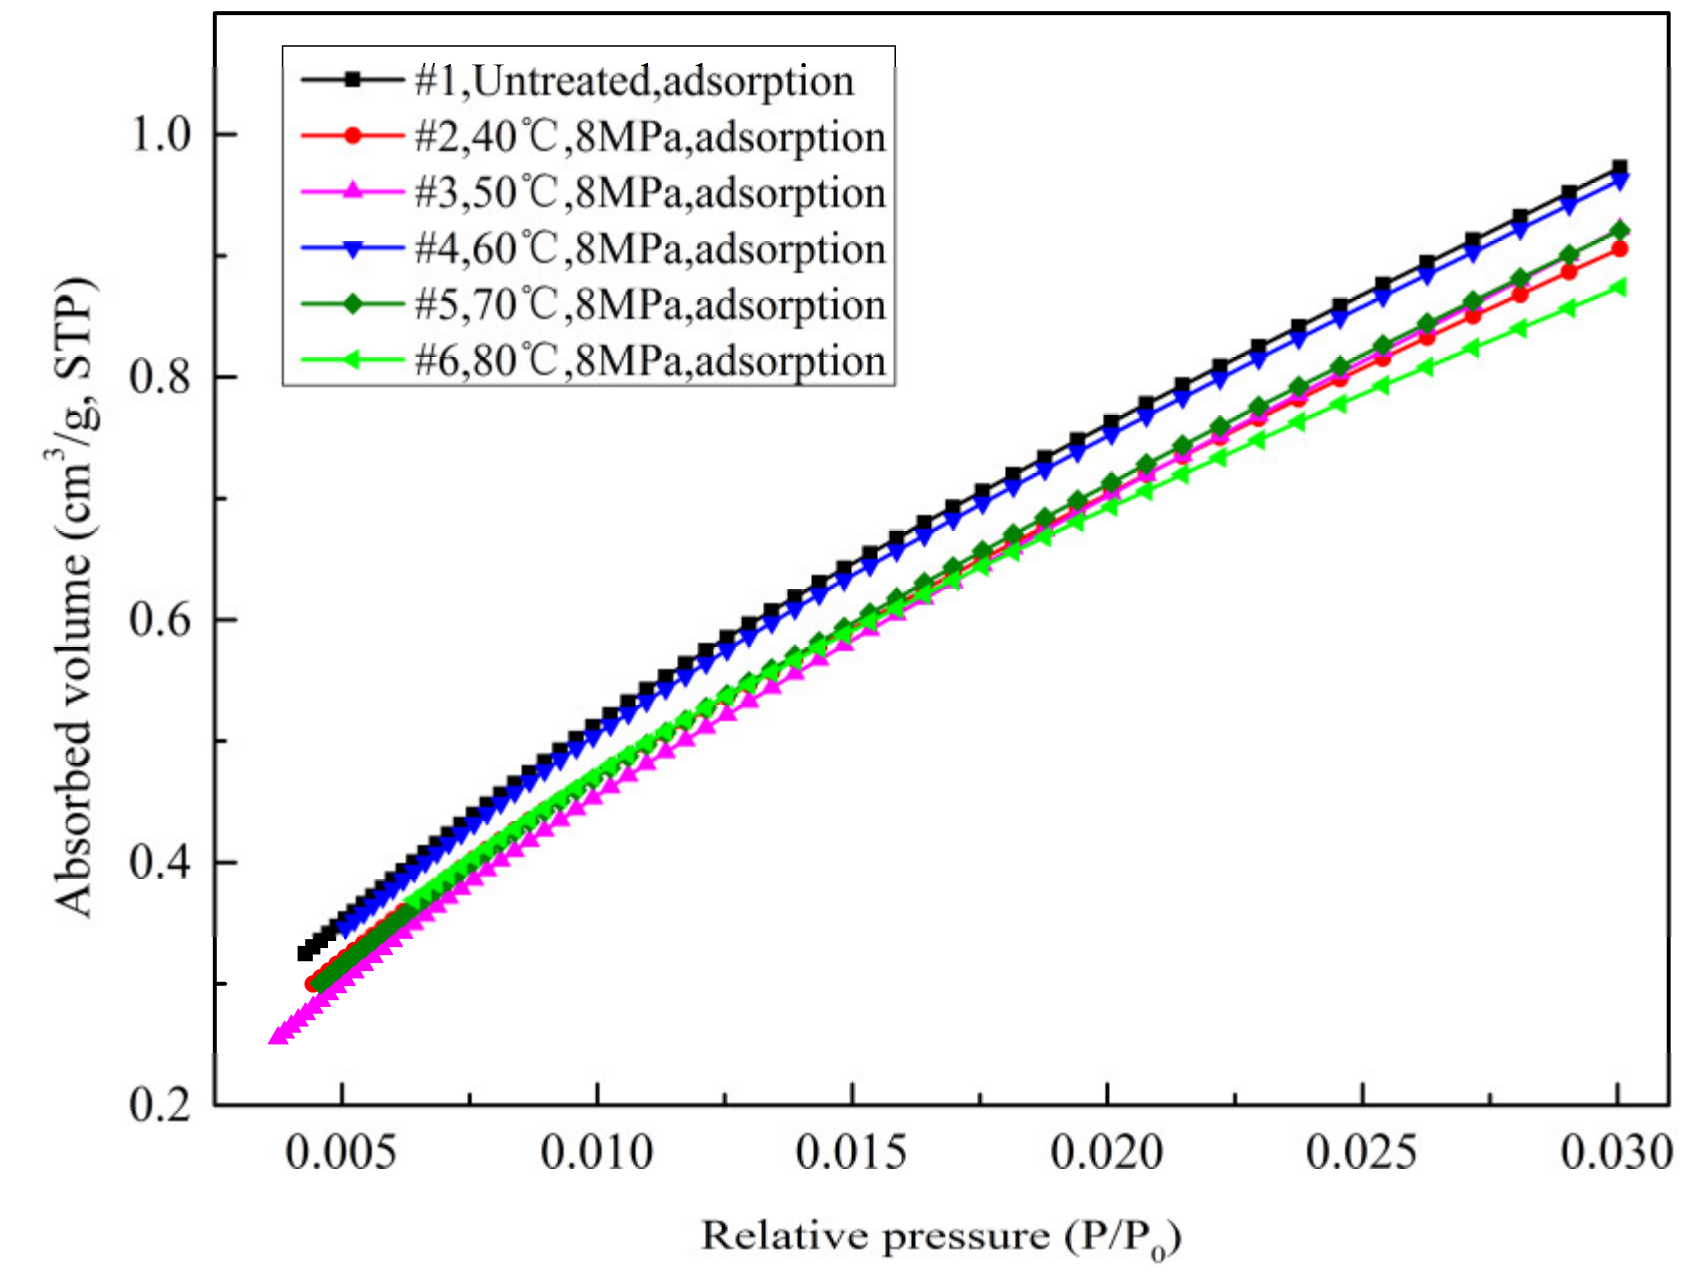
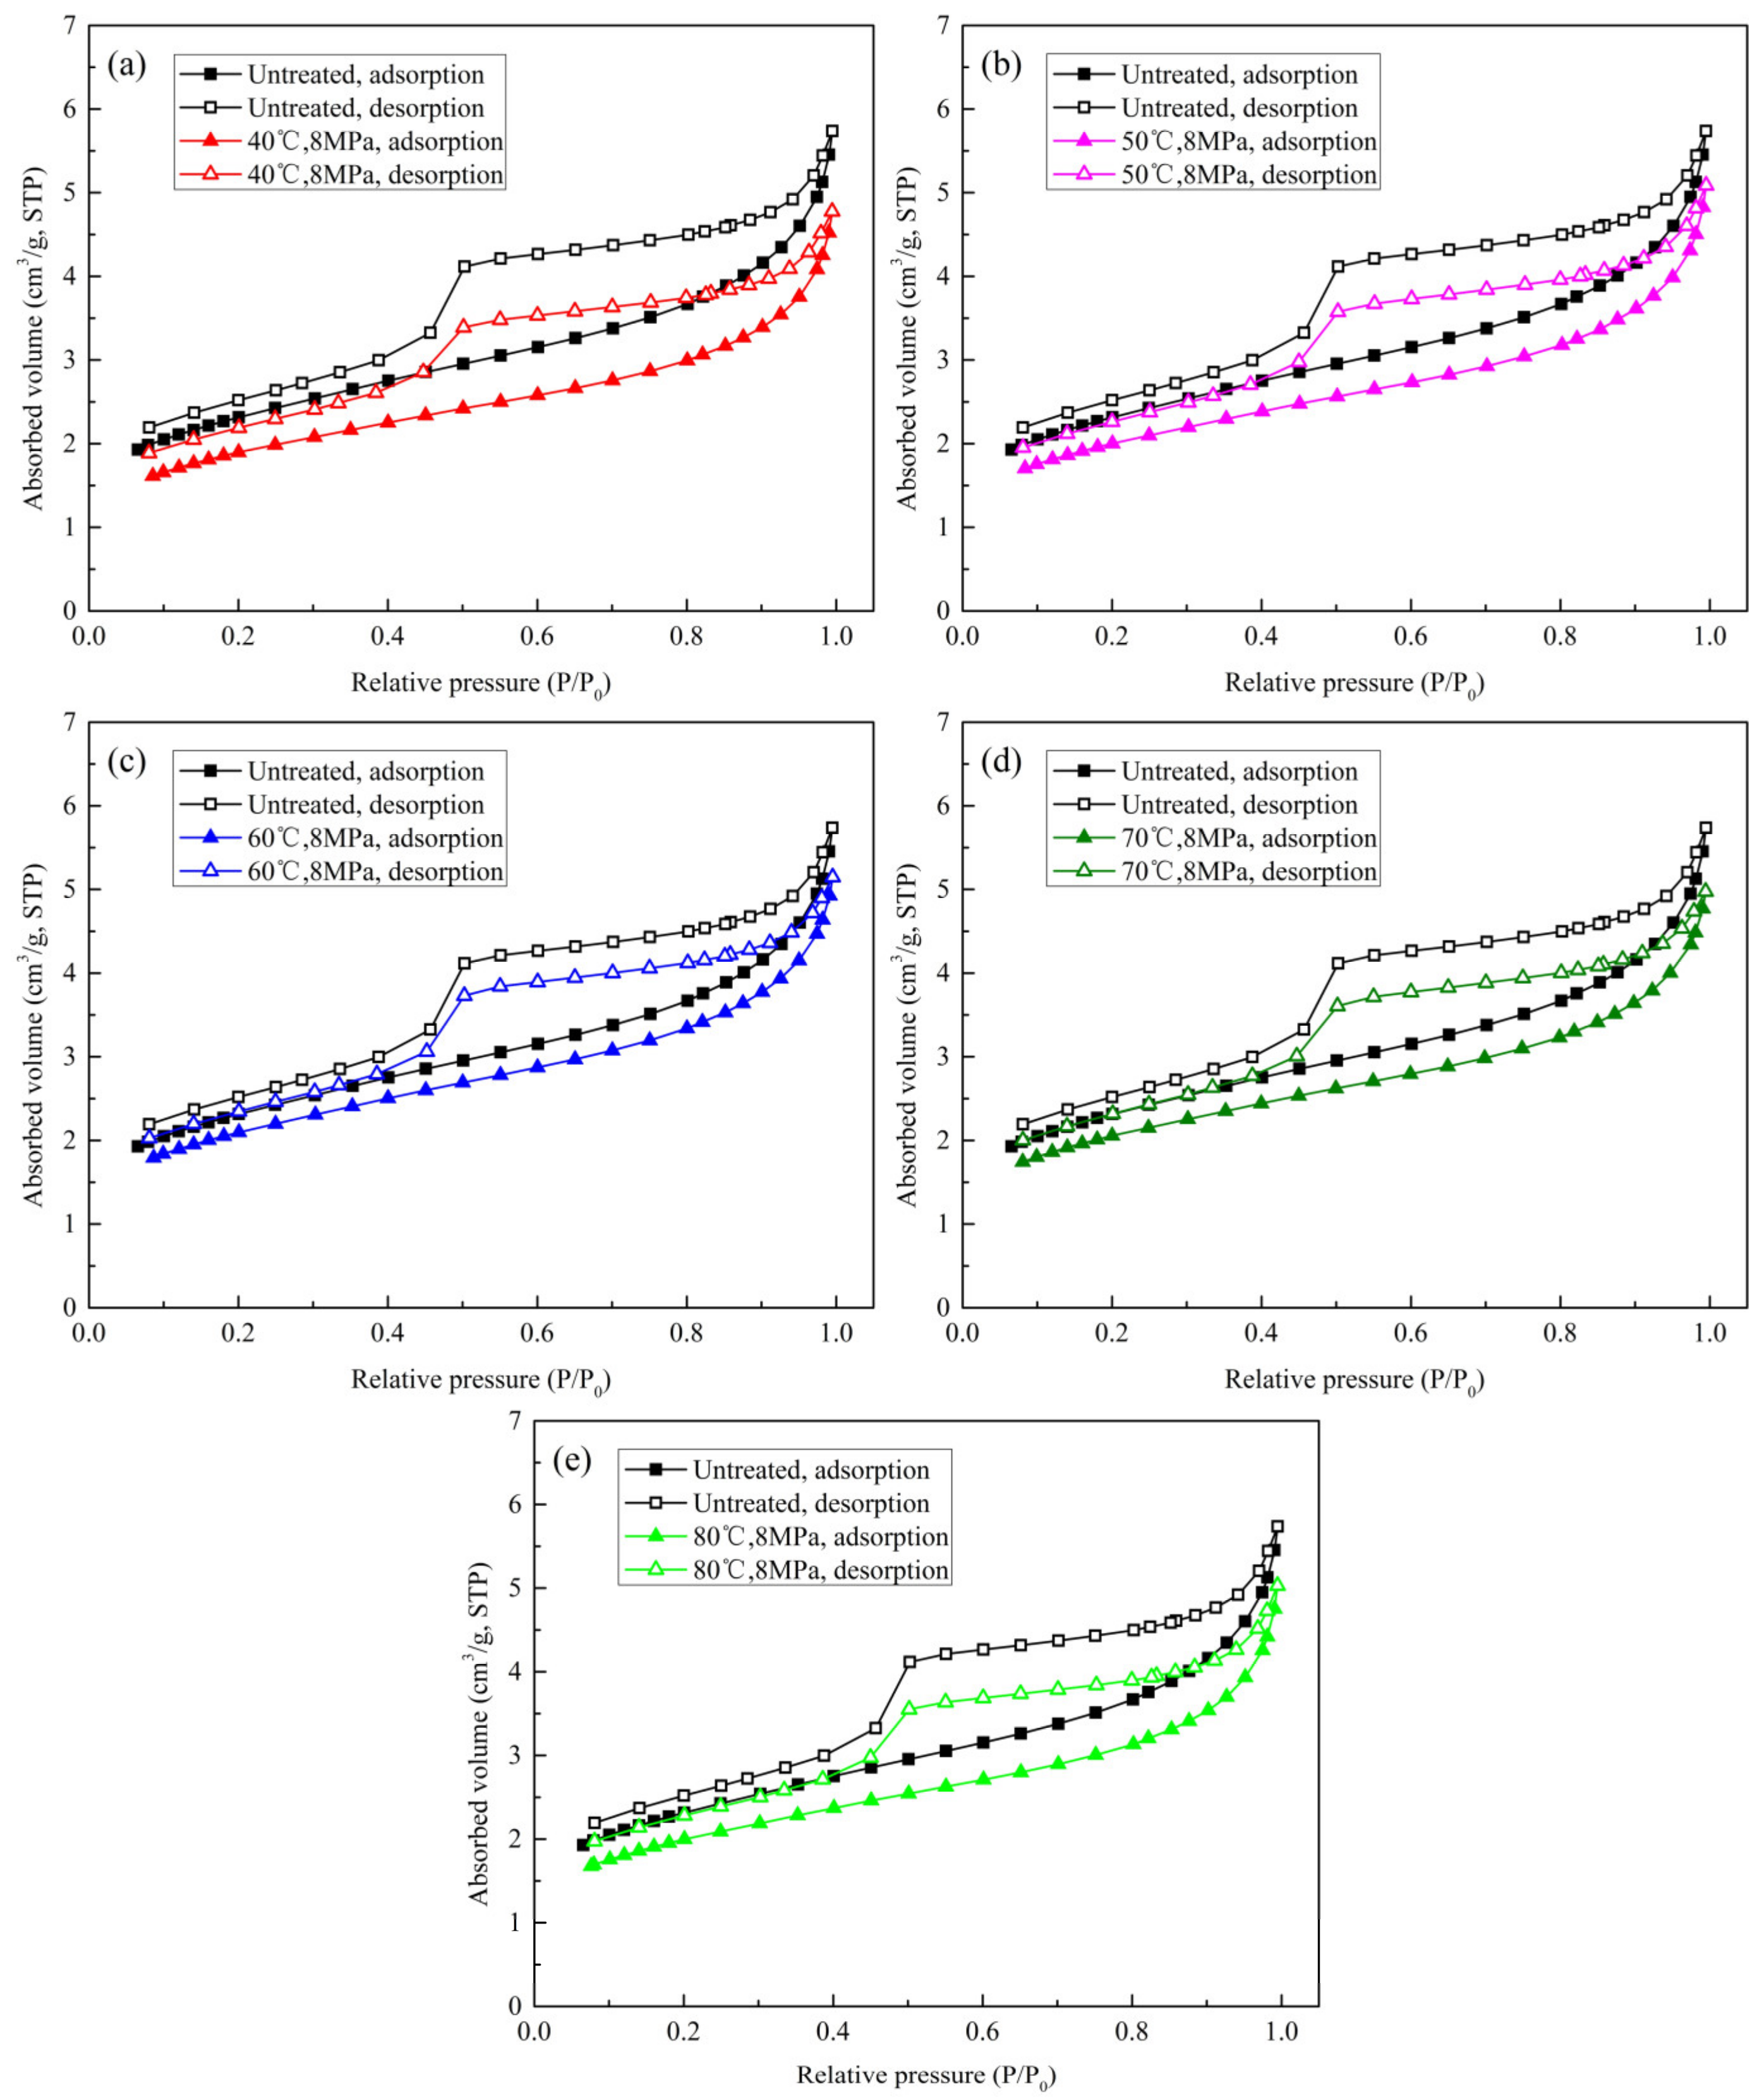
3.2.1. CO2 and N2 Adsorption Isotherms

The CO2 adsorption isotherms for all of the samples are shown in Figure 4. One isotherm is for the control sample, and the other five are isotherms for samples after treatment with Sc-CO2 at different temperatures. The N2 adsorption and desorption isotherms for identical samples are shown in Figure 5. It can be seen that the quantities of CO2 and N2 adsorbed by the samples treated with Sc-CO2 are lower than the quantities adsorbed by the untreated control sample. This reflects the reactions between the shale and the Sc-CO2 that reduced the shale’s adsorption capacity at all the temperatures tested. These results are supported by the experiments run by Pan et al. [33] that tested Longmaxi Formation shale samples collected from the outcrop. Changes in the SSA caused the reduced gas adsorption, the pore size distribution (PSD), and the TPV. These changes will be examined in more detail in the next section. According to the IUPAC isotherm classification scheme [32], the N2 adsorption isotherms are type IV isotherms and show that the pores in the untreated shale samples are mainly parallel split pores. Supercritical carbon dioxide temperature variations have little influence on pores of this shape.
In addition, the isotherms show that the quantities of CO2 and N2 adsorbed do not change uniformly with temperatures. For the samples treated with Sc-CO2, the quantity of CO2 adsorption was the highest for the sample treated at 60 °C followed, in decreasing order of CO2 absorption, by the samples treated at 50, 70, 40, and 80 °C. For N2, the order of decreasing adsorption quantity for treated samples was 60 °C, followed by 50, 80, 70, and 40 °C. Generally, at temperatures below 60 °C, the quantity of gas adsorbed gradually increased, but at temperatures above 60 °C, the amount of gas adsorbed decreased.
This relationship mimics the changes in the abundance of clay minerals in the samples. This is because after being treated with Sc-CO2, the adsorption capacity of the shale is mainly affected by the abundance of micro- and mesopores, and they are mainly contained in the organic matter and the clay minerals. A previous study has shown that the pores in the shales of the Longmaxi Formation can be divided into mineral-hosted pores and organic material-hosted pores [41]. Because the samples studied for our investigation had low organic matter contents, most of the micro- and mesopores are in the clay minerals. The lower the degree of clay mineral dissolution, the greater the number of micro- and mesopores in the sample, and thus, the less the adsorption capacity for CO2 and N2 is reduced. When the temperature at which samples are treated with Sc-CO2 in the 40–80 °C range increases, although the adsorptivity of treated shale samples is lower than that of untreated samples, the adsorptivity first increases and then decreases reaching its highest value at 60 °C. This trend is negatively correlated clay mineral abundances, as determined by XRD.

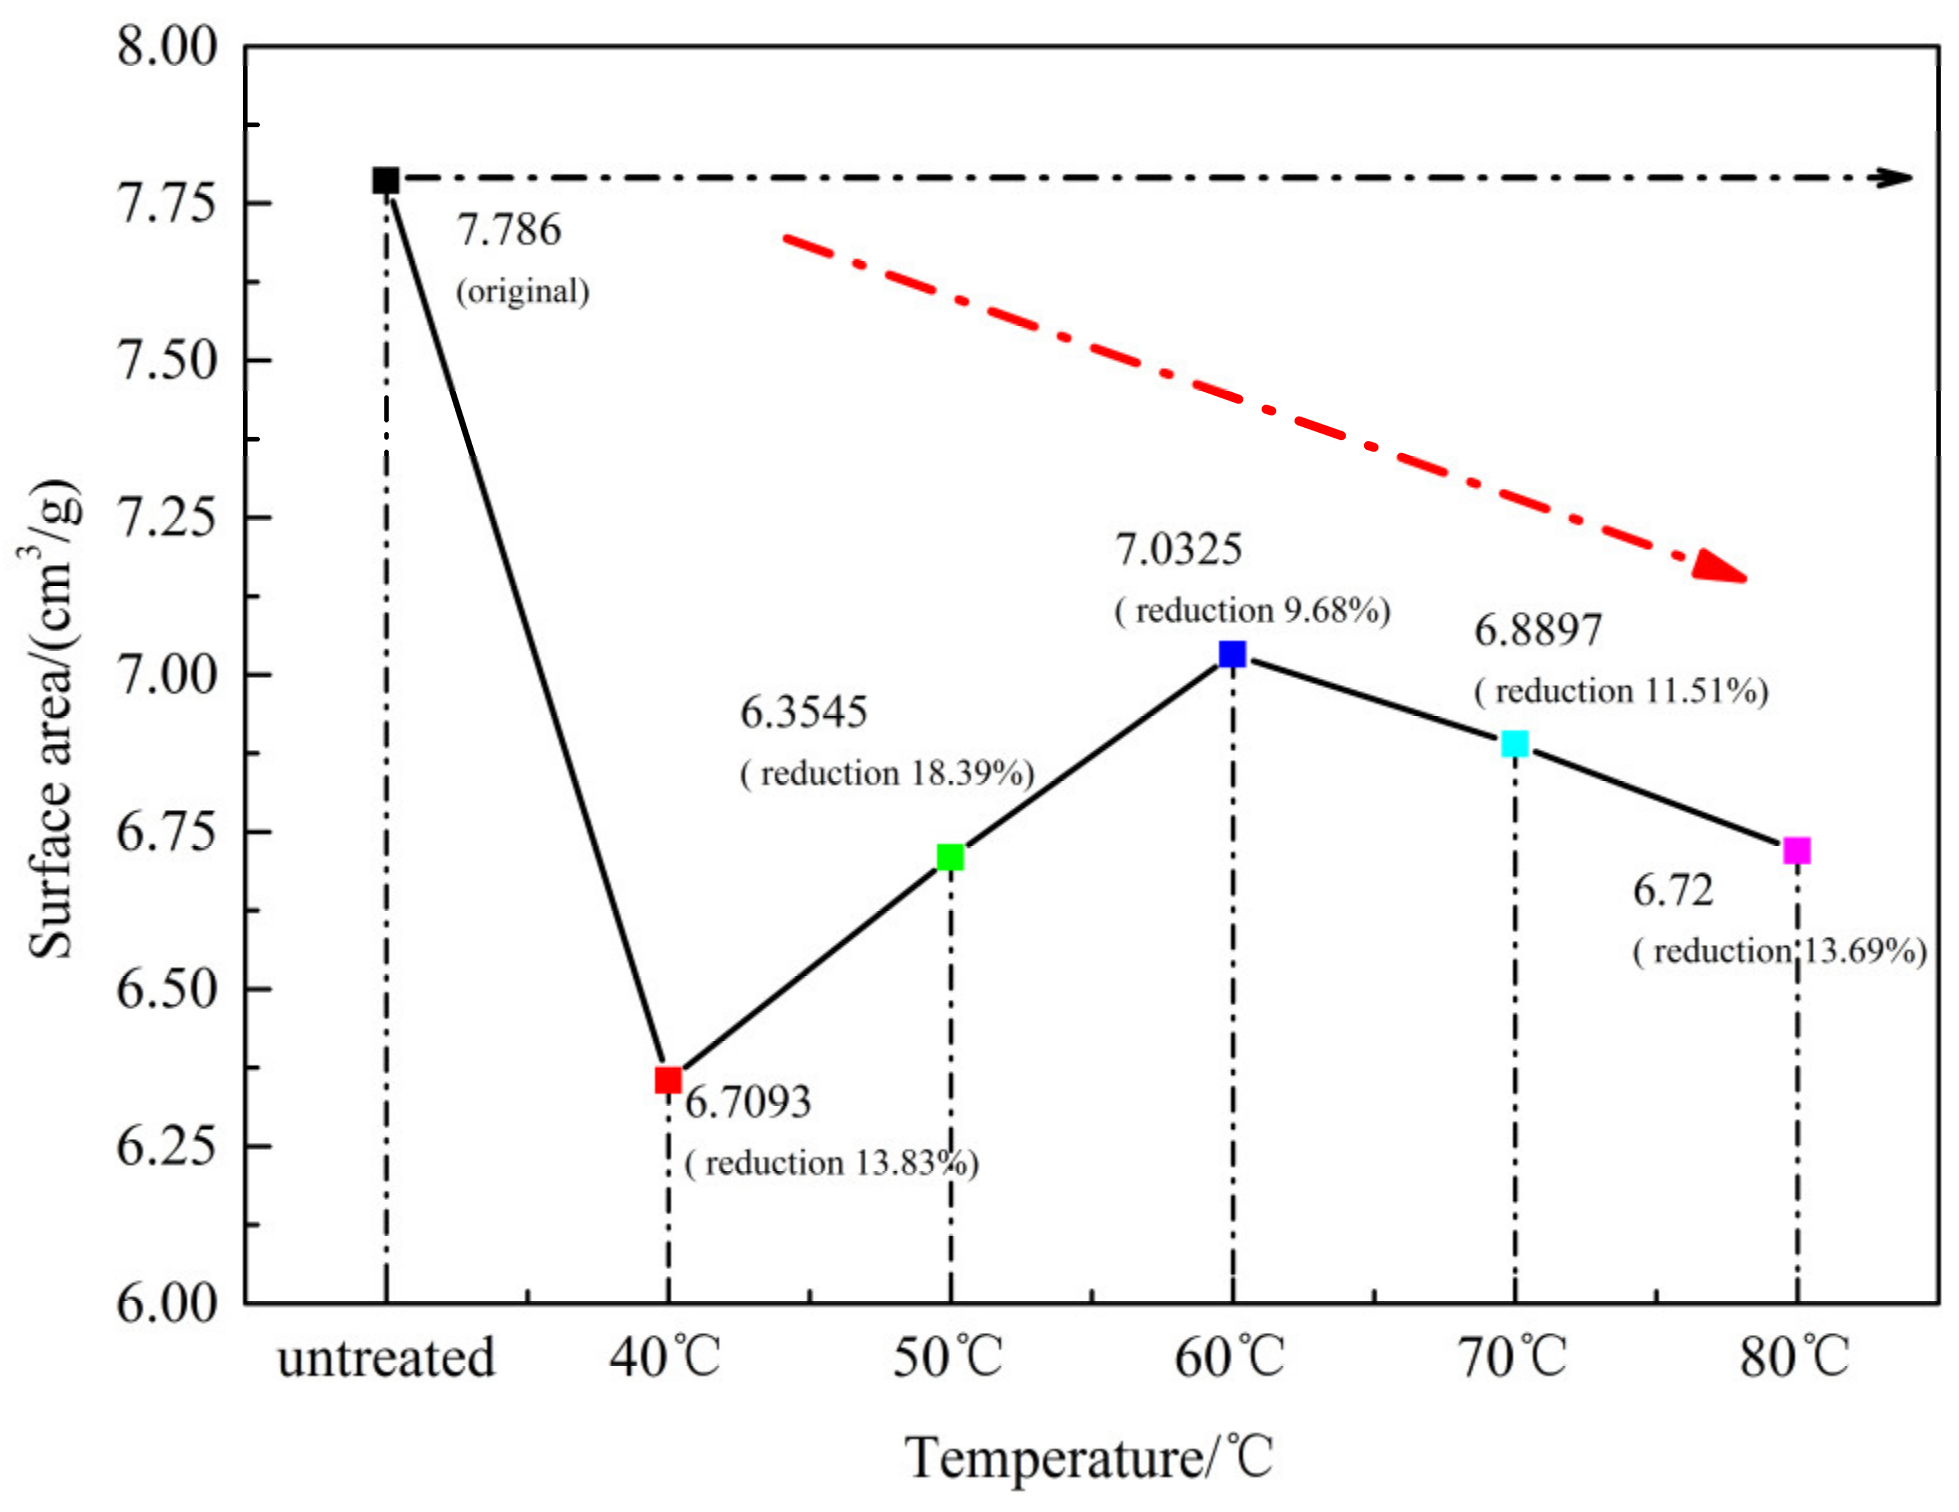
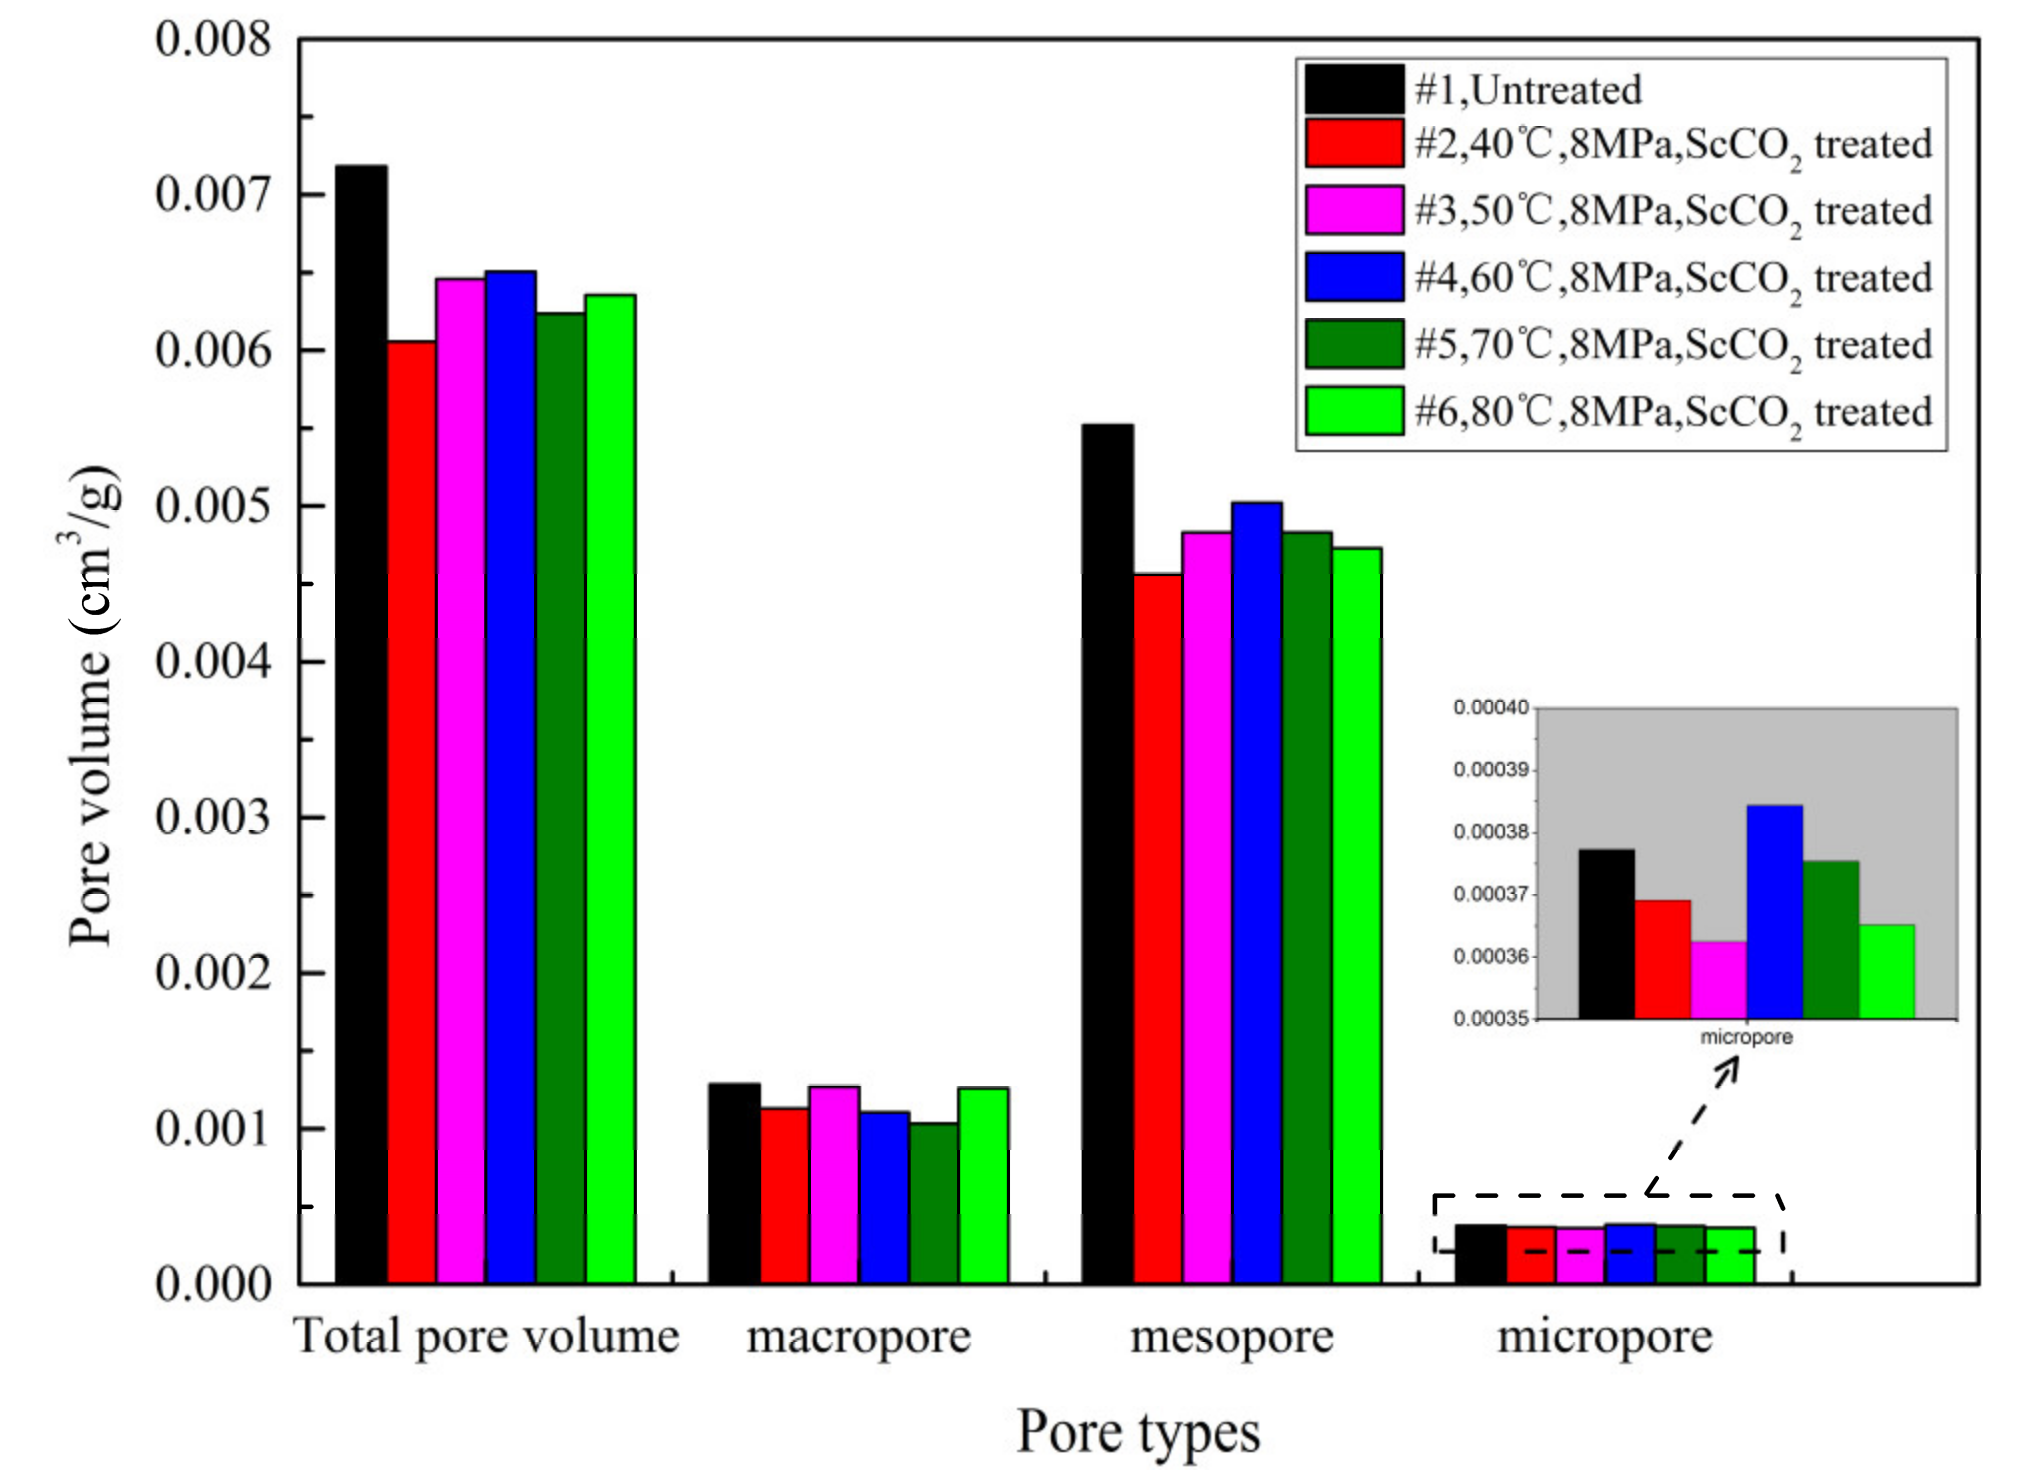
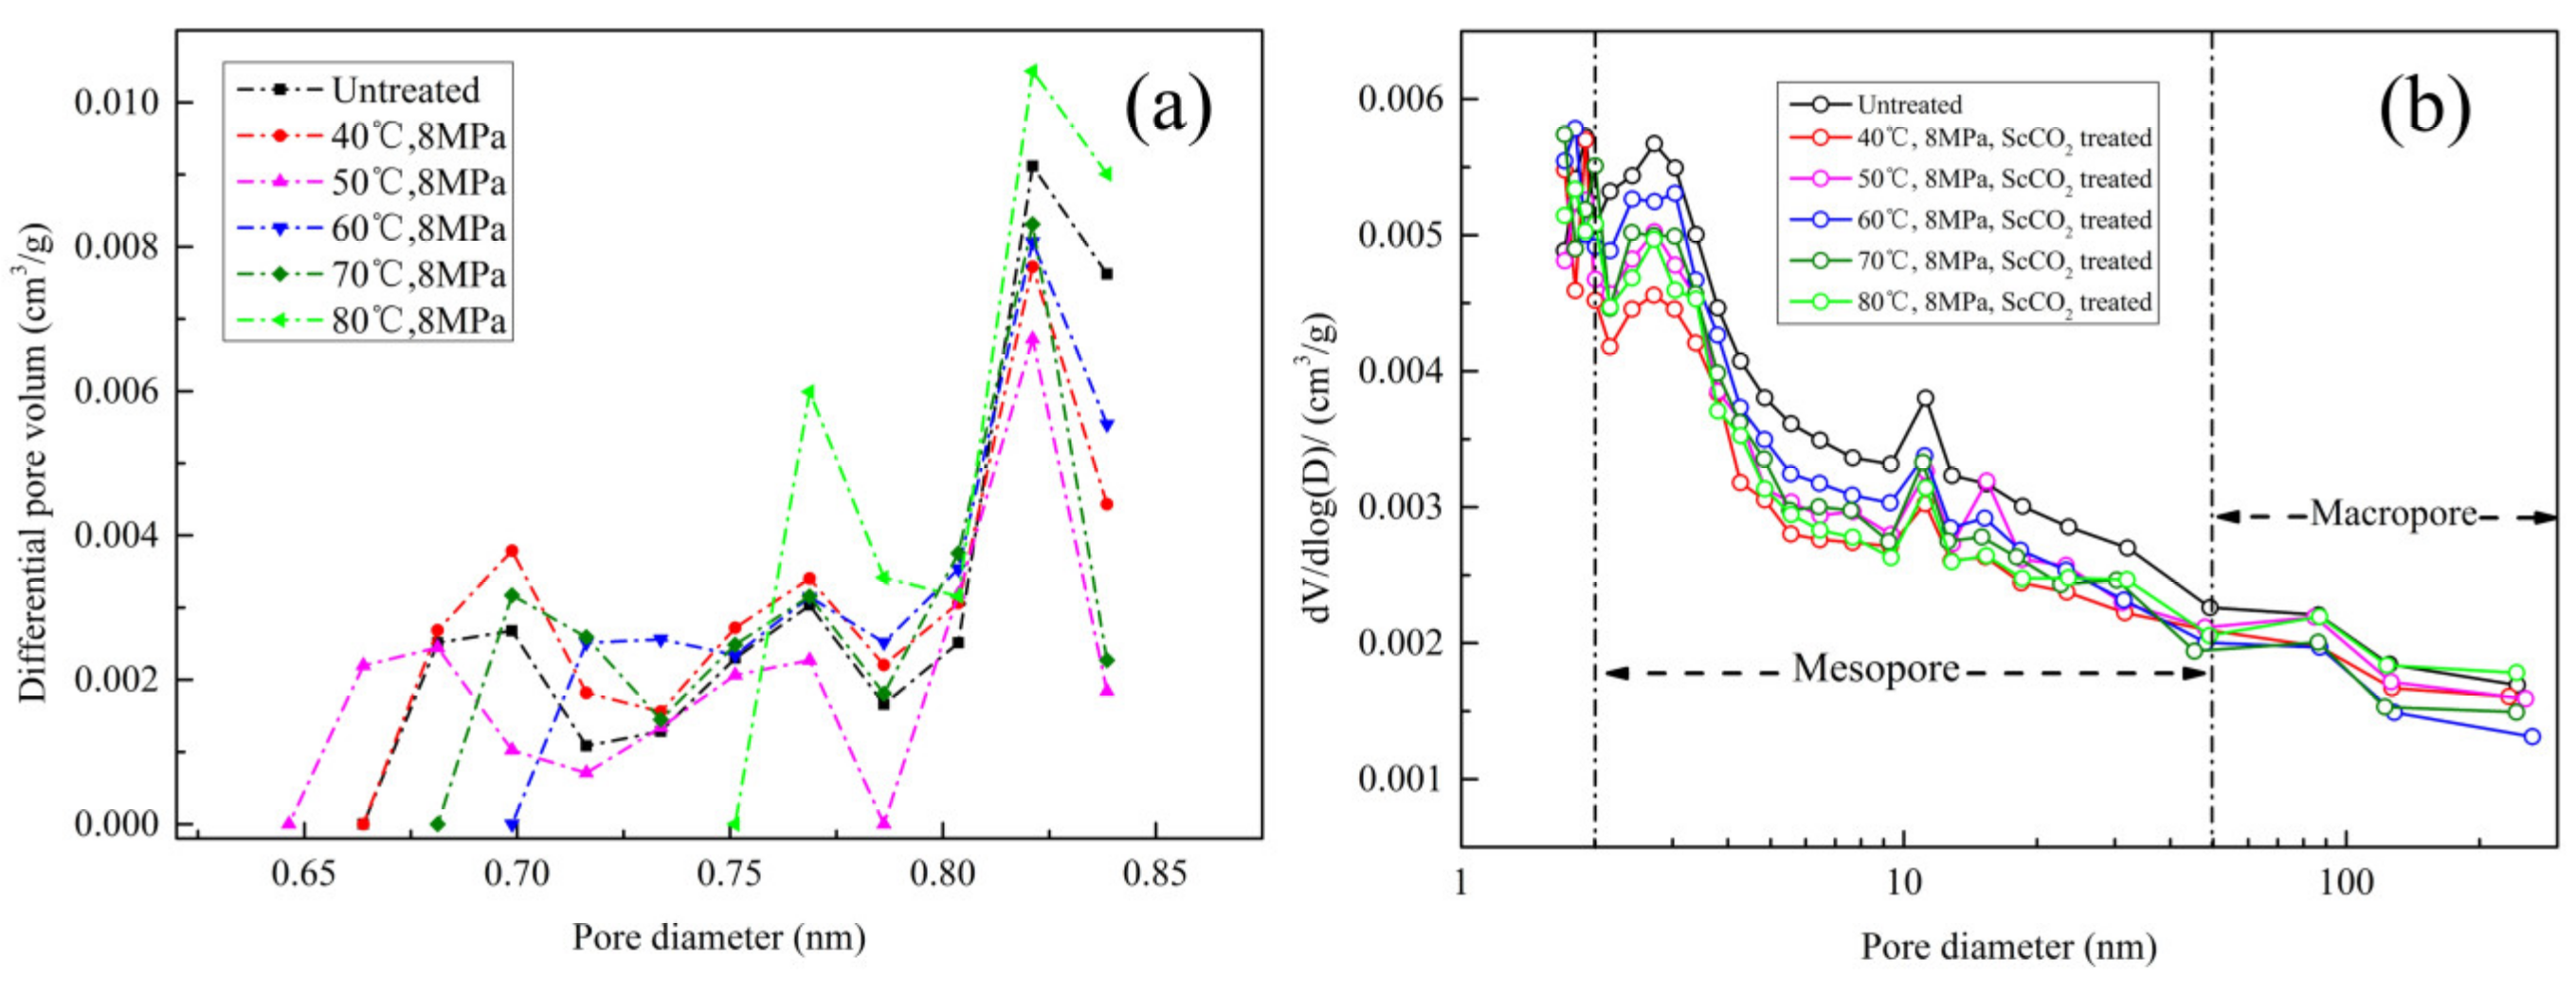
3.2.2. Shale Pores Specific Surface Areas, Total Volume, and Size Distribution

Supercritical carbon dioxide influences the pores and pore structure in shale in three main ways. First, Sc-CO2 can extract organic matter of shale to some extent so that it can dissolve the walls of organic pores in shale. This can change the pore structure through several mechanisms, such as generating new pores or by converting some of the micro- and mesopores into macropores [32]. Second, the H2CO3 formed from reactions between Sc-CO2 and hydrous silicates or the water films between minerals is a weak acid and may partially dissolve porous minerals. This will reduce the total pore volume in the shale, and thus, reduce the SSA and adsorption capacity. Third, the adsorption of CO2 by the shale matrix will change the surface potential energy of the shale [26,34]. According to the principle of energy conservation, the changed surface potential energy is equal to the elastic potential energy. Carbon dioxide adsorption will cause the shale to expand, and this may cause the macropores to shrink to meso- or micropores. The changes in SSA, TPV, and PSD after Sc-CO2 treatment are a result of the combined effects of these three mechanisms.
For the experiments conducted for this study, the Dubinin-Radushkevich (DR) and Dubinin-Astakhov (DA) models were used to determine the SSAs and pore volumes of the micropores measured by CO2 adsorption. The SSAs and TPVs measured by N2 adsorption were calculated using the Brunauer-Emmet-Teller (BET) and the Barrett-Joyner-Halenda (BJH) models (Table 2). The TPV of micropores less than 0.85 nm in diameter compared with the raw sample has no obvious relationship. This is because the initial volume of micropores of this size is low. The micropores abundances in samples from this shale are quite heterogeneous, and the TPV of the micropores is very sensitive to changes. When a small percentage of the clay in a sample is dissolved (leading to a micropores volume decrease) or adsorption-induced shale expansion leads to macro- and mesopores being compressed into micropores, the changes in micropores volume and structure can be very large. However, as mentioned above and as will be shown later in this Section, the proportion of TPV contributed by micropores is very small. For these reasons, in this paper, the focus is mainly on the SSA and TPV of pores in the 1.7–300 nm diameter range, pores for which the SSA and TPV data were obtained by the N2 adsorption method. These data can better reflect the overall changes in the pore structure of the sample studied.
Generally speaking, the SSA of the sample determines its adsorption ability. The initial N2 adsorption SSA of the raw samples was 7.786 m2/g, and the TPV was 0.007181 cm3/g. Table 2 shows that all the SSAs and TPVs of the Sc-CO2 treated samples (#2–#6) are lower than the untreated sample (#1). This suggests that Sc-CO2 treatment reduces the shale’s adsorption ability. In addition, at the higher Sc-CO2 treatment temperatures, the SSAs and TPVs after first rising from their low values after the 40 °C treatment trend to fall after the peak at 60 °C. As shown in Figure 6, sample #4, the sample treated at 60 °C, has a higher SSA and presumably a stronger adsorption ability than the samples treated with Sc-CO2 at higher temperatures. The dissolution of clay minerals verifies this at different temperatures.
Obviously, the SSA cannot be determined directly from the TPV because the SSA is also a function of the distribution of the different pore sizes. For example, although the TPV of sample #3 is larger than that of sample #5, the SSA of sample #3 is smaller (Figure 5). This demonstrates that it is necessary to further examine the pore volume changes and their relationship to pore size. For this study, pore sizes are subdivided into three different pore types according to the IUPAC classification: macropores, pores > 50 nm, mesopores, pores 2–50 nm, and micropores, pores < 2 nm. Total pore volumes and the pore volumes for the different pores types in the samples are shown in Figure 7.
In the raw sample, 17.87% of the pore volume are macropores, 76.88% are mesopores, and 5.25% are micropores. It is clear that owing to the high proportion of mesopore volume, changes in the mesopores will dominate differences in TPV after Sc-CO2 treatment. As the temperature of the experiments was increased from 40 °C to 80 °C, the changes in the meso- and micropore volume followed trends of first increasing (from 40 °C to 60 °C) and then decreasing (from 60 °C to 80 °C). The micropores account for the largest proportion of the total SSA, and the mesopores contribute the second largest area; the variation in both determine the SSA relationships, shown in Figure 6. It is very interesting that the micropores in sample #4 are a special case. After being treated with Sc-CO2 at 60 °C, the micropore volume in sample #4 exceeded that in the untreated sample (Figure 7 inset). This was most likely due to much greater CO2 adsorption-induced matrix expansion of the shale at 60 °C than at the other temperature.
Using the CO2 and N2 isothermal adsorption data, we analyzed the PSD data for both the untreated sample and the Sc-CO2 treated samples. The curves for those data are shown in Figure 8. As shown in Figure 8a, the shale’s micropores are mainly around 0.72 nm to 0.82 nm in diameter. Pores in this range of diameters contribute most of the volume for micropores less than 1 nm in diameter. The micropores PSD below 0.72 nm is complex, and this is probably due in part to the considerable heterogeneity of that shale and in part to the statistically small volume occupied by these micropores. Figure 8b shows that the PSD curves obtained from the N2 adsorption data present continuous distributions for pore sizes between 1.7 nm and 300 nm. The peak value for Sc-CO2 treated samples is not appreciably different from the peak for the untreated sample, and this means that the average shale pore size does not change very much after the shale is treated with Sc-CO2.

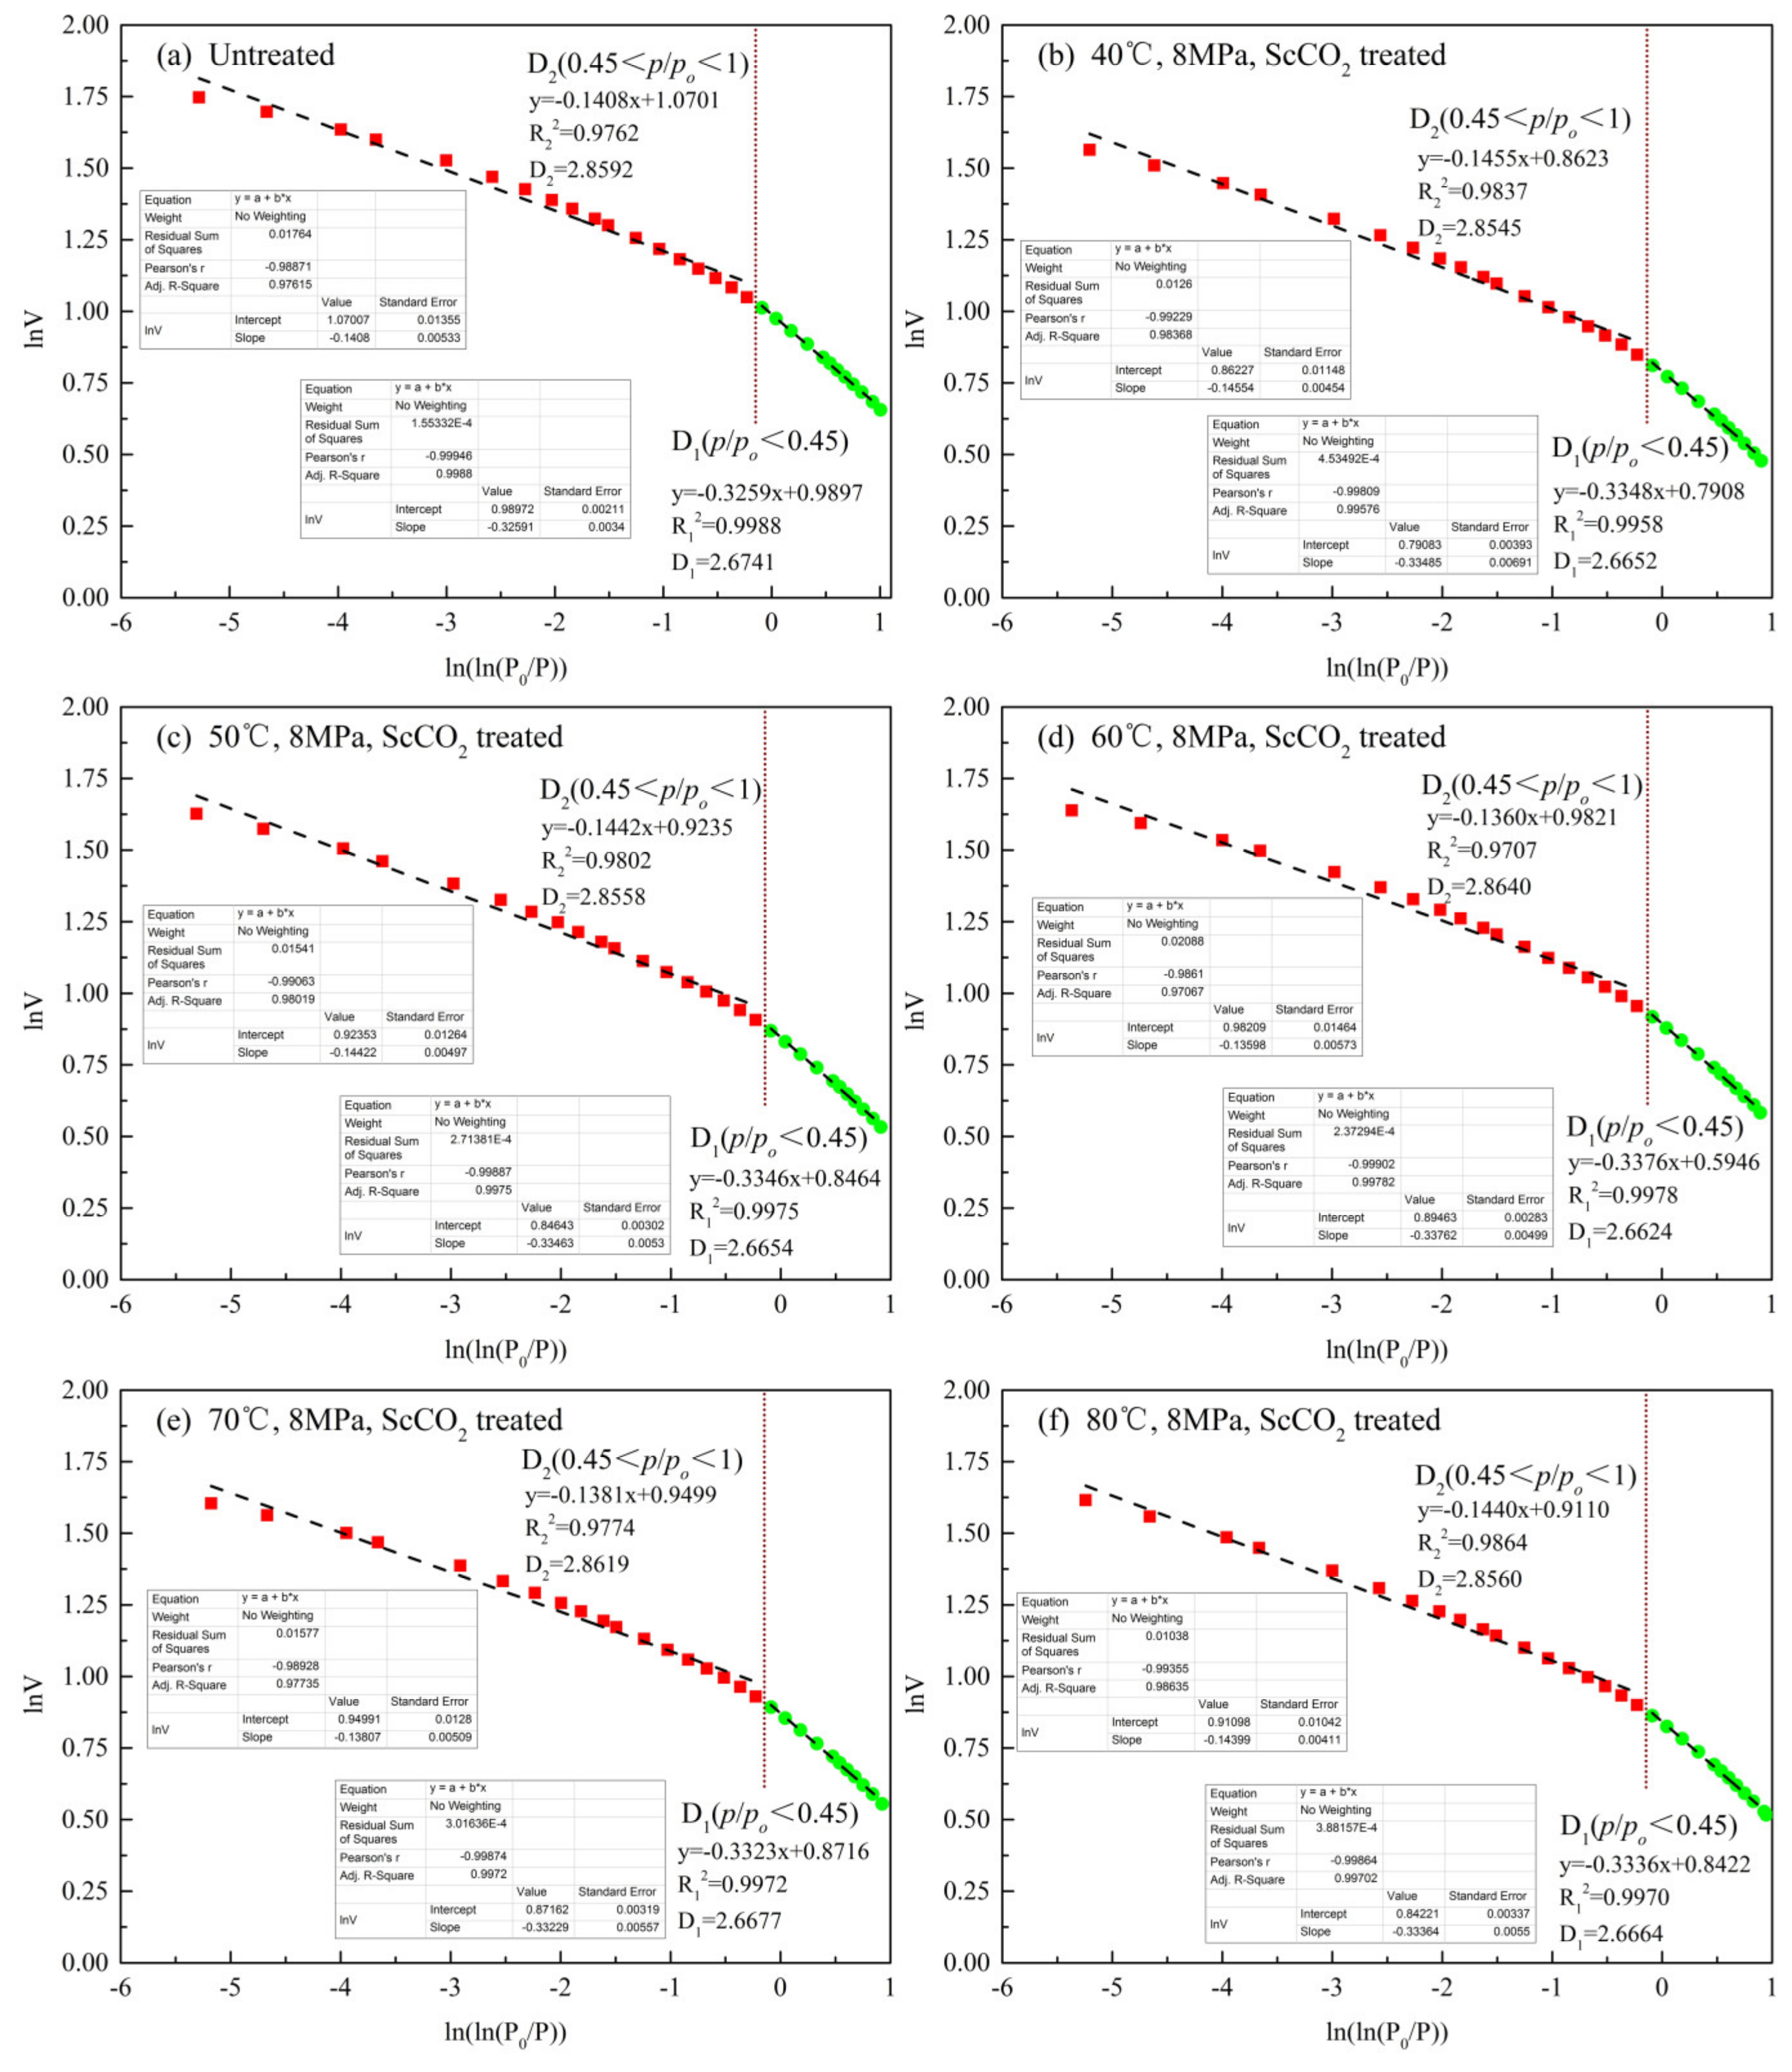
3.2.3. Pore Fractal Dimension

The fractal theory has been used to describe the surface roughness and structural complexity of pores in porous shale by many researchers [42,43,44]; shale’s fractal dimension is generally two to three [45]. A fractal dimension closer to two indicates a smoother pore surface and a simpler structure, a dimension closer to three implies a rougher pore surface and a more complicated structure. Because the CO2 adsorption curves only pertain to pores smaller than 1 nm, the N2 adsorption isotherms are used to characterize the fractal dimension of pore surfaces and the structure of the shale in this paper. The Frenkel-Halsey-Hill (FHH) model was used to assign a fractal dimension to the N2 adsorption data; the FHH equation is shown as Equation (7) [46,47,48]:
ln V = D   3 ln ln p 0 p +   C
where V is the amount of N2 adsorbed at equilibrium vapor pressure (cm3), po is the saturated vapor pressure of the gas (MPa), p is the equilibrium pressure (MPa), C is a fitting constant, and D is the fractal dimension, which can be obtained by calculating the slope of the fitted curve.
If the shale pores are fractal, Equation (7) says that lnV and ln[ln(po/p)] should be linearly correlated and the slope k of a line fit to the data can be obtained. This means the fractal dimension D of the shale pore’s structure can be calculated. As can be seen in Figure 5, all the N2 absorption and desorption hysteresis loops occur at the relative pressure, p/po, of 0.45. The N2 is mainly adsorbed on the shale surface when the relative pressure is low (0–0.45), and it is mainly adsorbed on the inner of the pores when the relative pressure is high (0.45–1.0). Therefore, the fractal dimension D1 (obtained from the data for relative pressures between 0 and 0.45) is used to describe the shale’s surface complexity, and the fractal dimension D2 (from relative pressures between 0.45 and 1.0) is used to describe the pore structure. By fitting the data for all of the samples, fractal characteristics were obtained—this is shown in Figure 9 and Table 3.
As can be seen from Table 3, the surface fractal dimension D1 of all the Sc-CO2 treated samples decreased relative to the untreated sample. This indicates that Sc-CO2 can make the surface of the shale smoother by extracting some material or through dissolution. The Sc-CO2 treatment temperature has little effect on the surface smoothness. Compared with D1, the fractal dimension D2 of the pore structure changes more noticeably. At the low temperatures of 40 °C and 50 °C, D2 is a little lower relative to the D2 of the untreated sample. However, at 60 °C, and 70 °C, the D2′s of the treated samples exceeds that of the initial fractal dimension indicating that the treated sample’s pore structure is more complex. The D2 for the treated samples decreases again at 80 °C. Combining these conclusions about surface smoothness and pore structure complexity with the information presented in Figure 6 and Figure 7 suggests that in the low temperature range (40–50 °C) and at 80 °C, Sc-CO2 acid dissolution of pore-rich clay has a greater effect on the shale’s SSA and the TPV than adsorption-induced expansion does. When the clay minerals are dissolved and transformed to quartz or pores close to each other are connected during Sc-CO2 treatment, the total number and(or) volume of meso- and micropores decreases or they are connected to form macropores. This is why D2 for these pores is lower than the D2 of the untreated sample. When the Sc-CO2 treatment temperature is around 60 °C, the adsorption-induced expansion effect is stronger, and this makes the micropores volume of sample #4 greater than that of the untreated sample and makes its pore structure the most complicated.
It is possible that the fractal dimension of the shale’s surface and of its pore structure may be correlated with the shale’s TOC, clay content, and SSA. Figure 10 plots fractal dimensions D1 and D2 against the SSAs and the average pore diameters of samples #1–#6. It can be seen that the fractal dimension of the shale’s surface is linearly and positively correlated with SSA and that the pore structure is negatively correlated with the average pore diameter. The larger the SSA, the greater the fractal dimension D1. This means the shale’s surface is rougher when the SSA is larger. In addition, the larger the average pore diameter, the smaller the fractal dimension D2 or, in physical terms, a larger average pore diameter means a simpler pore structure. Turning to the consequences of Sc-CO2 treatment, the above conclusions imply that the Sc-CO2-induced changes in the shale’s SSA and average pore diameter will greatly affect the flow of gas in the shale.

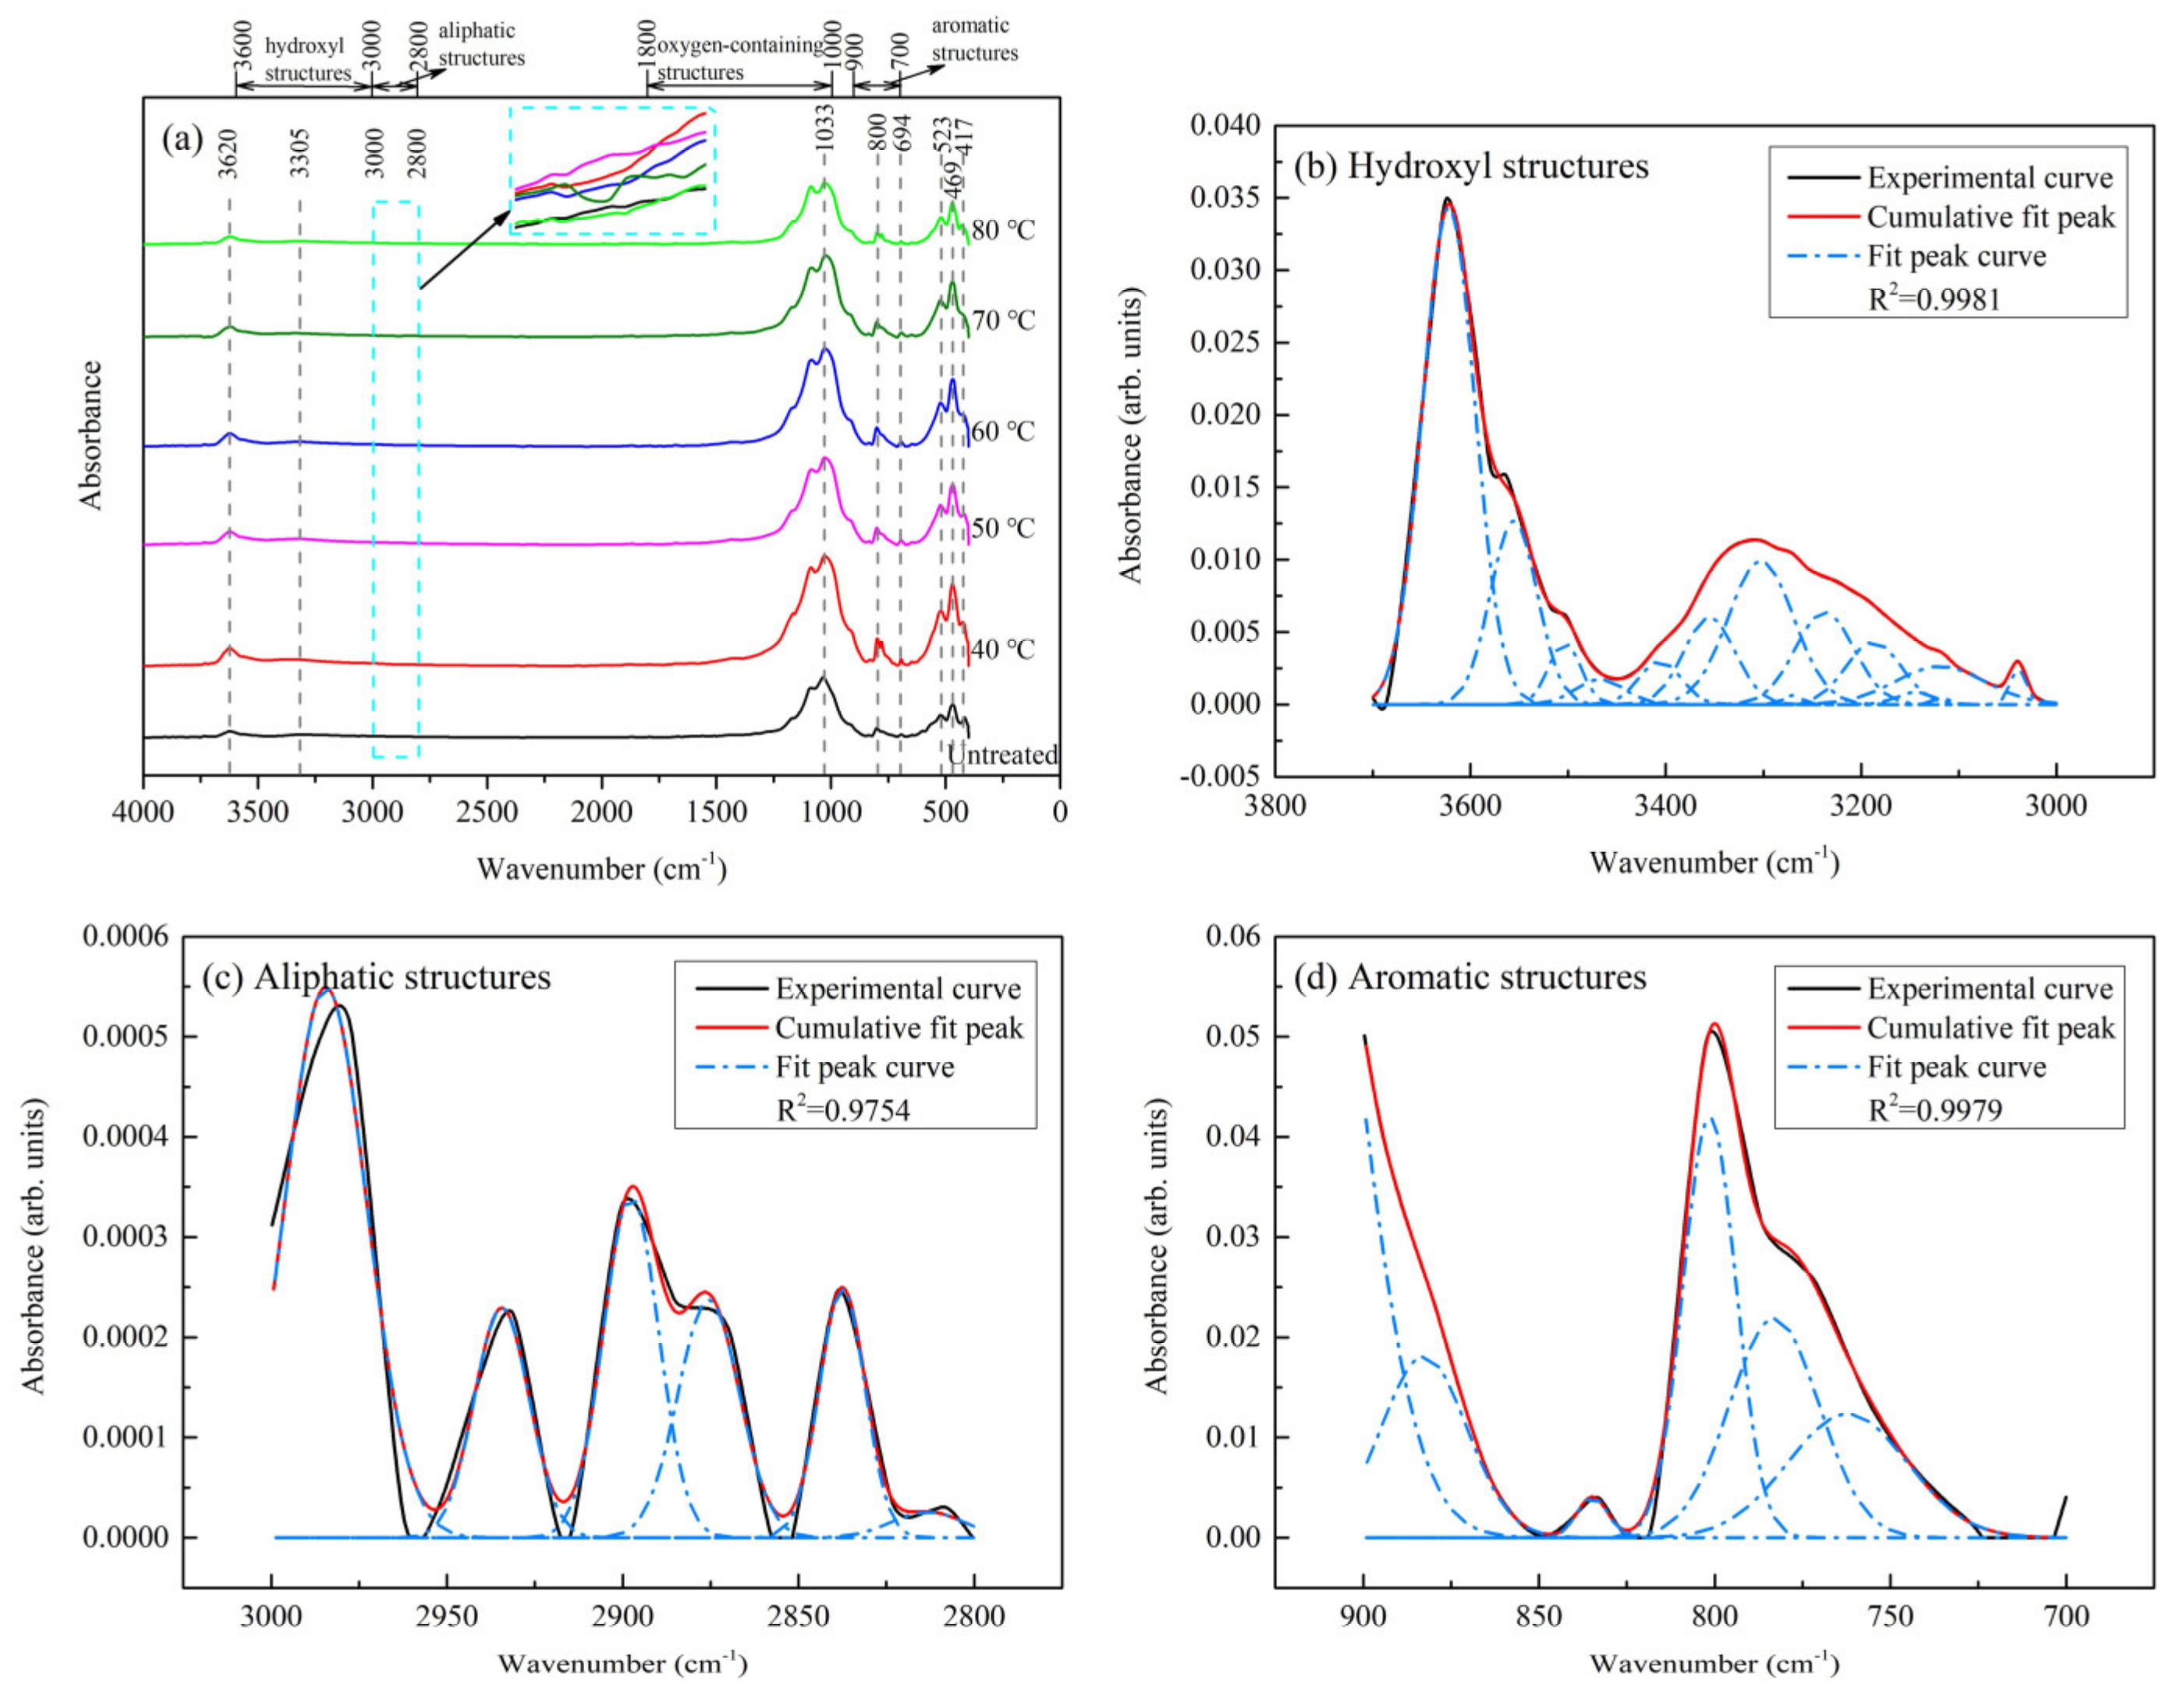
3.3. Inorganic and Organic Functional Group Analysis

3.3.1. Sc-CO2 Effects on the Minerals

As mentioned previously, FTIR was used to examine the functional groups. Fourier transform infrared spectra for the untreated and Sc-CO2 treated shale samples are shown in Figure 11a. Most of the absorption peaks for minerals are in the 400–1300 cm−1 range. There are peaks for a number of different mineral species; the absorption peaks for the silicate minerals are the highest. The 1021–1613 cm−1 peak is the stretching vibration peak for the Si-O bond, a strong absorption peak formed by the overlapping bands from quartz and illite [8,32]. This Si-O peak is the most intense peak and indicates that the shale contains a large amount of quartz and clay minerals, a conclusion consistent with the XRD results in Table 1. The absorption peaks at 1429 cm−1 and 876 cm−1 are the peaks for calcite. The peak shapes related to minerals in the FTIR spectra for the untreated and the Sc-CO2 treated samples are similar, and no new peaks were formed in or disappeared from the spectra for the treated samples. However, the positions and(or) intensities of the characteristic peaks changed somewhat—indicating that minerals present were the same, but their abundances in the treated samples differed.
Treating the shale with Sc-CO2 enhanced the intensity of the FTIR absorption peaks. Qualitatively, the intensity of the infrared spectrum absorption peaks reflects the concentrations of the functional groups. The peaks at low wavenumbers are made up of overlapping mineral and organic functional groups peaks. The Sc-CO2 extracts small molecular hydrocarbons from the shale and the decrease in the intensity of the FTIR peaks from the organic functional groups results in a relative increase in the intensity of the peaks related to the minerals.

3.3.2. Sc-CO2 Effects on Organic Structures and Hydrocarbons

The shale’s FTIR spectrum consists of multiple overlapping functional group peaks. To better analyze the changes in each functional group, Peakfit v. 4.12 software (SeaSolve Software, San Jose, CA, USA) was used to perform semi-quantitative analysis on the spectrum by curve fitting. The spectrum was divided into three regions: hydroxyl structures (3000–3600 cm−1), aliphatic hydrocarbons (2800–3000 cm−1), and aromatic hydrocarbons (700–900 cm−1). The spectrum was fitted using a Gaussian function, and the peaks were assigned according to references [49,50,51].
(a)
Changes in hydroxyl structures
Hydroxyl groups are the main hydrogen-bonded functional groups in the shale. The hydroxyl groups can be divided into six categories: OH–N, ring hydroxyls, OH–O, OH–OH, OH–π, and free OH. In this paper, only the peak fitting curves and the fitting parameters for groups in the untreated shale sample are presented. The curves fit the FTIR hydroxyl spectrum from the untreated shale sample are shown in Figure 11b. The hydroxyl functional group peak-fitting parameters are listed in Table 4, and the synthesis results for the hydroxyl structures in the untreated and Sc-CO2 treated shale samples are listed in Table 5.
Free OH and OH–O are the two most abundant hydroxyl group types in the original shale samples (38.69% and 20.95%, respectively) (Table 5) and the OH–N and OH–OH hydroxyl groups are the least abundant (6.77% and 4.57%, respectively). Ring hydroxyls and OH–π are present in intermediate amounts. After Sc-CO2 treatment, the OH–N and ring hydroxyl contents both decreased, whereas the OH–OH and OH–π contents increased relative to the raw sample. This is because when Sc-CO2 was introduced, it was dissolved in the free water in the shale to produce a weakly acidic liquid that provided a large amount of H+ to the system. Some of the pre-existing hydrogen bonds were destroyed by the H+ and the OH–N and ring hydroxyls, held together by the most easily broken hydrogen bonds, were then converted to OH–OH and OH–π. In addition, the Sc-CO2 treatment allowed water to be released from clay minerals [52], and this provided free OH and OH–OH. When the temperature was below 60 °C, the free OH content decreased compared with the raw sample. This happened because, at low temperatures, injected CO2 will preferentially react with the free water in the shale. Free OH is mainly derived from free water, resulting in a decrease of free OH at low temperatures. In general, the destruction of hydroxyl–hydrogen bonds by Sc-CO2 in shale is really the destruction of OH–N and ring hydroxyls.
Compared with the raw sample, the OH–N and ring hydroxyl contents decreased with increasing temperature (40–60 °C) and then increased when the temperature was increased to more than 60 °C (Figure 12). In the 40–60 °C temperature range, the increase in temperature reduced the CO2–water reaction activation energy, intensified the movement of CO2 molecules, and increased the probability of contact between CO2 molecules and shale. These chemical reactions proceeded in a positive direction (Equation (3)) to accelerate the formation of H+ and the destroy hydrogen bonds. Because acid dissolution is an exothermic reaction, the higher temperatures (>60 °C) inhibited the reaction from proceeding, and thus, reduced both H+ generation and the destruction of hydrogen bonds. Jia [53] simulated the effect of temperature on the water–CO2–rock system during CO2 geological storage. He concluded that calcite is mainly dissolved under low temperature conditions and precipitated under high temperature conditions. We think this is related to the direction in which the chemical reaction represented by Equation (3) proceeded. The XRD results for sample #6 (Table 1) reported 0.6% calcite in the sample—this is relatively consistent with Jia’s conclusions.
(b)
Changes in aliphatic hydrocarbons
Figure 11a shows that the aliphatic hydrocarbon content of the shale is low (2800–3000 cm−1). The curves fit the FTIR spectrum for the aliphatic hydrocarbons in untreated shale are shown in Figure 11c. The peak-fitting parameters for the aliphatic functional groups are listed in Table 6, and the synthesis results for the aliphatic hydrocarbons in the untreated and Sc-CO2 treated shale samples are listed in Table 7.
As can be seen from Table 7, the content of the aliphatic hydrocarbon groups in the shale samples treated with Sc-CO2 did not show a clear change trend. The aliphatic hydrocarbon chain length (L = A2925/A2950) showed irregular changes. Zhang et al. found that aliphatic hydrocarbons in coal are more easily extracted by Sc-CO2 than aromatic hydrocarbons [54]. Because of the low content of aliphatic hydrocarbons in the shale, the aliphatic hydrocarbons peaks in the FTIR spectrum were, at best, subtle and the peak fitting results obtained were not very good. It can be seen from the enlarged portion of the graph in the box in Figure 11a that the traces of the spectra for the different temperatures in the 2800–3000 cm−1 interval changed irregularly. It has been shown that when Sc-CO2 is used to extract aliphatic hydrocarbons, the aliphatic hydrocarbon content not only falls off, but different addition reactions may also take place.
(c)
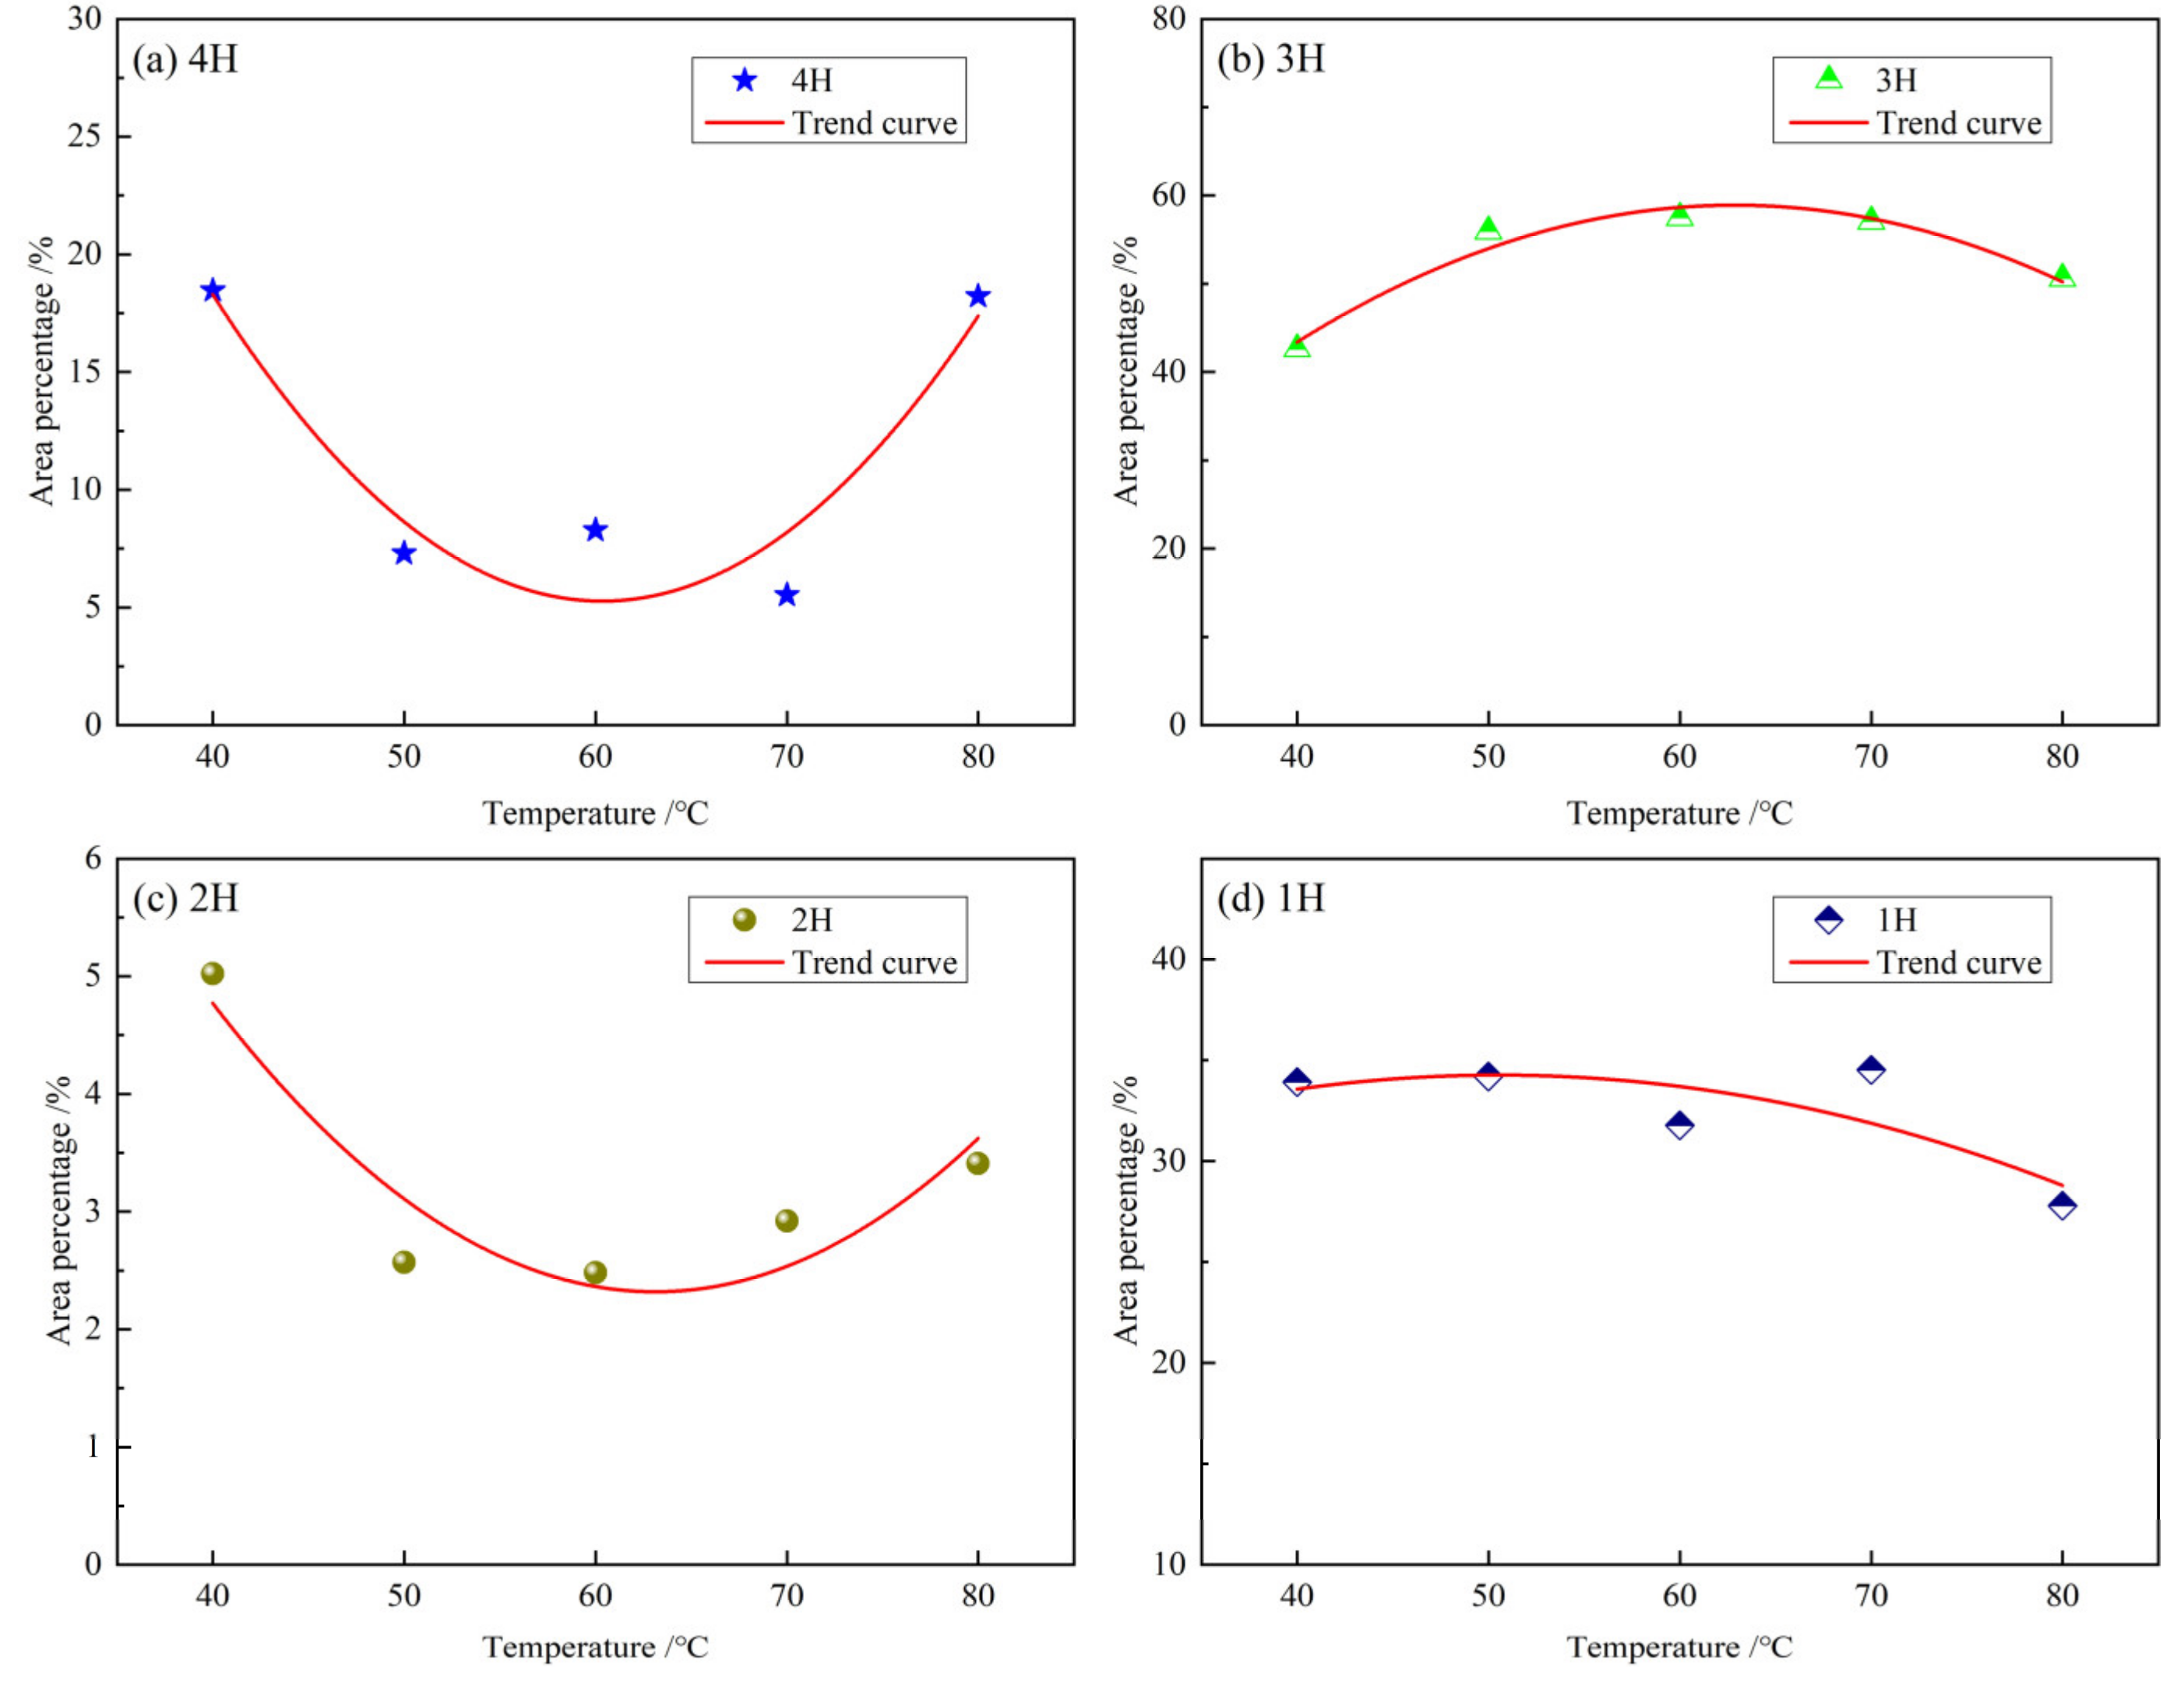
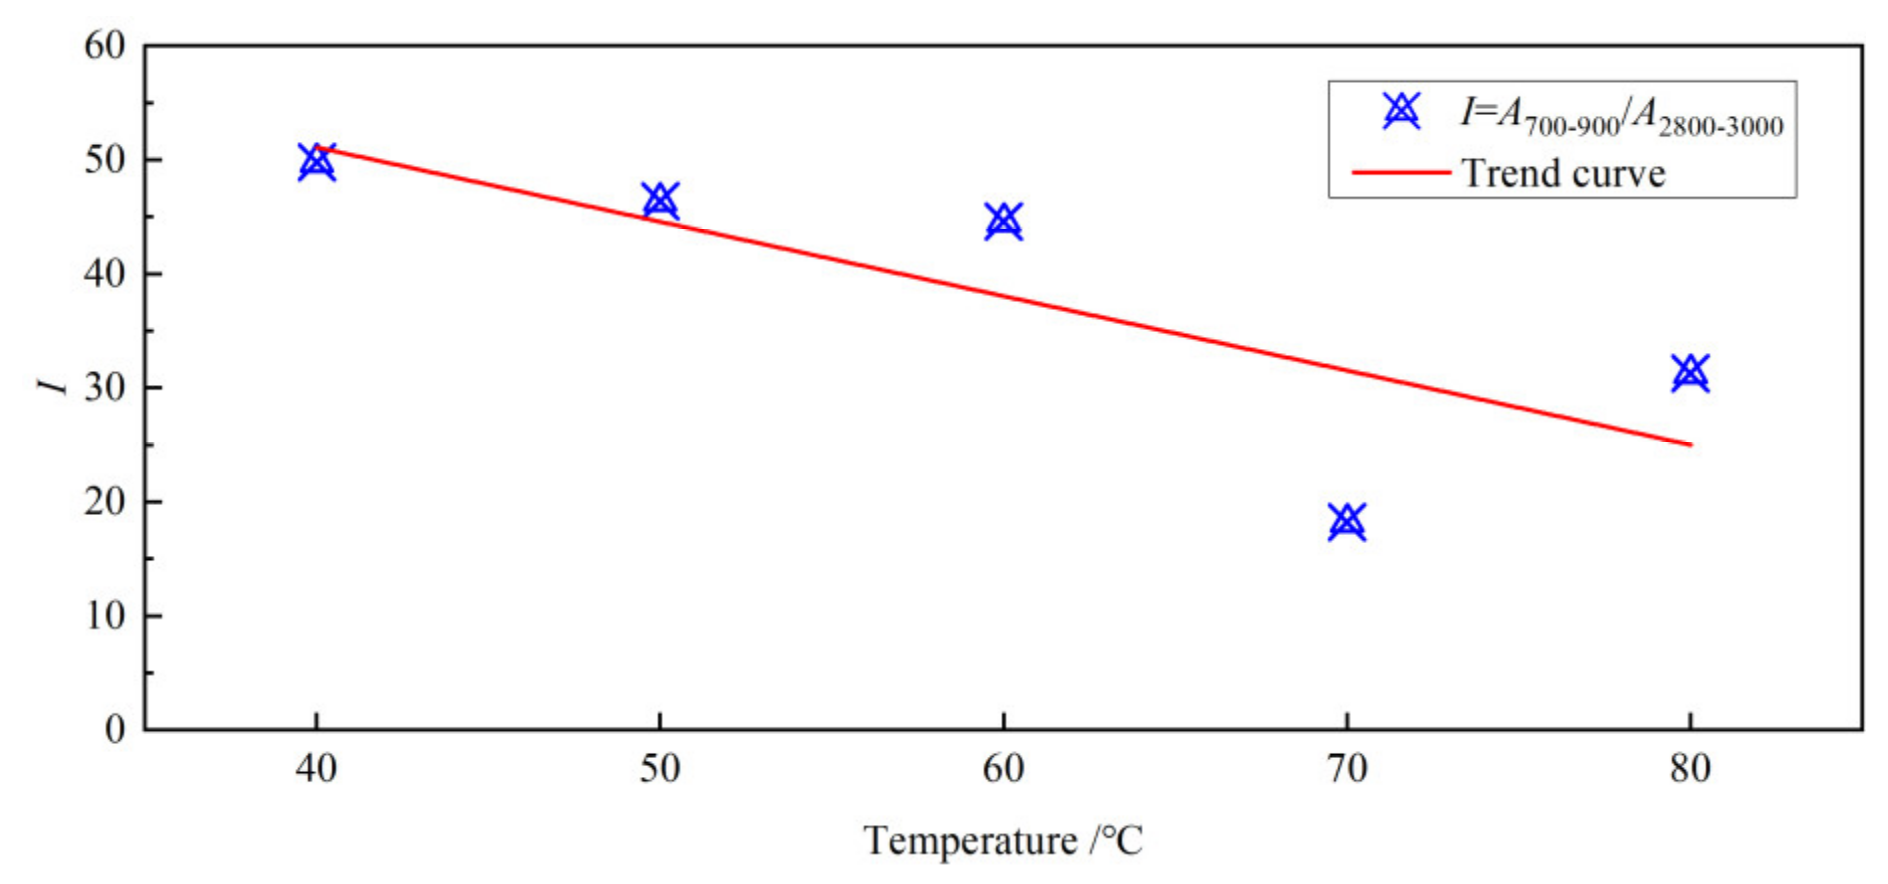
Changes in aromatic hydrocarbons
The curves fit the FTIR spectrum for the aromatic hydrocarbons in untreated shale are shown in Figure 11d. The peak-fitting parameters for the aromatic functional groups are listed in Table 8, and the synthesis results for the aromatic hydrocarbons in the untreated and the Sc-CO2 treated shale samples are listed in Table 9.
The structure of the hydrocarbons in this shale sample is dominated by 3H and 1H followed by 4H, with the 2H having the lowest abundances. As shown in Figure 13, compared with the raw sample, the abundance of 4H after Sc-CO2 treatment first decreased, but then increased as the SC-CO2 treatment temperature increased. The abundance of 2H increased significantly with the most significant increase taking place at 40 °C (an increase of 241.5%). The 2H content also showed a U-shaped relationship with increasing temperature. Except for the point at 40 °C, the 3H content increased, and the 3H abundance showed a good inverse U-shaped relationship with temperature; the 3H abundance increased the most at 60 °C (an increase of 18.75%). Except for the point at 70 °C, the content of 1H all increased, but the increase was not large (an increase of 0.41–9.1%). This can be considered to be no change. In general, most of the changes in the aromatic hydrocarbons in samples treated with Sc-CO2 were concentrated in the 3H and 2H hydrocarbons, and the abundances of these hydrocarbons increased significantly. The 4H hydrocarbons showed a decreasing trend, and the 1H hydrocarbons remained almost unchanged relative to the raw sample. The aromatic hydrocarbons were extracted to a lesser degree than that of aliphatic hydrocarbons, and this is why the change in aromatic hydrocarbons is more regular than that of the aliphatic hydrocarbons.
A parameter, I (I = A700–900/A2800–3000), was used to characterize the aromaticity of the shale. This parameter can be used to compare the relative abundances of the aromatic and aliphatic hydrocarbons [55]. After Sc-CO2 exposure, the value of parameter I showed a trend of linear decline (Figure 14). The parameter value declined because although aliphatic hydrocarbons are more easily extracted from shale than aromatic hydrocarbons, the aliphatic hydrocarbon content of the shale samples tested is significantly less than the aromatic hydrocarbon content. When the Sc-CO2 extracted hydrocarbons from these samples, the amount of aromatic hydrocarbon extracted was greater than the amount of aliphatic hydrocarbon extracted. This resulted in the I value decreasing. Previous studies have shown that as the pressure and temperature increase, the amount of Sc-CO2 that dissolves in water in the formation increases, therefore the degree of hydrocarbon extraction also increases [56].
Studies have shown that the content of oxygen-containing functional groups and hydroxyl groups in shale are related to the amount of CO2 the shale can adsorb [56,57]. The more oxygen-containing functional groups and hydroxyl groups the shale contains, the more CO2 it can adsorb. In the future, we plan to study the effect of supercritical carbon dioxide–shale interactions on the shale’s adsorption capacity.

4. Conclusions

In this study, samples of high-clay shale from the Silurian Longmaxi Formation, China, are used to study the effects of supercritical carbon dioxide (Sc-CO2) treatment temperatures on the shale’s mineral composition, pore structure, and organic functional groups. The main conclusions are drawn:
  • The Sc-CO2-induced changes to the minerals in the shale mainly occur in the clay minerals. When the temperature is increased in the 40–80 °C range, the dissolution of clay minerals caused by the Sc-CO2 first decreases, but then increases. The dissolution is the weakest at 60 °C, and the proportion of clay minerals in the 60 °C sample was the highest of any of the samples tested.
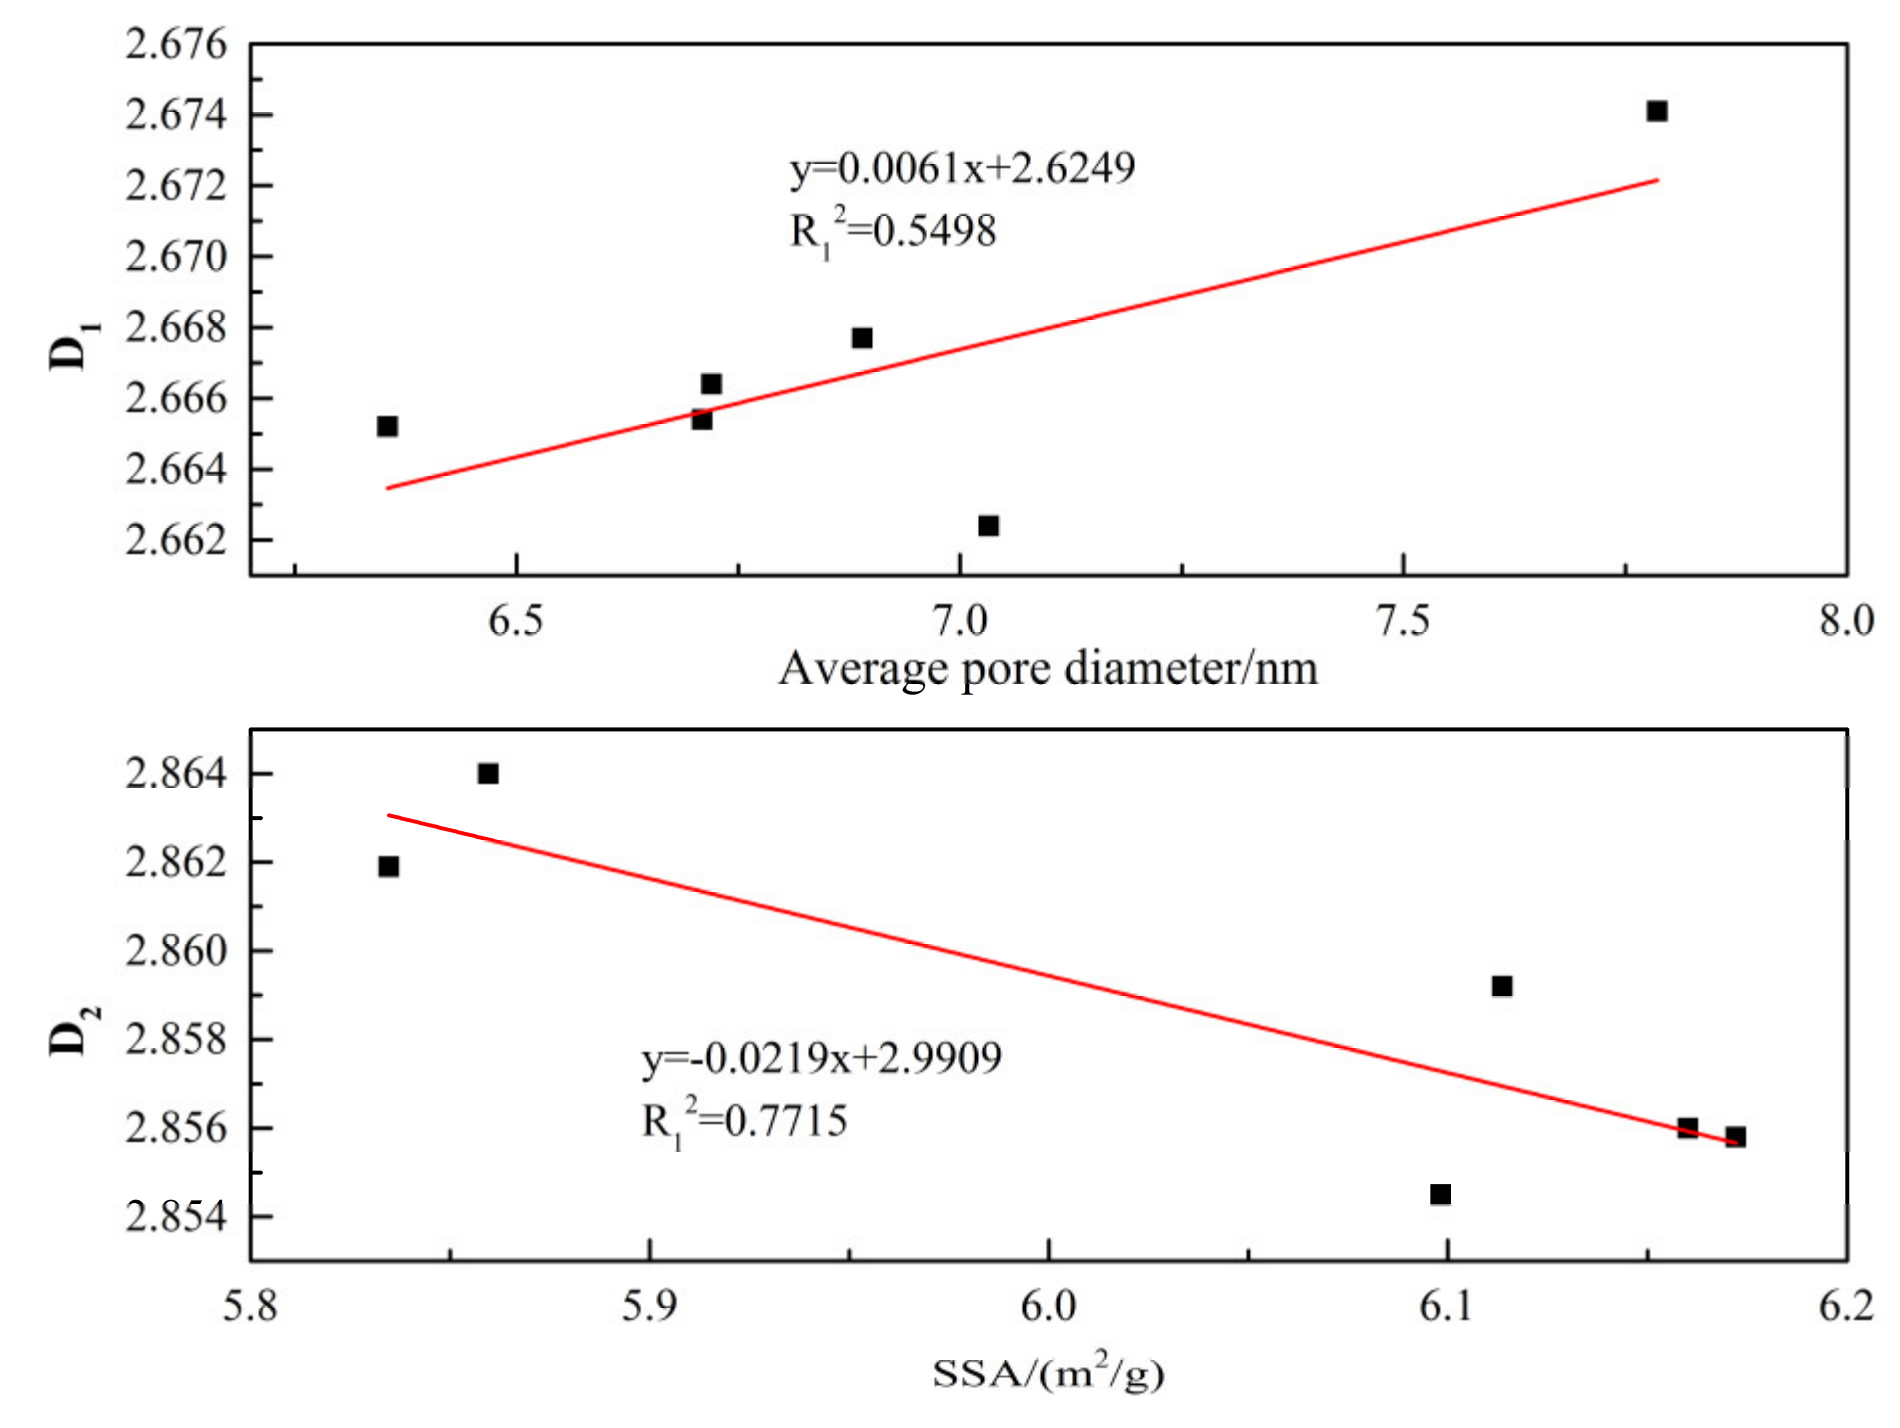
  • The interactions between the Sc-CO2 and the shale did not change the pore shapes or the shale’s PSD but reduced the shale’s SSA and TPV. With Sc-CO2 temperature increasing, the SSA, TPV, predominant pore type (mesopores), and fractal dimension of the pore structure tend to first increase and then decrease, reaching the peak at 60 °C. This is consistent with the changes in clay content. In addition, the shale’s surface fractal dimension shows a good positive linear relationship with SSA, but the pore structure fractal dimension shows a negative linear relationship with the average pore diameter.
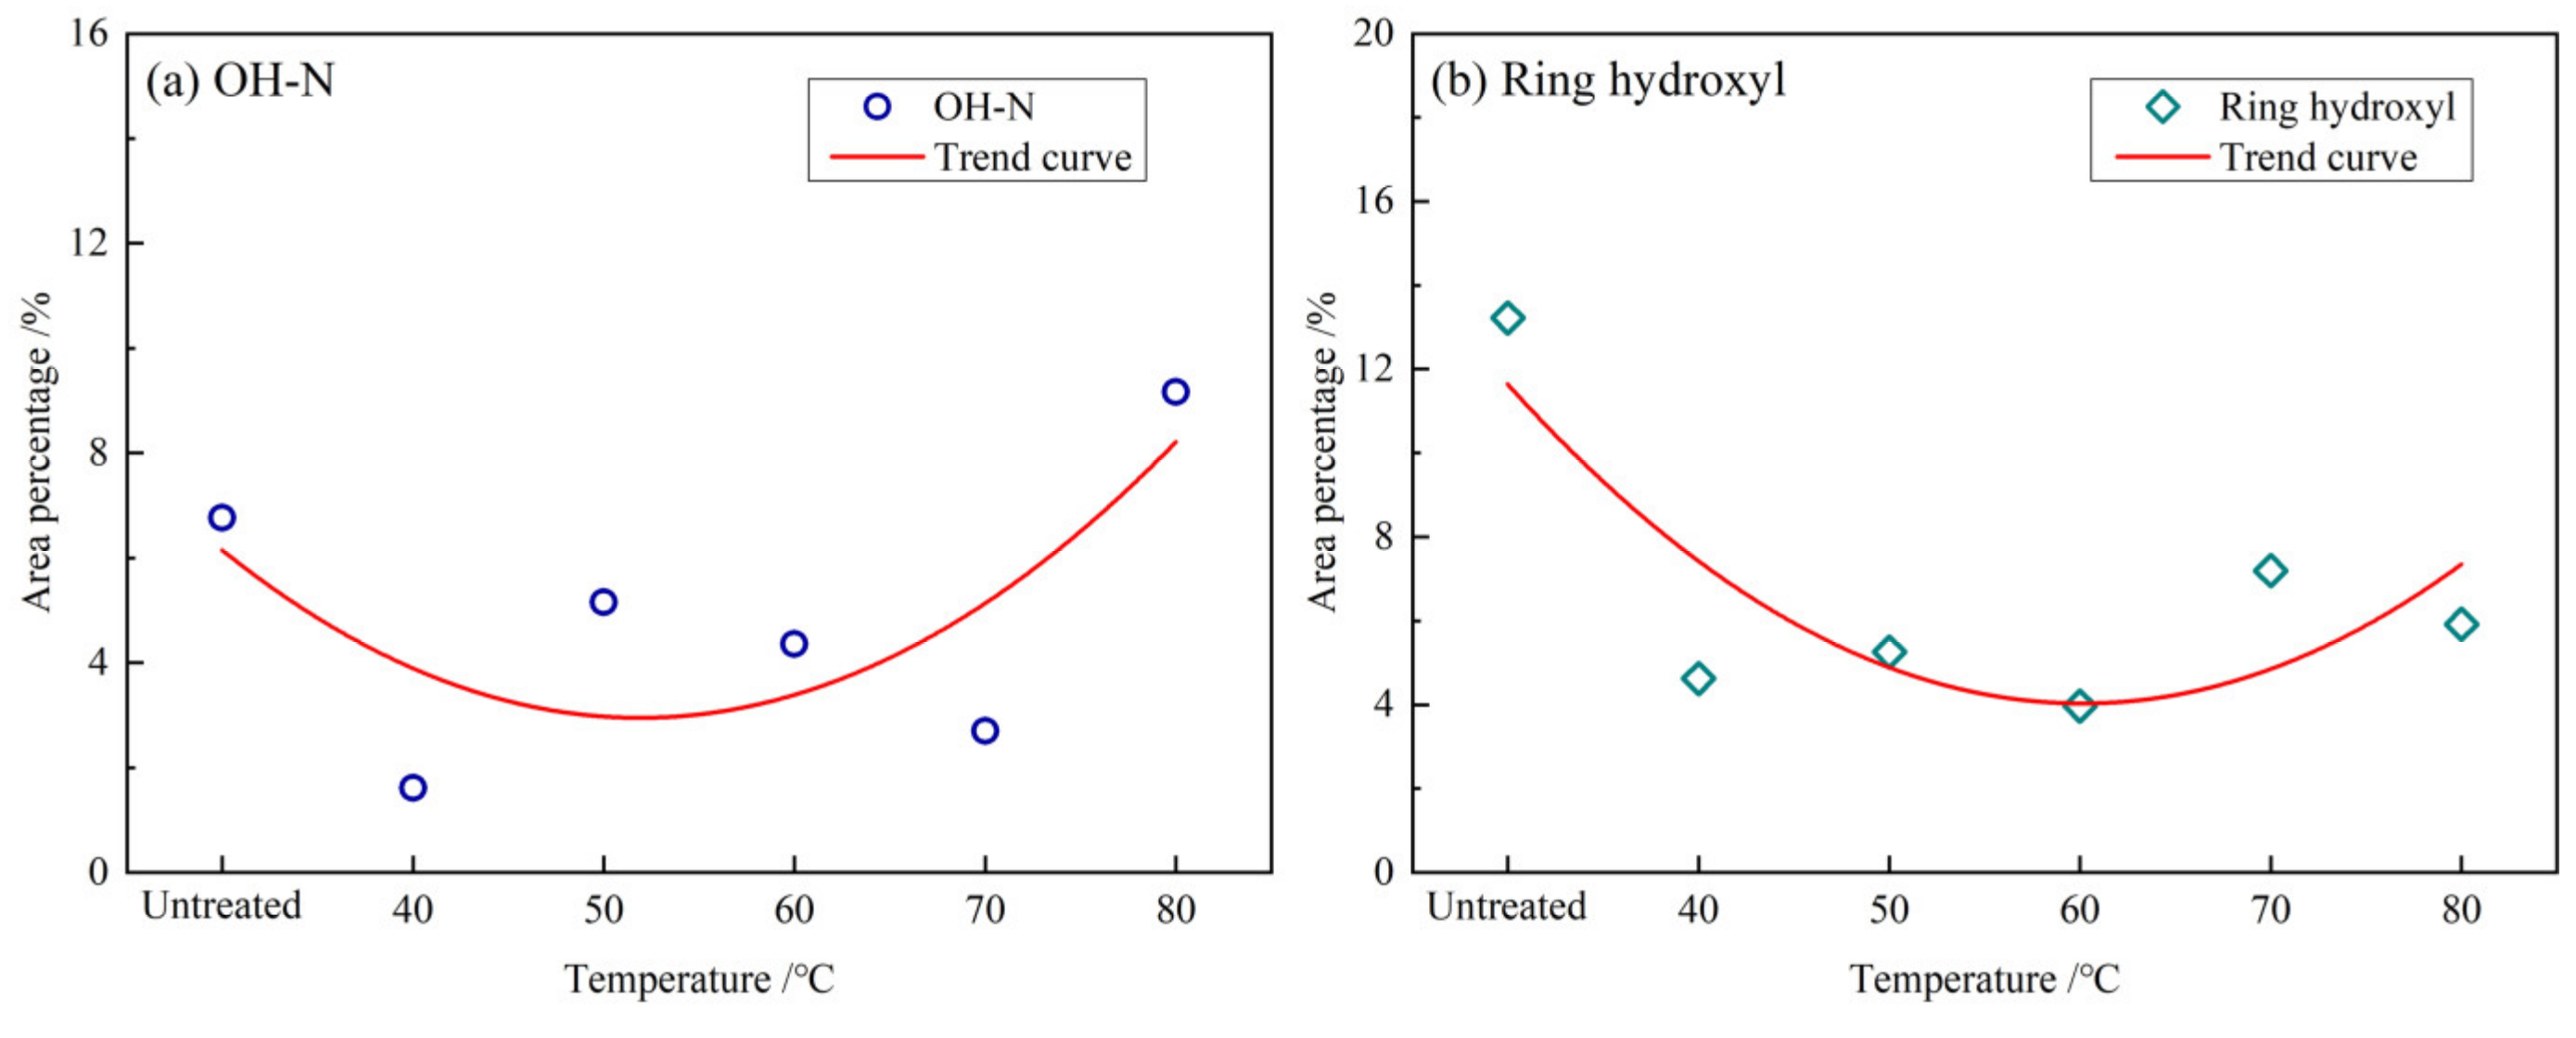
  • The destruction of hydroxyl structures by Sc-CO2 is mainly related to the destruction of OH–N and ring hydroxyls, which first increases and then decreases. This is because the formation of H+ is inhibited at higher temperatures. As Sc-CO2 temperature increased, the content of 4H and 2H show a U-shaped, while the 3H shows an inverted U-shaped. The content of 1H remains essentially unchanged. The value of the parameter for aromaticity (parameter I) shows a linear decline as the temperature increases.
According to the discussion above, we can find that the Sc-CO2 temperature is an important factor in addition to pressure that cannot be ignored. For the future application of the injection of CO2 into shale formation, temperature should be taken into consideration, especially its influence on the dissolution of clay minerals and extraction of organic matter. From the perspective of CO2 stimulation, the temperature of shale formation at about 60 °C may be more conducive to enhanced shale gas recovery, while a higher depth and temperature may have better security for carbon capture/storage.

Author Contributions

Y.C., M.Z. and Z.L. conceived and designed the experiments; Y.C. and M.Z. performed the experiments; M.Z. and X.D. analyzed the data; Z.L., H.Y. and L.Y. contributed materials and analysis tools; Y.C. and M.Z. wrote the paper.All authors have read and agreed to the published version of the manuscript.

Funding

This study was supported by the National Natural Science Foundation of China (No. 51904049); the Natural Science Foundation of Chongqing (General Program, No. cstc2019jcyj-msxmX0702); Chongqing Science and Technology Innovation Talent Support Program (No. CSTCCXLJRC201712); and Scientific Platform Project, Ministry of Education (fykf201908).

Conflicts of Interest

The authors declare no conflict of interest.

References

  1. Prašnikar, A.; Pavlišič, A.; Ruiz-Zepeda, F.; Kovač, J.; Likozar, B. Mechanisms of Copper-Based Catalyst Deactivation during CO2 Reduction to Methanol. Ind. Eng. Chem. Res. 2019, 58, 13021–13029. [Google Scholar] [CrossRef] [Green Version]
  2. Dasireddy, V.D.B.C.; Likozar, B. The role of copper oxidation state in Cu/ZnO/Al2O3 catalysts in CO2 hydrogenation and methanol productivity. Renew. Energy 2019, 140, 452–460. [Google Scholar] [CrossRef]
  3. Pori, M.; Likozar, B.; Marinšek, M.; Crnjak Orel, Z. Preparation of Cu/ZnO-based heterogeneous catalysts by photochemical deposition, their characterisation and application for methanol synthesis from carbon dioxide and hydrogen. Fuel Process. Technol. 2016, 146, 39–47. [Google Scholar] [CrossRef]
  4. Jonathan, R.M.; Peter, E.; Thomas, A.D.; Jon, E.O. Effect of CO2-brine-rock interaction on fracture mechanical properties of CO2 reservoirs and seals. Earth Planet. Sci. Lett. 2018, 499, 37–47. [Google Scholar]
  5. Hu, X.F.; Deng, H.C.; Lu, C.; Tian, Y.Y.; Jin, Z.H. Characterization of CO2/CH4 Competitive Adsorption in Various Clay Minerals in Relation to Shale Gas Recovery from Molecular Simulation. Energy Fuels 2019, 33, 8202–8214. [Google Scholar] [CrossRef]
  6. Zhang, C.; Zhou, S.X.; Li, J.; Chen, K.F.; Li, P.P.; Sun, Z.X. Effect of CO2 injection on adsorption of methane on shale from the Sichuan Basin in China. IOP Conf. Ser. Earth Environ. Sci. 2019, 360, 012050. [Google Scholar] [CrossRef] [Green Version]
  7. Yang, H.; Zhao, Y.; Zhang, X.; Liu, G.; Du, X.; Shang, D.; Yu, Y.; Chen, J.; Wang, H.; Tu, H. Supercritical CO2 fracturing with different drilling depths in shale. Energy Sources Part A Recover. Util. Environ. Eff. 2019, 1–20. [Google Scholar] [CrossRef]
  8. Zhou, J.P.; Xie, S.; Jiang, Y.D.; Xian, X.F.; Liu, Q.L.; Lu, Z.H.; Lyu, Q. Influence of Supercritical CO2 Exposure on CH4 and CO2 Adsorption Behaviors of Shale: Implications for CO2 Sequestration. Energy Fuels 2018, 32, 6073–6089. [Google Scholar] [CrossRef]
  9. Bi, H.; Jiang, Z.X.; Li, J.Z.; Li, P.; Chen, L.; Pan, Q.H.; Wu, Y.X. The Ono-Kondo model and an experimental study on supercritical adsorption of shale gas: A case study on Longmaxi shale in southeastern Chongqing, China. J. Nat. Gas Sci. Eng. 2016, 35, 114–121. [Google Scholar] [CrossRef]
  10. Ougier-Simonin, A.; Renard, F.; Boehm, C.; Vidal-Gilbert, S. Microfracturing and microporosity in shales. Earth Sci. Rev. 2016, 162, 198–226. [Google Scholar] [CrossRef] [Green Version]
  11. Davila, G.; Cama, J.; Luquot, L.; Soler, J.M.; Ayora, C. Experimental and modeling study of the interaction between a crushed marl caprock and CO2-rich solutions under different pressure and temperature conditions. Chem. Geol. 2017, 448, 26–42. [Google Scholar] [CrossRef]
  12. Skurtveit, E.; Aker, E.; Soldal, M.; Angeli, M.; Wang, Z. Experimental investigation of CO2 breakthrough and flow mechanisms in shale. Pet. Geosci. 2012, 18, 3–15. [Google Scholar] [CrossRef]
  13. Liu, J.; Xie, L.; Elsworth, D.; Gan, Q. CO2/CH4 Competitive Adsorption in Shale: Implications for Enhancement in Gas Production and Reduction in Carbon Emissions. Environ. Sci. Technol. 2019, 53, 9328–9336. [Google Scholar] [CrossRef] [PubMed]
  14. Wu, W.; Zoback, M.D.; Kohli, A.H. The impacts of effective stress and CO2 sorption on the matrix permeability of shale reservoir rocks. Fuel 2017, 203, 179–186. [Google Scholar] [CrossRef]
  15. Jiang, Y.D.; Qin, C.; Kang, Z.P.; Zhou, J.P.; Li, Y.; Liu, H.; Song, X. Experimental study of supercritical CO2 fracturing on initiation pressure and fracture propagation in shale under different triaxial stress conditions. J. Nat. Gas Sci. Eng. 2018, 55, 382–394. [Google Scholar] [CrossRef]
  16. Zhang, X.W.; Lu, Y.Y.; Tang, J.R.; Zhou, Z.; Liao, Y. Experimental study on fracture initiation and propagation in shale using supercritical carbon dioxide fracturing. Fuel 2017, 190, 370–378. [Google Scholar] [CrossRef]
  17. Alemu, B.L.; Aagaard, P.; Munz, I.A.; Skurtveit, E. Caprock interaction with CO2: A laboratory study of reactivity of shale with supercritical CO2 and brine. Appl. Geochem. 2011, 26, 1975–1989. [Google Scholar] [CrossRef]
  18. Liu, Q.Y.; Tao, L.; Zhu, H.Y.; Lei, Z.D.; Jiang, S.; McLennan, J.D. Macroscale Mechanical and Microscale Structural Changes in Chinese Wufeng Shale with Supercritical Carbon Dioxide Fracturing. SPE J. 2018, 23, 691–703. [Google Scholar] [CrossRef]
  19. Liu, H.; Wang, F.; Zhang, J.; Meng, S.W.; Duan, Y.W. Fracturing with carbon dioxide: Application status and development trend. Pet. Explor. Dev. 2014, 41, 513–519. [Google Scholar] [CrossRef]
  20. Song, X.H.; Guo, Y.T.; Zhang, J.; Sun, N.N.; Shen, G.F.; Chang, X.; Yu, W.S.; Tang, Z.Y.; Chen, W.; Wei, W.; et al. Fracturing with Carbon Dioxide: From Microscopic Mechanism to Reservoir Application. Joule 2019, 3, 1913–1926. [Google Scholar] [CrossRef]
  21. Niu, Y.; Yue, C.T.; Li, S.Y.; Ma, Y.; Xu, X.Y. Influencing Factors and Selection of CH4 and CO2 Adsorption on Silurian Shale in Yibin, Sichuan Province of China. Energy Fuels 2018, 32, 3202–3210. [Google Scholar] [CrossRef]
  22. Wang, M.; Huang, K.; Xie, W.; Dai, X. Current research into the use of supercritical CO2 technology in shale gas exploitation. Int. J. Min. Sci. Technol. 2019, 29, 739–744. [Google Scholar] [CrossRef]
  23. Zhang, S.W.; Xian, X.F.; Zhou, J.P.; Zhang, L. Mechanical behaviour of Longmaxi black shale saturated with different fluids: An experimental study. RSC Adv. 2017, 7, 42946–42955. [Google Scholar] [CrossRef] [Green Version]
  24. Lyu, Q.; Long, X.P.; Ranjith, P.G.; Tan, J.Q.; Kang, Y.; Wang, Z.H. Experimental investigation on the mechanical properties of a low-clay shale with different adsorption times in sub-/super-critical CO2. Energy 2018, 147, 1288–1298. [Google Scholar] [CrossRef]
  25. Lyu, Q.; Long, X.P.; Ranjith, P.G.; Kang, Y. Unconventional Gas: Experimental Study of the Influence of Subcritical Carbon Dioxide on the Mechanical Properties of Black Shale. Energies 2016, 9, 516. [Google Scholar] [CrossRef] [Green Version]
  26. Chen, T.Y.; Feng, X.T.; Pan, Z.J. Experimental study on kinetic swelling of organic-rich shale in CO2, CH4 and N2. J. Nat. Gas Sci. Eng. 2018, 55, 406–417. [Google Scholar] [CrossRef]
  27. Luo, X.; Ren, X.; Wang, S. Supercritical CO2-water-shale Interactions under Supercritical CO2 Stimulation Conditions. Energy Procedia 2018, 144, 182–185. [Google Scholar] [CrossRef]
  28. Yin, H.; Zhou, J.P.; Xian, X.F.; Jiang, Y.D.; Lu, Z.H.; Tan, J.Q.; Liu, G.J. Experimental study of the effects of sub- and super-critical CO2 saturation on the mechanical characteristics of organic-rich shales. Energy 2017, 132, 84–95. [Google Scholar] [CrossRef]
  29. Lyu, Q.; Ranjith, P.G.; Long, X.P.; Ji, B. Experimental Investigation of Mechanical Properties of Black Shales after CO2-Water-Rock Interaction. Materials 2016, 9, 663. [Google Scholar] [CrossRef]
  30. Chen, G.H.; Lu, S.F.; Liu, K.Y.; Xue, Q.Z.; Xu, C.X.; Tian, S.S.; Li, J.B.; Zhang, Y.Y.; Tong, M.S.; Pang, X.T.; et al. Investigation of pore size effects on adsorption behavior of shale gas. Mar. Pet. Geol. 2019, 109, 1–8. [Google Scholar] [CrossRef]
  31. Ross, D.J.K.; Bustin, R.M. The importance of shale composition and pore structure upon gas storage potential of shale gas reservoirs. Mar. Pet. Geol. 2009, 26, 916–927. [Google Scholar] [CrossRef]
  32. Yin, H.; Zhou, J.P.; Jiang, Y.D.; Xian, X.F.; Liu, Q.L. Physical and structural changes in shale associated with supercritical CO2 exposure. Fuel 2016, 184, 289–303. [Google Scholar] [CrossRef]
  33. Pan, Y.; Hui, D.; Luo, P.Y.; Zhang, Y.; Zhang, L.; Sun, L. Influences of subcritical and supercritical CO2 treatment on the pore structure characteristics of marine and terrestrial shales. J. CO2 Util. 2018, 28, 152–167. [Google Scholar] [CrossRef]
  34. Bakhshian, S.; Hosseini, S.A. Prediction of CO2 adsorption-induced deformation in shale nanopores. Fuel 2019, 241, 767–776. [Google Scholar] [CrossRef]
  35. Jarboe, P.J.; Candela, P.A.; Zhu, W.L.; Kaufman, A.J. Extraction of Hydrocarbons from High-Maturity Marcellus Shale Using Supercritical Carbon Dioxide. Energy Fuels 2015, 29, 7897–7909. [Google Scholar] [CrossRef]
  36. Lu, X.Q.; Jin, D.L.; Wei, S.X.; Zhang, M.M.; Zhu, Q.; Shi, X.F.; Deng, Z.G.; Guo, W.Y.; Shen, W.Z. Competitive adsorption of a binary CO2-CH4 mixture in nanoporous carbons: Effects of edge-functionalization. Nanoscale 2015, 7, 1002–1012. [Google Scholar] [CrossRef]
  37. Zhang, K.Z.; Cheng, Y.P.; Li, W.; Wu, D.M.; Liu, Z.D. Influence of supercritical CO2 on pore structure and functional groups of coal: Implications for CO2 sequestration. J. Nat. Gas Sci. Eng. 2017, 40, 288–298. [Google Scholar] [CrossRef] [Green Version]
  38. Liu, Y.; Song, C.; Meng, Q.; He, P.; Yang, R.; Huang, R.; Chen, S.; Wang, D.; Xing, Z. Paleoclimate change since the Miocene inferred from clay-mineral records of the Jiuquan Basin, NW China. Palaeogeogr. Palaeoclimatol. Palaeoecol. 2020, 550, 109730. [Google Scholar] [CrossRef]
  39. Xu, L.; Zhang, J.; Ding, J.; Liu, T.; Shi, G.; Li, X.; Dang, W.; Cheng, Y.; Guo, R. Pore Structure and Fractal Characteristics of Different Shale Lithofacies in the Dalong Formation in the Western Area of the Lower Yangtze Platform. Minerals 2020, 10, 72. [Google Scholar] [CrossRef] [Green Version]
  40. Hu, K.; Mischo, H. High-Pressure Methane Adsorption and Desorption in Shales from the Sichuan Basin, Southwestern China. Energy Fuels 2020, 34, 2945–2957. [Google Scholar] [CrossRef]
  41. Xu, H.; Zhou, W.; Zhang, R.; Liu, S.M.; Zhou, Q.M. Characterizations of pore, mineral and petrographic properties of marine shale using multiple techniques and their implications on gas storage capability for Sichuan Longmaxi gas shale field in China. Fuel 2019, 241, 360–371. [Google Scholar] [CrossRef]
  42. Yang, F.; Ning, Z.F.; Liu, H.Q. Fractal characteristics of shales from a shale gas reservoir in the Sichuan Basin, China. Fuel 2014, 115, 378–384. [Google Scholar] [CrossRef]
  43. Jiang, F.J.; Chen, D.; Chen, J.; Li, Q.W.; Liu, Y.; Shao, X.H.; Hu, T.; Dai, J.X. Fractal Analysis of Shale Pore Structure of Continental Gas Shale Reservoir in the Ordos Basin, NW China. Energy Fuels 2016, 30, 4676–4689. [Google Scholar] [CrossRef]
  44. Yang, R.; He, S.; Yi, J.Z.; Hu, Q.H. Nano-scale pore structure and fractal dimension of organic-rich Wufeng-Longmaxi shale from Jiaoshiba area, Sichuan Basin: Investigations using FE-SEM, gas adsorption and helium pycnometry. Mar. Pet. Geol. 2016, 70, 27–45. [Google Scholar] [CrossRef]
  45. Pfeifer, P.; Avnir, D. Chemistry in Noninteger Dimensions between 2 and 3.1. Fractal Theory of Heterogeneous Surfaces. J. Chem. Phys. 1983, 79, 3558–3565. [Google Scholar] [CrossRef]
  46. Fu, H.J.; Tang, D.Z.; Xu, T.; Xu, H.; Tao, S.; Li, S.; Yin, Z.Y.; Chen, B.L.; Zhang, C.; Wang, L.L. Characteristics of pore structure and fractal dimension of low-rank coal: A case study of Lower Jurassic Xishanyao coal in the southern Junggar Basin, NW China. Fuel 2017, 193, 254–264. [Google Scholar] [CrossRef]
  47. Zhang, S.H.; Tang, S.H.; Tang, D.Z.; Huang, W.H.; Pan, Z.J. Determining fractal dimensions of coal pores by FHH model: Problems and effects. J. Nat. Gas Sci. Eng. 2014, 21, 929–939. [Google Scholar] [CrossRef]
  48. Avnir, D.; Jaroniec, M. An Isotherm Equation for Adsorption on Fractal Surfaces of Heterogeneous Porous Materials. Langmuir 1989, 5, 1431–1433. [Google Scholar] [CrossRef]
  49. Painter, P.C.; Snyder, R.W.; Starsinic, M.; Coleman, M.M.; Kuehn, D.W.; Davis, A. Concerning the Application of Ft-Ir to the Study of Coal—A Critical-Assessment of Band Assignments and the Application of Spectral-Analysis Programs. Appl. Spectrosc. 1981, 35, 475–485. [Google Scholar] [CrossRef]
  50. Wang, Q.; Hua, Z.; Guan, J. Structure of Wangqing oil shale and mechanism of carbon monoxide release during its pyrolysis. Energy Sci. Eng. 2019, 7, 2398–2409. [Google Scholar] [CrossRef]
  51. Okolo, G.N.; Neomagus, H.W.J.P.; Everson, R.C.; Roberts, M.J.; Bunt, J.R.; Sakurovs, R.; Mathews, J.P. Chemical–structural properties of South African bituminous coals: Insights from wide angle XRD–carbon fraction analysis, ATR–FTIR, solid state 13 C NMR, and HRTEM techniques. Fuel 2015, 158, 779–792. [Google Scholar] [CrossRef]
  52. Jiang, Y.D.; Luo, Y.H.; Lu, Y.Y.; Qin, C.; Liu, H. Effects of supercritical CO2 treatment time, pressure, and temperature on microstructure of shale. Energy 2016, 97, 173–181. [Google Scholar] [CrossRef]
  53. Jia, Y. Simulation of brine-gas-sandstone interaction during carbon dioxide geological storage. Master Thesis, China University of Geosciences, Beijing, China, 2013. [Google Scholar]
  54. Zhang, B.N.; Liang, W.G.; Ranjith, P.G.; Li, Z.G.; Li, C.; Hou, D.S. Coupling Effects of Supercritical CO2 Sequestration in Deep Coal Seam. Energy Fuels 2019, 33, 460–473. [Google Scholar] [CrossRef]
  55. He, X.Q.; Liu, X.F.; Nie, B.S.; Song, D.Z. FTIR and Raman spectroscopy characterization of functional groups in various rank coals. Fuel 2017, 206, 555–563. [Google Scholar] [CrossRef]
  56. Pan, Y.; Hui, D.; Luo, P.Y.; Zhang, Y.; Sun, L.; Wang, K. Experimental Investigation of the Geochemical Interactions between Supercritical CO2 and Shale: Implications for CO2 Storage in Gas-Bearing Shale Formations. Energy Fuels 2018, 32, 1963–1978. [Google Scholar] [CrossRef]
  57. Wang, Q.Q.; Zhang, D.F.; Wang, H.H.; Jiang, W.P.; Wu, X.P.; Yang, J.; Huo, P.L. Influence of CO2 Exposure on High-Pressure Methane and CO2 Adsorption on Various Rank Coals: Implications for CO2 Sequestration in Coal Seams. Energy Fuels 2015, 29, 3785–3795. [Google Scholar] [CrossRef]
Figure 1. (a) Core from the Zu202 well in a core warehouse; (b) shale cores at about 3867 m depth.
Sustainability 12 03927 g001
Figure 2. Photographs of the Sc-CO2 treatment equipment: (a) ISCO plunger pump; (b) circulating water bath heating system and control platform.
Sustainability 12 03927 g002
Figure 3. Diffraction patterns of XRD results (Q—Quartz; Pl-Plagioclase; Sd—Siderite; Py—Pyrite; Chl—Chlorite; I—Illite).
Sustainability 12 03927 g003
Figure 4. CO2 adsorption isotherms for samples of crushed shale treated with Sc-CO2 at 40–80 °C.
Sustainability 12 03927 g004
Figure 5. N2 adsorption and desorption isotherms for shale samples before and after Sc-CO2 treatment at 40–80 °C.
Sustainability 12 03927 g005
Figure 6. Specific surface areas of an untreated sample and of samples treated with Sc-CO2 at the different temperatures shown on the X-axis. SSA data are from N2 adsorption.
Sustainability 12 03927 g006
Figure 7. Total pore volumes and pore volumes for macro-, meso-, and micropores for the untreated sample and the Sc-CO2 treated samples. Pore volumes are from N2 adsorption.
Sustainability 12 03927 g007
Figure 8. Untreated and treated sample pore size distributions as determined by (a) CO2 adsorption and (b) N2 adsorption.
Sustainability 12 03927 g008
Figure 9. Fitting curves for lnV vs. ln[ln(po/p)] (Equation (7) for samples in the relative pressure ranges 0–0.45 and 0.45–1.0).
Sustainability 12 03927 g009
Figure 10. Graphs plotting fractal dimension D1 (shale surface) against SSA and fractal dimension D2 (pore complexity) against average pore diameter.
Sustainability 12 03927 g010
Figure 11. Fourier transform infrared spectra for (a) untreated, and Sc-CO2 treated shale samples and (for “b” through “d”) curve-fitted FTIR spectra for untreated shale (b) hydroxyl structures, (c) aliphatic structures, and (d) aromatic structures.
Sustainability 12 03927 g011
Figure 12. OH–N and ring hydroxyl contents in shale sample #1–#6 (red line for observing trends).
Sustainability 12 03927 g012
Figure 13. 4H, 3H, 2H, and 1H aromatic hydrocarbon contents in shale sample #1–#6 (red line for observing trends).
Sustainability 12 03927 g013
Figure 14. Values of parameter I for Longmaxi Formation shale samples treated with Sc-CO2 at different temperatures (red line for observing trends). The parameter is defined by He et al. [42].
Sustainability 12 03927 g014
Table 1. Mineral compositions of samples after Sc-CO2 treated.
Sample NumberSc-CO2 Treat StateMineral Compositions (%) and ICDD Card Number
QuartzPlagioclaseCalciteDolomiteSideritePyriteAugiteClay
86-223770-375287-186379-134402-083771-168024-0201-
#1Untreated41.46.1--0.61.52.248.2
#240 °C,8 MPa44.57.1---1.32.444.7
#350 °C,8 MPa42.17.1---2.02.546.3
#460 °C,8 MPa40.96.6--1.41.32.347.5
#570 °C,8 MPa43.36.2--1.11.82.245.4
#680 °C,8 MPa44.46.90.60.41.11.72.542.4
Note: The mineral analysis database used the International Centre for Diffraction Data (ICDD) 2004 PDF database. Clay minerals of the samples mainly include chlorite (24-0506) and illite (26-0911).
Table 2. Specific surface area (SSA) and total pore volume (TPV) derived by CO2 and N2 adsorption.
Sample NumberSc-CO2 Treat StateCO2 AdsorptionN2 Adsorption
DR, SSA, m2/gDA, TPV (<0.85 nm), ×10−3 cm3/gBET, SSA, m2/gBJH, TPV (1.7–300 nm), ×10−3 cm3/gBJH, Average Pore Diameter, nmAverage Pore Diameter, nm (4V/A)
#1Untreated9.2012.647.797.186.113.69
#240 °C,8 MPa8.8712.486.356.066.103.81
#350 °C,8 MPa9.2214.456.716.466.173.85
#460 °C,8 MPa9.4613.047.036.515.863.70
#570 °C,8 MPa9.2913.516.896.245.833.62
#680 °C,8 MPa8.7811.316.726.366.163.78
Table 3. The fractal dimension of pore surface and structure base on N2 adsorption data.
Sample NumberSc-CO2 Treat StateFractal Dimension of Pore SurfaceFractal Dimension of Pore Structure
D1Fitted Equation (1)R12D2Fitted Equation (2)R22
#1Untreated2.6741y = −0.3259x + 0.98970.992.8592y = −0.1408x + 1.07010.98
#240 °C,8 MPa2.6652y = −0.3348x + 0.79080.992.8545y = −0.1455x + 0.86230.98
#350 °C,8 MPa2.6654y = −0.3346x + 0.84640.992.8558y = −0.1442x + 0.92350.98
#460 °C,8 MPa2.6624y = −0.3376x + 0.59460.992.8640y = −0.1360x + 0.98210.97
#570 °C,8 MPa2.6677y = −0.3323x + 0.87160.992.8619y = −0.1381x + 0.94990.98
#680 °C,8 MPa2.6664y = −0.3336x + 0.84220.992.8560y = −0.1440x + 0.91100.99
Table 4. Hydroxyl functional groups peak-fitting results of the untreated shale sample.
SamplePeak Position, cm−1Area Percentage, %Assignment
Untreated3038.970.86OH–N
3117.270.16OH–N
3119.145.08OH–N
3144.040.68OH–N
3187.215.14Ring hydroxyl
3237.368.08Ring hydroxyl
3269.710.25OH–O
3302.7114.01OH–O
3355.446.69OH–O
3406.022.74OH–OH
3467.271.84OH–OH
3503.672.95OH–π
3555.6812.85OH–π
3622.3238.69Free OH
Table 5. Hydroxyl structures synthesis results of the shale samples.
AssignmentUntreated40 °C50 °C60 °C70 °C80 °C
OH–N6.771.615.154.362.709.16
Ring hydroxyl13.224.625.263.977.205.92
OH–O20.9512.1019.3131.5212.1726.25
OH–OH4.5721.4918.181.2819.19-
OH–π15.8027.7817.1018.3332.7017.07
Free OH38.6932.4135.0040.5426.0441.60
Table 6. Aliphatic structures peak-fitting results of the untreated shale sample.
SamplePeak Position, cm−1Area Percentage, %Assignment
Untreated2814.781.95sym.R2CH2
2837.6611.23sym.R2CH2
2875.2614.46sym.R2CH2
2897.5519.32–R3CH
2934.3912.90asym.R2CH2
2984.4240.14asym.RCH3
Table 7. Hydroxyl structures synthesis results of shale samples.
AssignmentUntreated40 °C50 °C60 °C70 °C80 °C
sym.R2CH227.642.4239.503.7381.051.87
–R3CH19.32-49.550.27-1.63
asym.R2CH212.904.16--9.017.15
asym.RCH340.1493.4210.9596.009.9489.35
L = A2925/A29500.3210.045--0.9060.080
Table 8. Aromatic structures peak-fitting results of the untreated shale sample.
SamplePeak Position, cm−1Area Percentage, %Assignment
Untreated762.2018.494H
783.0422.193H
801.4426.203H
834.771.472H
882.7116.841H
899.6314.801H
Table 9. Aromatic structures synthesis results of shale samples.
AssignmentUntreated40 °C50 °C60 °C70 °C80 °C
4H18.4918.467.308.285.5218.21
3H48.3942.6155.9357.4657.0450.59
2H1.475.022.572.482.923.41
1H31.6433.9234.2031.7734.5227.80

