Individual Green Certificates on Blockchain: A Simulation Approach

1
Tsinghua-Berkeley Shenzhen Institute, Tsinghua University, Shenzhen 518055, China
2
Department of Industrial Engineering and Operations Research, University of California, Berkeley, CA 94720, USA
*
Authors to whom correspondence should be addressed.
Sustainability 2020, 12(9), 3942; https://0-doi-org.brum.beds.ac.uk/10.3390/su12093942
Submission received: 2 April 2020
/
Revised: 23 April 2020
/
Accepted: 6 May 2020
/
Published: 11 May 2020
(This article belongs to the Section Energy Sustainability)
Abstract
:Distributed renewable energy offers an exciting opportunity for sustainable transition and climate change mitigation. However, it is overlooked in most of the conventional tradable green certificates programs. Blockchain shows an advantage of incorporating a galaxy of distributed prosumers in a transparent and low-cost manner. This paper proposes I-Green, a blockchain-based individual green certificates system for promoting voluntary adoption of distributed renewable energy. Combing the features of blockchain technology and the theories of social norm and peer effects, the novel green ratio incentive scheme and proof of generation consensus protocol are designed for I-Green. A blockchain simulator is constructed to evaluate the effectiveness and efficiency of I-Green system. The simulation results present its potential for facilitating widespread adoption of distributed generation, and confirm the feasibility of blockchain as the information communication technology (ICT).
1. Introduction
In the era of sustainable transition, distributed renewable energy plays a significant role in greenhouse gases abatement. Compared to centralized generation, distributed generation presents advantages including less transmission loss, flexibility and resilience [1]. Efficiency and reliability of distributed generation have been improved, owing to the rapid development of distributed energy resources (DERs) and distributed energy storage systems (DESS) [2]. Additionally, microgrids are constructed in many areas for local energy sharing and load balancing, which improves the utilization of distributed generated power [3]. Distributed energy, therefore, is promising in accommodating the growing energy demand and accelerating renewable energy transformation.
DER deployment has been expanding over the last decade in many developed countries, such as Denmark, Germany, Japan and U.S. (https://www.qianzhan.com/analyst/detail/220/180418-ebc688e9.html). However, in many countries in South America, Asia, and Africa, distributed generation constitutes only a small fraction of total power capacity, and distributed energy is not sufficiently utilized. A combination of regulatory, economic, social and technical issues impedes widespread adoption of distributed renewable energy [4,5]. In addition to regulatory uncertainties and installation investment, public attitude towards DERs is a main barrier in many cases [6]. Some residents are reluctant to have energy generation systems on site, as they take up space and might be unpleasant to the eye. Besides, most residents have little knowledge or experience in DERs. Lack of reliable and individually-relevant information about technology performance, daily operation and maintenance deters them from deploying DERs [7].
For motivating renewable energy adoption, tradable green certificates (TGCs) and renewable energy certificates (RECs) schemes are widely implemented all over the world. One TGC or REC represents the generation of a certain amount of electricity from a renewable energy source. In compliance REC and TGC markets, electrical power distributors and suppliers are required to buy certificates from renewable power plants, as a proof of providing renewable energy to their customers. These markets have been proved by several research to be inefficient and economically unfavorable to end-consumers [8,9]. There are also voluntary certificates markets, but most REC and TGC schemes failed to engage consumers and prosumers (Prosumers are people who consume and produce electricity in the meanwhile.), or to motivate distributed generation.
With properties of decentralization, transparency, immutability and security, blockchain technology offers an unprecedented opportunity for promoting distributed renewable energy. The first blockchain was conceptualized by Nakamoto’s white paper on Bitcoin [10], the pioneering digital currency to solve the double-spending problem without requiring a trusted authority. Blockchain is a distributed ledger technology. Transactions are encapsulated in a “block”, which is cryptographically linked to the previous block, forming a ledger in a form of chained blocks. Through peer to peer communication, the ledger is shared on a distributed network, where each node can have a copy of the ledger. Following the consensus protocol, nodes collectively maintain the ledger and achieve consistency. With the evolvement of blockchain technology, the second generation of its application—smart contract, has emerged. Smart contracts contain computer code converted from contractual clauses or interaction rules. They are stored on blockchains and executed automatically when the predefined triggers happen. Smart contracts on blockchains are self-executed and self-enforced [11], fostering collaborations among known or unknown participants [12]. The features and capabilities of blockchain technology are consistent with the requirements of a voluntary certificates market. Without the need of intermediaries, it allows direct interactions among prosumers and consumers in a costless manner, which could lead to off-line communications in communities and impact people’s attitude. Owing to its transparency and immutability, a reliable record of the generation and transaction of certificates can be constructed, rendering a trustworthy and attractive system. Appropriate incentive mechanisms could be coded in smart contracts, deployed and automatically executed on blockchains. Therefore, blockchain technology is worth to be explored for facilitating certificates markets and distributed energy adoption.
In this research, we leverage blockchain technology and design I-Green, a blockchain-based individual green certificates system for prosumers and consumers in a community. A simulation approach is deployed to examine and improve the effectiveness and efficiency of I-Green. This paper consists of several parts:
- Combing the transparency and reliability of blockchain technology and the theories of social norm and peer effects, this research designs a novel incentive mechanism of I-Green—the green ratio scheme, for motivating voluntary green certificates trading between consumers and prosumers.
- This research designs the cryptocurrency and the consensus protocol of I-Green—proof of generation, which has a synergy effect with the green ratio scheme.
- A simulation approach is applied to study both agents’ behavior and system performance of the designed I-Green blockchain. Simulations with different consensus protocols, incentive intensities, and network scales indicate that I-Green has the potential to effectively and efficiently facilitate adoption of distributed renewable energy.
- The light-weight blockchain simulator constructed in this research retains the principles and logics of blockchain operation and simultaneously incorporates agents’ behavior. Therefore, it can be used to investigate both blockchain performance and interactions on blockchains with varying blockchain configurations and market schemes.
This article is arranged as following: Section 2 reviews related literature and projects; in Section 3, design of I-Green system is demonstrated, including the architecture, cryptocurrency, incentive mechanism and consensus protocol; the simulation framework is constructed in Section 4; Section 5 presents simulation results and analysis of I-Green; Section 6 concludes.
2. Related Literature and Projects
The idea of leveraging blockchain technology to facilitate low-carbon and renewable development has emerged since the proliferation of blockchain technology. The blockchain technology has been explored to improve the accountability and transparency of carbon markets [13,14,15], green supply chain [16] and reward environmentally-friendly behaviors [17]. However, literature works on application of blockchain in the renewable energy field mainly concern peer to peer energy trade [18,19] and resource optimization on microgrids [20,21,22]. Studies on blockchain-based energy certificates are limited.
Cryptocurrency [23] is a medium of exchange and an incentive in consensus protocols of blockchains. A conceptual framework for developing renewable energy certificates as cryptocurrencies on Ethereum blockchain was proposed in [24]. It provided a brief description on how certificates can be issued by PUC (public utility emission) and traded between QP (qualified producers) and UP (unqualified producers) without a detailed system design. A small-scale experiment of peer to peer green certificates trade through blockchain was conducted in several solar energy-powered buildings [25]. It confirmed the feasibility of blockchain for supporting transactions, and concluded that a permission role is in need for many blockchain applications in real-world scenarios. In [26], two cases of applying blockchain technology to energy certificates markets were analyzed. Benefits of introducing blockchain were identified, including lower transaction cost, increased reliability, transparency and security. Studies on applying blockchain technology to environment and energy credits are at an early stage, as most of them proposed conceptual models without clear incentive schemes.
There are several articles conducting further research on design and simulation of blockchain-based certificates and energy trading systems. Simulations are mostly conducted on existed blockchains, especially Ethereum and Hyperledger Fabric. In [27], green certificates trading was simulated between 20 households with smart contracts on Ethereum blockchain. Without effective incentives, it simply assumed that all consumers buy cryptocurrencies to cover all of their consumption. With an electricity pricing scheme for load balancing, peer to peer energy trade was simulated on Ethereum in [28]. Similarly, a local energy market was designed and simulated on a private Ethereum blockchain in [29]. A blockchain-based double auction energy trading platform was simulated in [30], but it focused on analyzing the impacts of peer to peer trading on distribution network. Scanergy [31,32] designs a cryptocurrency, NRG Coin to motivate prosumers to assist with the grid load balancing. NRG Coins can be used as a payment for certain amount of electricity. Scanergy pays prosumers with NRG Coins for the feed-in electricity, the amount of which is adjusted according to the electricity demand and load balancing. This dynamic granting mechanism influences prosumers’ uploading of distributed generation. Simulation of Scanergy [33] concluded that digital currencies could be an important ingredient in the design of incentive mechanisms. These simulations mainly focused on analyzing market activities of participating agents, leaving out the evaluation of the operation of underlying blockchain systems. On the other hand, in the broader field of blockchain, simulation method was mostly used for studying performance, cost and security of PoW blockchains [34,35,36]. A private blockchain was simulated with various block intervals and numbers of confirmation blocks in [37], and the latency was accordingly evaluated. In [38], a scalable blockchain simulator VIBES was proposed, which takes parameterized blockchain and network settings as inputs, and derives performance metrics according to pre-defined formulas. Simulation of Scanergy [33] concluded that cryptocurrencies could be an important ingredient in the design of incentive mechanisms. In summary, a blockchain simulation framework for analyzing both system performance and agents’ behavior is missed in existing literature.
Blockchain technology has been applied by several practical endeavors in distributed renewable energy promotion programs. Smart Solar (https://www.ideocolab.com/prototypes/smartsolar) is a project of IDEO, aiming to design a blockchain-connected solar panel that proves and tracks generated energy as well as creates and transacts RECs autonomously. EW origin (https://energyweb.org/origin/) is a decentralized application developed by Energy Web Foundation for recording the provenance and tracking the ownership of renewable energy generation, with information of location, time, source type, and emissions. Launched in 2014, SolarCoin (https://solarcoin.org/en/node/6) is a solar electricity reward program, granting cryptocurrencies to solar energy producers. The cryptocurrency is listed on several exchanges but suffers from undervaluation due to inflation, which counteracts its effectiveness.
Social norms and peer effects are two theories in psychology and sociology, often utilized for motivating pro-environmental activities. For the design of incentive mechanisms of the blockchain-based certificates system, the theories and their effects are reviewed. Social norm is the perceived prevalent conduct of a group and believed to be appropriate and acceptable by most individuals. Research on the role of social norms in promoting environmentally-friendly behavior has started several decades ago, confirming that people tend to approach to social norms when they learn they are outliers [39,40,41]. Social norms, therefore, can be harnessed for motivating pro-environmental behaviors. Field experiments and practical pilot projects have been conducted, such as the one in Sacramento, California, which cut energy demand by 2%, just by telling residents their energy usage level compared to their neighbors’. Social norms are classified as descriptive norms and injunctive norms. Descriptive norms are perceptions of the most general behaviors of the majority people, while injunctive norms involve perceptions of what behaviors are typically approved or disapproved. In [42], it is found that the descriptive norms make a change to energy consumption behavior but also lead to boomerang effects, by which households with a lower-than-average power consumption tend to consume more once they know that they are doing better than their neighbors. New information and communication (ICT) technologies that address the invisibility of typical behaviors are essential for the formation and functioning of social norms [43]. In terms of peer effects, the survey and regression model in [7] concluded that both passive peer effects (effects of seeing photovoltaic (PV) systems in the neighborhood), and active peer effects (effects of in-person communication with PV owners) accelerate the decision process of solar adoption. Survey in North California conducted by [44] confirmed that neighbors with PV are key information channels in the spread of solar, and that the peer effect is a common motivator for adoption. To summarize, social norms and peer effects are proved to be effective for incentivizing pro-environmental behaviors if appropriately incorporated.
3. I-Green System Design
3.1. Architecture of I-Green
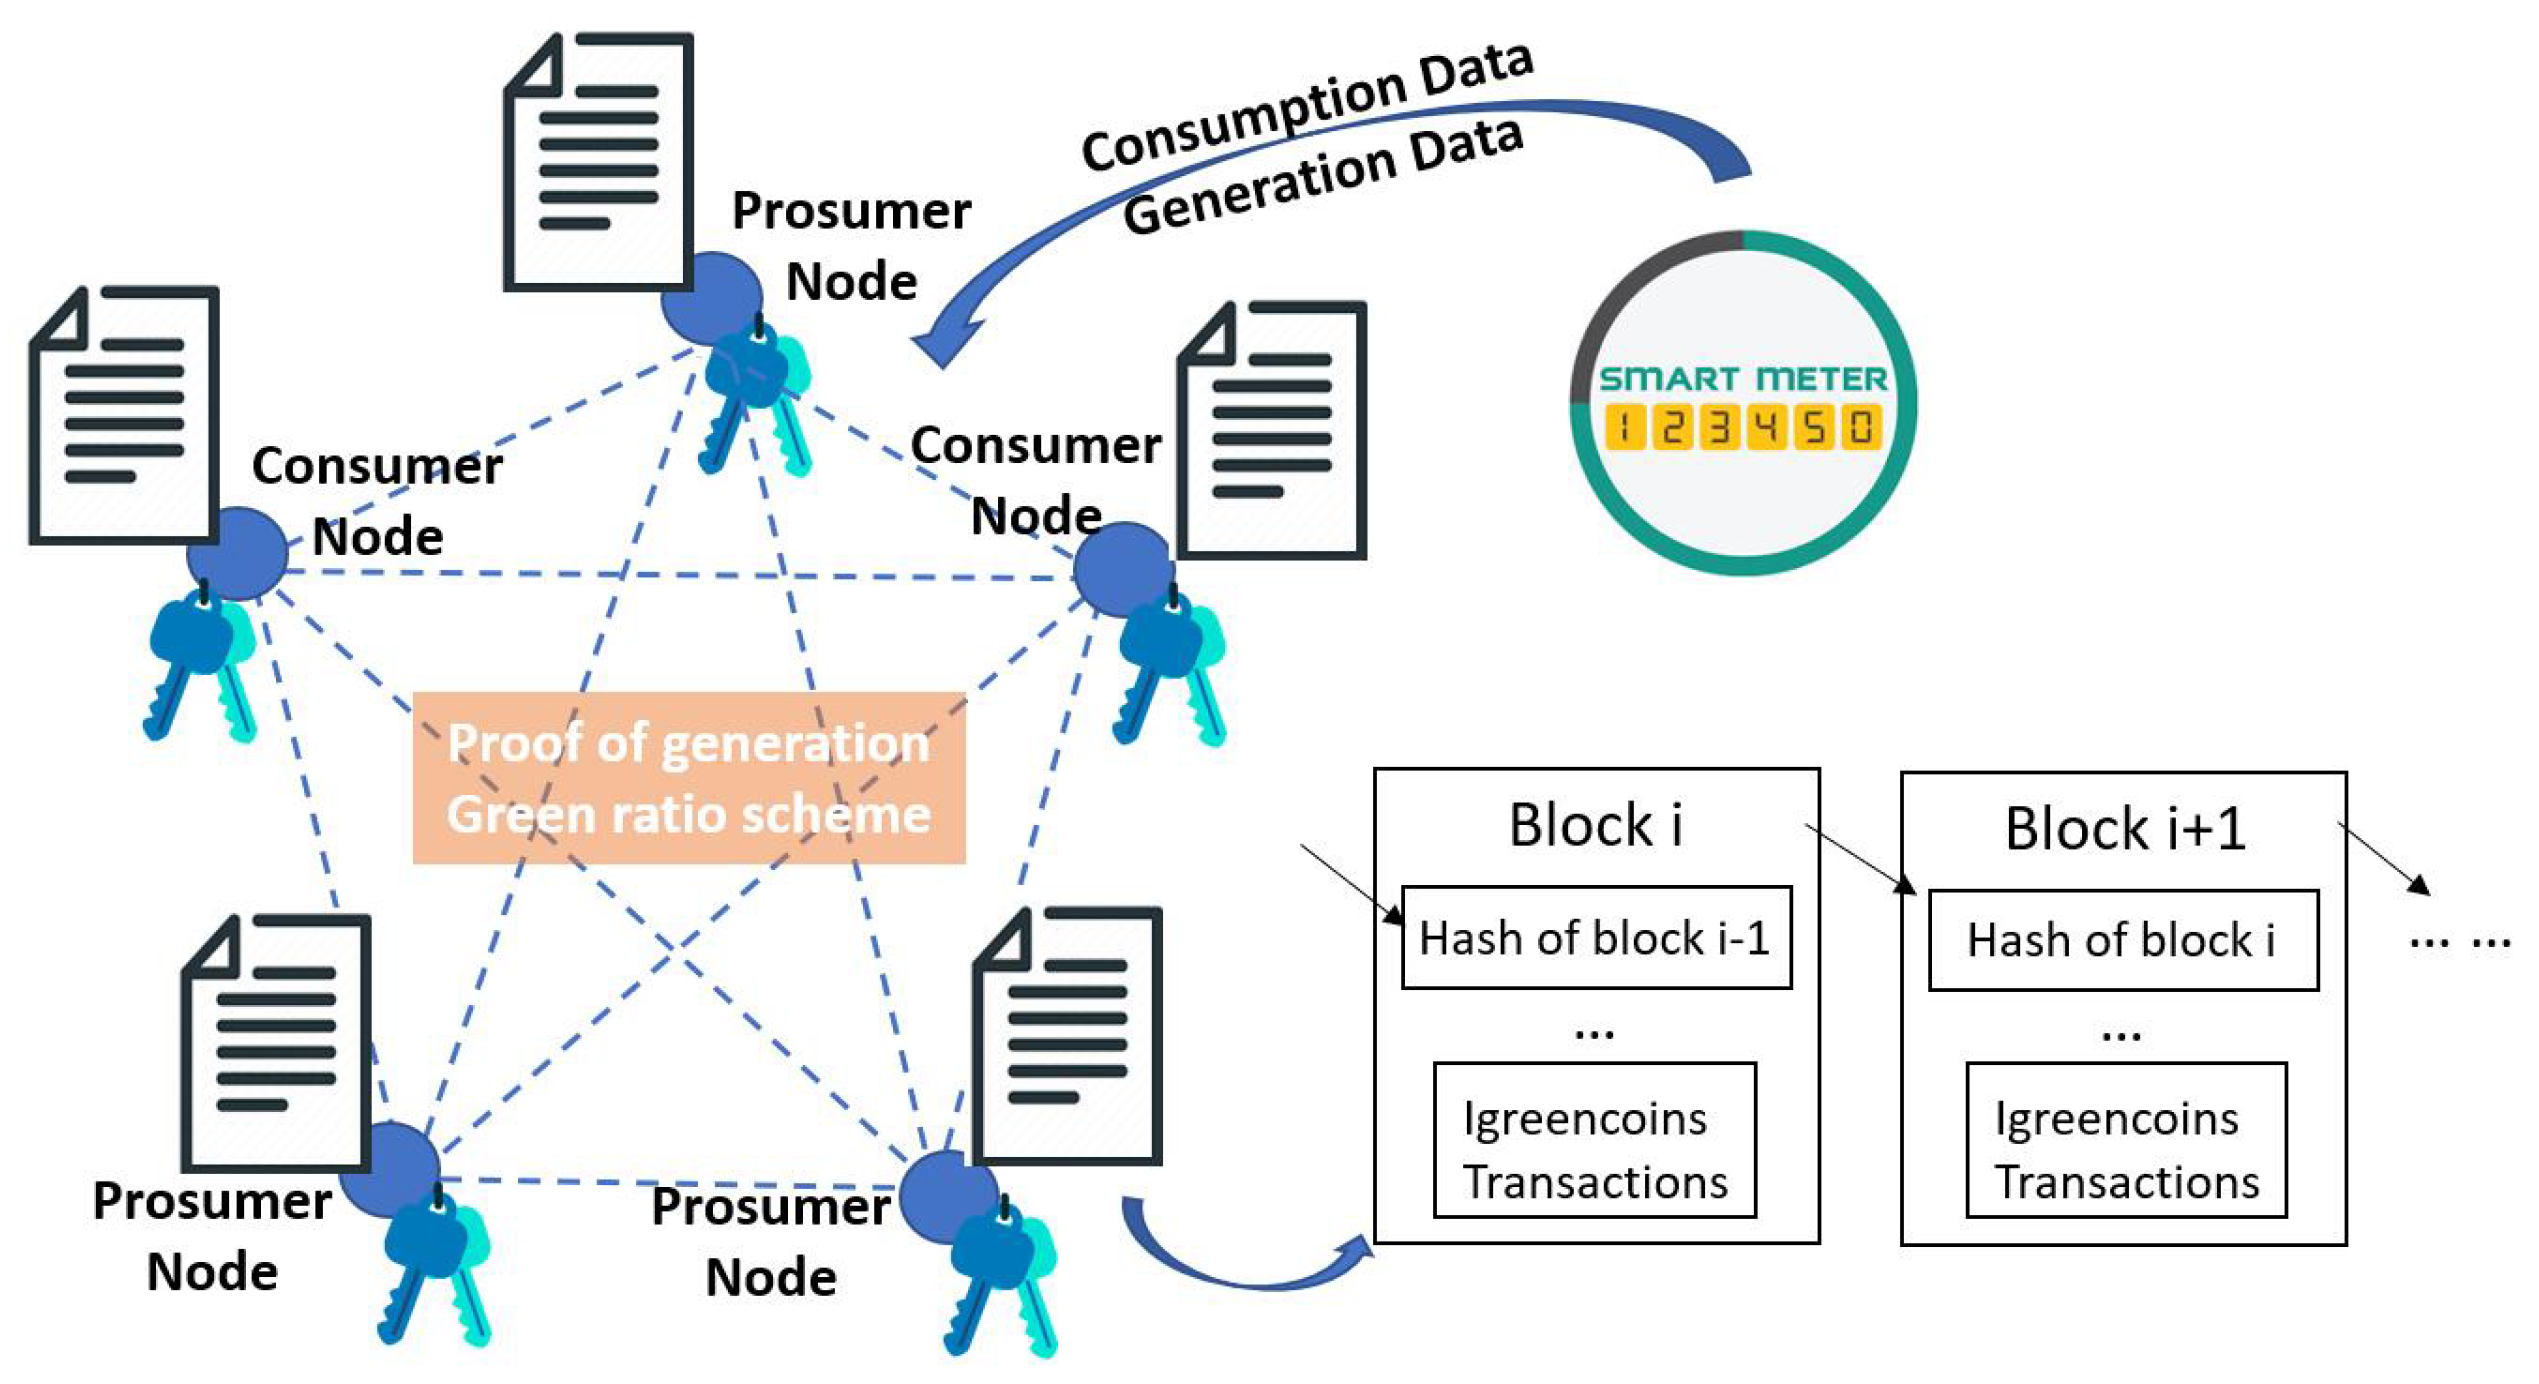
I-Green is a consortium blockchain, deployed and bootstrapped by a community committee (government or civil organization). All households in the community can join I-Green as consumer nodes, while only prosumers with registered electricity generation equipment and smart meters become prosumer nodes. The community committee conducts authorization for I-Green. An authorized participant gets a pair of keys (public key and private key) to access I-Green system. Participants (consumer nodes and prosumer nodes) use public keys to represent their identities on I-Green, without revealing their physical identities among each other. Electricity generation and consumption data of residents are uploaded through smart meters, encrypted and recorded on I-Green blockchain. Thousands of households in the community can be connected through I-Green, collectively maintaining a transparent and immutable record of renewable energy adoption. The architecture of I-Green is shown in Figure 1.
Igreencoins are designed as the native cryptocurrency of I-Green blockchain. They are created and granted to prosumers when they feed renewable electricity into the grid, which is recorded by smart meters automatically. Accordingly, each igreencoin is backed by one kWh of renewable energy. Consumers without PV on their rooftops can buy igreencoins from prosumers who are willing to sell extra coins. Holding igreencoins is a proof of generation or consumption of renewable energy. Igreencoins are only granted for injecting electricity into the grid, which will be transmitted to and consumed by others. Self-consumed renewable generation is not rewarded with igreencoins, since energy generation rather than consumption is encouraged.
The operation of I-Green system is divided into successive phases, denoted by contribution periods. At the end of each contribution period, all igreencoins created, earned or bought from others retire, thus are no longer available for trading in following periods. The coin retirement mechanism refrains the system from inflation.
Similar to the green certificate scheme, igreencoin trading is independent from transaction and transmission of underlying electrical power. Therefore, I-Green system is applicable to different physical situations of distributed generated electricity—either delivered to neighbors through microgrid or sent back to the energy distributor by macrogrid.
3.2. Consensus Protocol—Proof of Generation
Consensus protocol is critical for a blockchain system. It is the rule governing how new valid blocks are created and a consistent ledger is reached on a blockchain. There are various consensus protocols deployed by different blockchain applications [45,46], such as proof of work (PoW), proof of stake (PoS), delegated proof of stake (DPoS), and practical Byzantine fault tolerance (pBFT). Among them, Pow and PoS are the primary and most popular protocols. Enlightened by them, many proof of X protocols are proposed, such as proof of elapsed time, proof of burn, proof of activity, etc. The consensus protocol essentially defines a voting scheme, for selection of the next bookkeeper. Under PoW, nodes (a.k.a. miners) compete with each other to solve hash puzzles, and the first one who get a solution can create a new block and spread it over the network. Instead of setting a puzzle-solving competition for bookkeeper selection, PoS requires nodes to lock some coins into the network as stake. The proportion of a node’s stake determines its chance of being selected to verify transactions and create a new block. Only if the new block is accepted by the network, the verifier can get its staked coins back and collect reward, which prevents it from falsifying data.
The consensus protocol to a great extend determines key performance of a blockchain, including throughput, latency, scalability, security and efficiency [47,48]. As the consensus protocol of Bitcoin, PoW is widely criticized for resource waste [49,50] and vulnerability to a 51% attack (A 51% attack is that a miner controlling more than 51% of the computational power of the network is able to create blocks of falsified transactions and invalidate blocks created by honest miners.) due to the concentration of mining power. PoS, on the other hand, is more efficient than PoW in terms of speeding up transactions and saving resource [51].
Considering impacts of a consensus protocol on blockchain performance, requirements for the consensus protocol of I-Green are summarized. First, it should be energy-efficient, as the ultimate goal of I-Green system is to facilitate sustainability. Computationally extensive consensus protocols, such as proof of work, should be avoided. In addition, I-Green system provides a platform for transactions, thus it should be able to handle a certain amount of requests within an acceptable time. This imposes throughput, latency and scalability requirements to the consensus protocol. Furthermore, security is a significant factor for I-Green, as it involves many individuals and personal information.
Based on these requirements, a novel consensus protocol—proof of generation (PoG) is designed for I-Green blockchain. It makes use of the electricity data submitted on I-Green. The consensus process of PoG includes following steps:
- Prosumer nodes voluntarily run for candidates. Based on submitted electricity data on I-Green in last period, Top N nodes with highest feed-in generation become verification candidates.
- A proposer is randomly selected among N candidates, who verifies transactions, creates a new block, and broadcasts it to all candidates. If the selected proposer fails to response within the waiting time T, a new proposer will be selected.
- All candidates verify the new block and broadcast their confirmations to other candidates.
- Candidates add the new block to the blockchain, if more than confirmations from other candidates are received.
- If the newly created block is not accepted by the majority of verification candidates, a new round of consensus process will be initiated. The proposer of the invalid block is considered malicious and will be banned from joining the verification candidates group.
The PoG protocol has several advantages:
- On the contrary to PoW, which requires investment in mining machines and consumption of energy, PoG requires investment in distributed energy generation. It benefits the environment, instead of putting more pressure on it.
- New coins on I-Green system are created from two sources—grant for renewables generation and block reward for processing transactions. These two sources both provide motivation for consumers to become prosumers, which is consistent with the goal of I-Green system for promoting renewable energy adoption.
- The transaction fee is not required, which renders the I-Green system more attractive to participants.
- In terms of security, the PoG protocol retains a certain level of randomness of verifiers selection. The new block creator is randomly selected from top N nodes with highest feed-in generation. First, the amount of feed-in electricity highly depends on both the weather and the consumption during last round, which add randomness to who can enroll in the candidates group. Furthermore, PoG randomly selects next block creator from verification candidates, instead of choosing the one with highest feed-in generation. This selection mechanism mitigates the risk of the system being controlled by a single entity. It shows advantage over PoW and PoS, under which the probability of being selected can be predicted by nodes’ resource or stake. With more system participants and a larger number of candidates N, the security of I-Green system can be further improved.
3.3. Incentive Mechanism—Green Ratio Scheme
3.3.1. Design of the Green Ratio Scheme
According to the theories of social norm and peer effects reviewed in Section 2, individuals’ decisions and behavior are impacted by the social norm and their peers, especially regarding activities that benefit the public and the society. Combining the motivation effects of social norm and peer effects, and the transparency and reliability of blockchain technology, we design the green ratio scheme for I-Green system. The green ratio scheme is a vehicle for attracting participants and motivating renewable energy adoption. Green ratio is defined as the percentage of renewable energy in total energy consumption, and it is calculated in terms of each household and of the community as a whole.
In Equation (1), is the amount of distributed renewable electricity fed into the grid by all prosumers in that community, and can be measured by aggregate number of igreencoins held by all participants of I-Green; is the amount of renewable electricity supplied by utility companies; C is the total consumption of the community. , where is the amount of non-renewable electricity from suppliers. The proportion of renewables of centralized power supply .
In Equation (2), is the metered electricity consumption of household i (it would be assigned a small number for feasibility if .); and are amounts of distributed and centralized renewable electricity consumption of household i. is measured by the amount of igreencoins held by household i, as both self-made and purchased coins represent consumption of renewables. is calculated proportionally as , since renewable electricity is either generated by prosumers or provided by utility companies. As previously designed, the data of self-produced and self-consumed electricity is not submitted on the I-Green system, and is not rewarded with igreencoins.
The data of individual and community green ratios are calculated and recorded automatically on the I-Green blockchain ledger, based on generation and consumption data uploaded onto I-Green system through smart meters. Green ratios are public data on I-Green blockchain, which are open to all participants for the formation of the social norm and the functioning of peer effects.
3.3.2. Mechanisms of the Green Ratio Scheme
Community green ratio represents the average adoption rate of renewables among households in the community, providing the social norm. Owing to the effect of social norm, residents subconsciously compare their own ratios to that of their neighbors, and have the tendency to stay near the average level. In other pro-environmental programs, the norms, such as consumption, waste or recycle data, are provided by third parties. Whereas, green ratios are calculated and recorded on blockchain as public data, under the witness of all participants. Thanks to the transparency and reliability of blockchain technology, it accelerates the formation of a more visible and trustworthy social norm, which has stronger behavior guiding effects.
The motivation mechanisms of the green ratio scheme are threefold:
- Under the pressure of social norm, households with ratios lower than the community level tend to improve their ratios by purchasing igreencoins, forming the demand of igreencoins.
- Prosumers with above-average green ratios can sell their extra coins to others and make profits. They are economically incentivized to earn more igreencoins by generating and feeding more renewables, even their green ratios are already higher than the norm. Therefore, the green ratio scheme avoids the boomerang effect of social norms, which states that people performing better than the social norm have the tendency to retrograde.
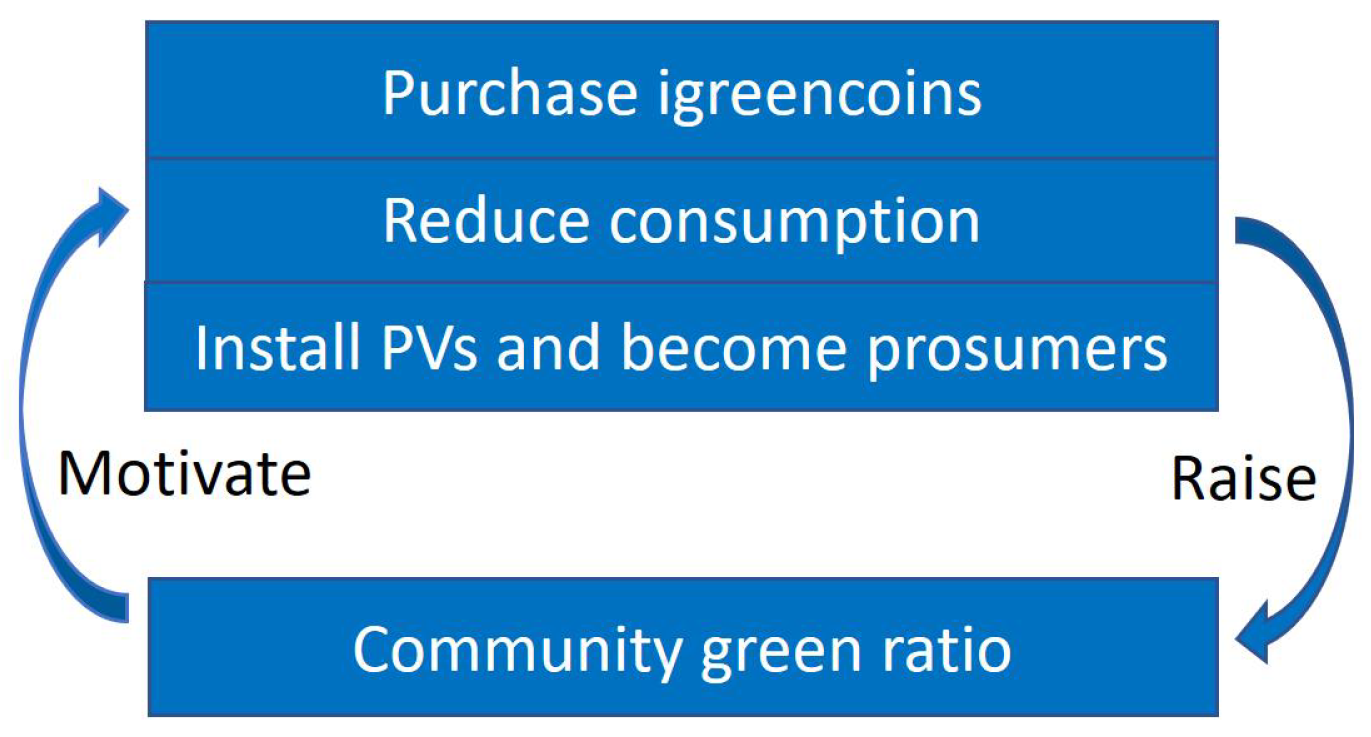
- To achieve a higher green ratio, a consumer also has choices of reducing consumption or becoming a prosumer by installing solar panels. With more energy being saved and more prosumers joining I-Green, the community green ratio will rise, which in turn sets a higher social norm level for participating households to achieve.
With these mechanisms, the positive feedback between the social norm and renewable energy adoption is constructed through the green ratio scheme, as shown in Figure 2. Households competitively improve their renewables proportions, realizing a higher community green ratio, which in turn further motivates participants. Although self-consumed generation is not directly rewarded on I-Green system, it benefits its owner by reducing metered consumption and improving the green ratio. Therefore, green ratio scheme of I-Green also motivates self-sufficiency.
In addition to the passive peer effect (pressure from social norms or peers behaving better), the active peer effect also plays a significant role for promoting renewables adoption. With information about benefits and operation experience of DERs disseminating between PV owners and their neighbors, concerns of some people could be mitigated, which increases the acceptance of DERs across the whole community.
3.3.3. A Reputation System Based on Green Ratio
Green ratios are calculated according to accumulated generation and consumption of electricity during one contribution period. At the end of a contribution period, I-Green system records green ratios as historical data on the blockchain ledger. Then the system resets data and initiates a new contribution period. Retired igreencoins, together with historical green ratios, are locked up on the blockchain, providing a permanent and immutable record of households’ contributions to the environment and sustainable development.
A reputation system can be constructed based on the contribution record. Although physical identities are kept private on I-Green, participants always have the choice to disclosure and prove their identities with private keys. This option might be favorable to people who want to demonstrate their efforts and contributions to renewable transition, and to prove that they are socially responsible. Therefore, the contribution record provided by I-Green forms a reputation system, which households can voluntarily join. Besides, the certain extent of trust built on the reputation system can be utilized for verifier selection of the consensus protocol, to improve the efficiency of I-Green blockchain.
4. Simulation Configuration
To examine the performance and effectiveness of the designed I-Green system, it is simulated with various blockchain settings and incentive intensities. The PoG consensus protocol is compared with other typical protocols, including PoW, PoS, and a private blockchain, which functions similar to a centralized system.
4.1. Simulation Environment and Structure
The simulation is conducted on a computer with following properties: operating system: 64-bit windows 10; RAM: 12 GB; processor: Intel (R) Core (TM) i5-4590 CPU @3.30GHz 3.30 GHz. The simulation is implemented with Python.
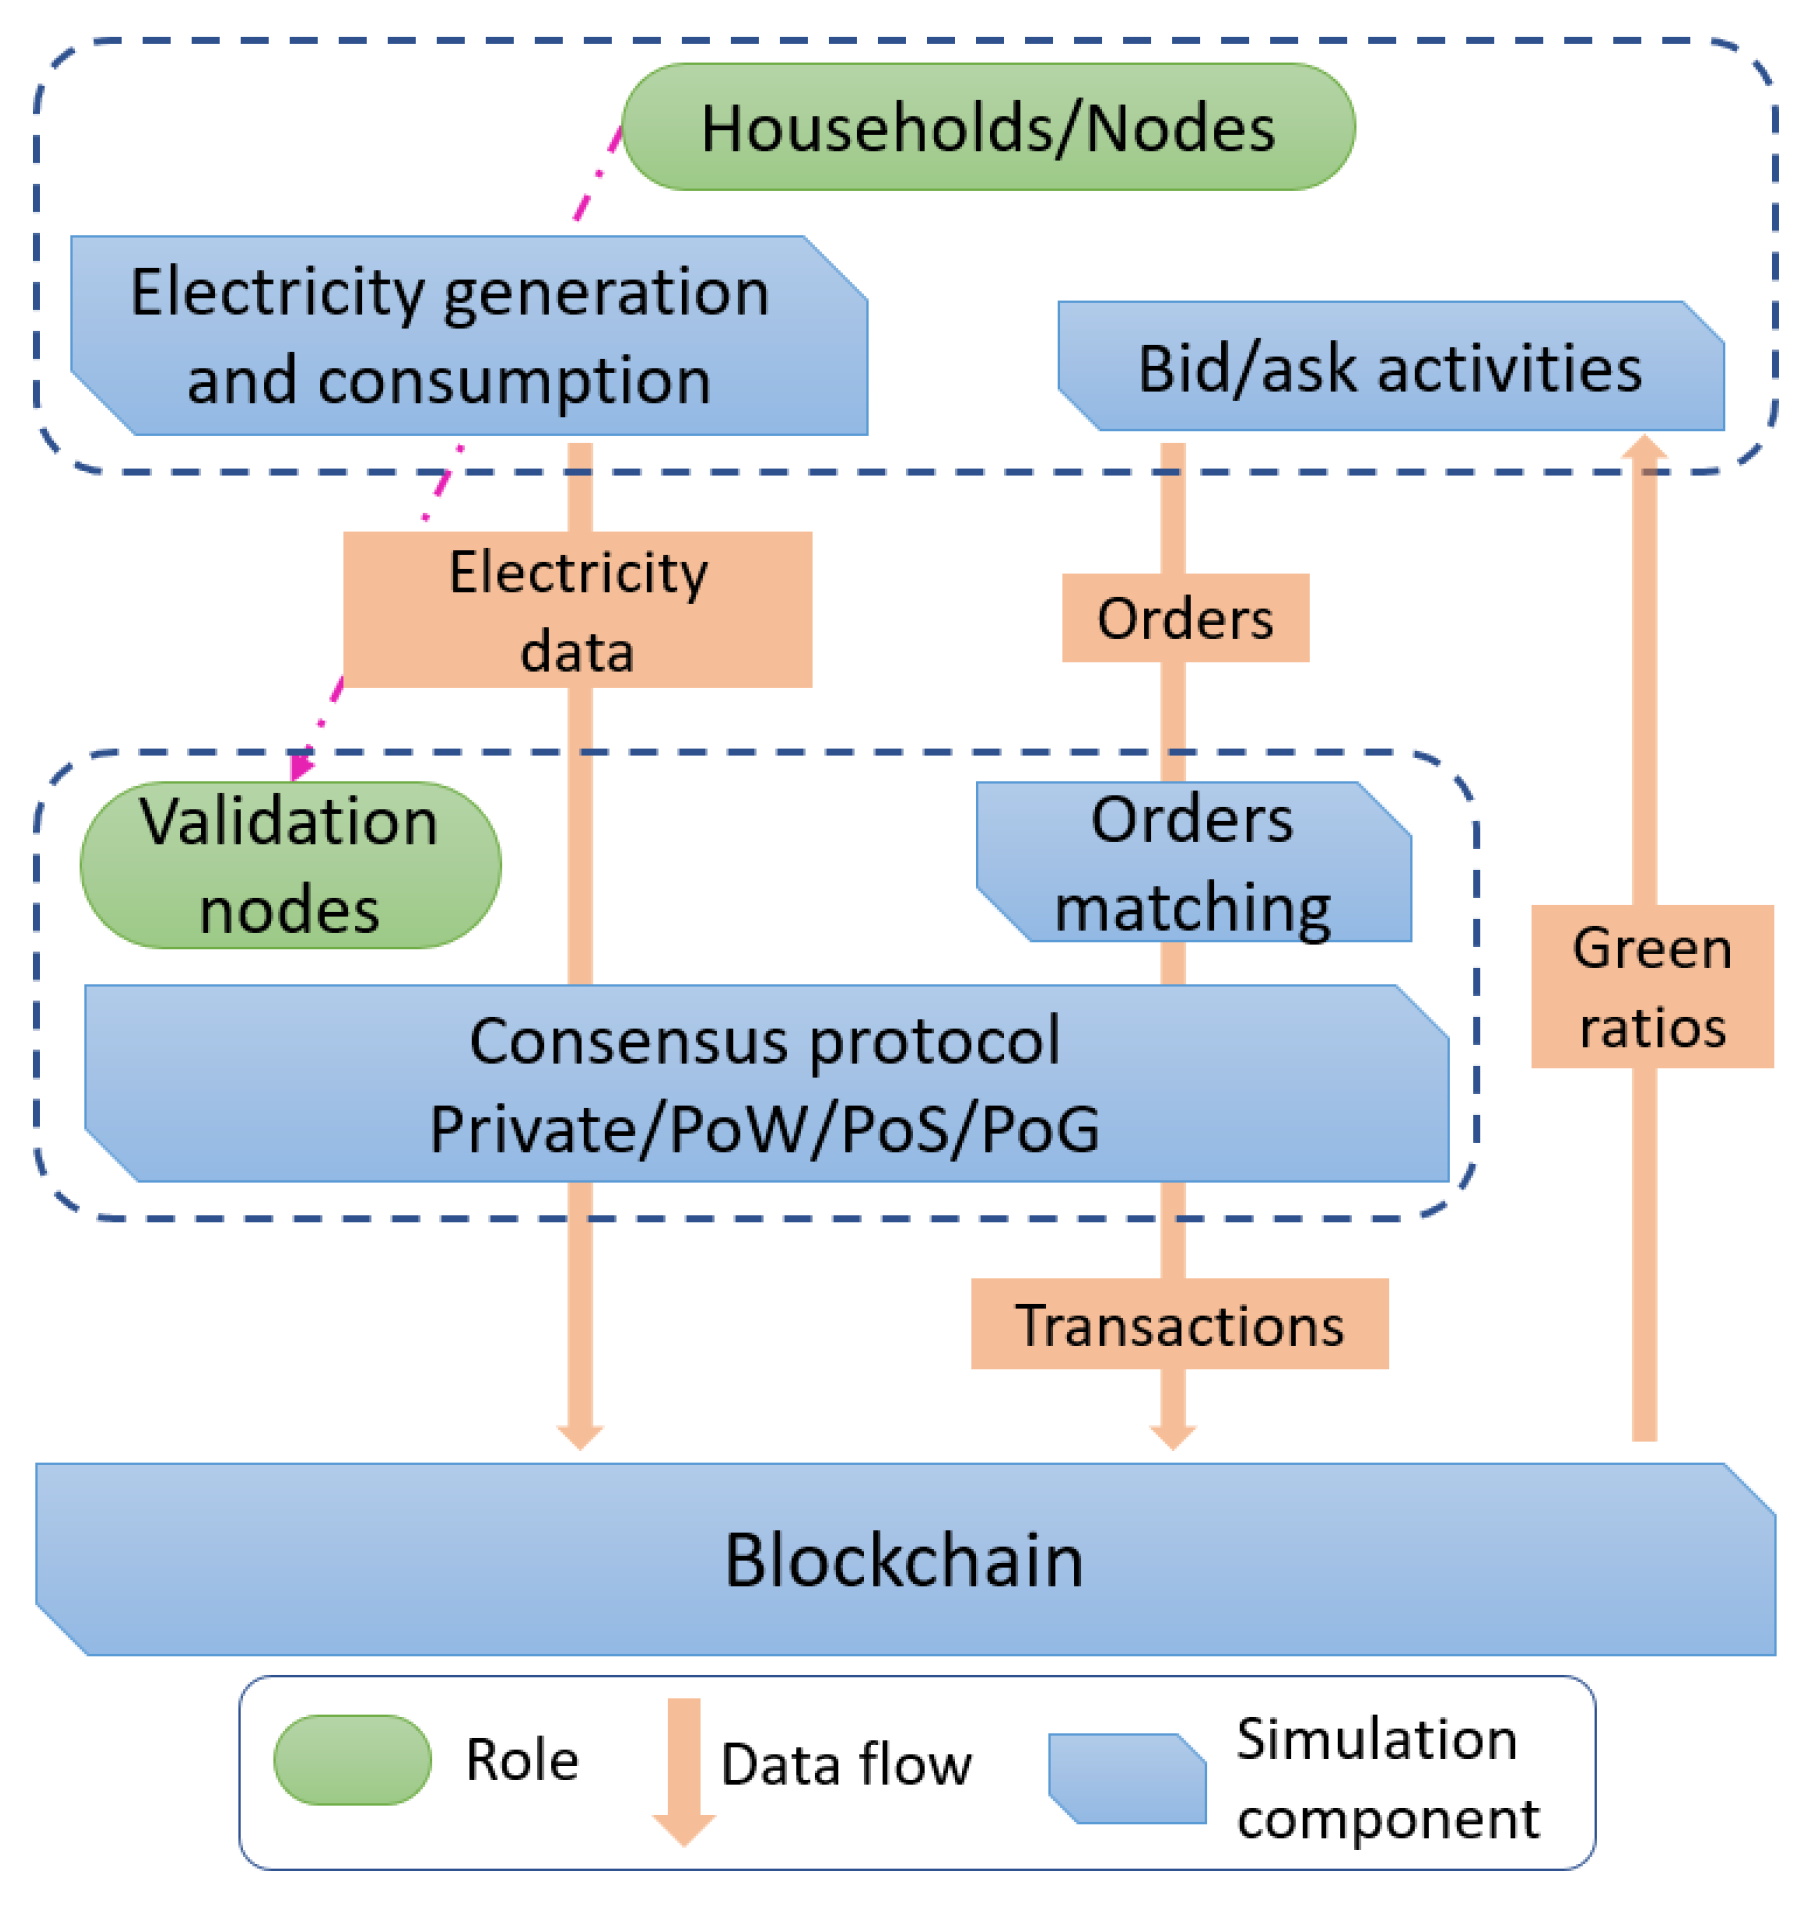
The structure of the simulation is shown in Figure 3. Each household is a node on I-Green blockchain, with their electricity generation and consumption data submitted onto I-Green through smart meters. Their bid and ask activities are simulated through order generation based on the green ratio scheme. Orders are matched, and the corresponding transactions are broadcast to the network. The submitted data, including electricity data and transaction data, are verified then recorded on the blockchain ledger, according to the consensus protocol. The consensus protocol in simulation is switchable among PoG, PoW, PoS, and a private blockchain. The blockchain ledger stores accounts and balances, and historical data. The details of each simulation component are explained in following sections.
Simulated scenario is the deployment of I-Green in a community during 30 consecutive days. I-Green is initiated by the community committee, then households register on the system, getting pairs of private and public keys for access. On each day of the simulated period, following activities are conducted:
- Households (nodes) submit daily electricity consumption and generation data onto I-Green, according to which new igreencoins are created and granted, and green ratios are calculated automatically;
- Nodes read green ratios of their peers and the community from the blockchain ledger and make bid or ask orders, which is impacted by the intensity of the green ratio scheme;
- Orders are collected in an order book and matched by the validation node;
- Matched orders are submitted to the network as pending transactions, and outstanding orders are canceled;
- According to the consensus protocol (PoG, PoW, PoS, or a private blockchain), verification nodes collectively verify electricity data and transaction data, and record them on the blockchain ledger;
- Transactions are settled, and balances of accounts are updated.
4.2. Households and Electricity Data
Networks of a small, a medium and a large community, with 100, 1000, and 10,000 households, respectively, are simulated. 30% of households in a community are prosumers, with PV systems or other electricity generation equipment. Households register on I-Green as consumer nodes or prosumer nodes.
Based on previous methods for electricity data simulation [52,53,54], following factors are taken into consideration for the simulation of electricity generation and consumption:
- Weather: it affects all households, as sunlight intensity impacts generation, and temperature impacts consumption. It is assumed that sunlight intensity and temperature are independent.
- Capacity of solar panels: prosumers have different numbers of panels on their rooftops.
- Consumption habits: each household has its habit of electricity usage.
- Random factors: the consumption and generation of a node on each day are both affected by random factors.
The simulation of these factors are showed in Table 1.
Consumption of node j on day i is affected by temperature of the day , consumption habits of the node , and a random factor . It is simulated as: ∼ Normal(260,101). The distribution of consumption is truncated to avoid negative values.
Generation of prosumer node j on day i is affected by sunlight intensity of the day , PV capacity of the node , and a random factor . It is simulated as: . The distribution is also truncated for generating only positive values.
4.3. Simulation of Bid and Ask Activities
Ask and bid activities of participants are simulated under different intensities of the green ratio scheme. It is assumed that distributed generation is the only source of renewables, thus green ratio is calculated as the ratio of number of igreencoins to the consumption amount. The effect of green ratio scheme is simulated through the norm factor. The norm factor is defined as the percentage of nodes with lower-than-average green ratios that are willing to buy igreencoins to improve their green ratios. It is a signal of how strong the impact of the social norm is on residents’ decisions. A higher norm factor indicates that more households are motivated by the social norm to improve their green ratios. The simulation runs for scenarios with norm factors equal to 10%, 50% and 90%, respectively.
A higher norm factor also implies a higher willingness to pay for igreencoins. Accordingly, bid price and amount are simulated based on the norm factor and bidder’s deviation from the social norm—the difference between her green ratio and the community green ratio, as in Equation (3). The base price is set as 100. With a larger green ratio lag and a higher norm factor, bidders are willing to buy more igreencoins with a higher price.
On the asking side, it is assumed that nodes with green ratios greater than the community level would like to sell their extra coins and put ask orders. The ask amount and price are simulated according to Equation (4). The ask price is mainly determined by the base price of igreencoins and the norm factor, since the demand will be higher with a higher norm factor. Additionally, a random factor is included to reflect the preference of different offerers, which is set as an integer uniformly distributed in the range of [0, 15]. The ask amount is positively related to the excess of offerer’s green ratio over the community level, indicating that a household with a higher green ratio would like to sell more coins.
Orders are collected and matched by the validation node based on a price-amount priority. Matched orders are submitted to the network as pending transactions for verification. Considering the delay of transaction settlement on the blockchain, the call auction method is deployed by I-Green to avoid invalid transactions due to belated account update. It is assumed that each node submits at most one order in each round, and outstanding orders are canceled at the end of that round. Therefore, participants have a fresh start to make decisions in next round.
4.4. Simulation of a Private Blockchain
The private blockchain operates similar to a centralized system, where submitted electricity data, orders and transactions are processed by a single entity. This entity maintains accounts, balances and the ledger, which is stored in the form of chained blocks. Instead of setting a certain time interval between blocks, creation of blocks is simulated in an event-driven manner. All the data broadcast to the blockchain network, including electricity generation and consumption, orders, and transactions, are firstly added into the pending pool. Only if all involved nodes complete their actions, the consensus process will start. The validation nodes verify data in the pending pool and create a new block accordingly. This block generation scheme is also employed in the simulation of other types of blockchains in the following.
4.5. Simulation of Proof of Generation
The number of verification candidates of PoG is set as 10. According to the record of generation data submitted in the last round, top 10 prosumer nodes with highest generation become candidates, and a verifier is randomly selected among them. Right after the initiation of the system, before prosumer nodes submitting generation data, there is not any generation record. To bootstrap the system, it is assumed that the community committee conducts the first round of verification. An alternative method is randomly selecting a verifier from all registered prosumer nodes.
4.6. Simulation of Proof of Work
Under the PoW protocol, miners adjust their investment in mining machines and the utilization rate, to maximize their profits from mining. The revenue of mining is determined by block reward and coin price. The cost, on the other hand, includes electricity charge and opportunity cost of retaining the machines. The probability of successfully mining a block depends on the competition among miners, as in Equation (5). The game among miners, together with fluctuating prices of electricity and coin, renders a dynamic mining market, where miners frequently leave and join. Therefore, the total hashing power on the network and its distribution among miners keep changing. Since the hashing power impacts the speed of solving the hash puzzle, the difficulty of hash puzzle is adjusted automatically and periodically to maintain a certain average block creation time. Despite the complex interactions and adjustments in PoW, miners work collectively to maintain the blockchain ledger on the whole.
Without loss of evidence for analysis, an equilibrium mining situation is assumed for the simulation of PoW: during the simulated period, the coin and electricity prices are steady, and the difficulty level, total computational resource and miners’ shares of it are fixed. It is simulated that 10% of nodes in the network are miners, and that their shares of hashing power follow a discrete uniform distribution of . Since it is the proportion of hashing power that determines the probability of winning, the absolute value of hashing power is trivial. Given that all miners in the network are equally connected to communication infrastructures, they receive all transaction requests and start mining at the same time. In simulation, each miner is assigned with a certain number of threads, which equals to its shares of computational resource. The hash puzzle is solved independently by all threads through trial-and-error. Each miner’s mining time is measured by the least number of trials conducted by all threads belonging to that miner. The fastest miner gets the chance to encapsulate pending transactions into a new block and get the block reward. The block reward is set as 50 igreencoins.
4.7. Simulation of Proof of Stake
By PoS protocols, nodes put their coins at stake to compete for the right of creating a new block. In most PoS protocols, “coin age” instead of amount of staked coins is used as the criterion for verifier selection in the consensus process. Coin age is the number of coins multiplied by duration that coins have been held by the node, as in Equation (6). The chance of being selected to create a new block is proportional to the coin age of staked coins. Once a node is chosen and a new block is successfully created by it, the coin age of its staked coins is reset to zero. The “coin age” method, therefore, avoids the situation that the wealthiest nodes in the network always win. The block reward of simulated PoS is set as 50 igreencoins, same as that of PoW.
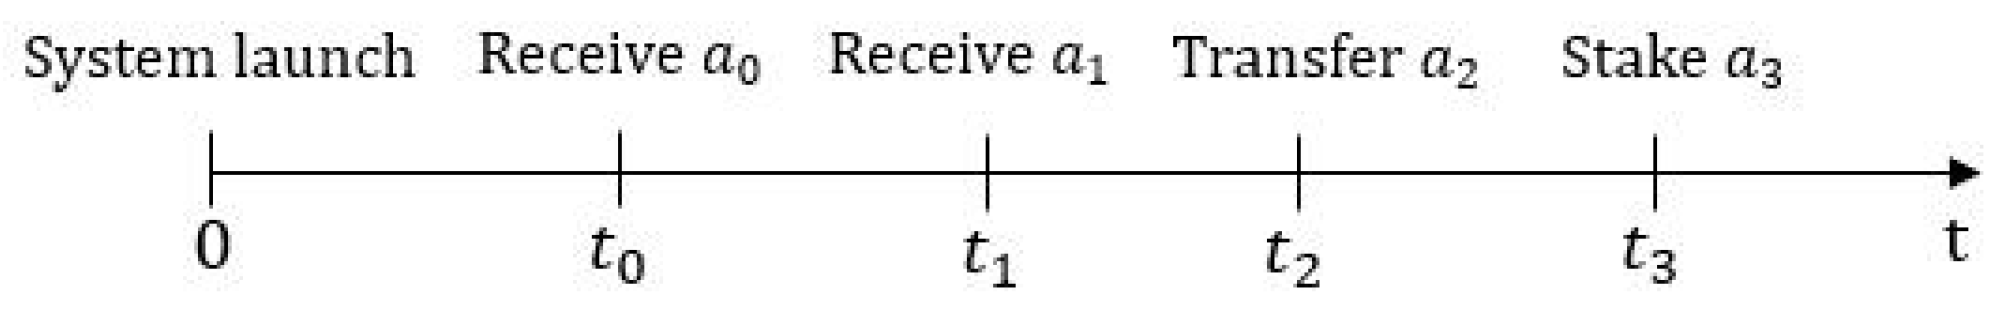
Coins attained at different time have different coin ages. In practice, most PoS blockchains require nodes to specify which coins they would like to put for stake. Without loss of the principle of PoS, average coin age is utilized in the simulation. The average coin age of each node’s all coins is calculated and updated along with their activities. In this way, nodes only need to decide the amount of coins for stake, instead of specifying several certain coins. At any time t, the average coin age of a node = t − average reception time. The calculation of average coin age is explained in the case of node A, shown in Figure 4.
- Receiving coins for the first timeNode A receives coins at time . At any time t (), average coin age = , and total coin age = .
- Receiving additional coinsNode A receives coins at time . At any time t (), average reception time , average coin age = , and total coin age = . It can be examined that at time , total coin age = , since newly received coins do not immediately contribute to total coin age.
- Transferring out coinsNode A transfers coins out at time . The amount of coins is deducted correspondingly, while the average coin age remains the same. At any time t (), average coin age = , and total coin age = . The coin age of is lost due to transferring coins to others.
- Putting stakeNode A put coins at stake at time . Coin age of staked coins = , which expires if node A is selected as the verifier. Then the remaining total coin age = . Since the amount of coins owned by node A is unaffected, average coin age is updated as , and average reception time = average coin age = . This is equivalent to moving the average reception time from forward to , with the amount of coin age surrendered by each coin for the stake. At any time t (), average coin age = , and total coin age = .
It is assumed that nodes with more than 100 coins would like to put stake and run for the verifier. The minimum and maximum number of staked coins are set as 10 and 100. It is simulated that each qualified node puts stake with a random number of coins between 10 and 100, and less than one-tenths of its total coins amount. Nodes with staked coins become verification candidates, and the creator of next block is selected among them. The probability of being selected is proportional to staked coin age, as in Equation (7).
Similar to the case of PoG, at the launch time of the I-Green system, nodes do not have any coins to put stakes. The community committee initiates and bootstraps I-Green system. It conducts the first round of verification and performs as a backup verifier—when there is not any other nodes putting stakes, the committee node processes transactions. The committee node is assigned with pseudo-coins for putting stakes in the simulation.
5. Simulation Results and Analysis
5.1. Market Activities
In this section, simulated market activities, including asking, biding, and transactions under various intensities of the social norm and different consensus protocols are analyzed. Market liquidity and effectiveness are also evaluated.
5.1.1. Effects of the Green Ratio Scheme
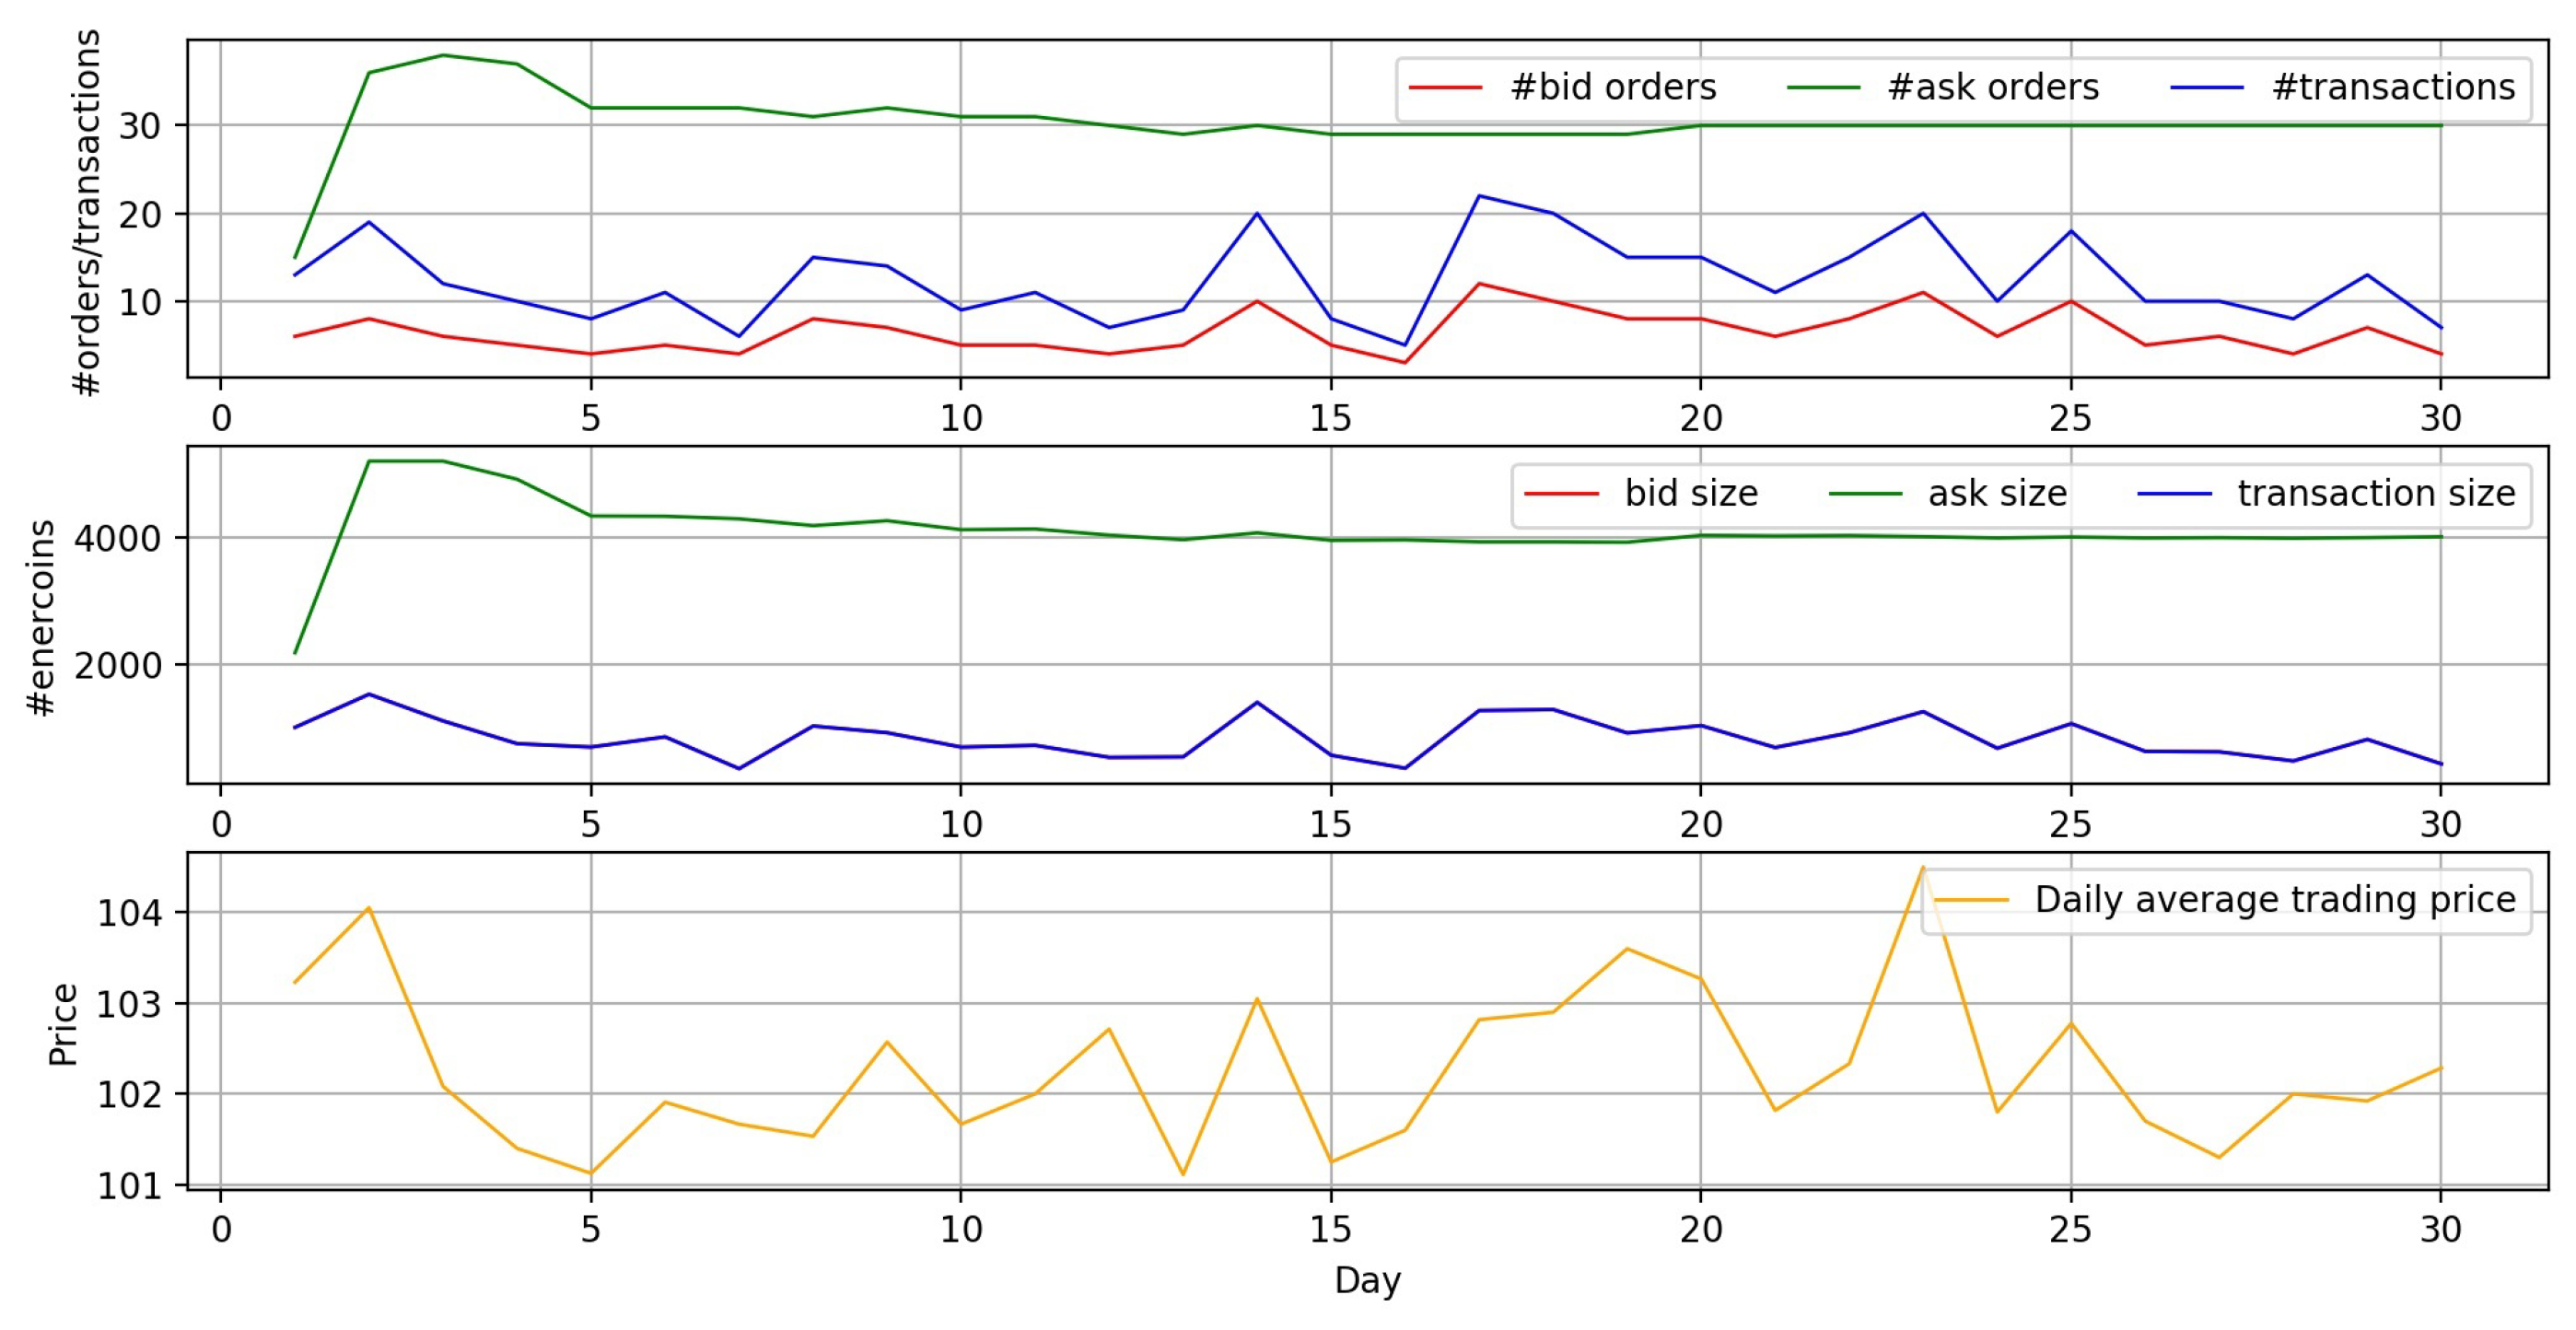
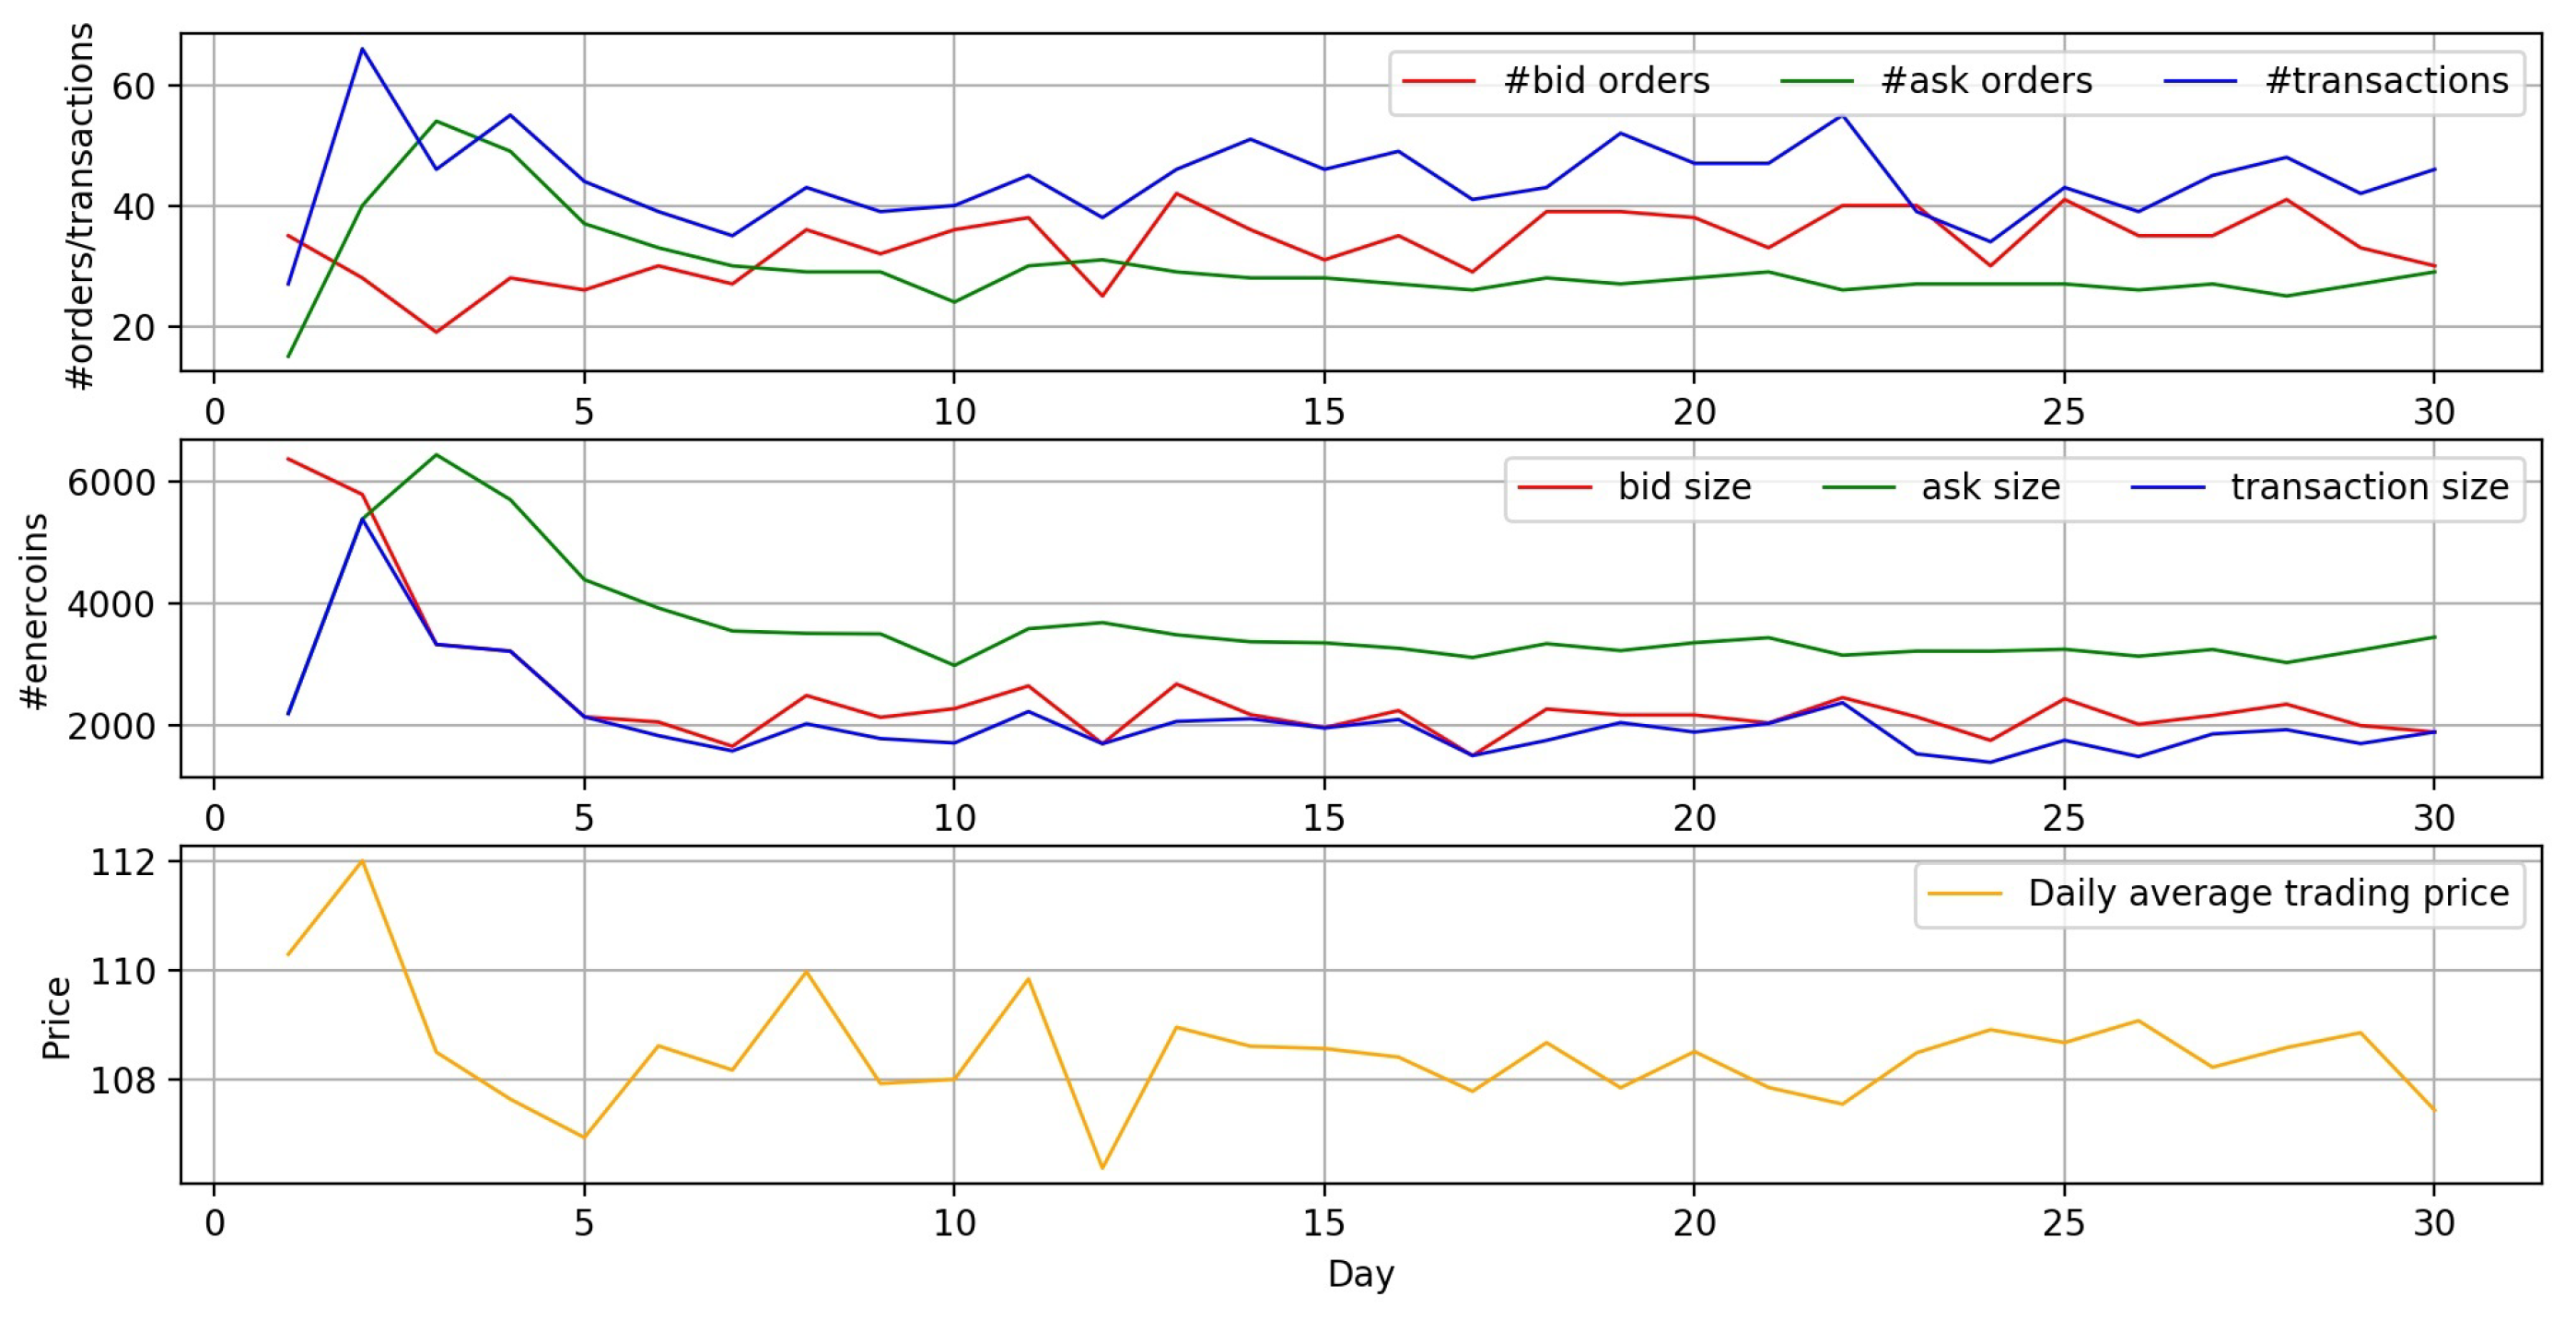
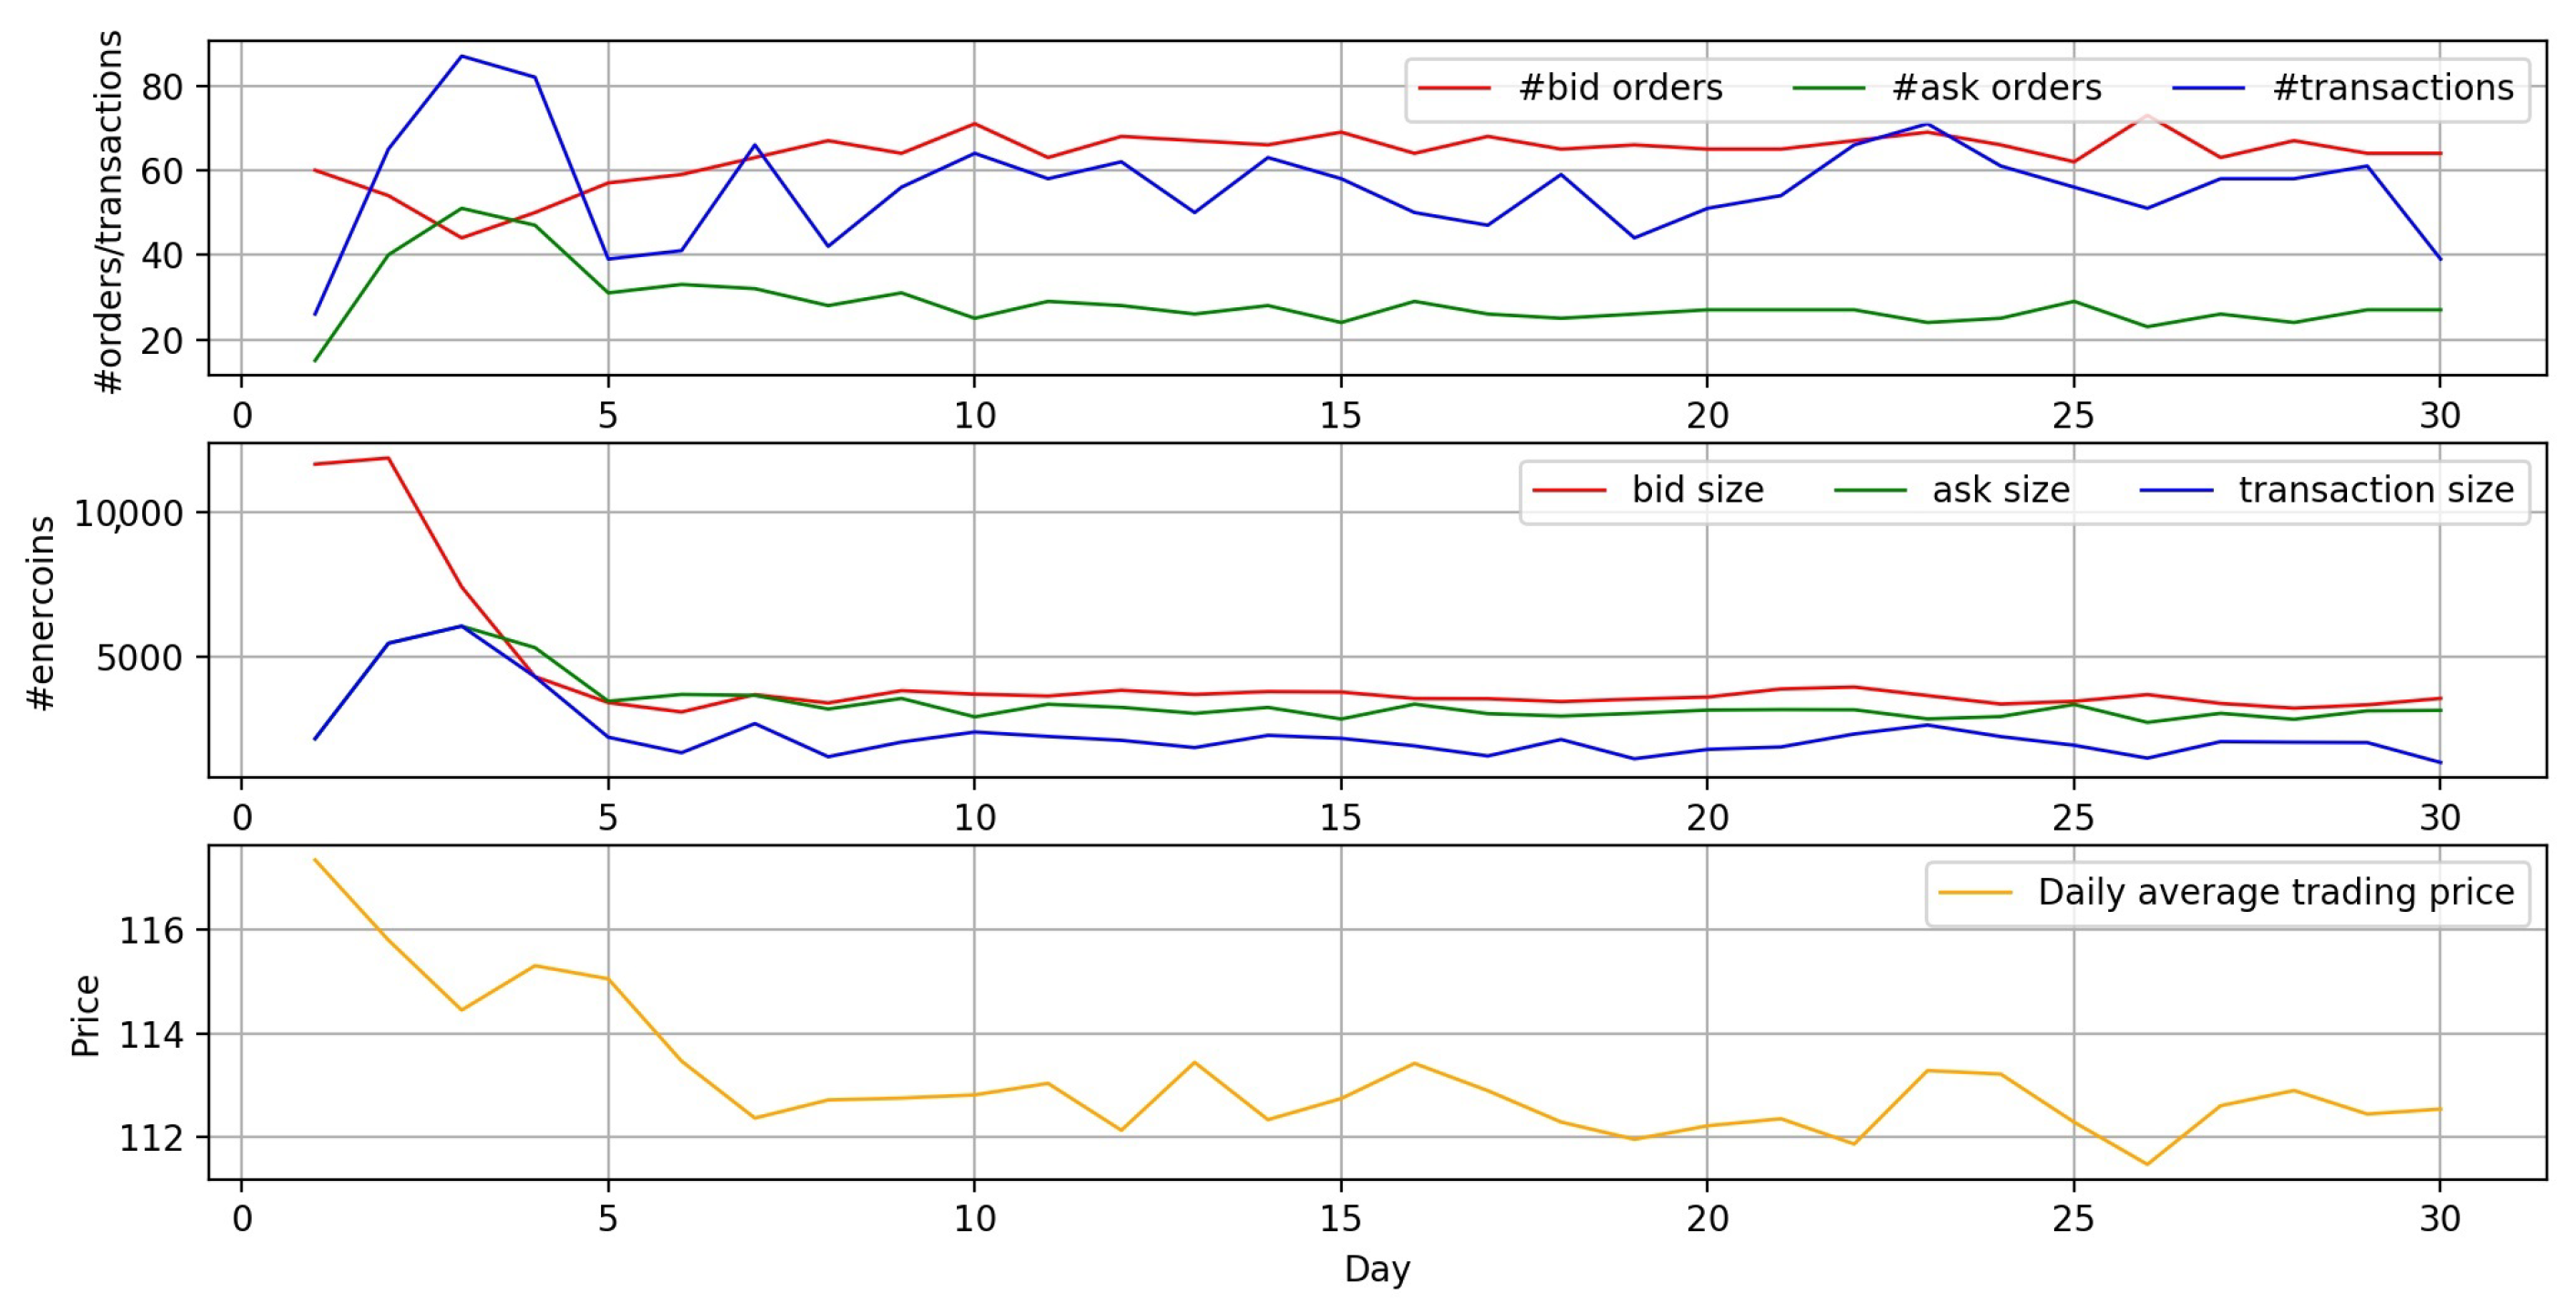
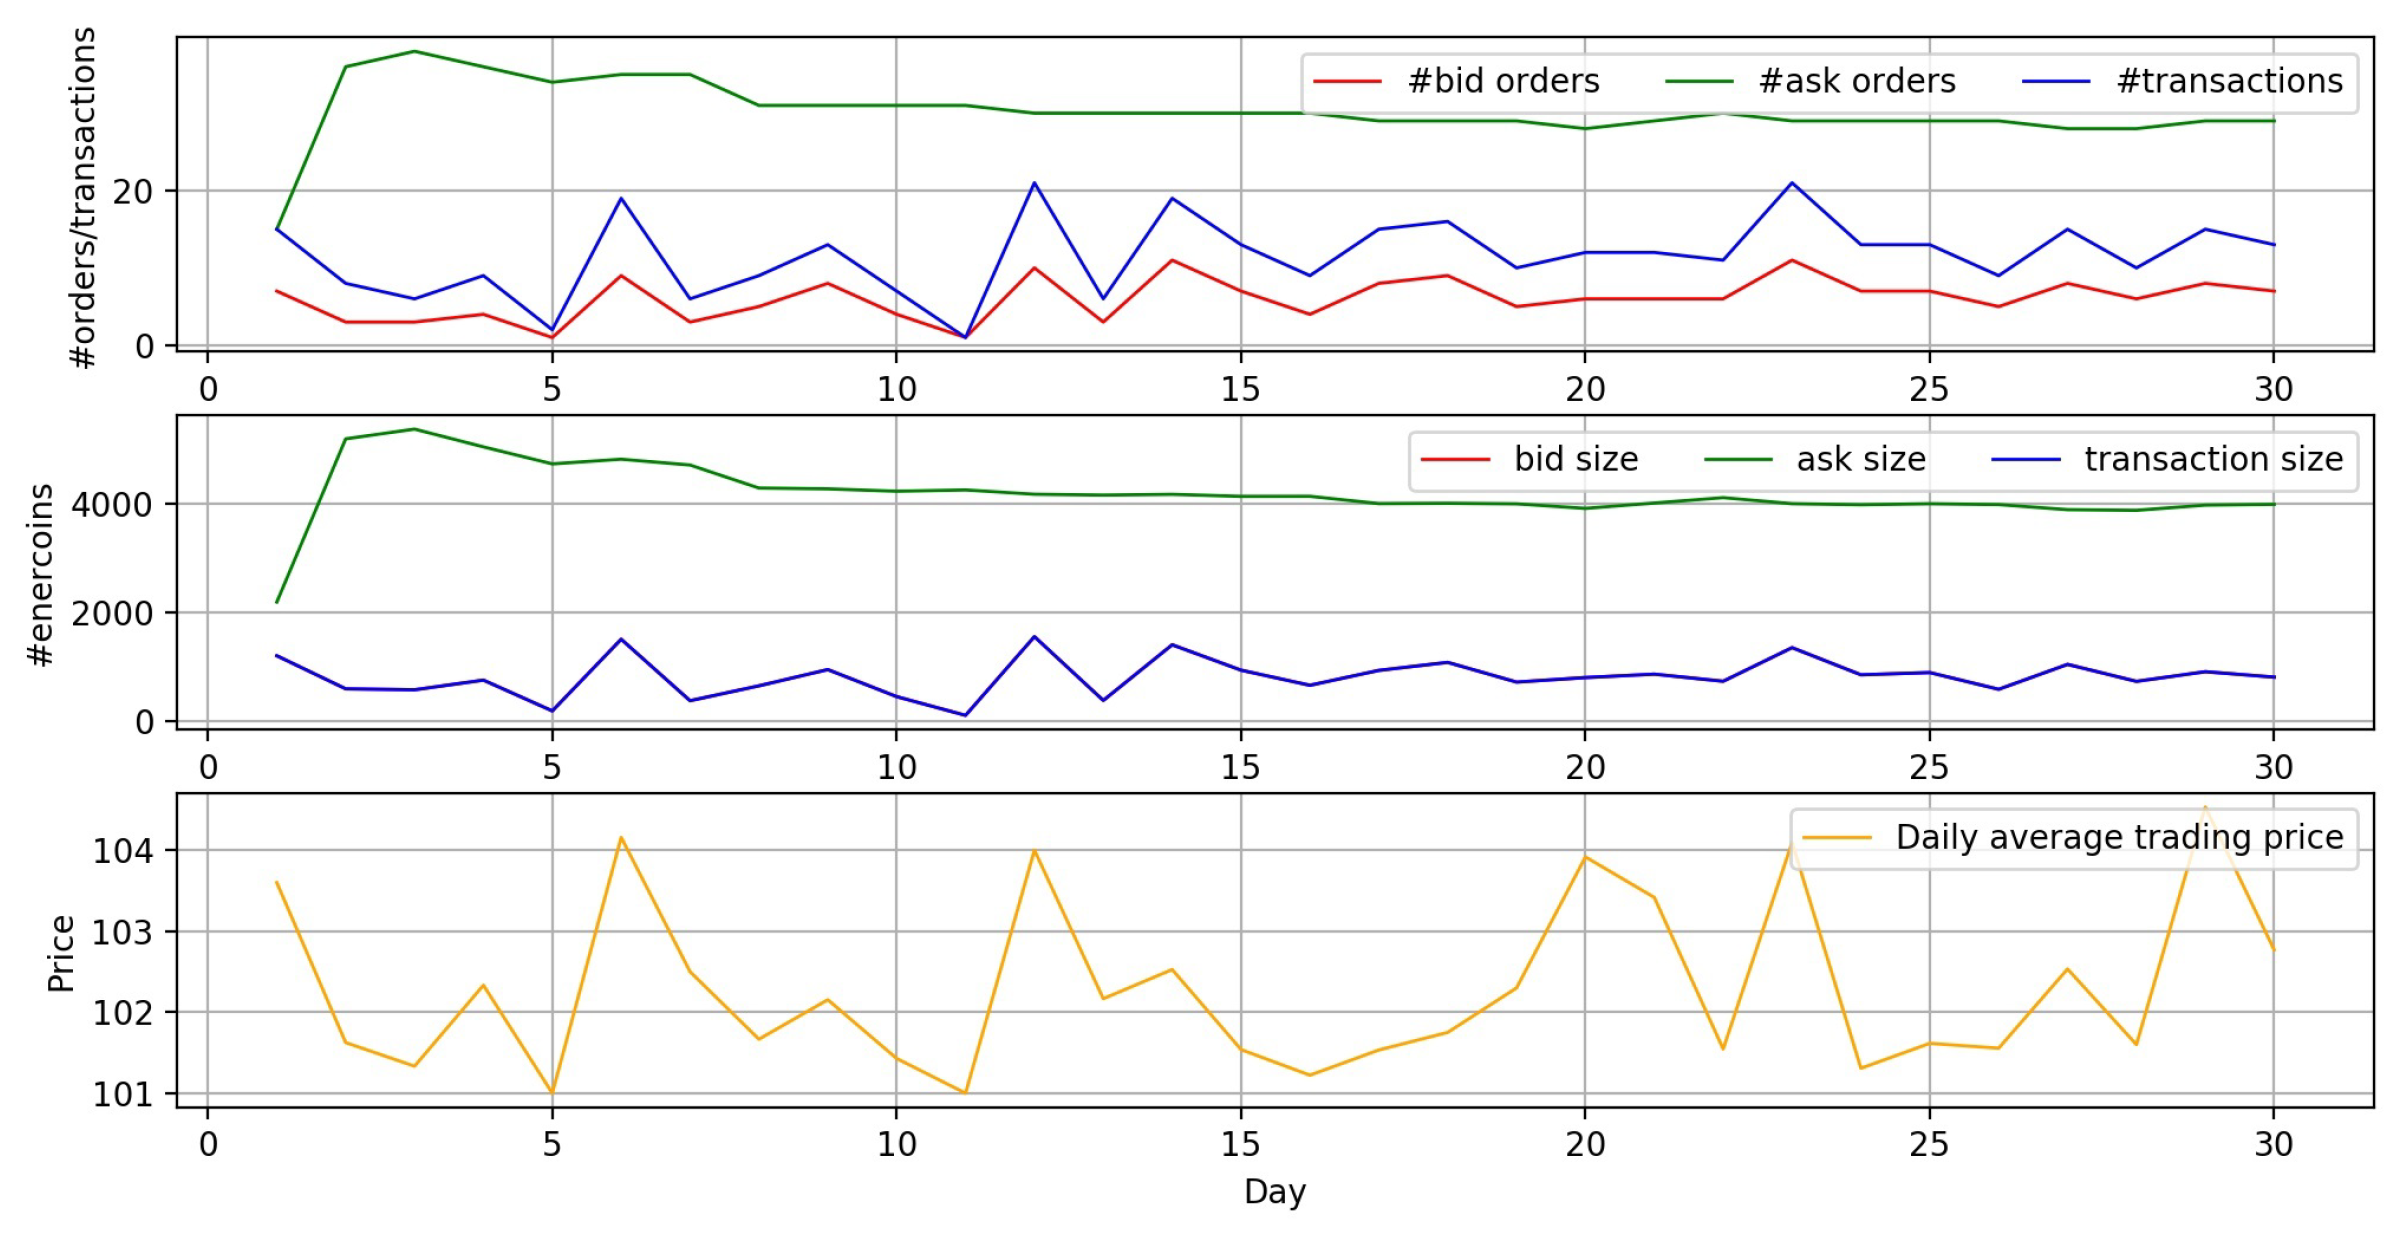
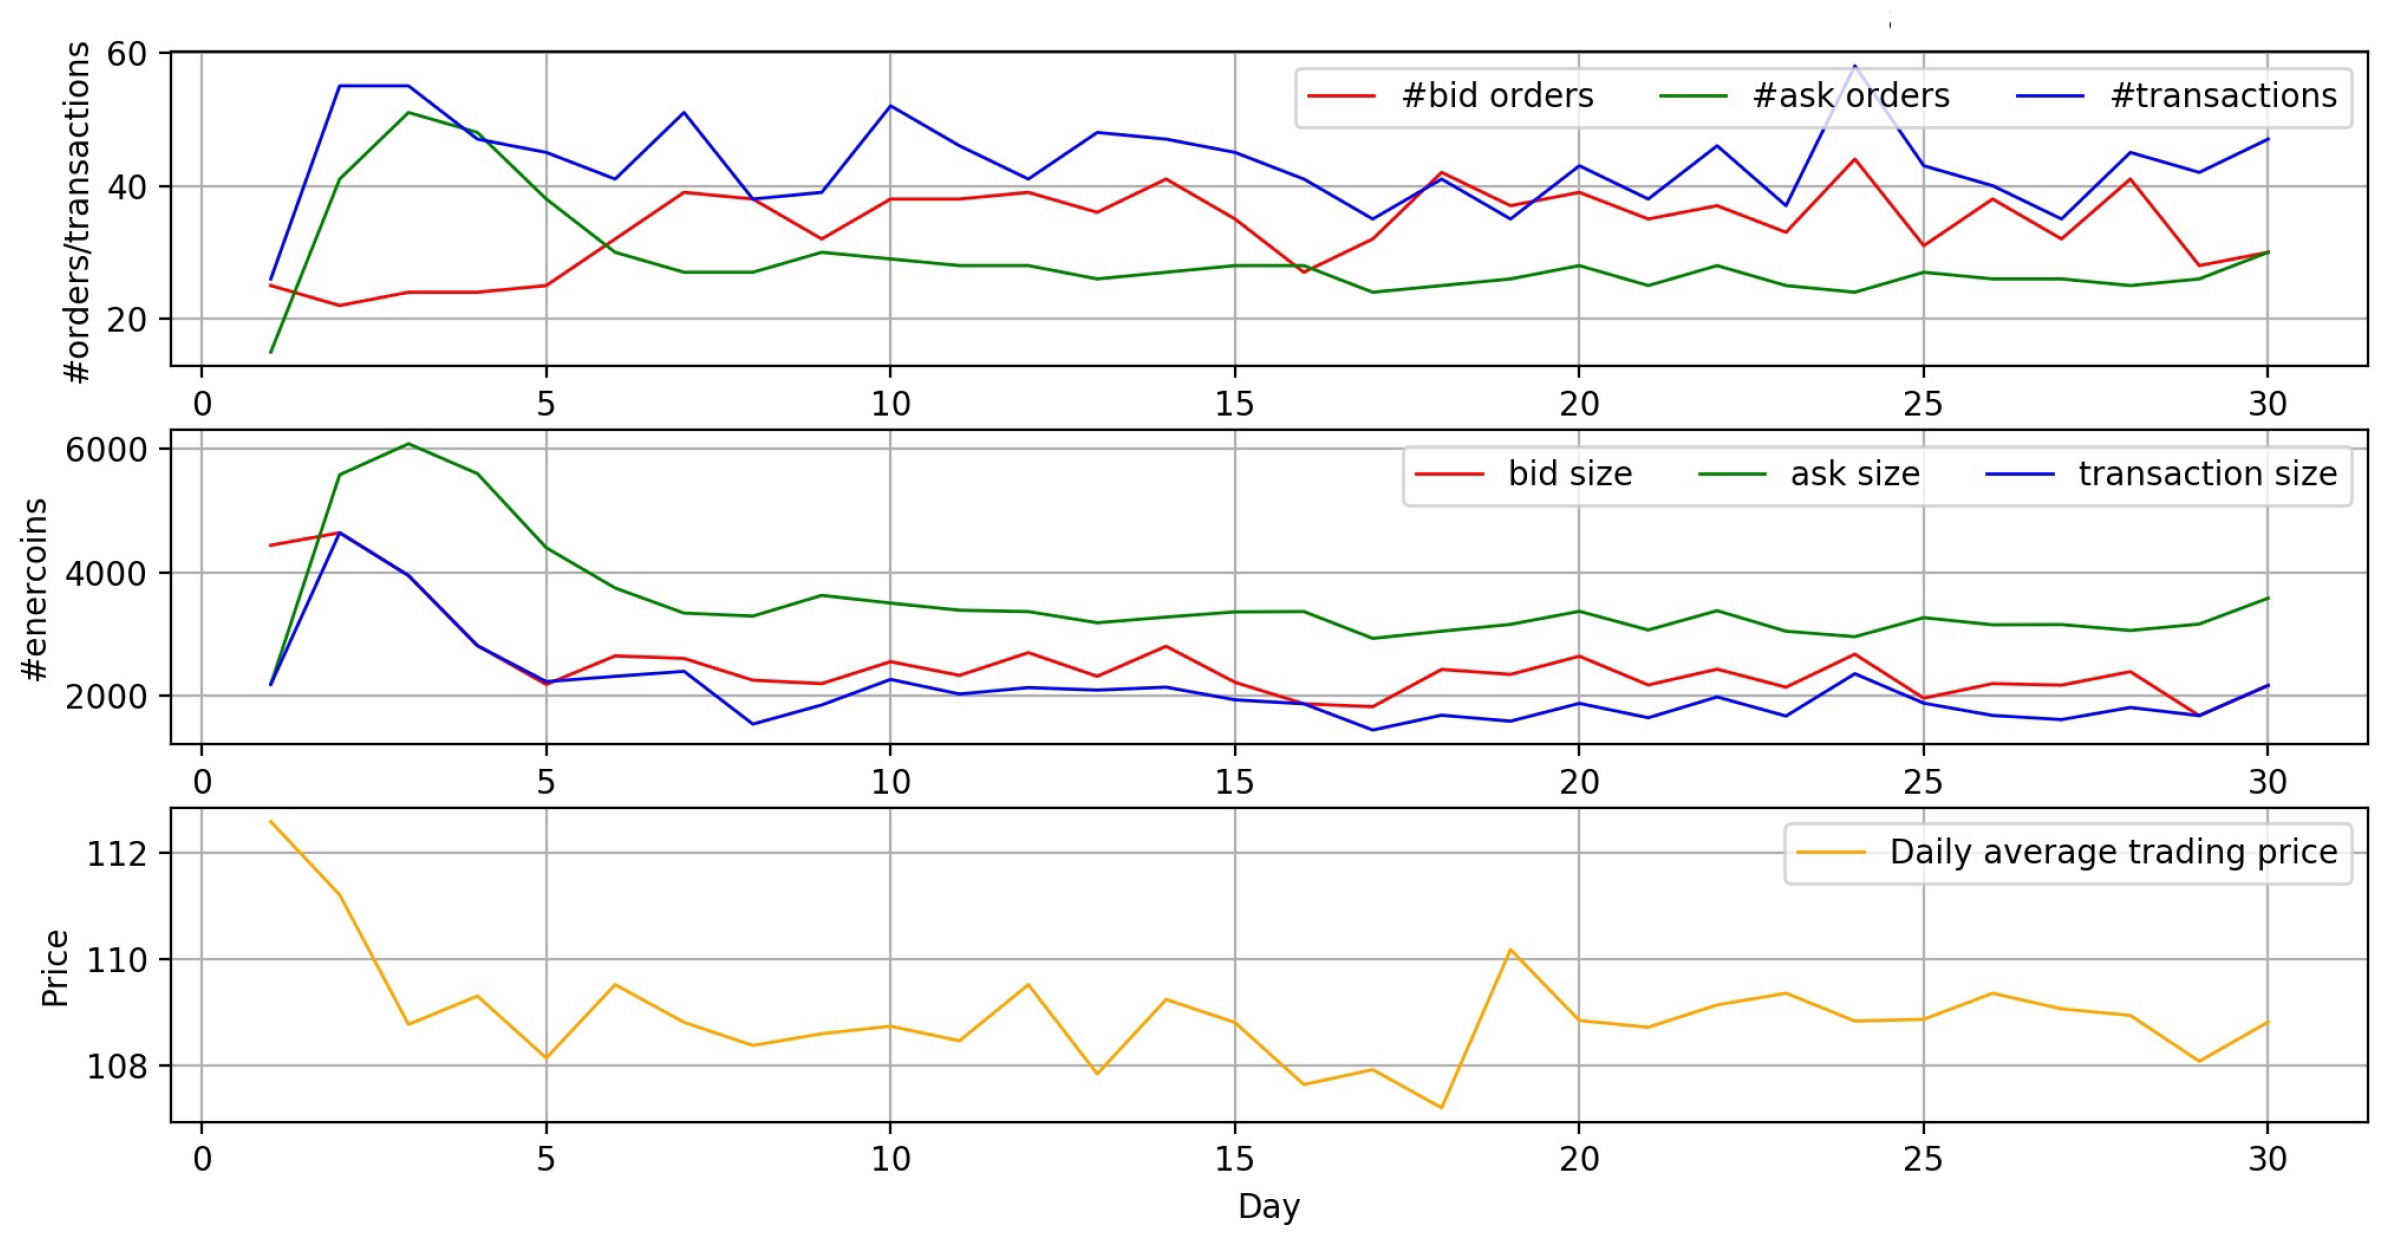
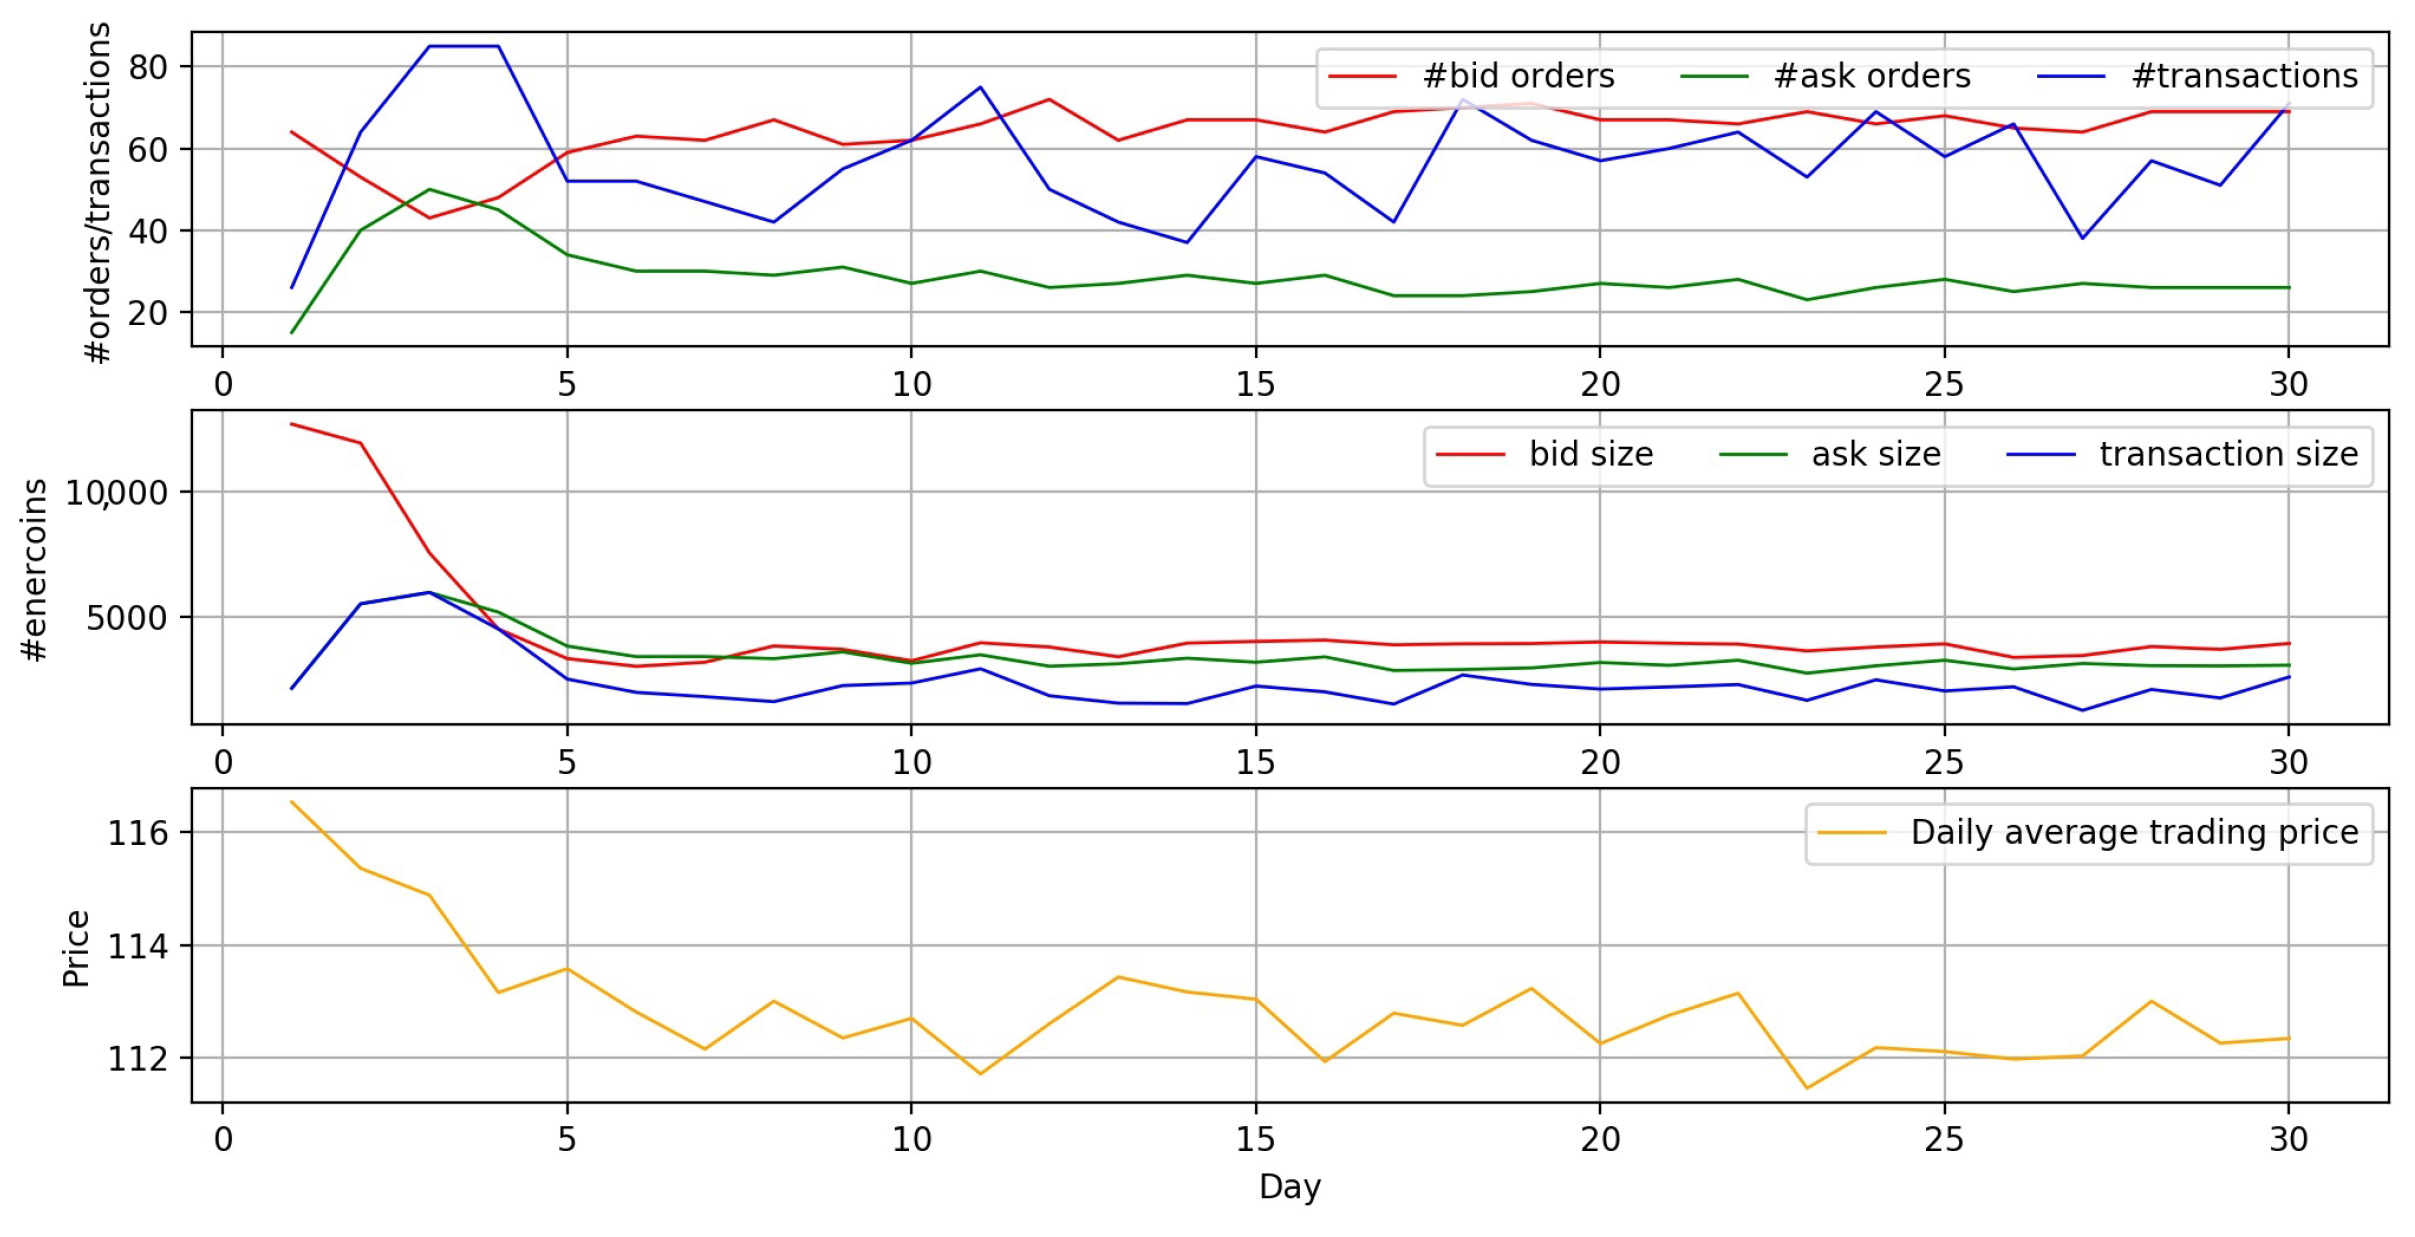
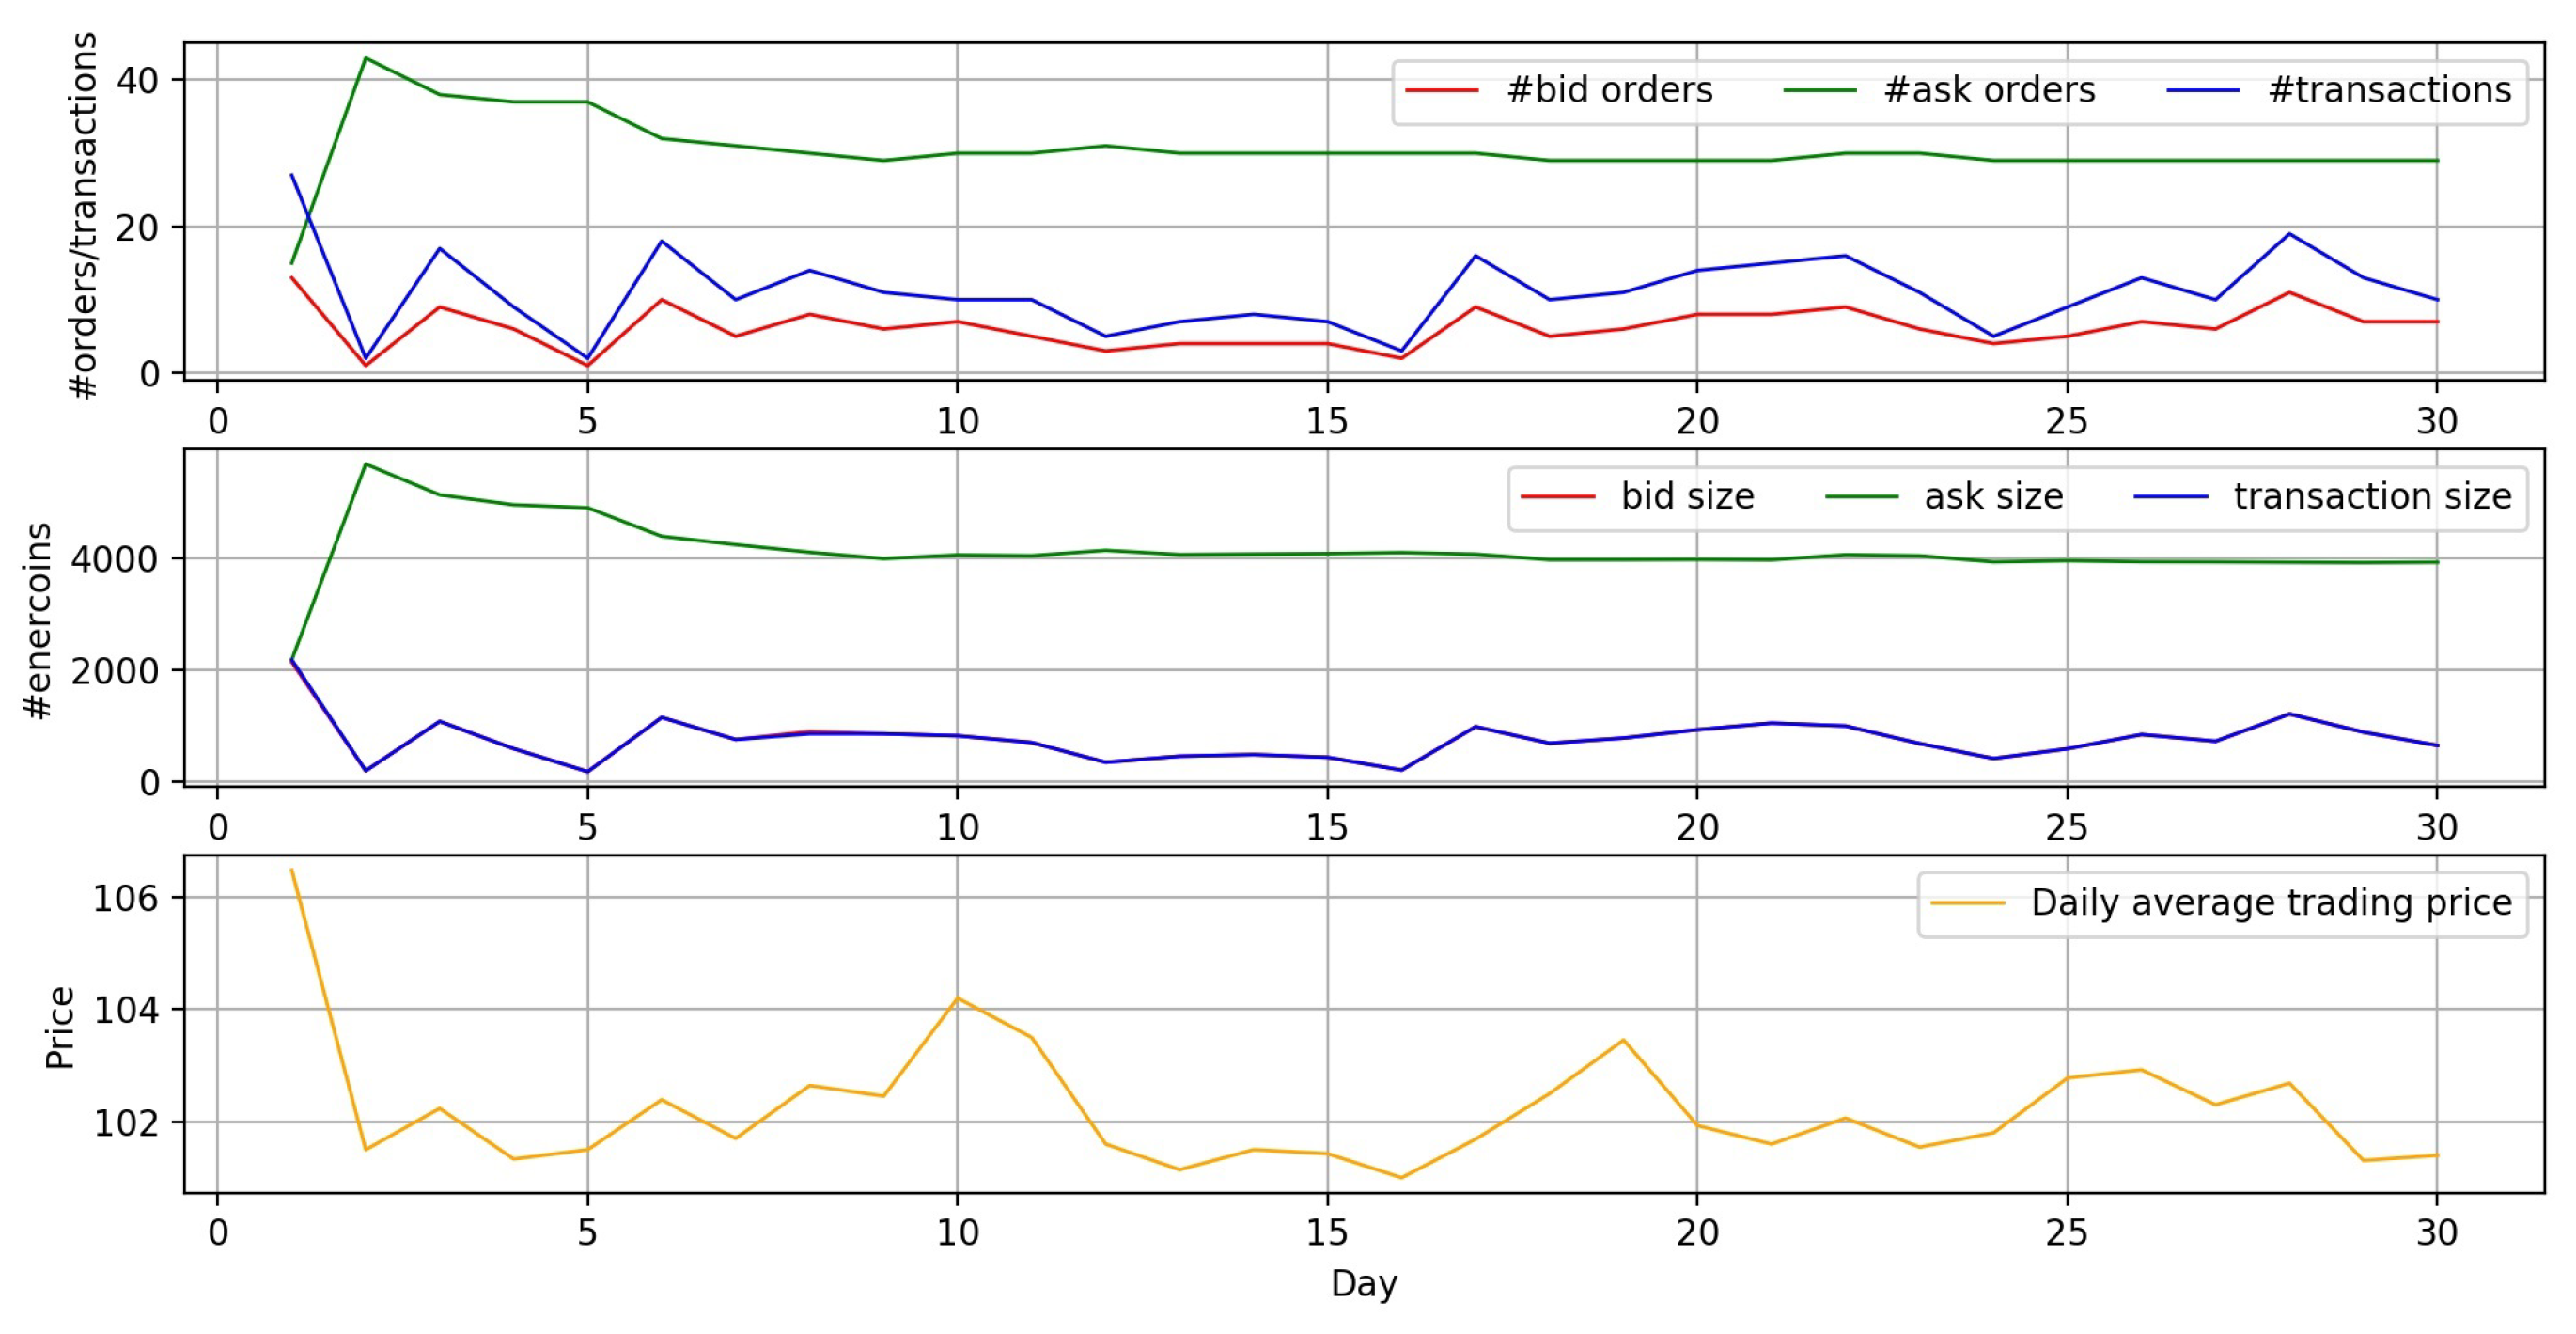
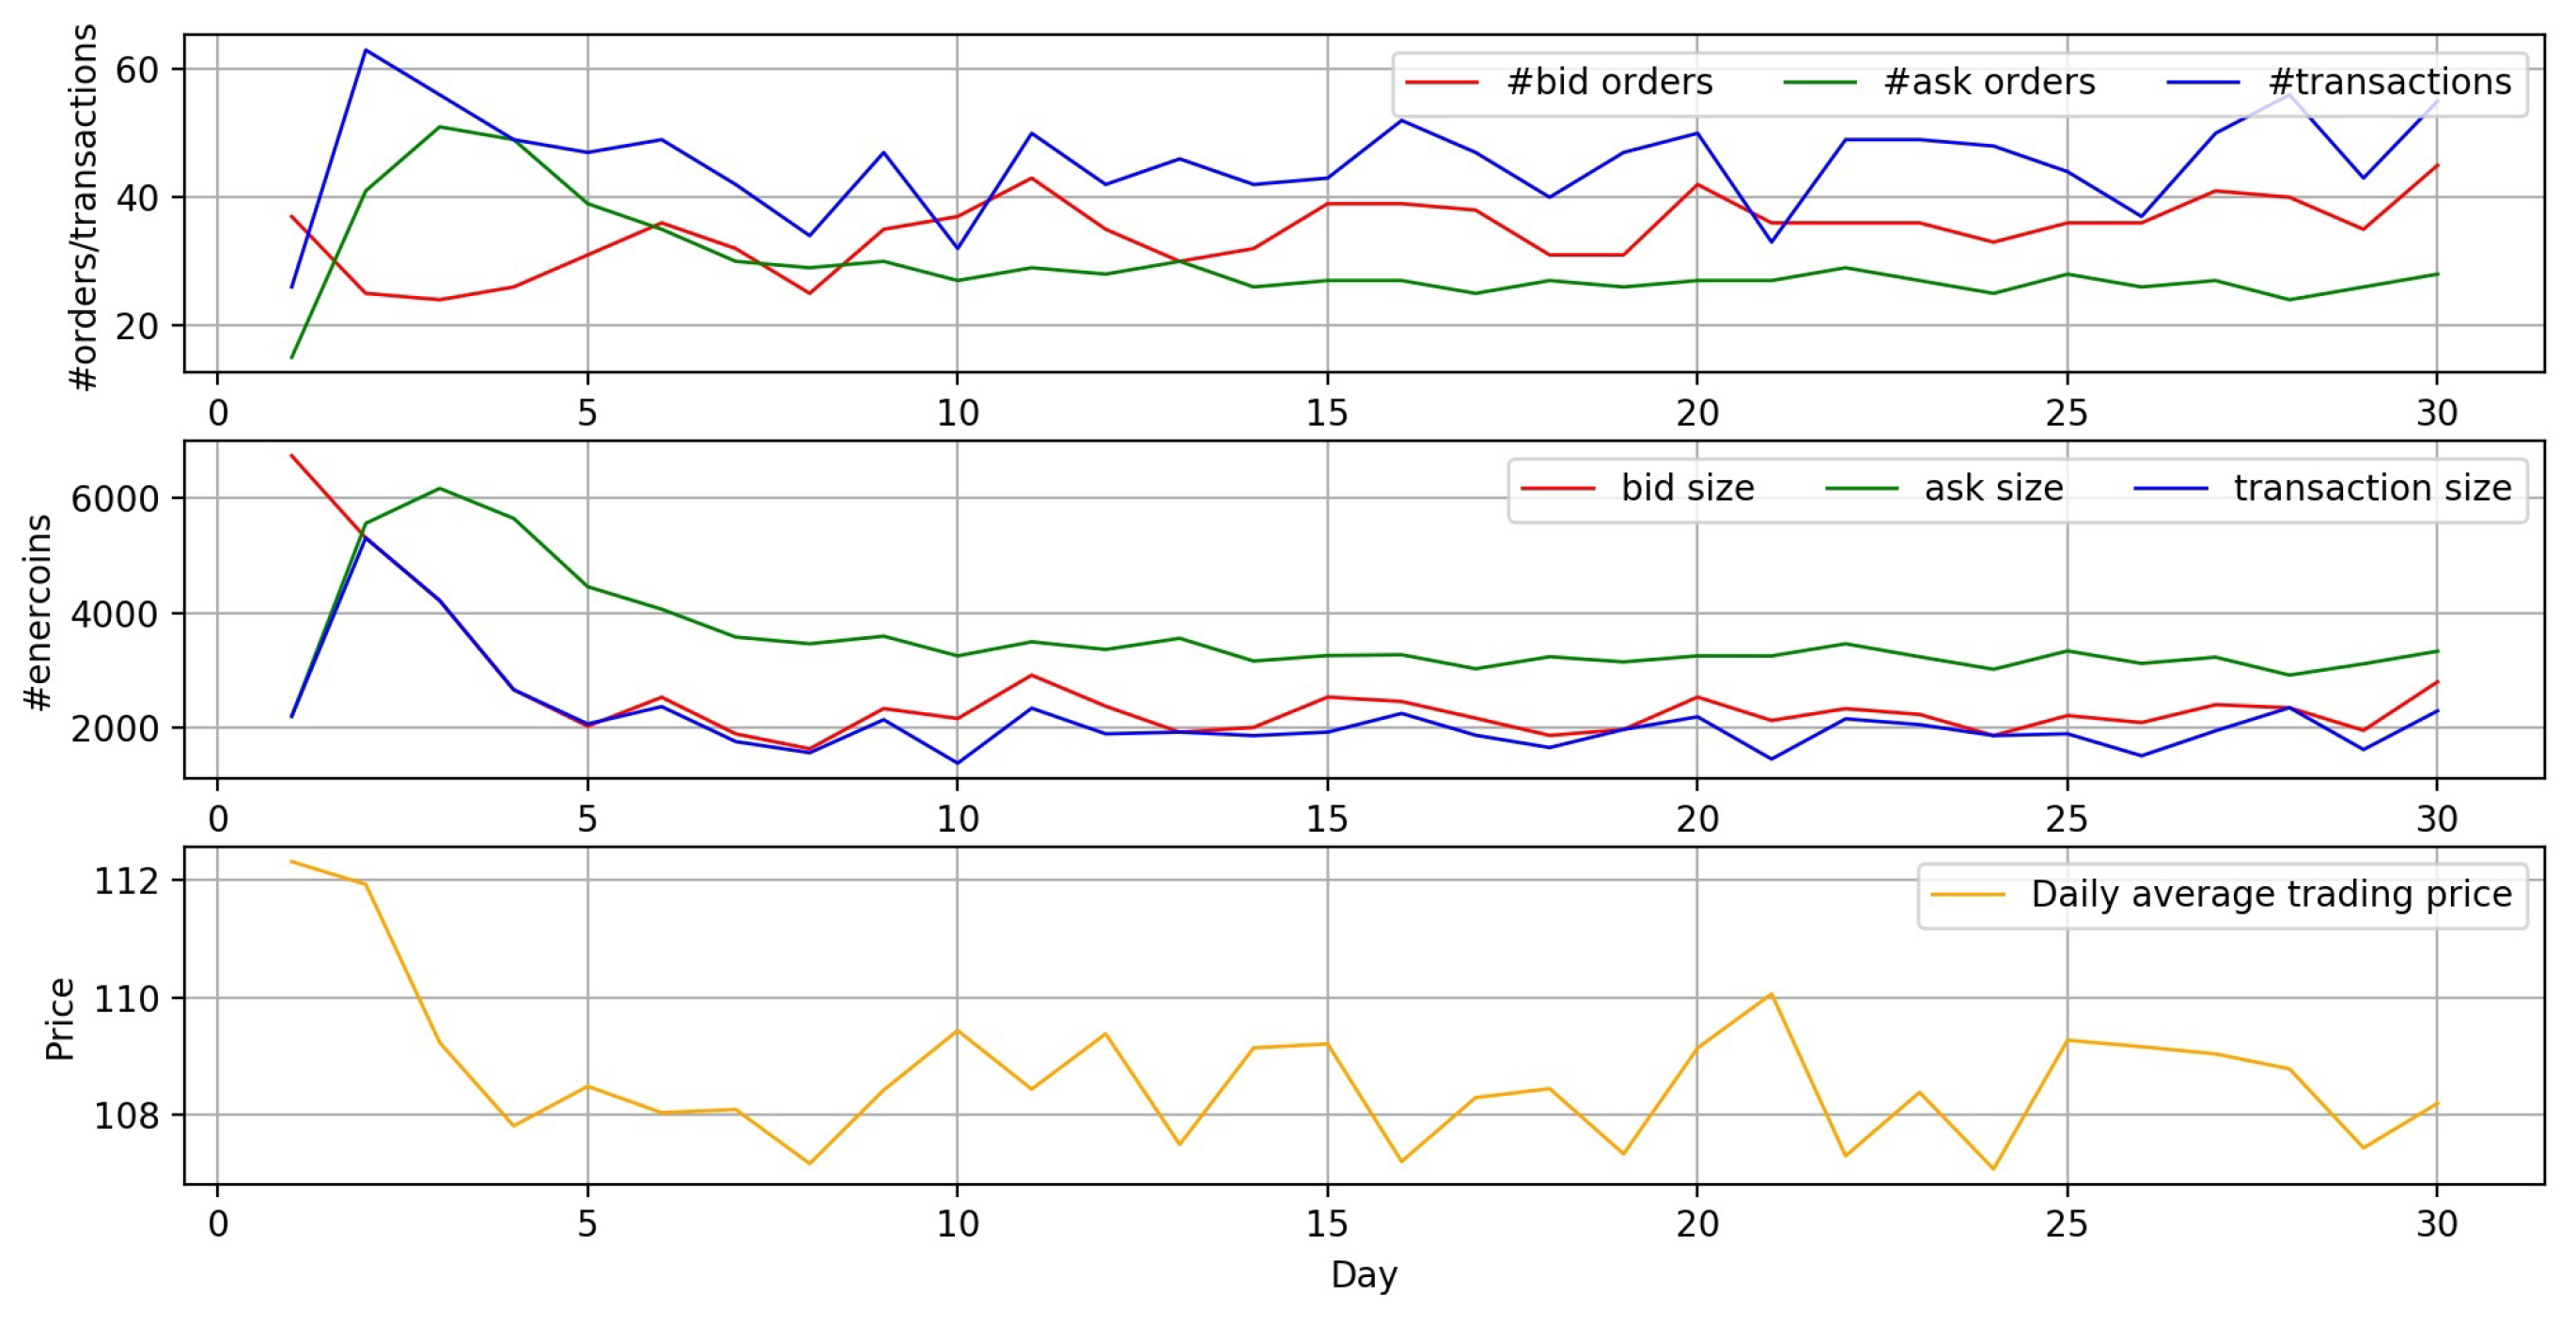
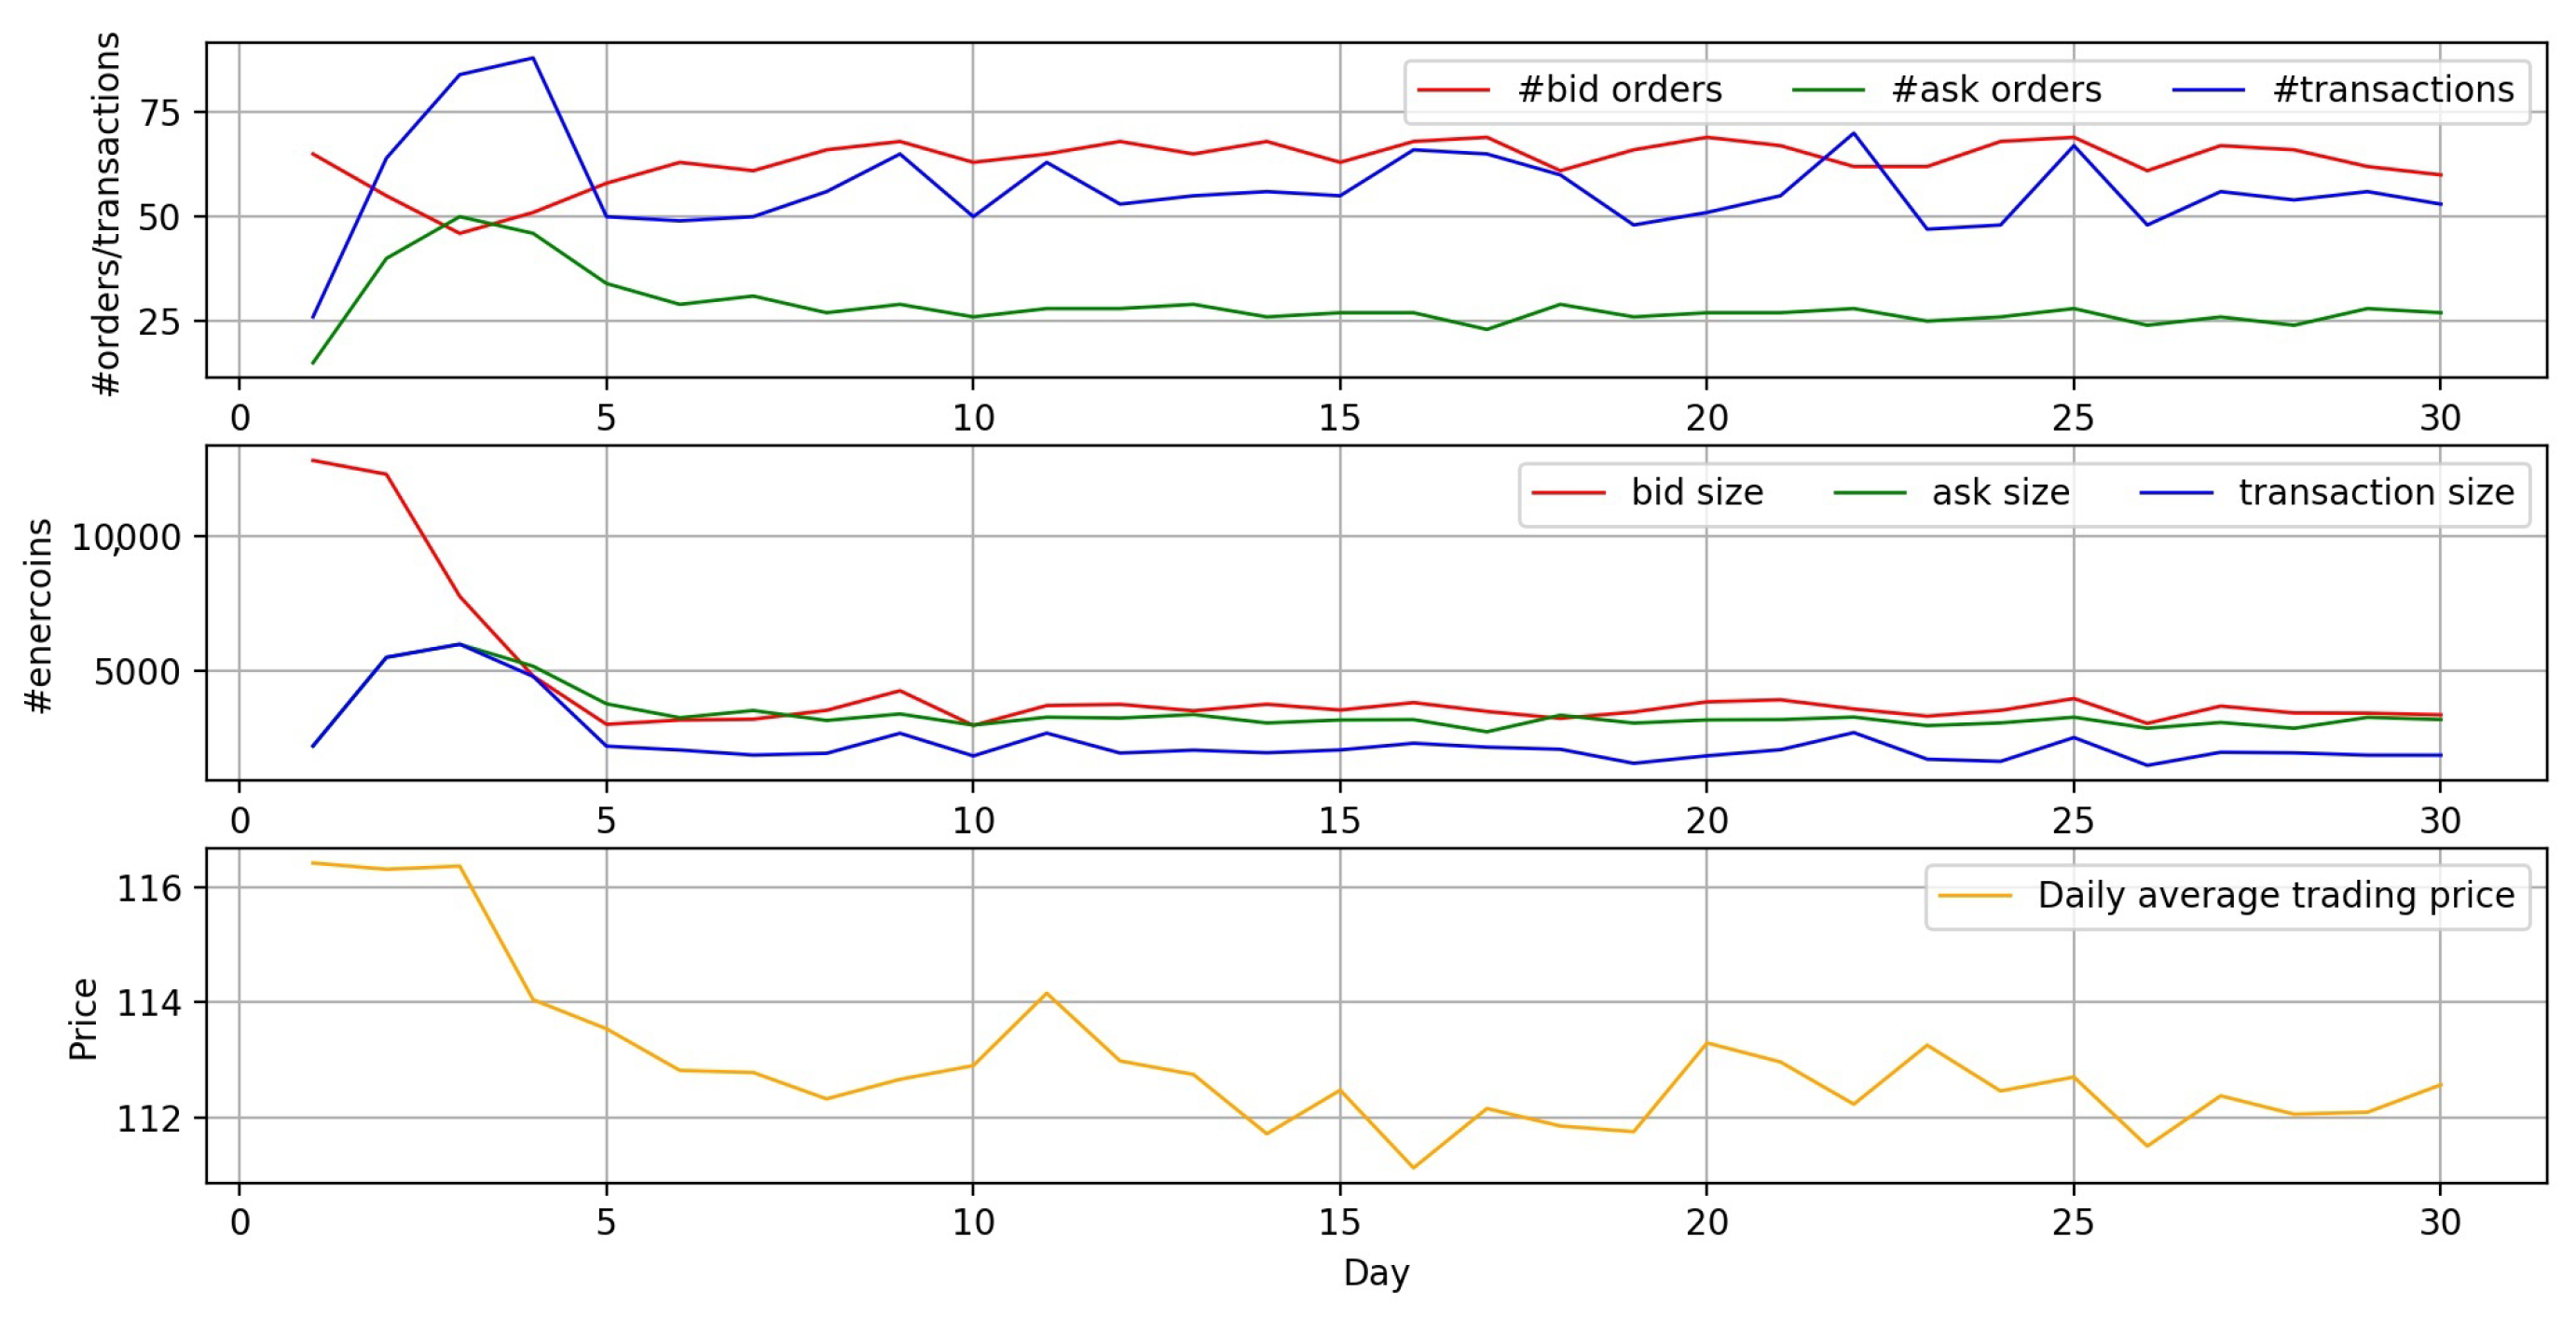
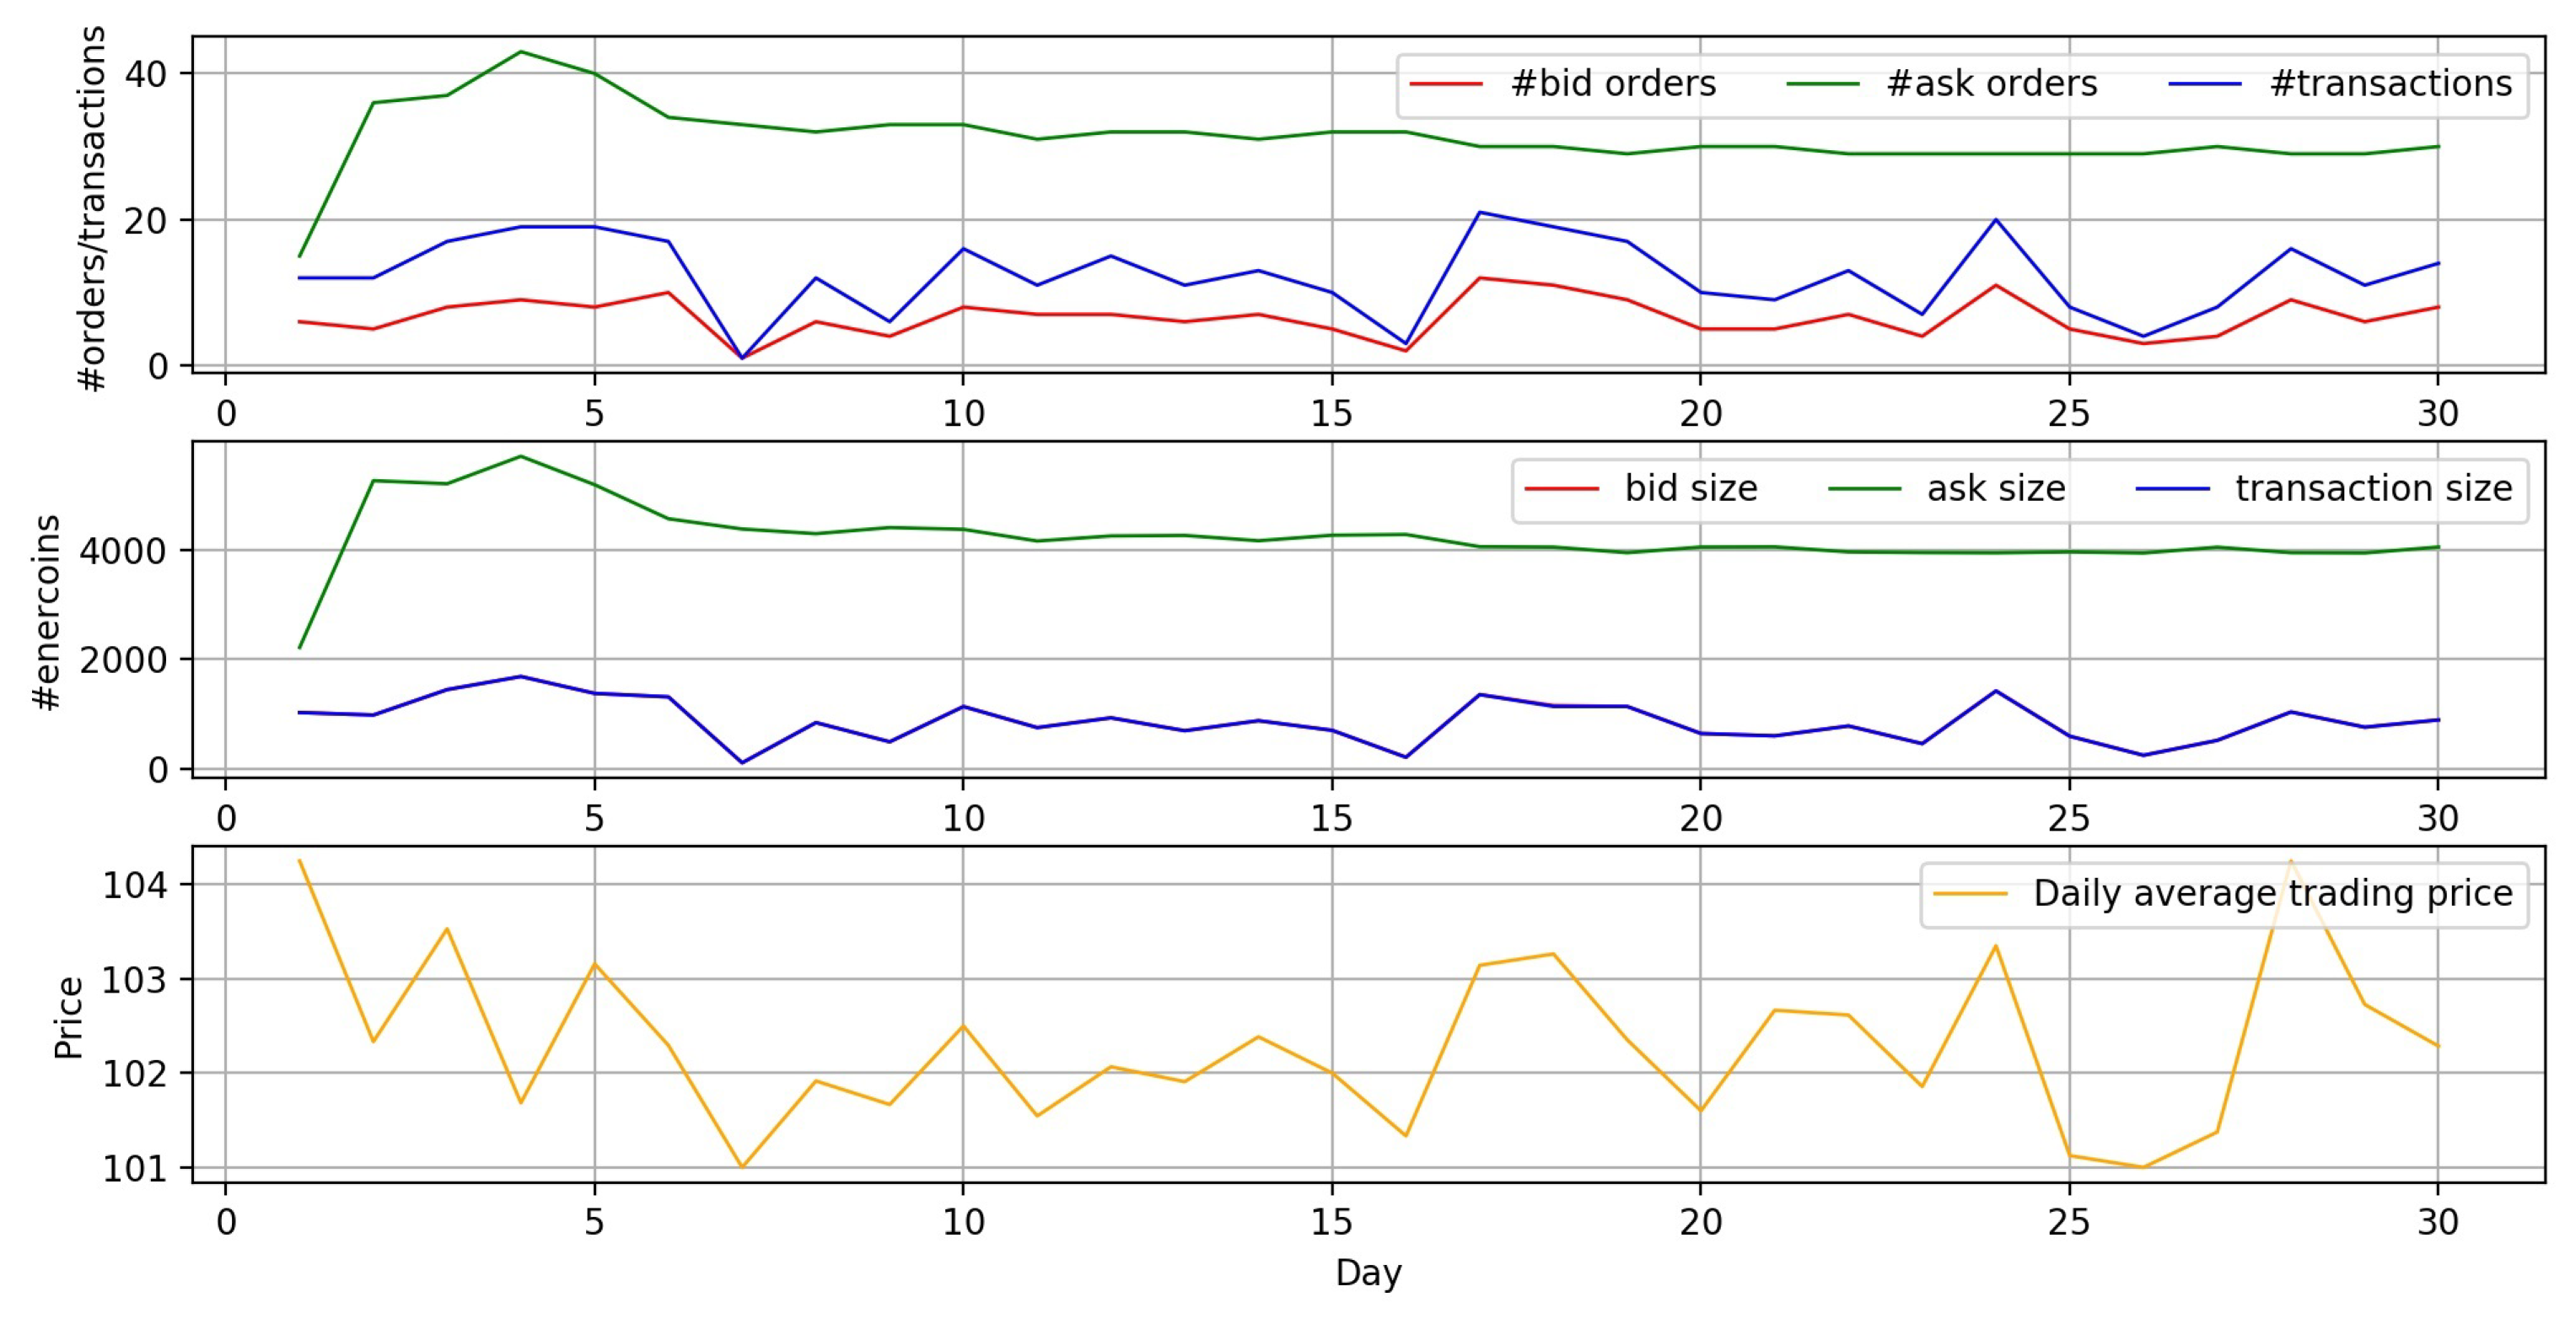
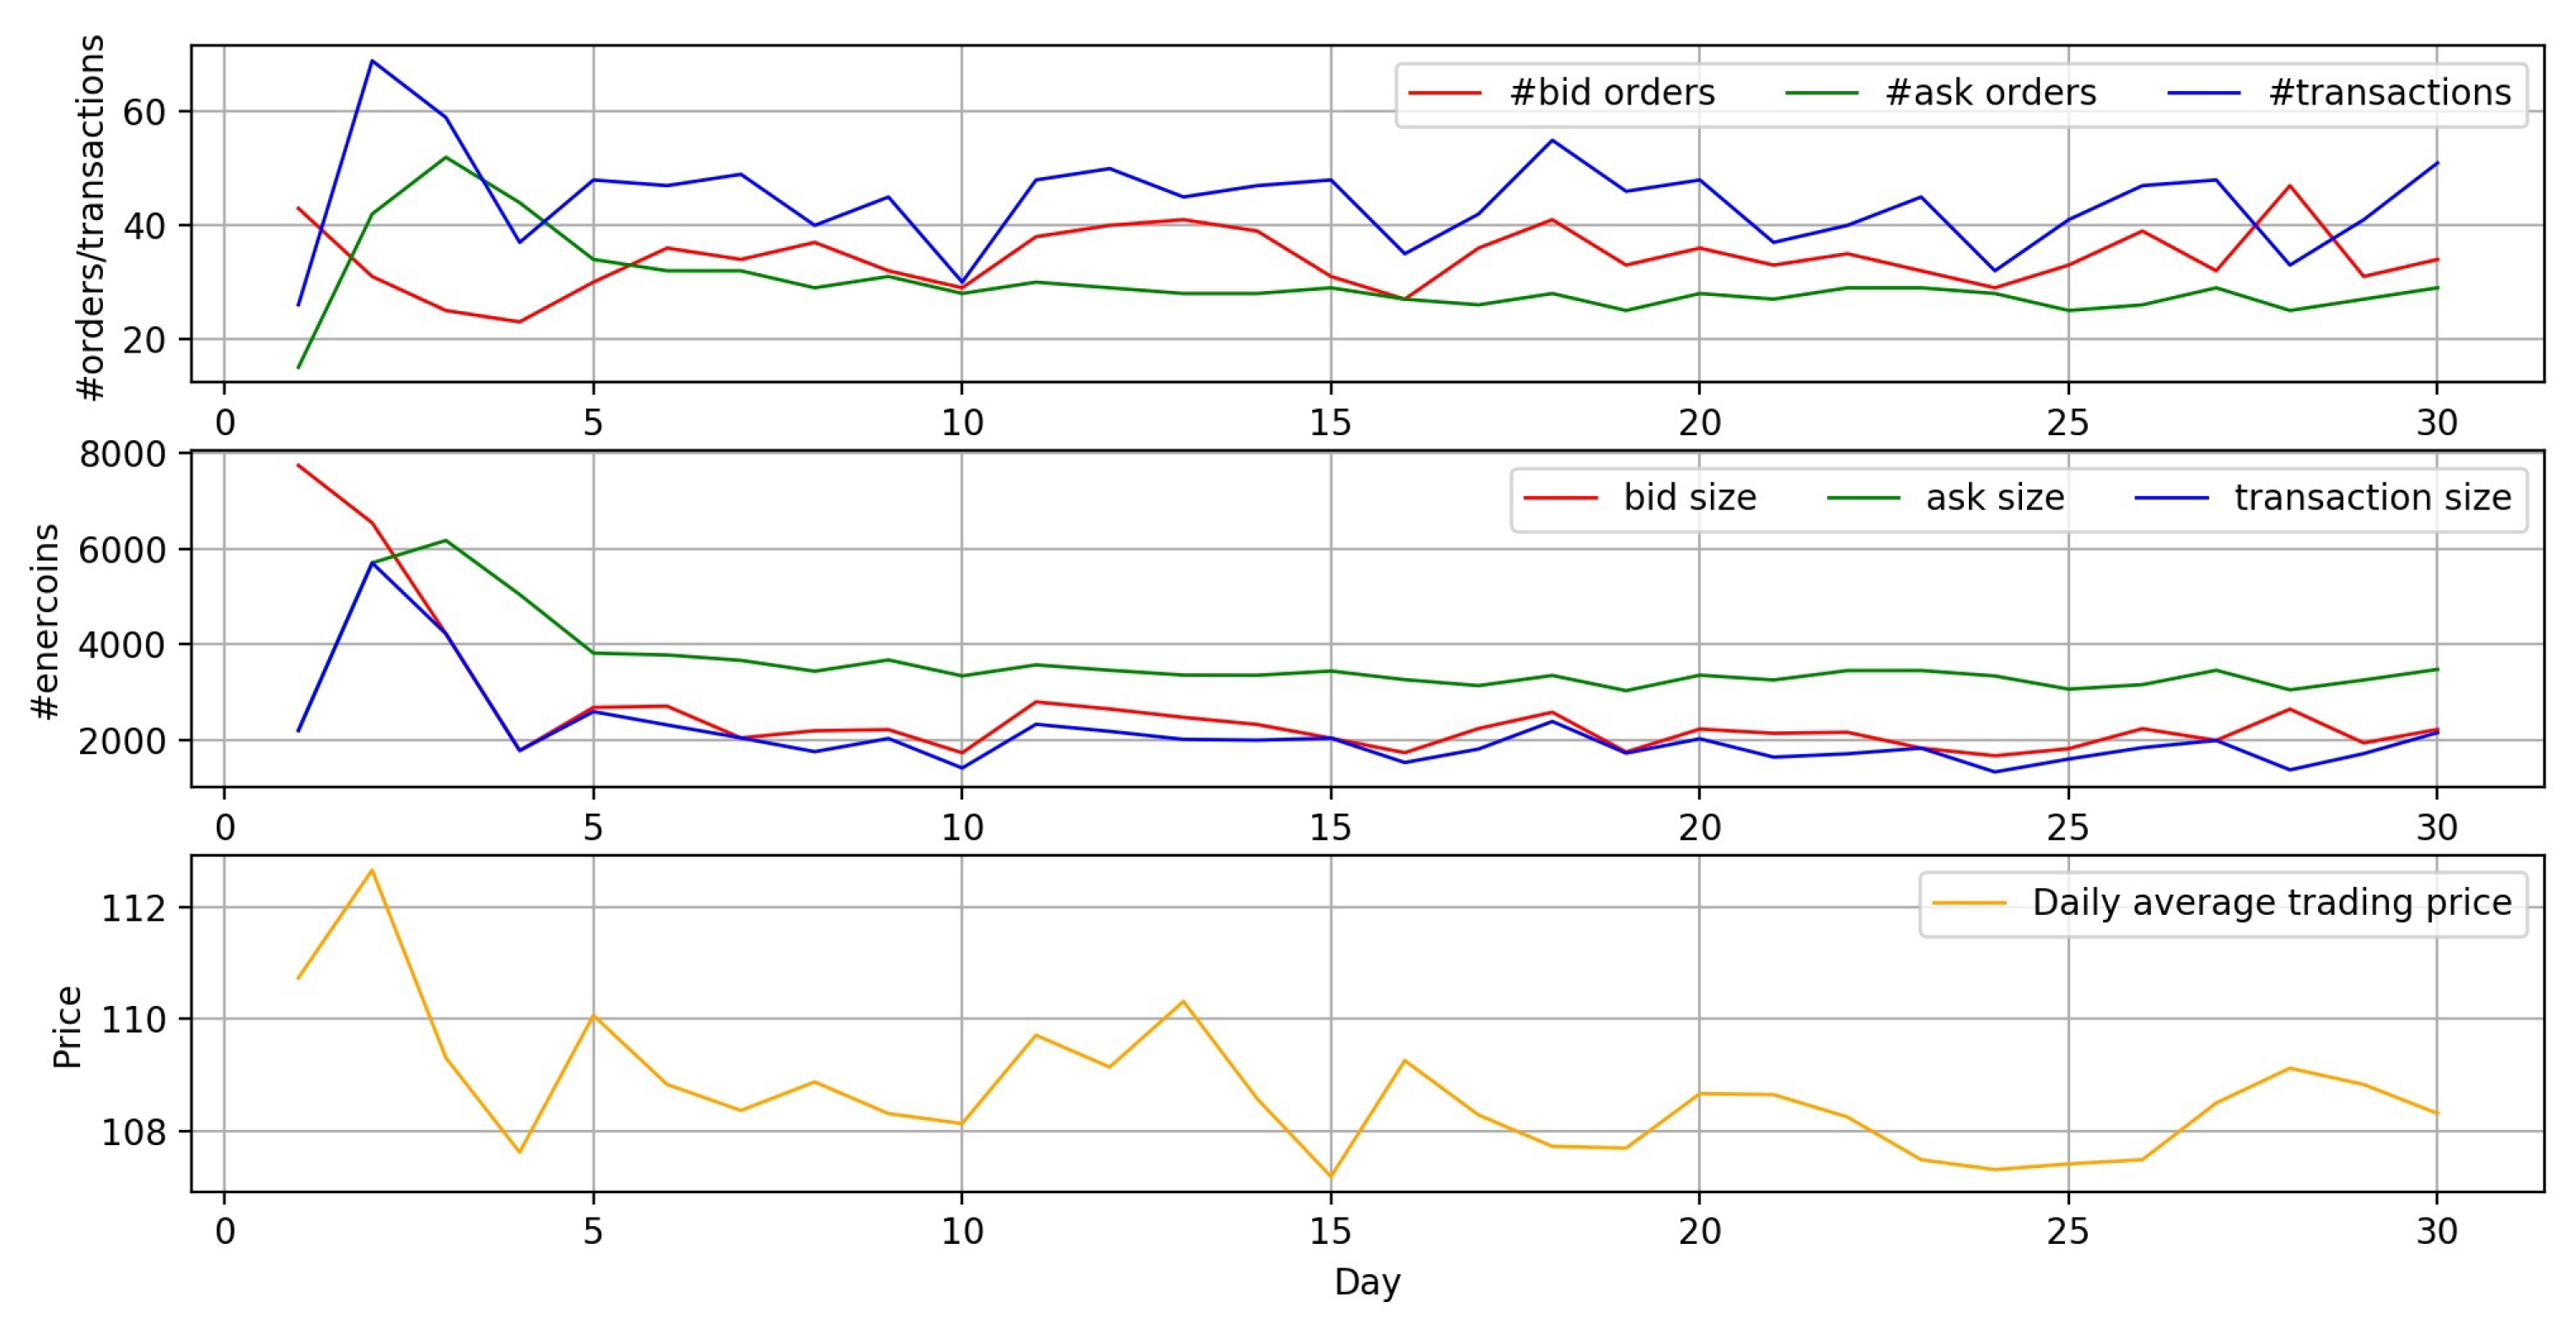
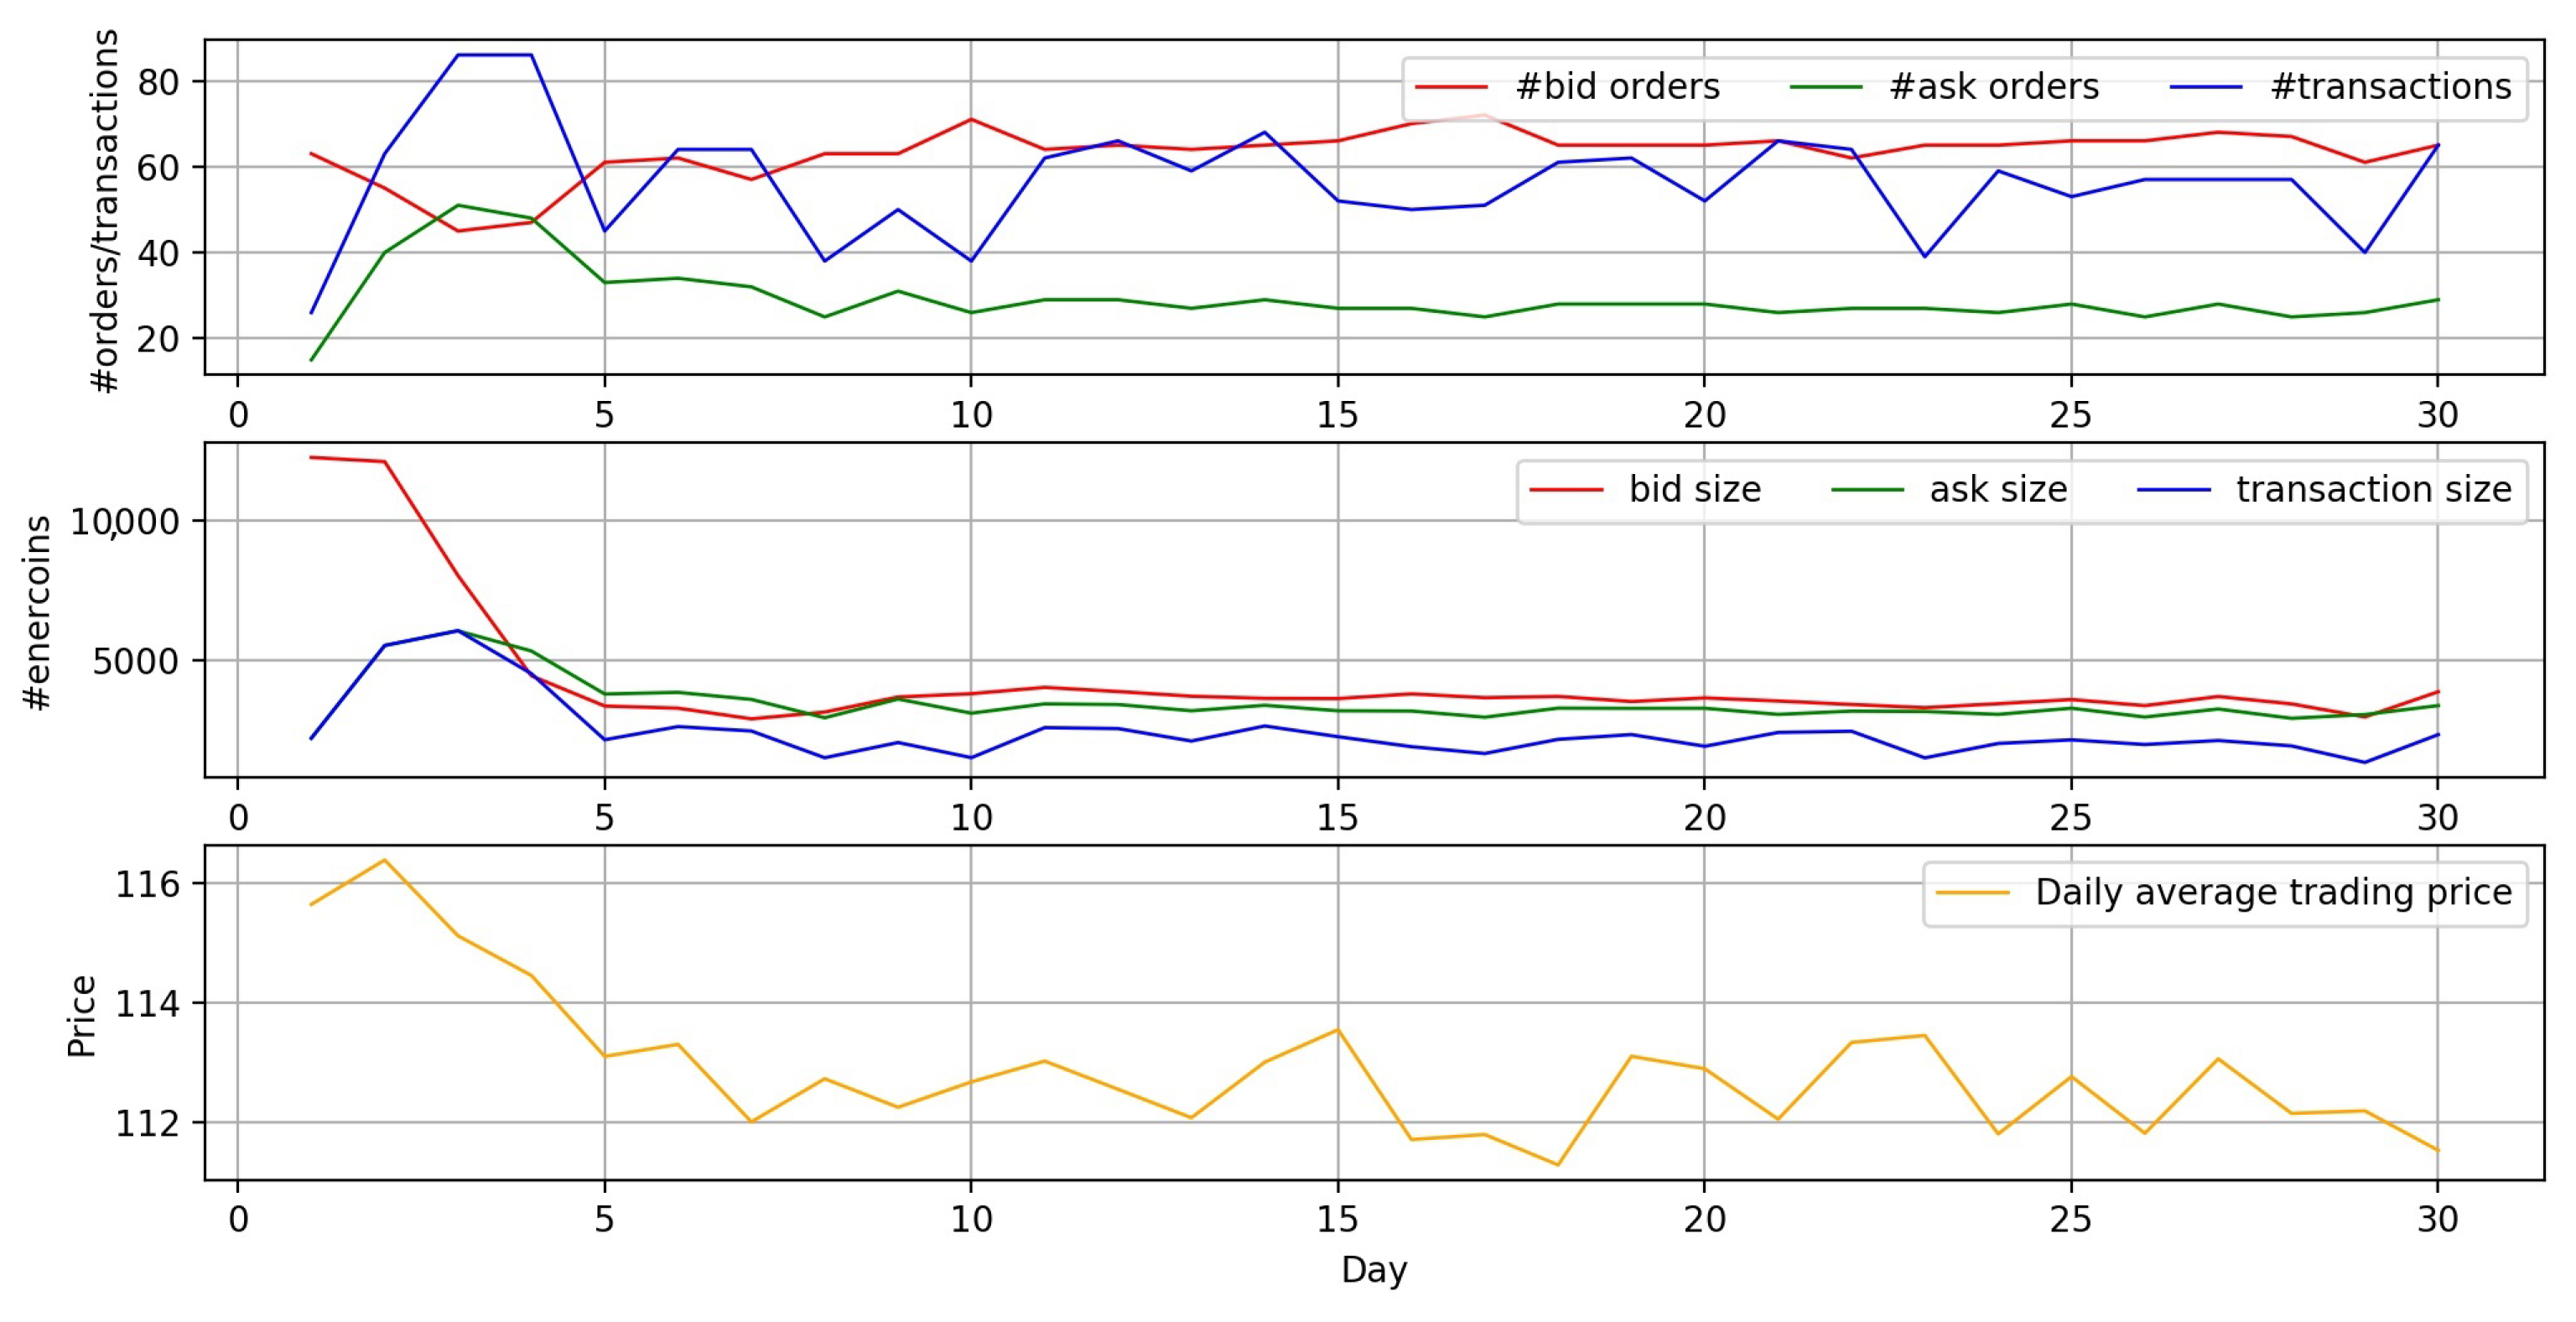
In a small community (100 households), as the norm factor varies (10%, 50%, 90%), I-Green is firstly simulated on a private blockchain. Market activities are shown in Figure 5, Figure 6 and Figure 7. Three line charts in each figure, from top to bottom, represent number of orders/transactions, ask/bid/transaction size (number of igreencoins) and daily average transaction price.
Comparing Figure 5, Figure 6 and Figure 7, we can find that, with a higher norm factor, number of bid orders and total bid size increase, implying that more participants are willing to buy more igreencoins. The corresponding number of transactions and transacted amount of igreencoins are also raised. The average price of igreencoin is pushed up by increased demand. The mean value of these variables during the simulation period are shown in Table 2. It presents that the market is more active when the norm factor is higher.
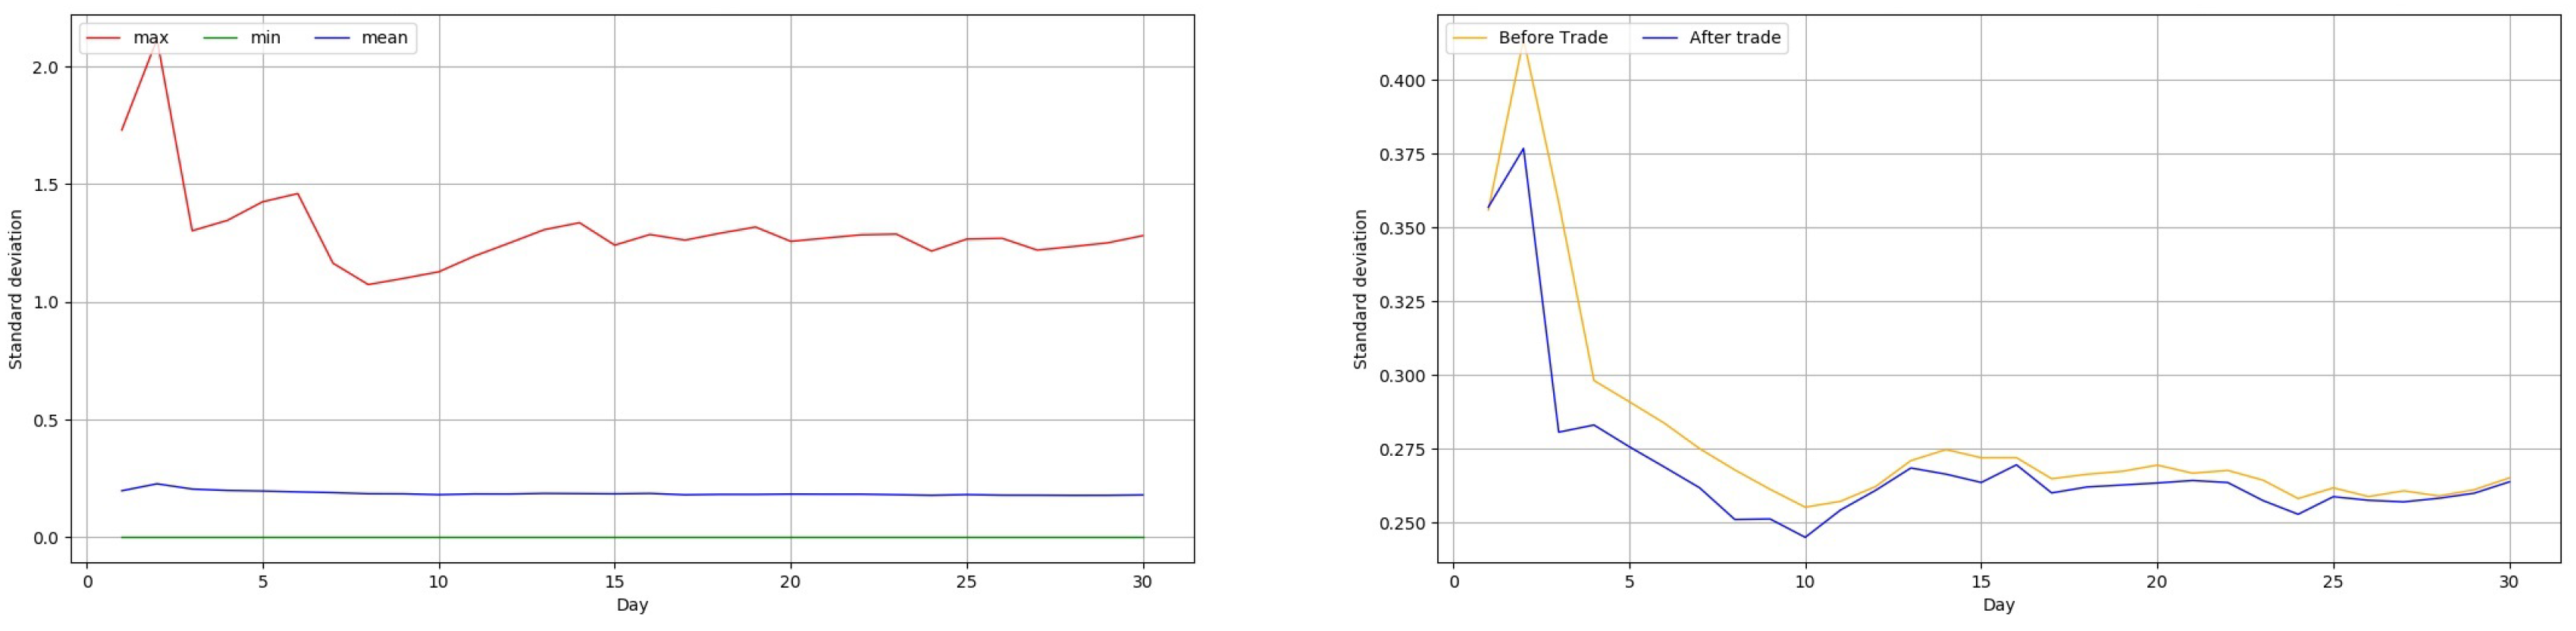
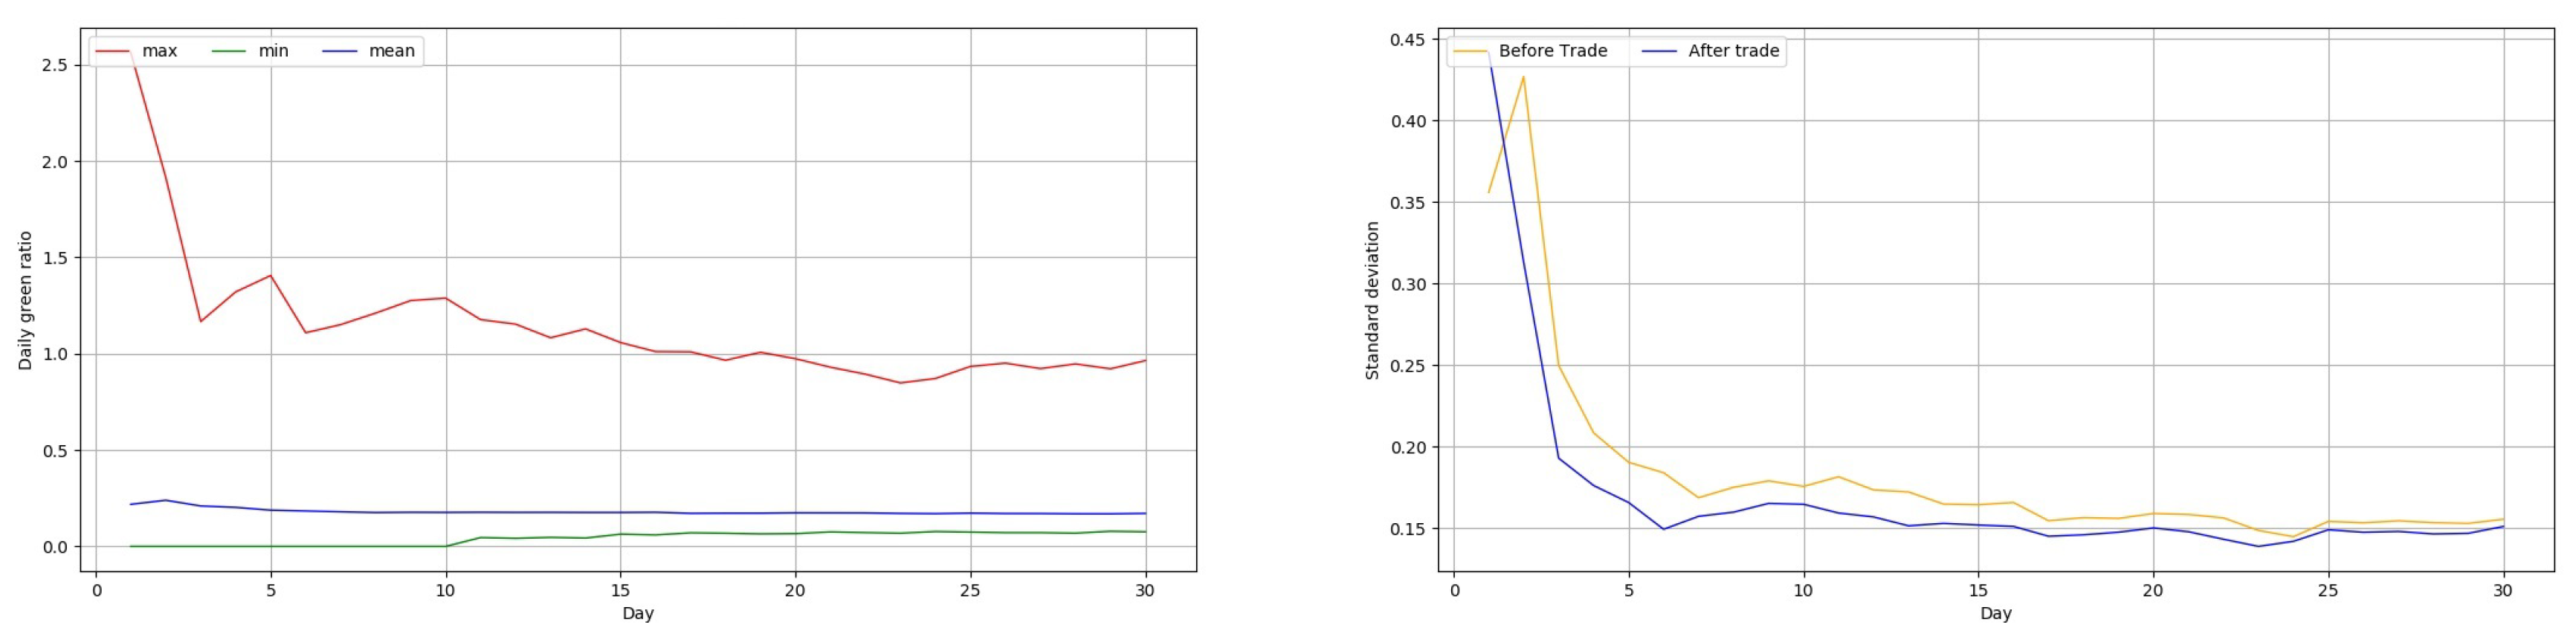
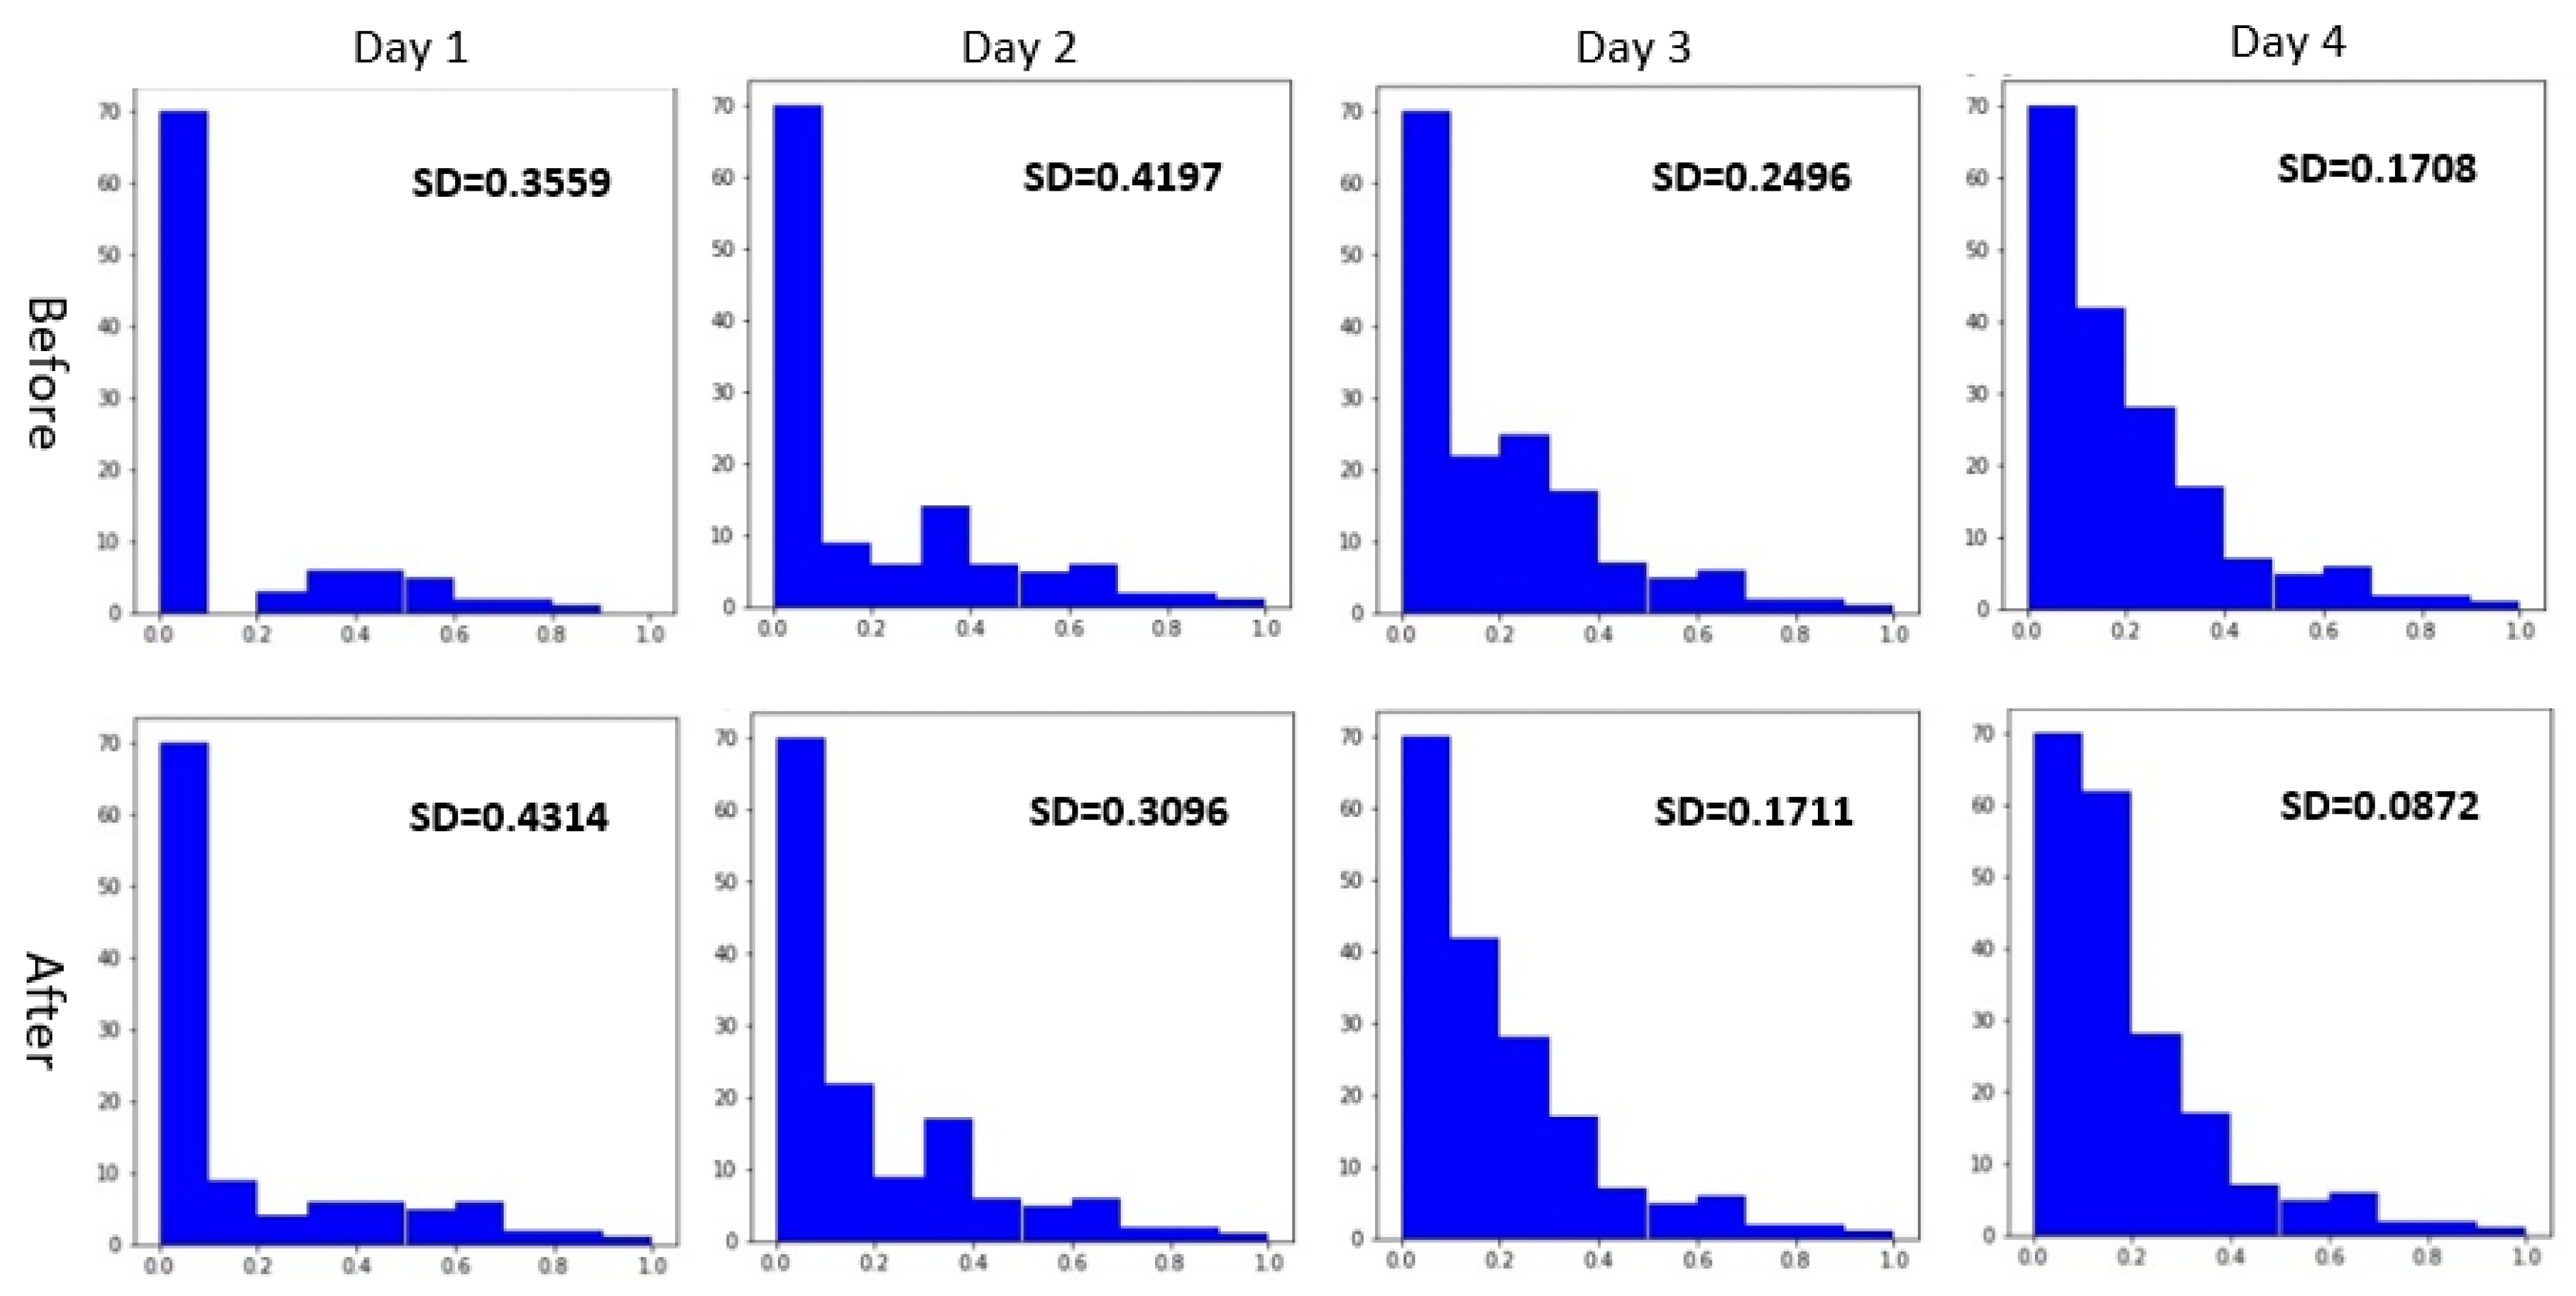
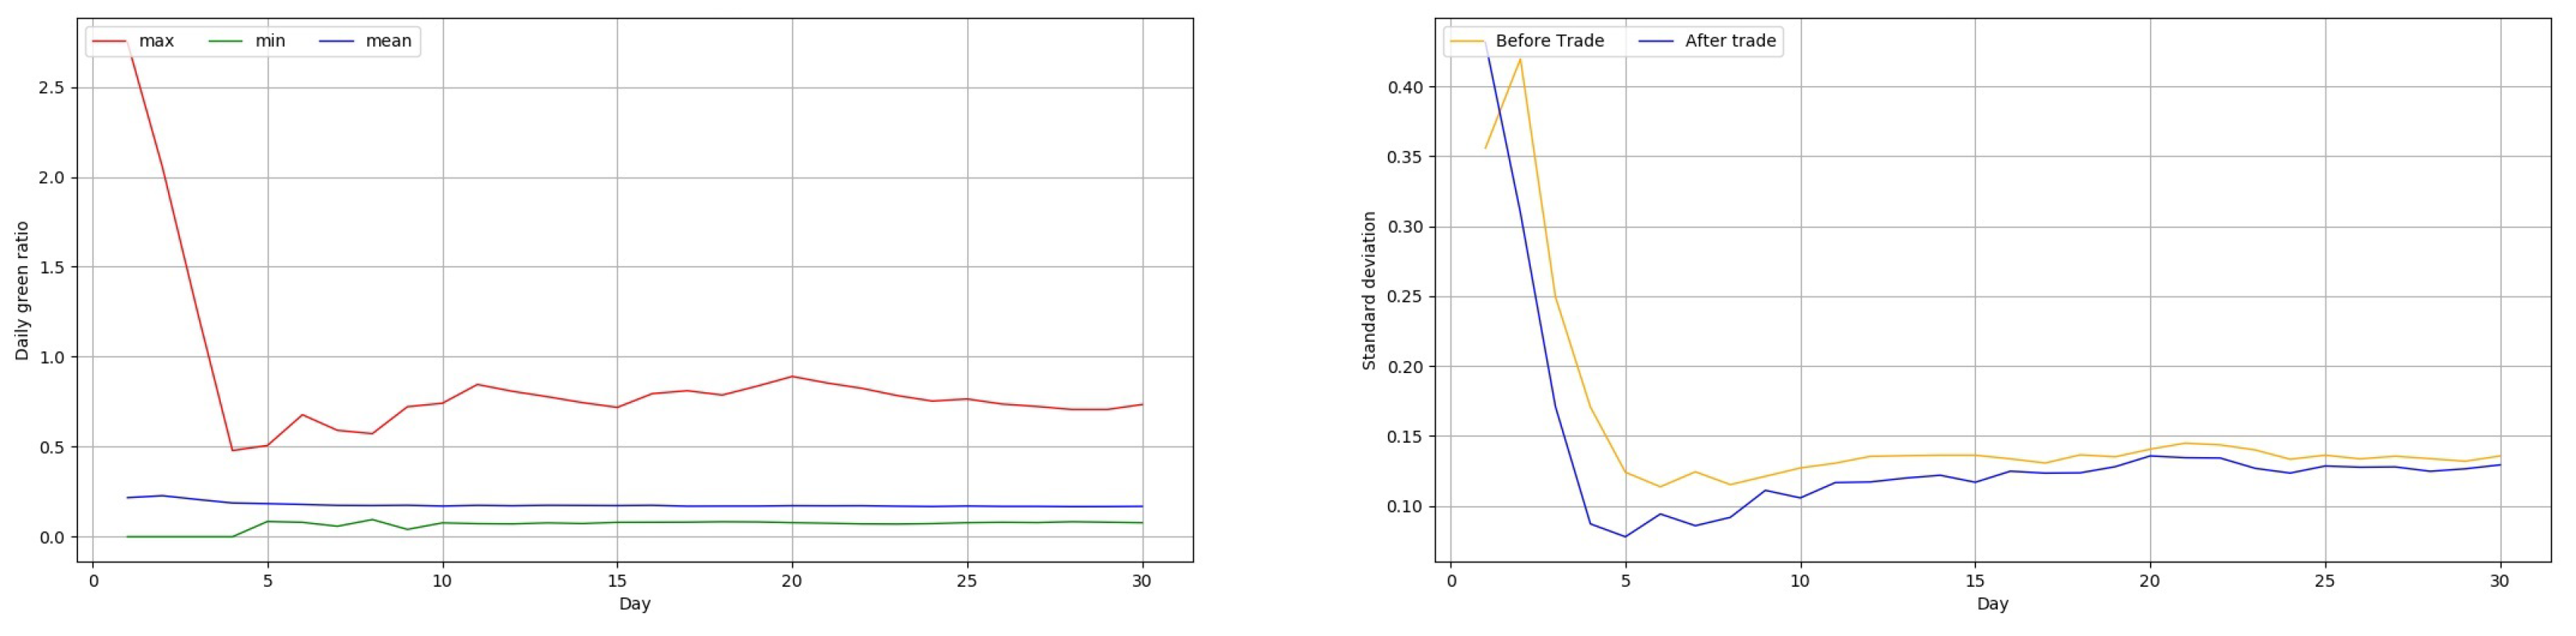
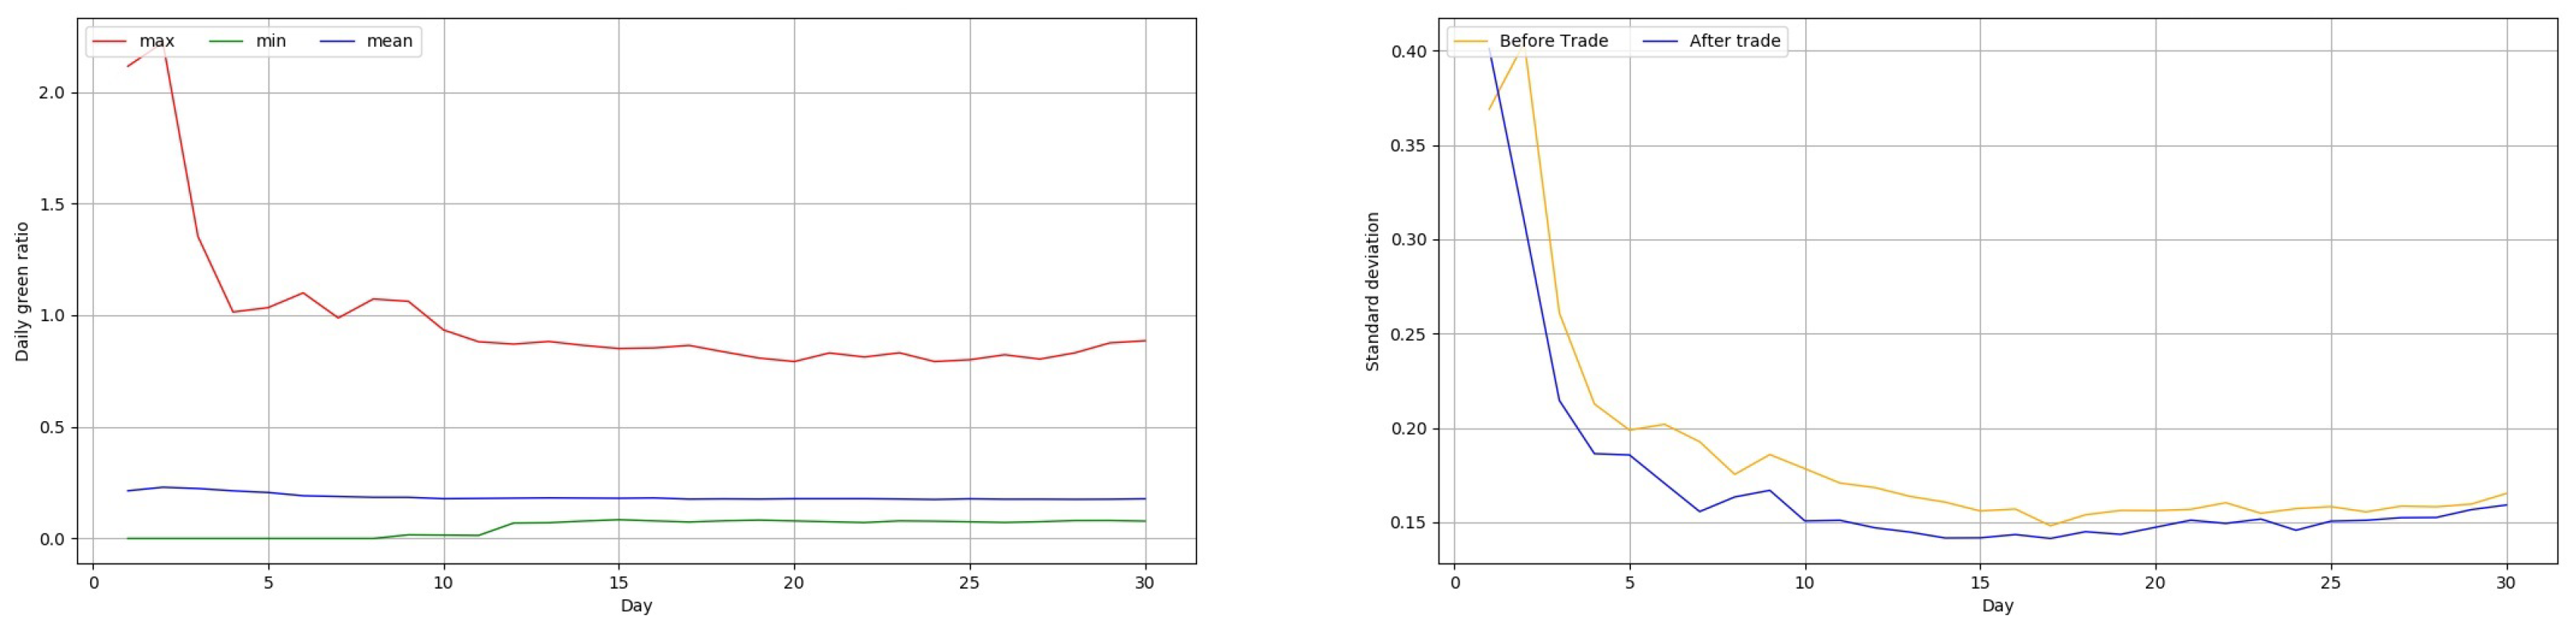
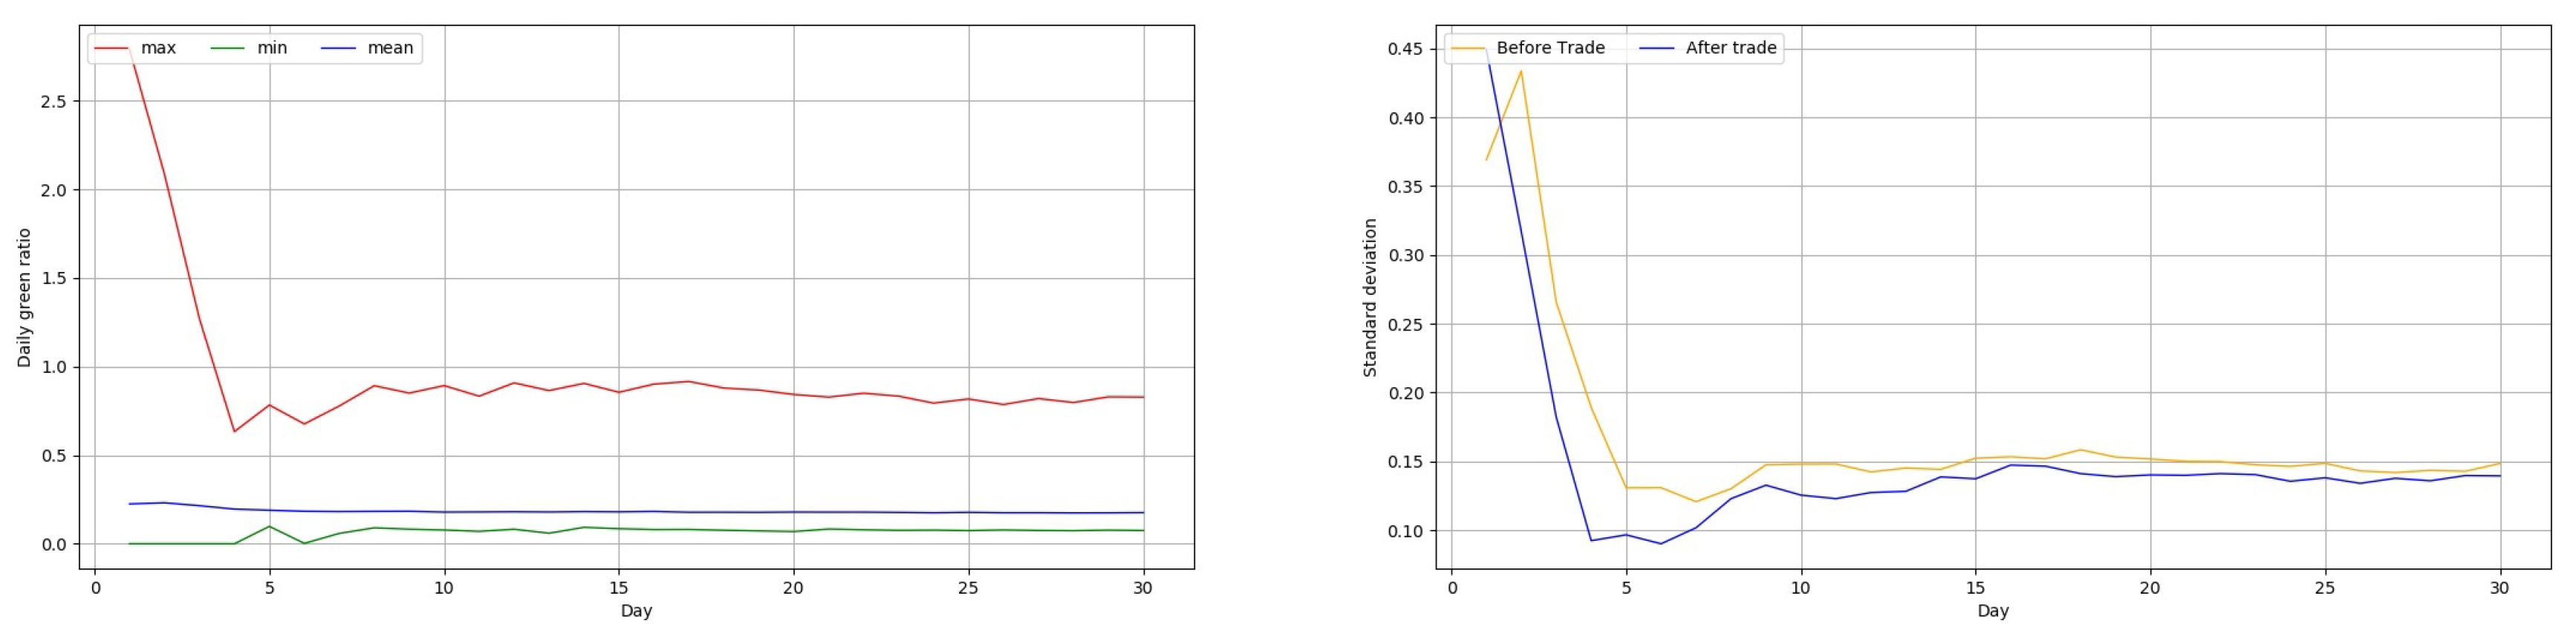
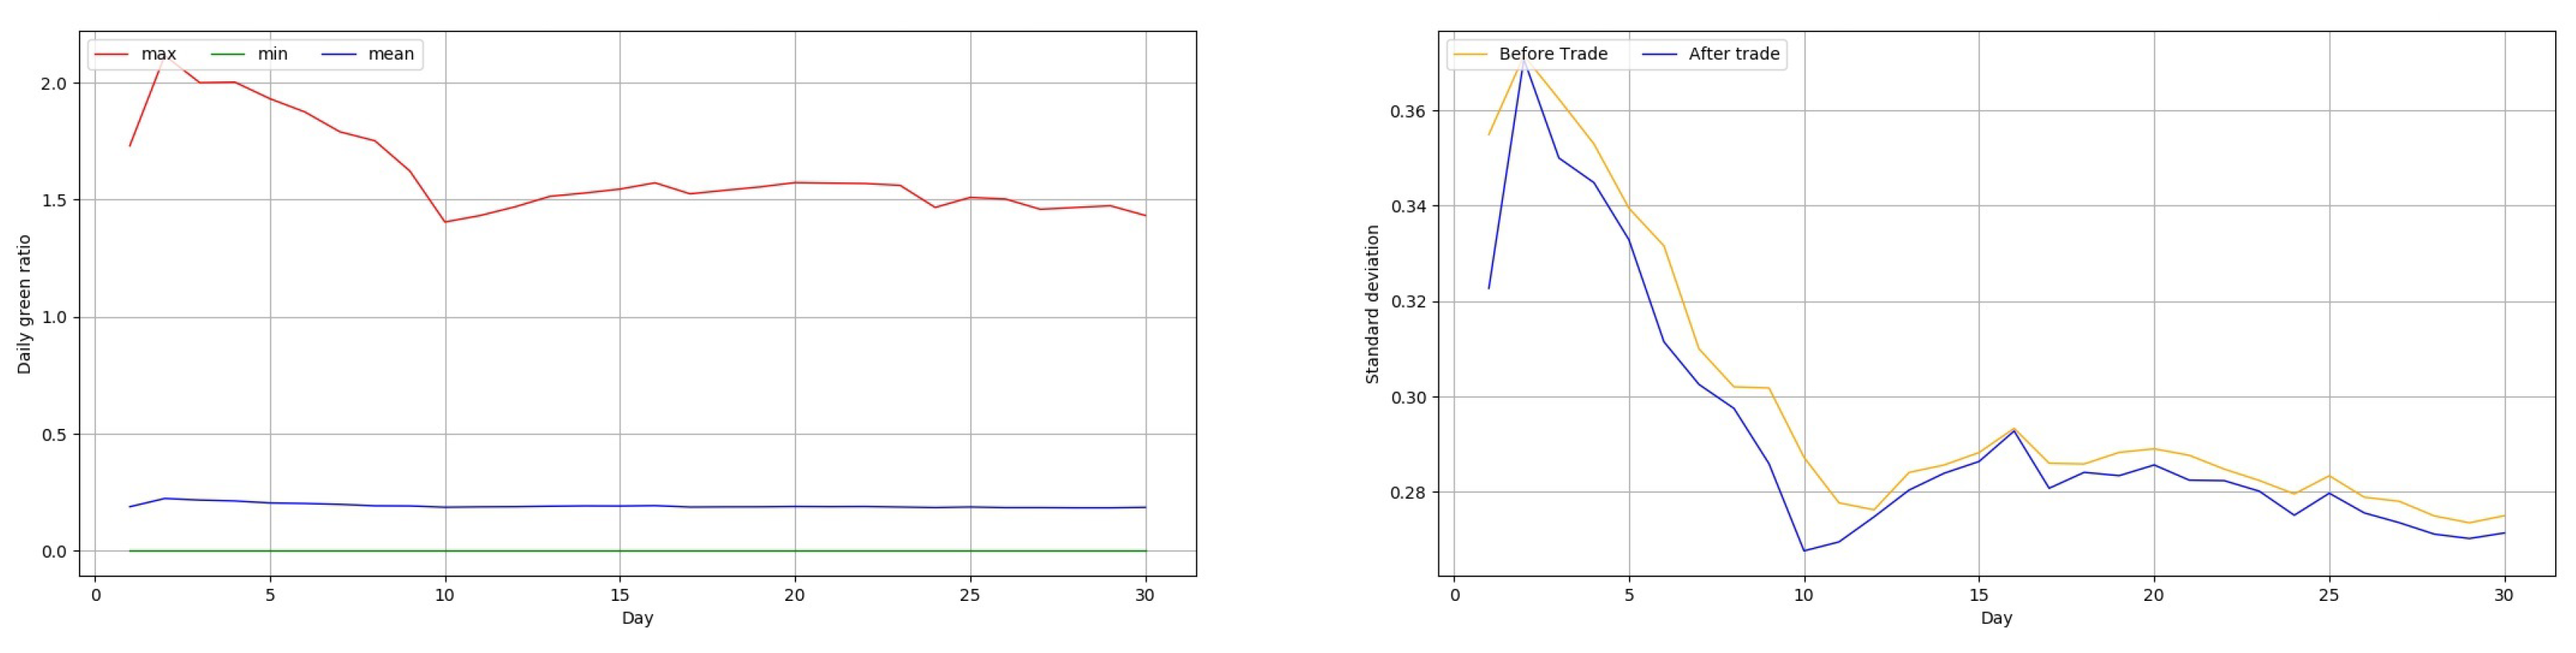
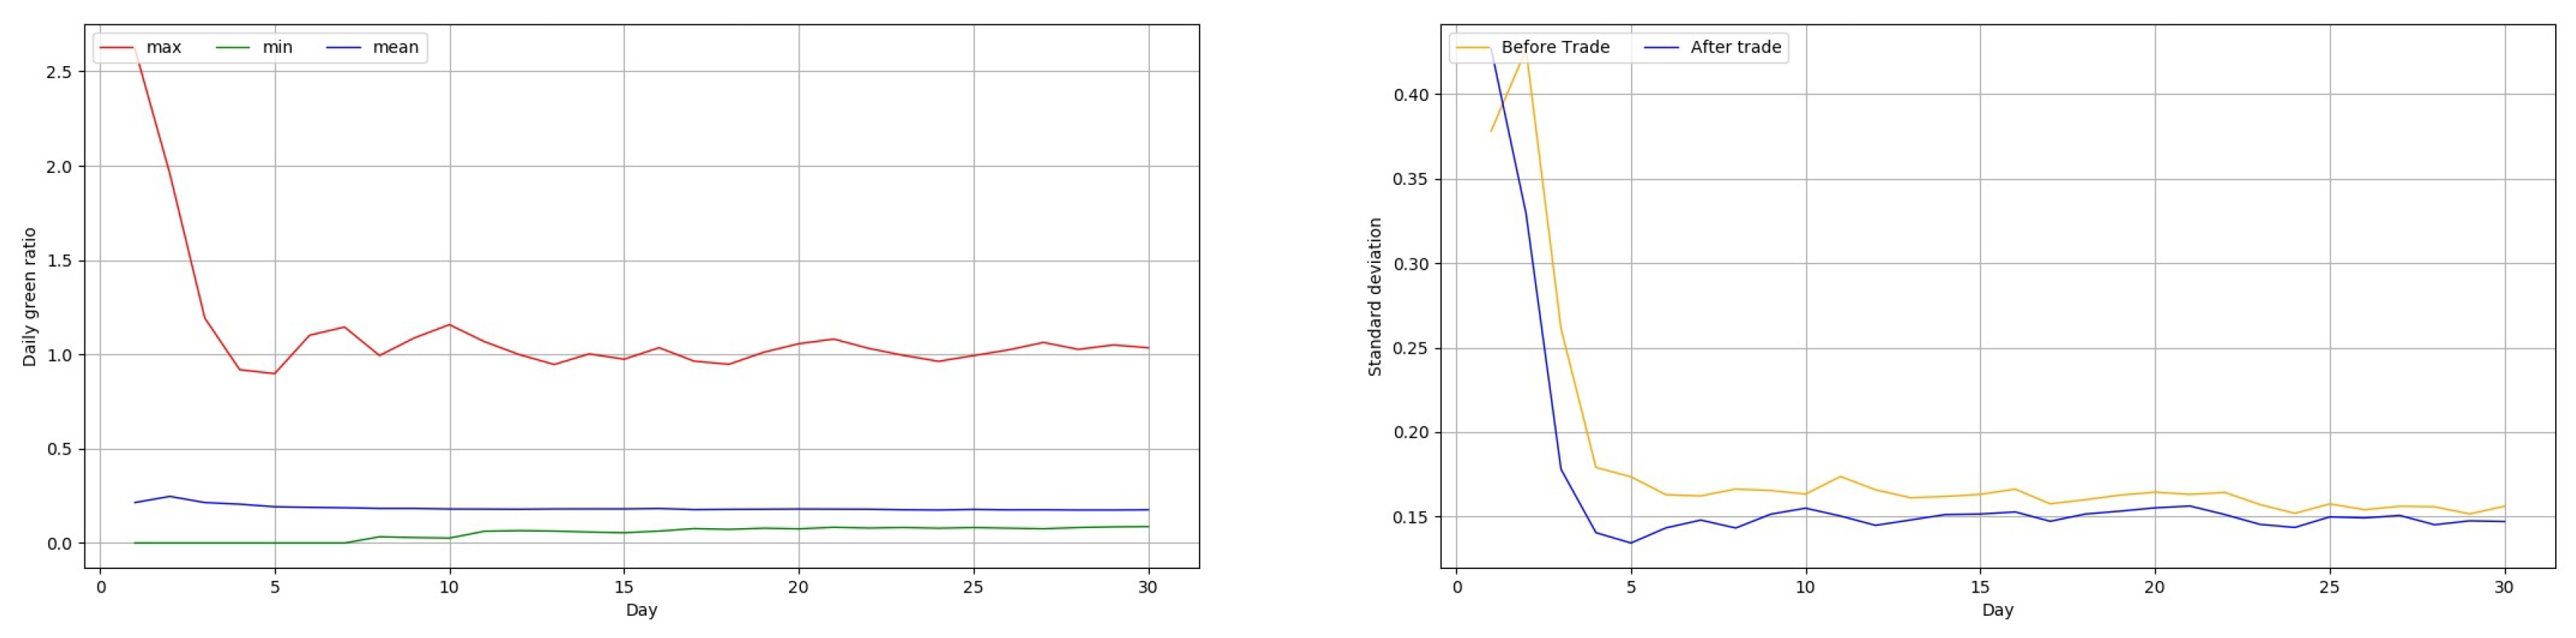
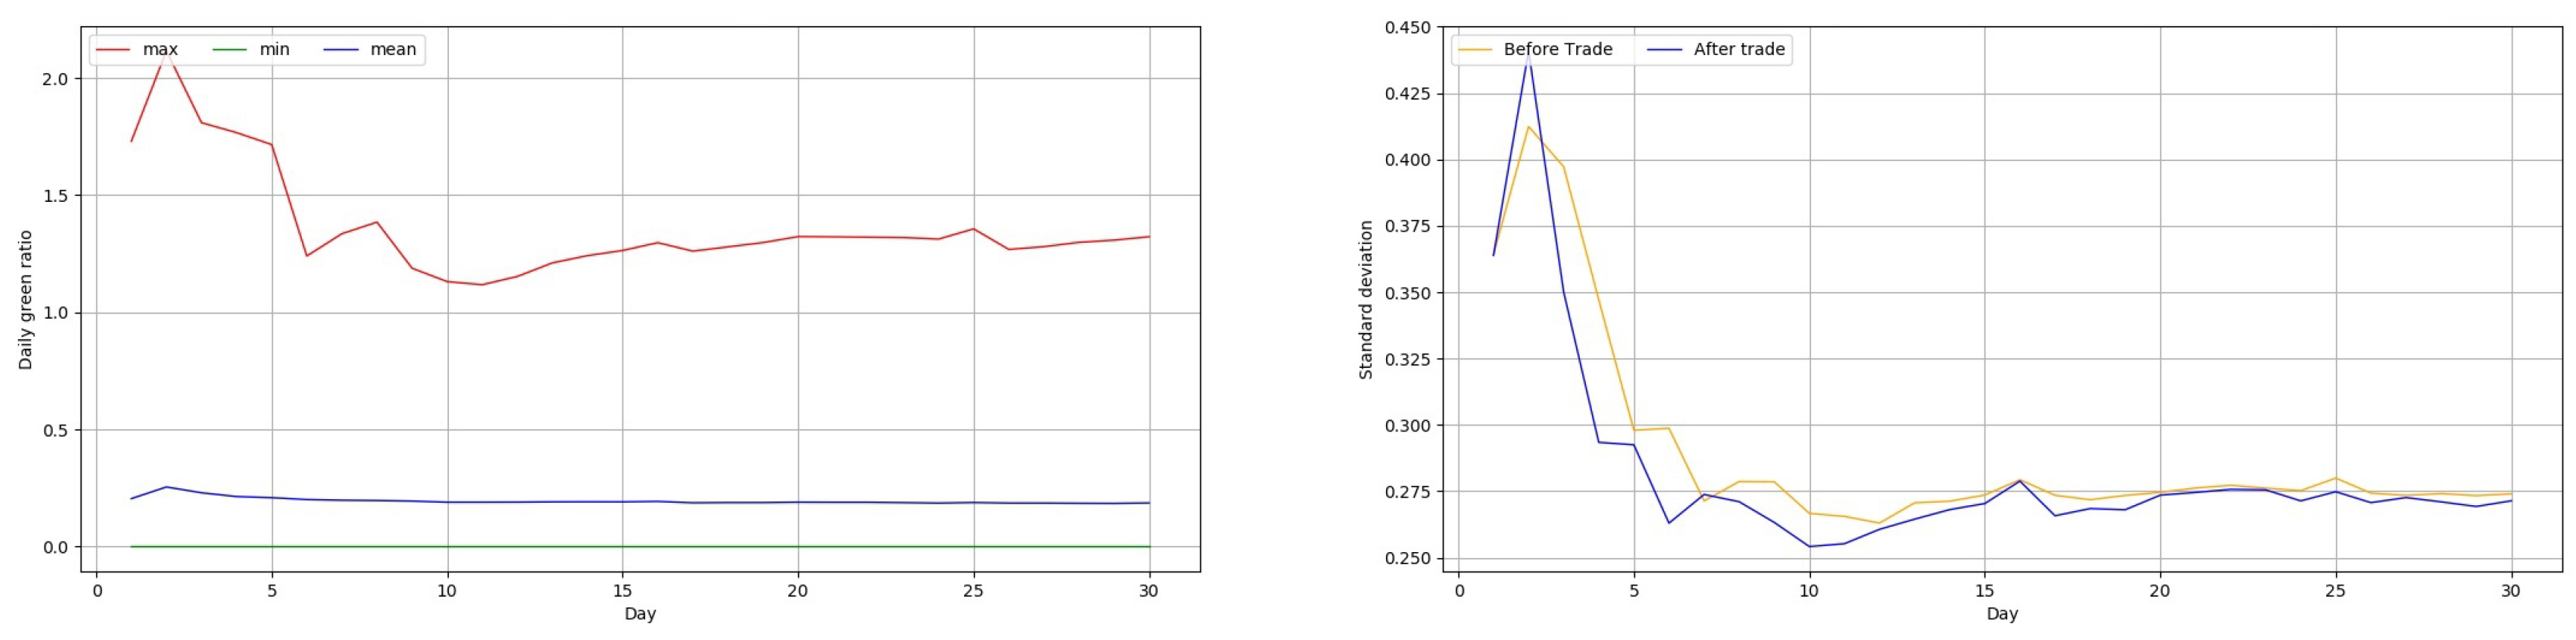
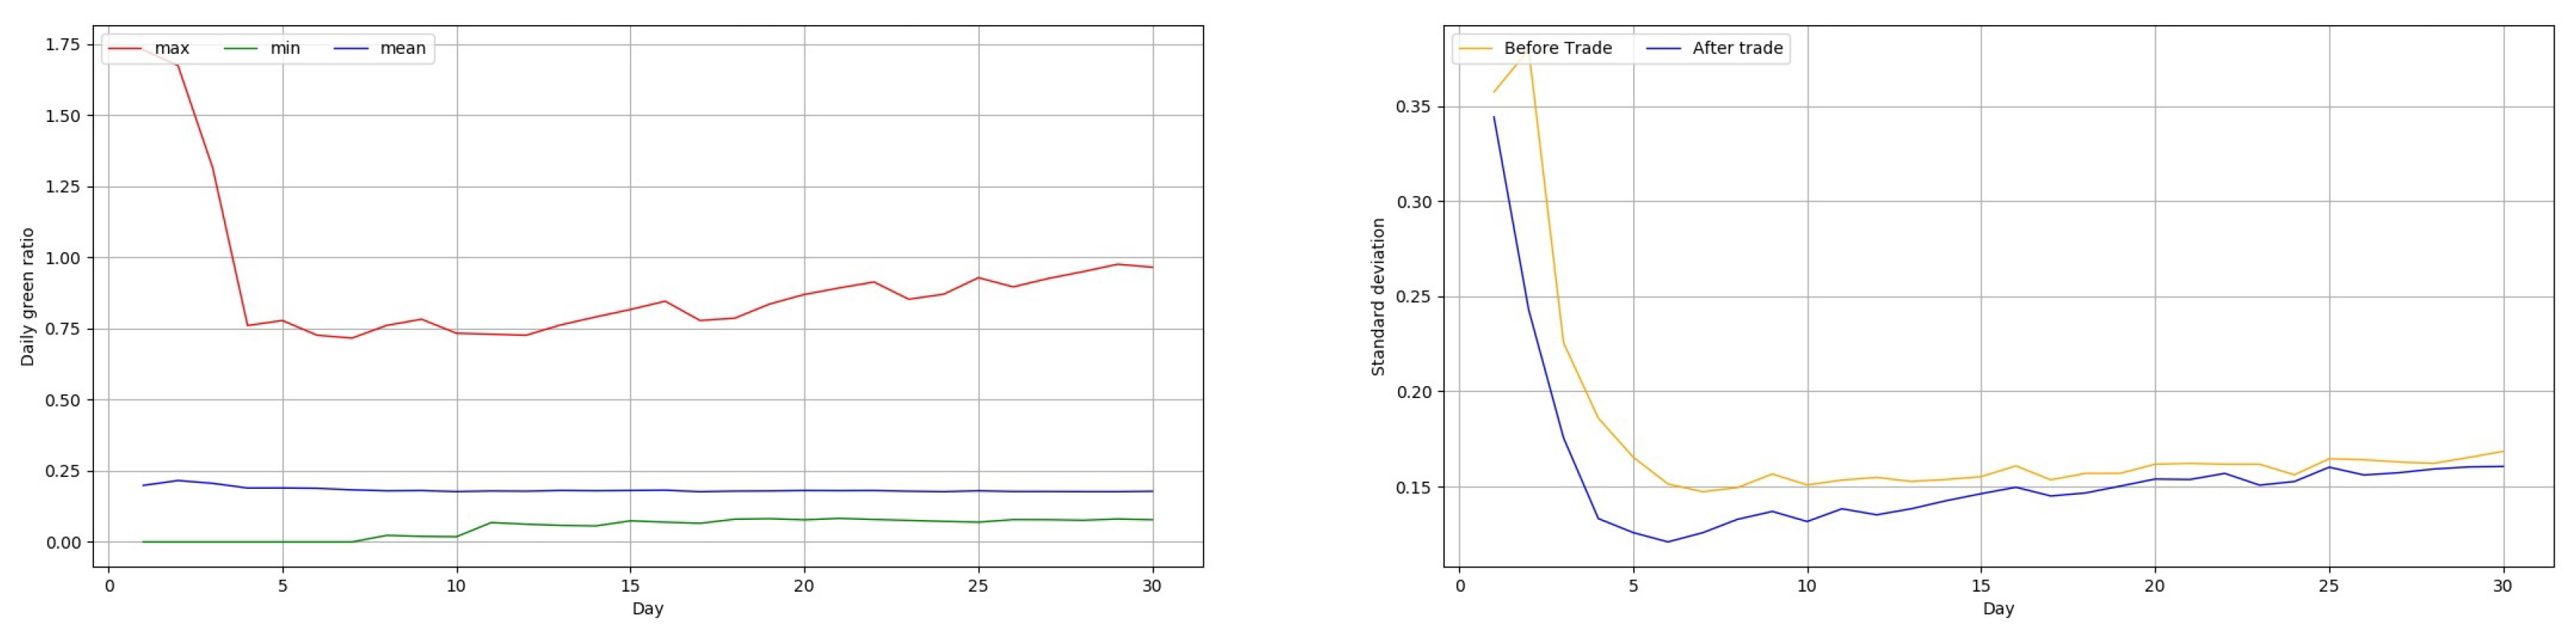
The last column of Table 2 shows the standard deviations (SD) of participants’ green ratios at the end of the simulation period. The statistics of green ratios under different norm factors (10% and 50%) during the simulated period are shown in Figure 8 and Figure 9. Detailed distributions of participants’ green ratios during 4 trading days are presented as an example, in Figure A5 in Appendix A.2. The ultimate goal of I-Green system is to promote distributed electricity generation for renewable transition. To realize that goal, environmental consciousness of the public need to be enhanced and more residents should be involved. A lower standard deviation signifies that individuals’ green ratios are more evenly distributed, and that residents are involved more equally in adopting renewable energy. Consistent with the influence on market activities, a higher norm factor drives more consumers to buy igreencoins to improve their green ratios, resulting in a smaller standard deviation. Furthermore, the norm factor impacts the speed of SD to approach the stable value. Comparing Figure 8 and Figure 9, we can find that it takes about 15 days to reach a SD = 0.27 when norm factor = 10%, while only 6 days to reach a SD = 0.15 when norm factor = 50%.
5.1.2. Synergy Effect of PoG
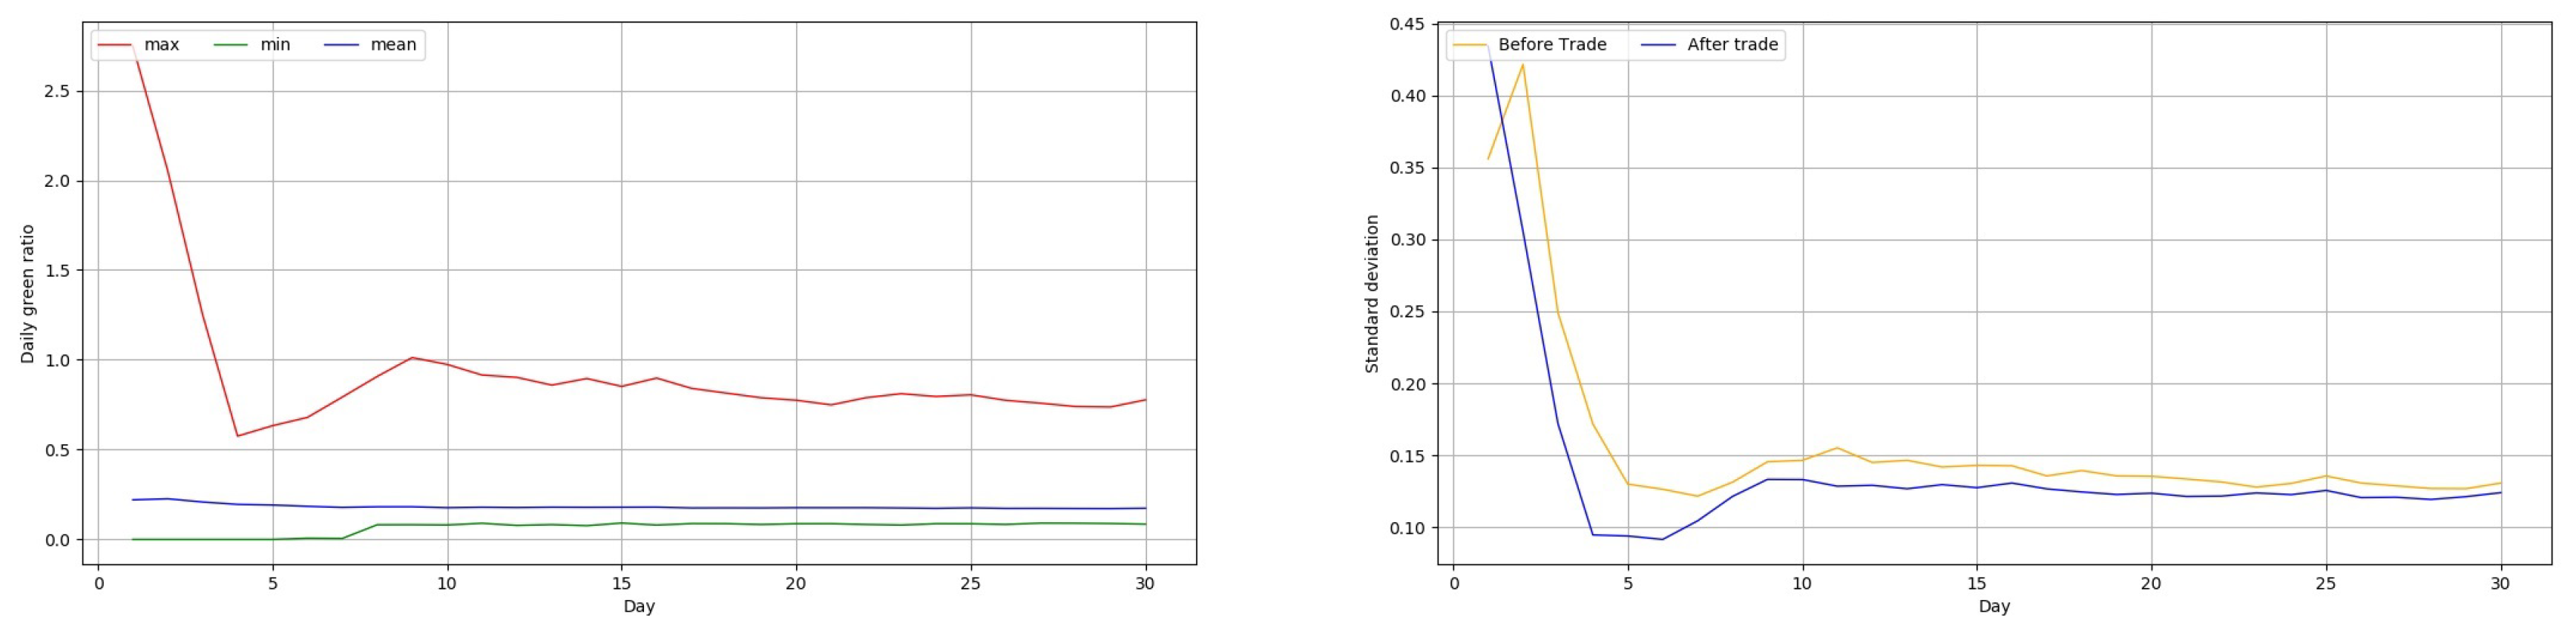
Simulated market activities on I-Green with PoG protocol are shown in Figure 10, Figure 11 and Figure 12, as norm factor = 10%, 50% and 90%, respectively. Table 3 displays the mean value of market variables and standard deviations of green ratios approached at the end of the simulation period.
Compared to market situations on a private blockchain, the employment of PoG animates the market, when norm factor is high enough (50% and 90%). Bid and transaction amount in Figure 11 and Figure 12 are larger, in contrast to that in Figure 6 and Figure 7, correspondingly. More vivid market activities are also confirmed by Table 3, where transaction amount and average price are higher than that in Table 2, when norm factor = . However, with a small norm factor (), the reinforcement effect of PoG does not appear, since the market activities do not increase and the standard deviation of green ratios is higher, compared to that on a private blockchain.
This result can be explained by the principle of PoG protocol. PoG grants validation rights to prosumers, by which they receive more coins as block reward. On one hand, issuing more coins for validation raises up the community green ratio, further driving participants to improve their personal ratios. On the other hand, PoG favors prosumers and amplifies their advantages, leaving a larger gap for consumers to catch up with. However, when the norm factor is low, participants have insufficient tendency to achieve the social norm. Neither a higher community green ratio nor a larger difference between prosumers and consumers can lead more households to buy igreencoins. Therefore, there is a synergy between PoG and the green ratio scheme. The combination of PoG and the green ratio scheme is able to enhance the effectiveness of I-Green system, getting more households involved in the renewables adoption. The synergy effect can be strengthened by increasing the block reward of PoG, which is currently set as 50 igreencoins. As shown in Table 4, bid and transaction amount increase when block reward of PoG is marked up to 100 igreencoins. Whereas, it also widens the gap between prosumers and consumers, resulting in a higher dispersion of participants’ green ratios.
The increase of prosumers’ percentage in the community is simulated. Table 5 demonstrates market variables of the situation with 60% prosumers. Compared to the situation of 30% prosumers shown in Table 3, the increase of prosumers achieves similar activeness and liquidity of the market. The synergy effect of the PoG and the motivation effect of the green ratio scheme, therefore, are sustained with the scaling of prosumers.
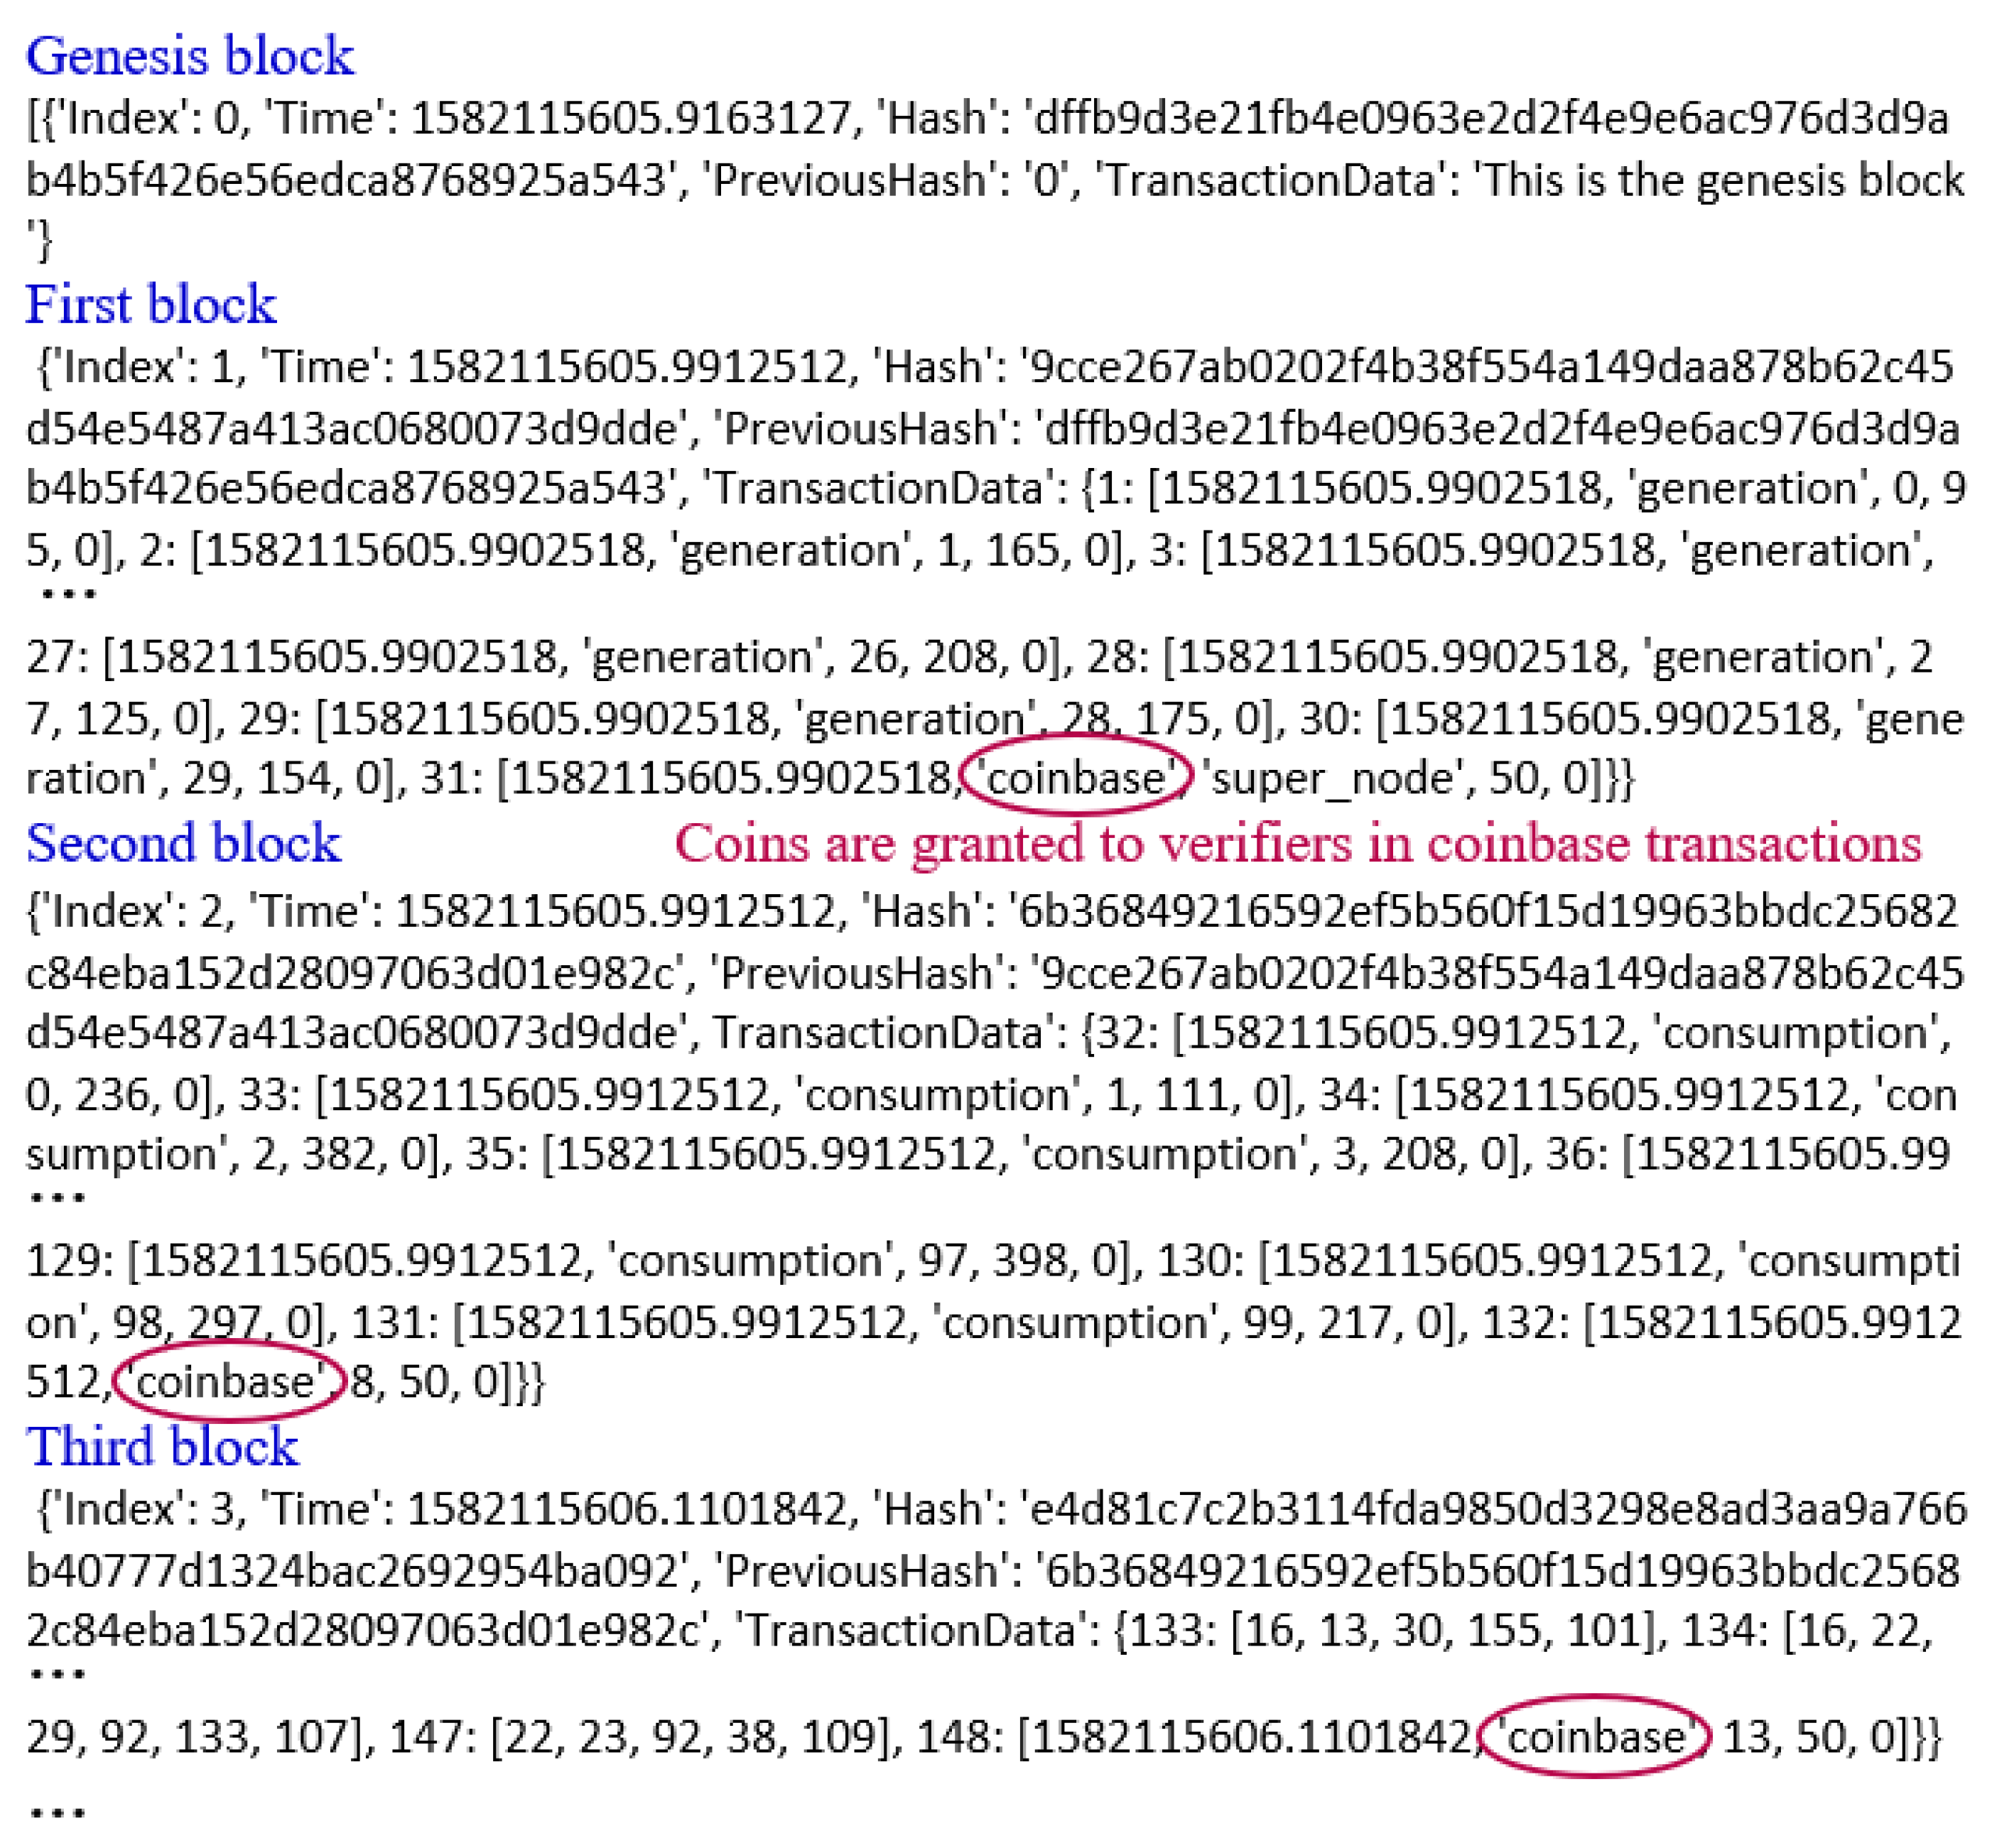
Market variables of simulated PoW and PoS blockchains are shown in Table 6 and Table 7, with detailed market activities presented in Appendix A.4 and Appendix A.5. Compared to the situation on a private blockchain, I-Green with PoW has a similar market liquidity, but a slightly higher standard deviation of green ratios. This results from the fact that PoW issues new coins to miners, a group of pre-selected nodes at the beginning of the simulation, which enlarges the difference of their green ratios to that of others. PoS slightly improves market liquidity, as it realizes a small increase of transaction amount compared to the private blockchain. New coins granted to verifiers in PoS expand the circulation and raise up the community green ratio, which in turn motivates more trading activities. In summary, neither PoW nor PoS achieves the same scale of improvement of market activeness as PoG does.
The simulation results of a medium (1000 households) and a large (10,000 households) community on I-Green (with PoG protocol) and on a private blockchain are shown in Appendix B. The motivation effect of the green ratio scheme and the synergy effect of PoG are maintained with the expanding of the community.
5.2. Blockchain Performance
In this section, vital performance metrics of I-Green as a blockchain system are evaluated and analyzed, including its efficiency, scalability and security. The performance of proof of generation protocol is compared with that of proof of work and proof of stake protocols.
5.2.1. Efficiency and Scalability
Table 8 presents average processing time of a block on four kinds of blockchains. It counts the time consumed by record-keeping procedures, including verifier selection, new blocks creation, and transactions settlement. Since these processes are streamlined in the simulation, the time consumption primarily reflects the operation cost. On a small network (100 nodes), the cost of PoG is similar to that of a private blockchain. With the scaling up of the network (1000 nodes and 10,000 nodes), the cost of PoG approximately increases linearly, being slightly larger than the cost of a private blockchain. PoG costs less than PoS, and the advantage is enlarged with the expanding of the network. This is caused by the more efficient verifier selection of PoG, as it does not require putting stakes or calculating coinage. PoW dramatically augments the operation cost. Given the difficulty level (A chance of 10% to solve the puzzle in each trial) and amounts of miners (10% of nodes) set in the simulation, operation costs of PoW are about 250 times, 2700 times and 23,000 times of the costs of PoG on a small, a medium and a large network, respectively. PoW is designed deliberately to be time-consuming and energy-consuming for synchronization and security, thus it is dilemmatic to improve its performance. The simulation confirms that PoW is not eligible for I-Green, which has been theoretically discussed in Section 3.2.
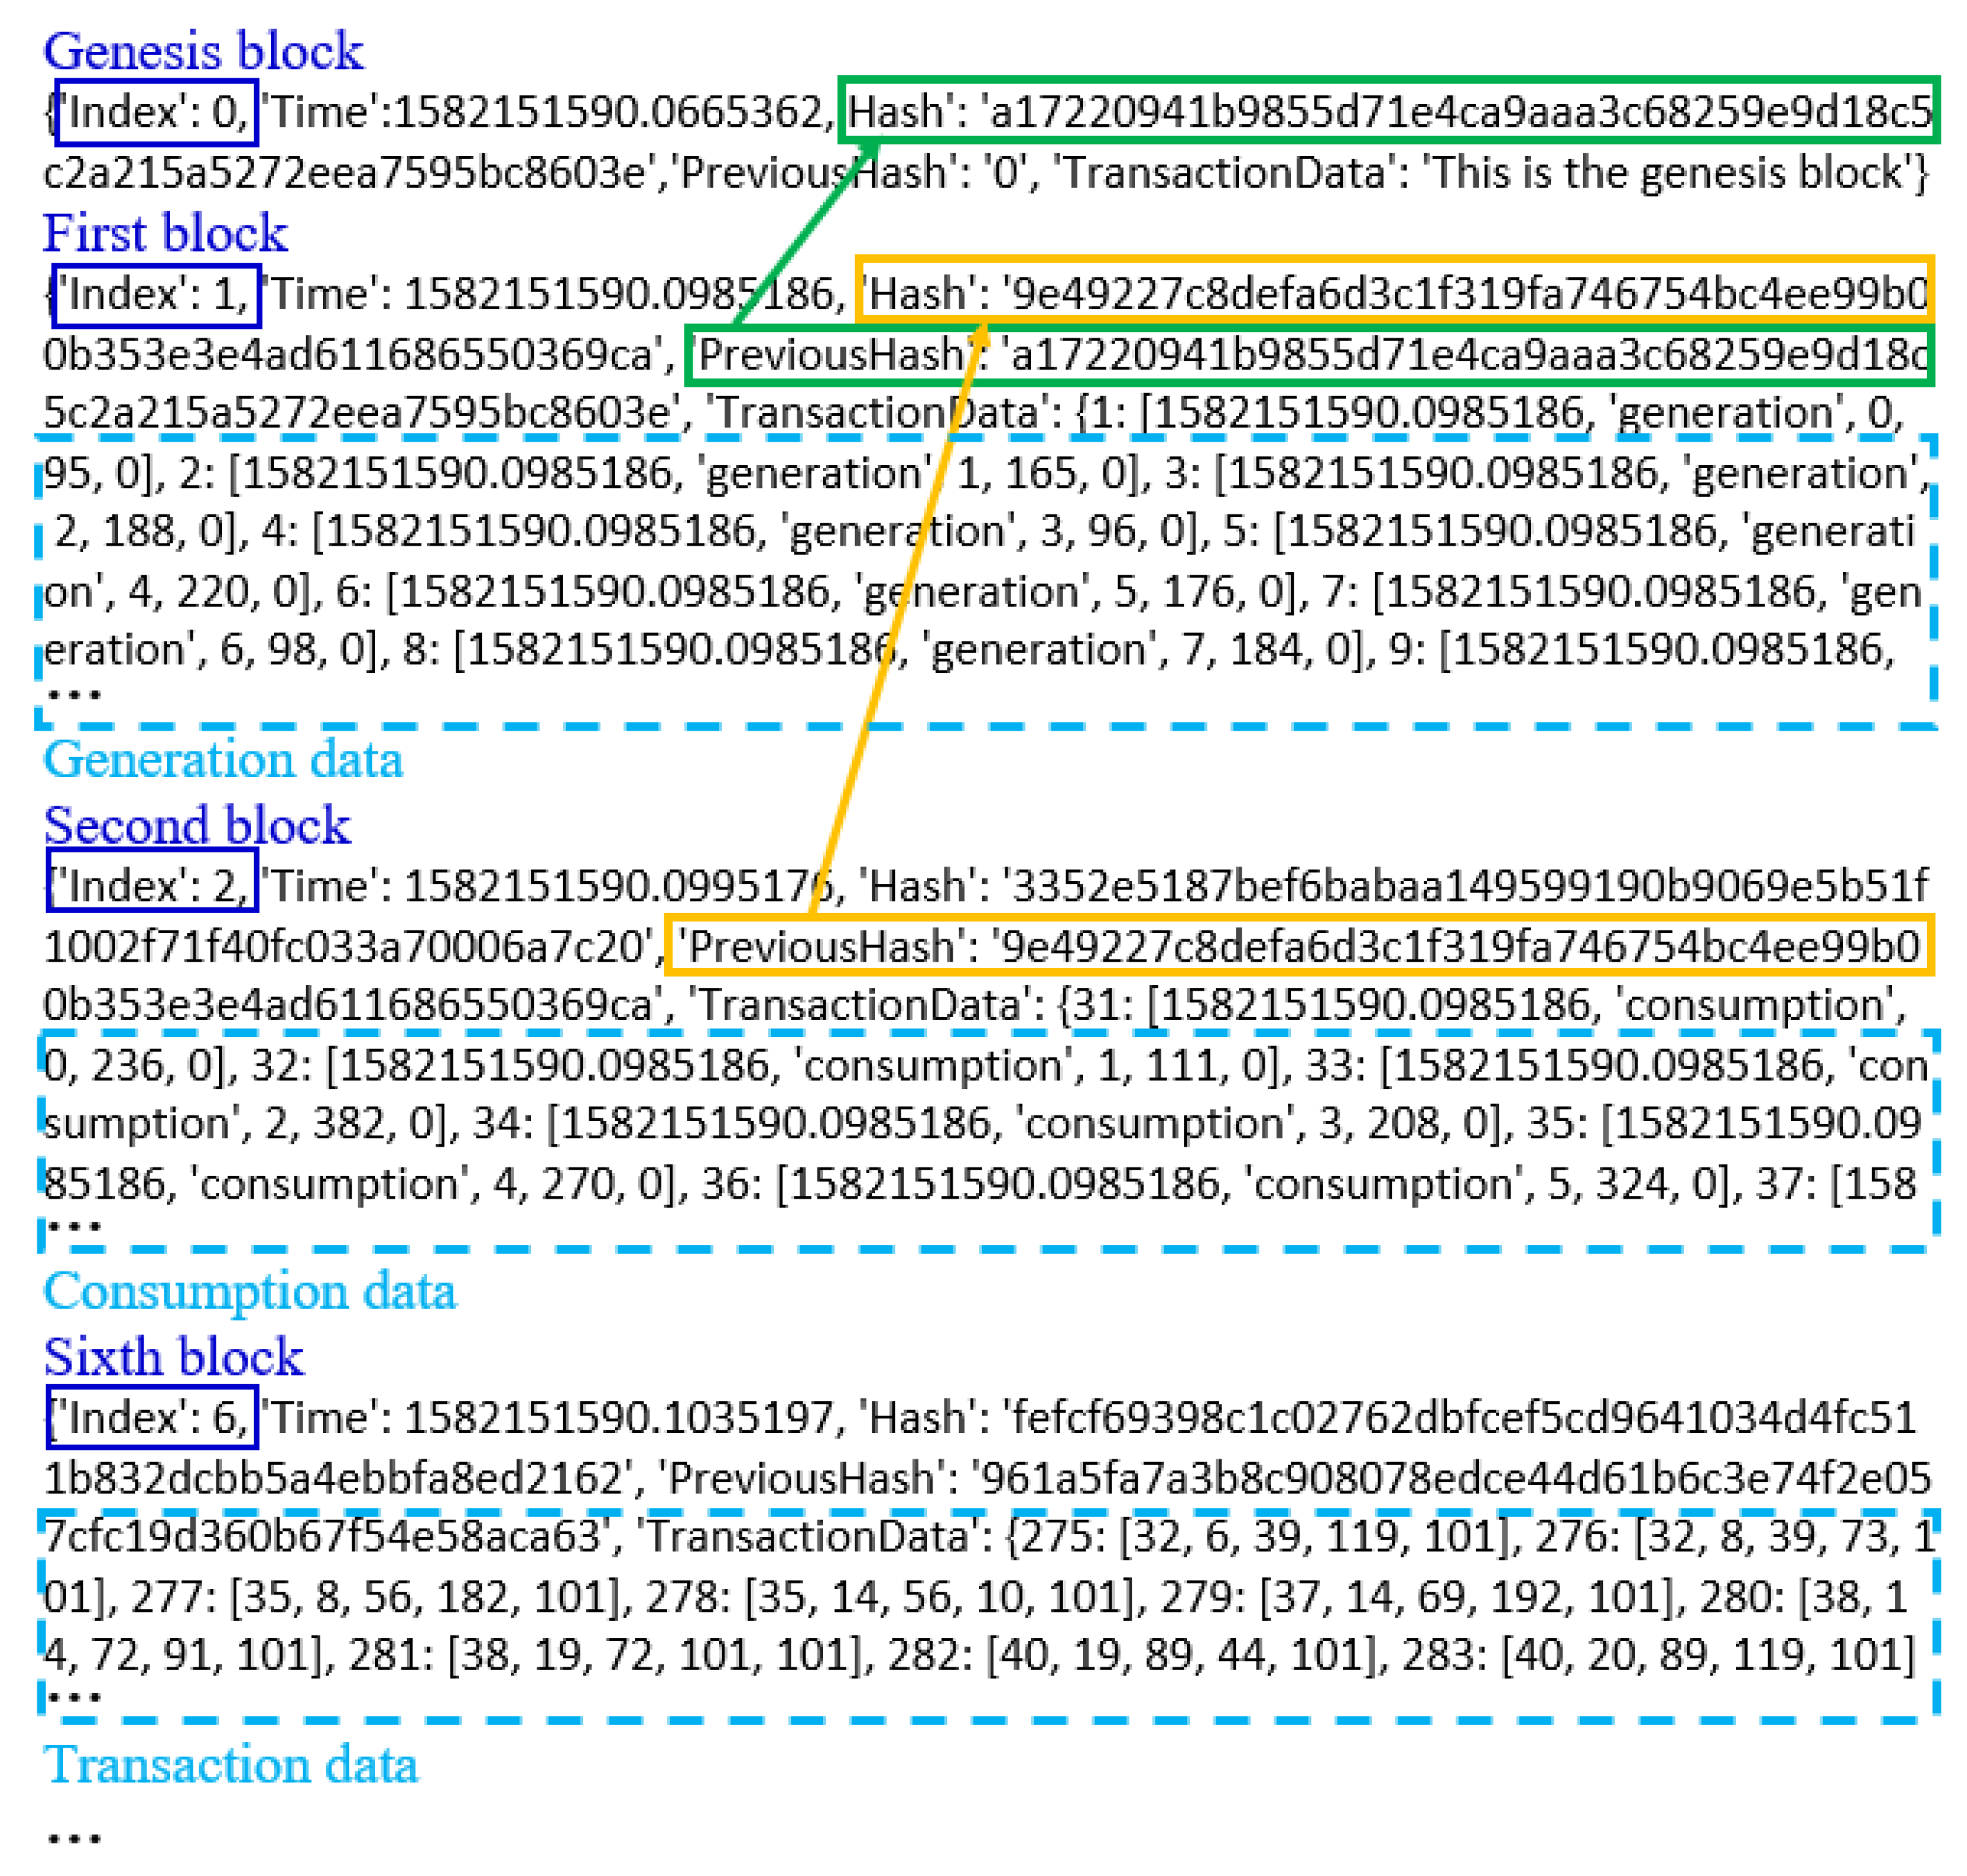
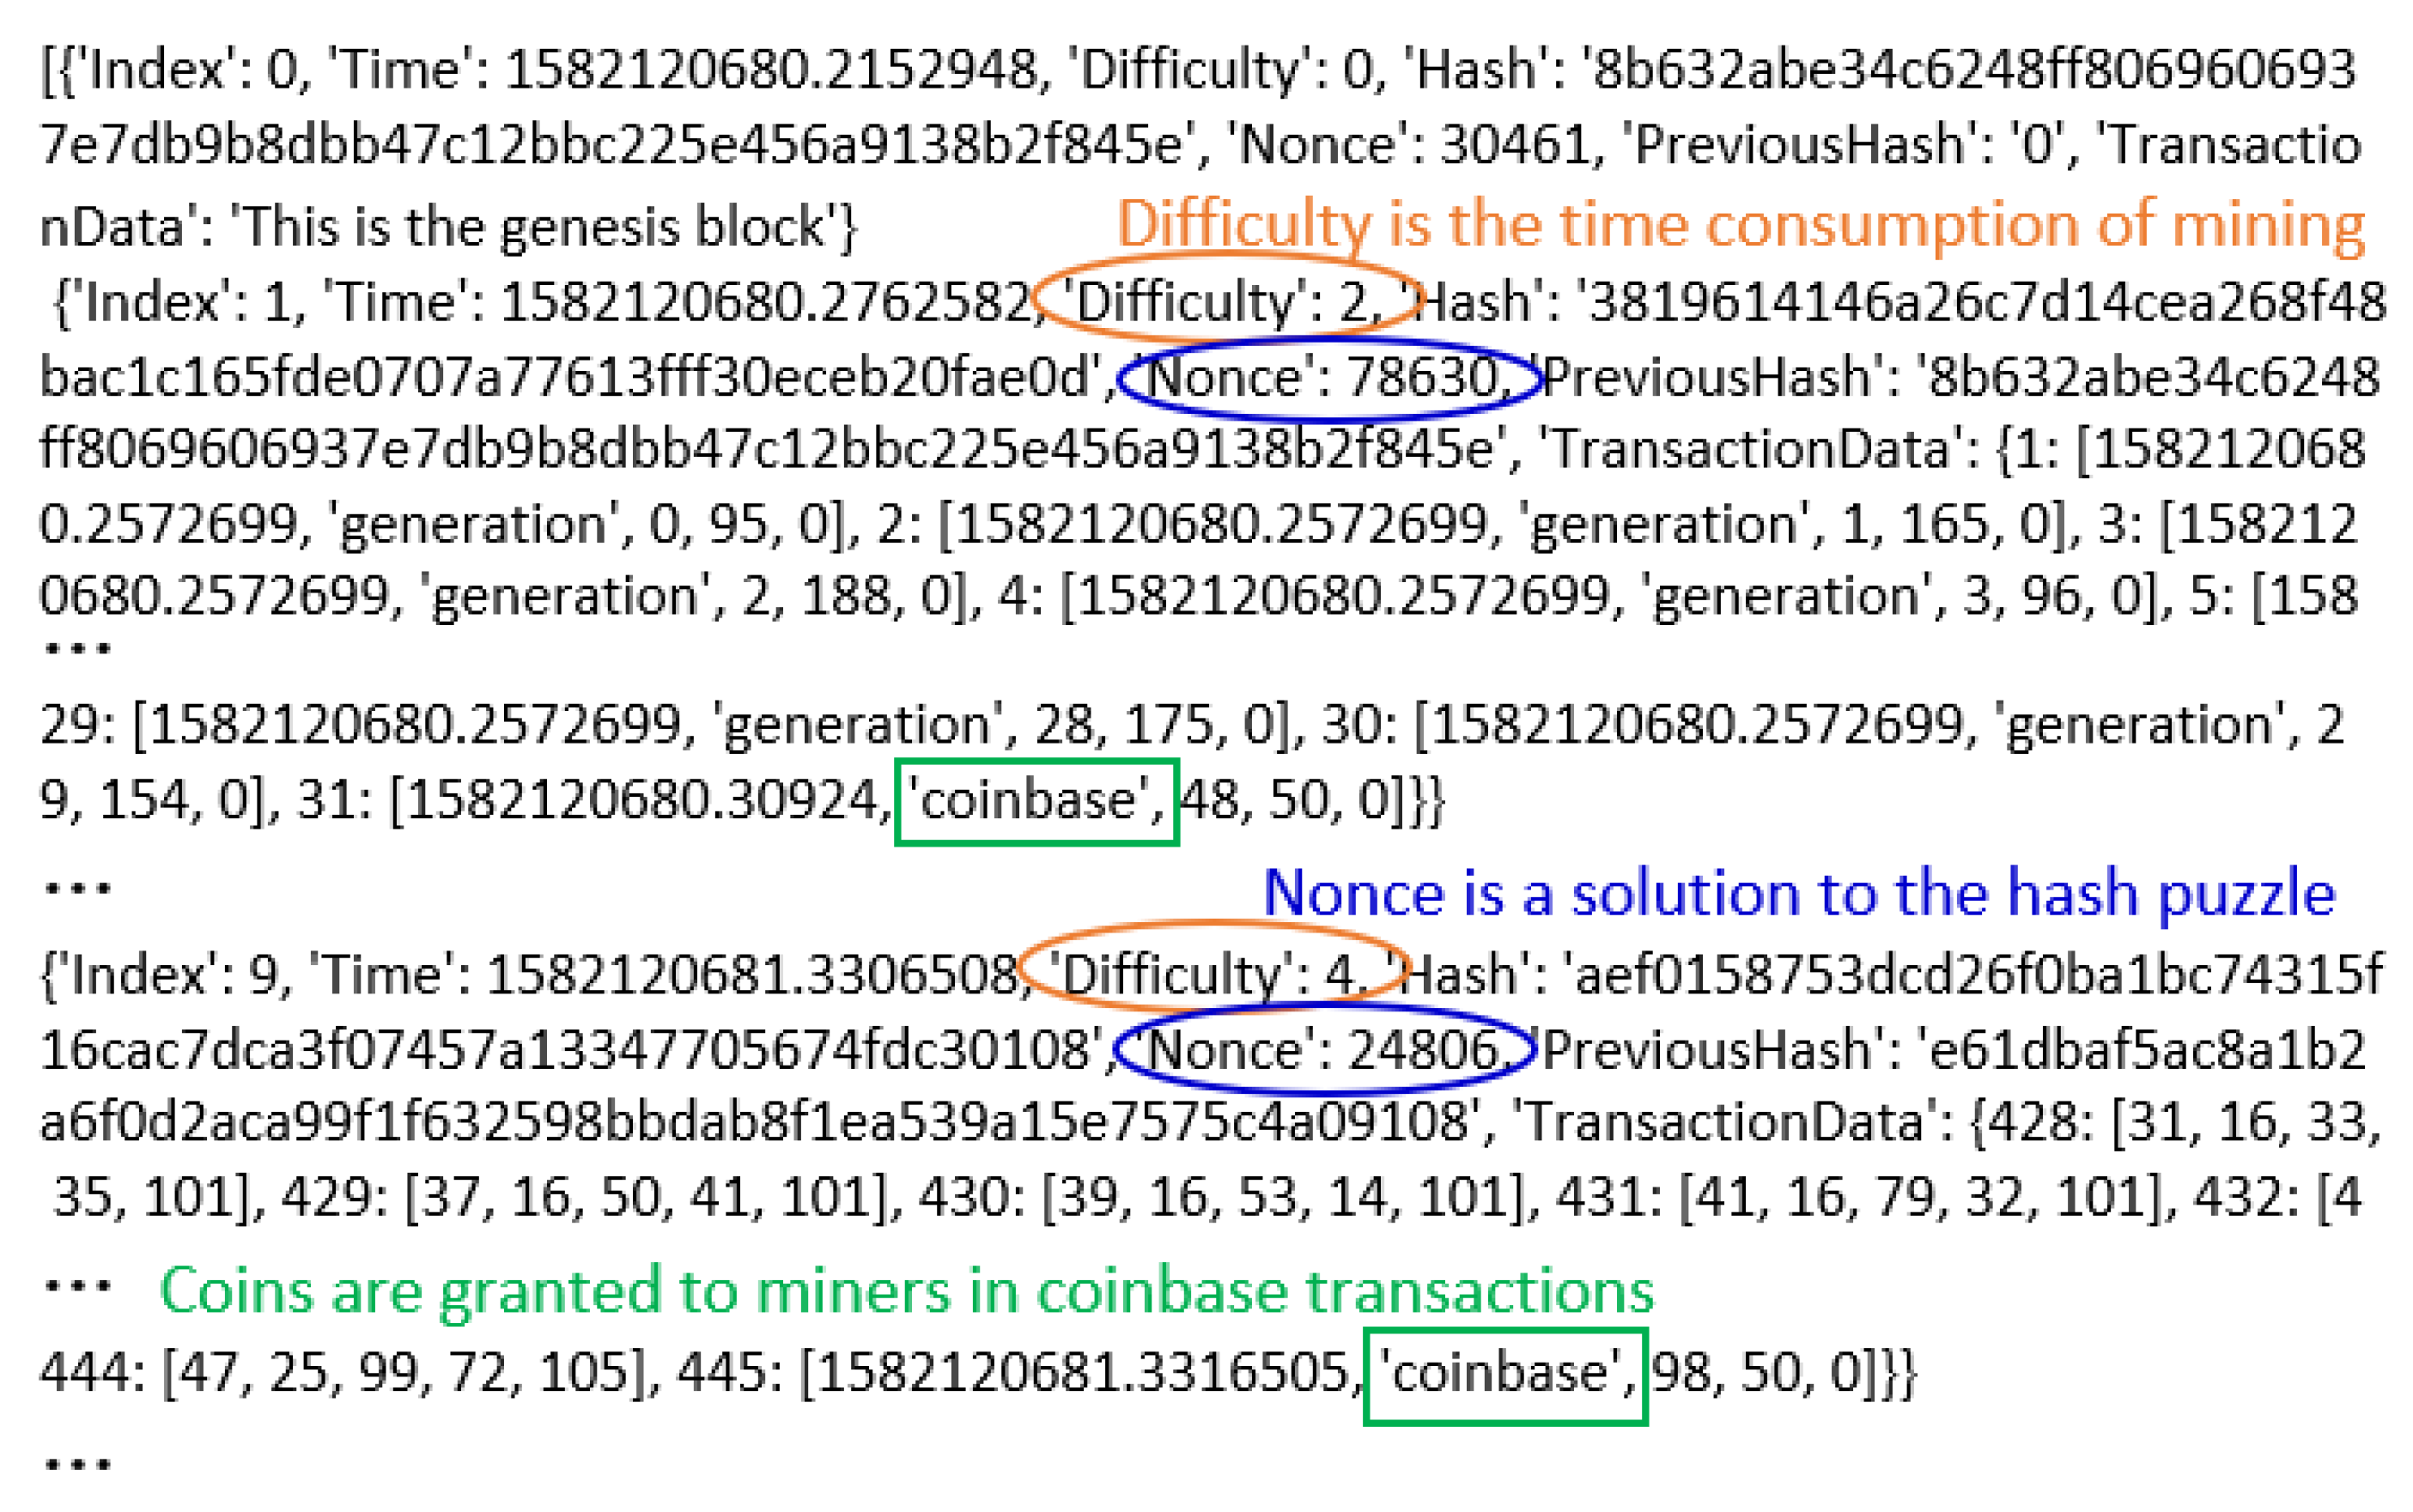
All electricity and transaction data during the simulation period are recorded on I-Green ledgers. Figure A4, Figure A7 and Figure A11 in Appendix A display sample segments of the simulated private, PoG and PoW blockchain ledgers. The content of PoS ledger is similar to that of PoG. Size of four kinds of blockchain ledgers are shown in Table 9. The size of a block is mainly determined by amount of transaction data encapsulated in it, thus the size of a simulated blockchain depends on total amount of market activities during the simulation period. It can be found from Table 9 that, at each network scale, blockchain size slightly increases with a higher norm factor, while it is almost invariant in terms of different protocols. The required storage space for the complete ledger increases linearly with the expanding of the network, reflecting linear increase of transaction amount.
The block generation is simulated in an event-driven manner, without specific block interval or limit on the block size. Block interval and block size are design decisions influenced by data transmission capacity of communication infrastructures, for consistency of a distributed system. Once the block interval and block size limit are determined, system throughput can be estimated by Equation (8), and system latency can be evaluated according to Equation (9).
5.2.2. Security
I-Green blockchain is a distributed system, maintained collectively by participants according to the consensus protocol. Accordingly, the security of I-Green significantly depends on its consensus protocol. Consensus protocols of distributed networks are essentially voting rules, by which an agreement is reached among the majority of participants. Different protocols employ different forms of voting power, such as computational resource of miners in PoW and staked coins of verifiers in PoS. If the majority of voting power is controlled by a single entity, it can dominate the decision-making process of the network and act in the best interest of itself, instead of the whole network. Since concentration of voting power imposes higher attack risk to blockchains, a secure blockchain consensus protocol should retain a certain degree of decentralization and randomness of the verification right. Therefore, we measure the safety of I-Green with different protocols based on verifiers’ distributions.
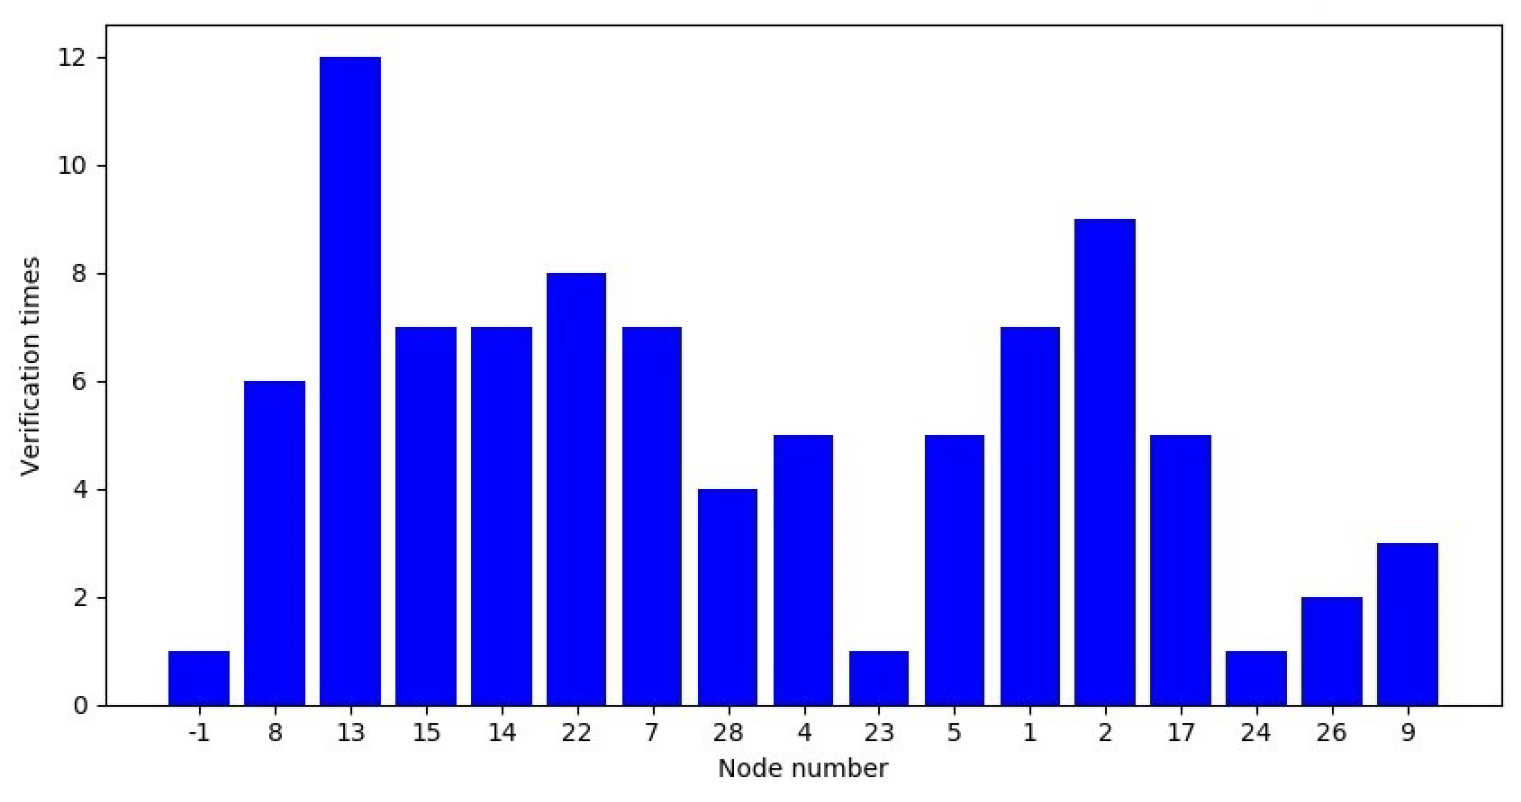
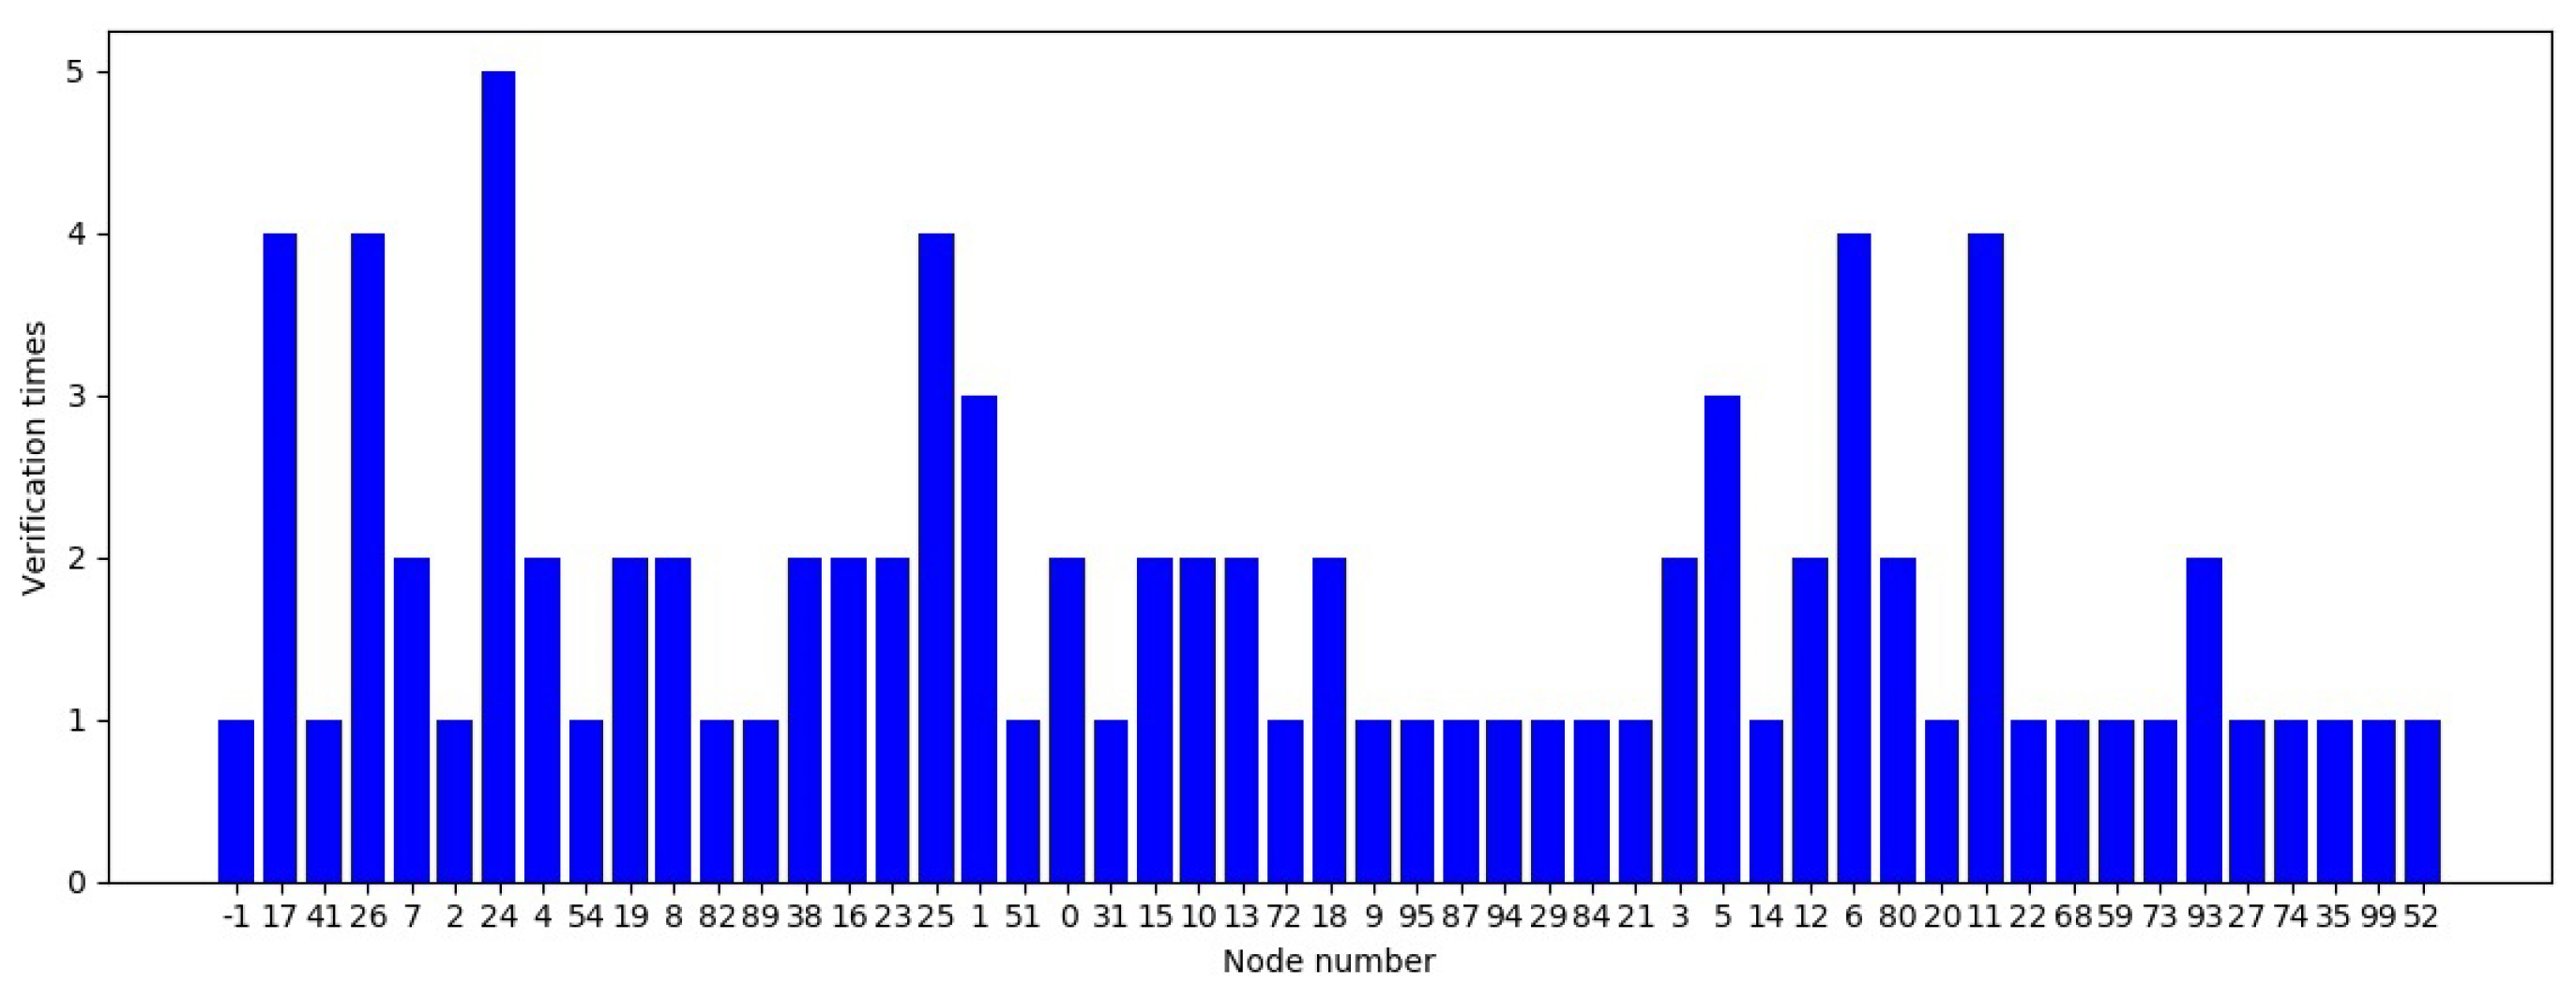
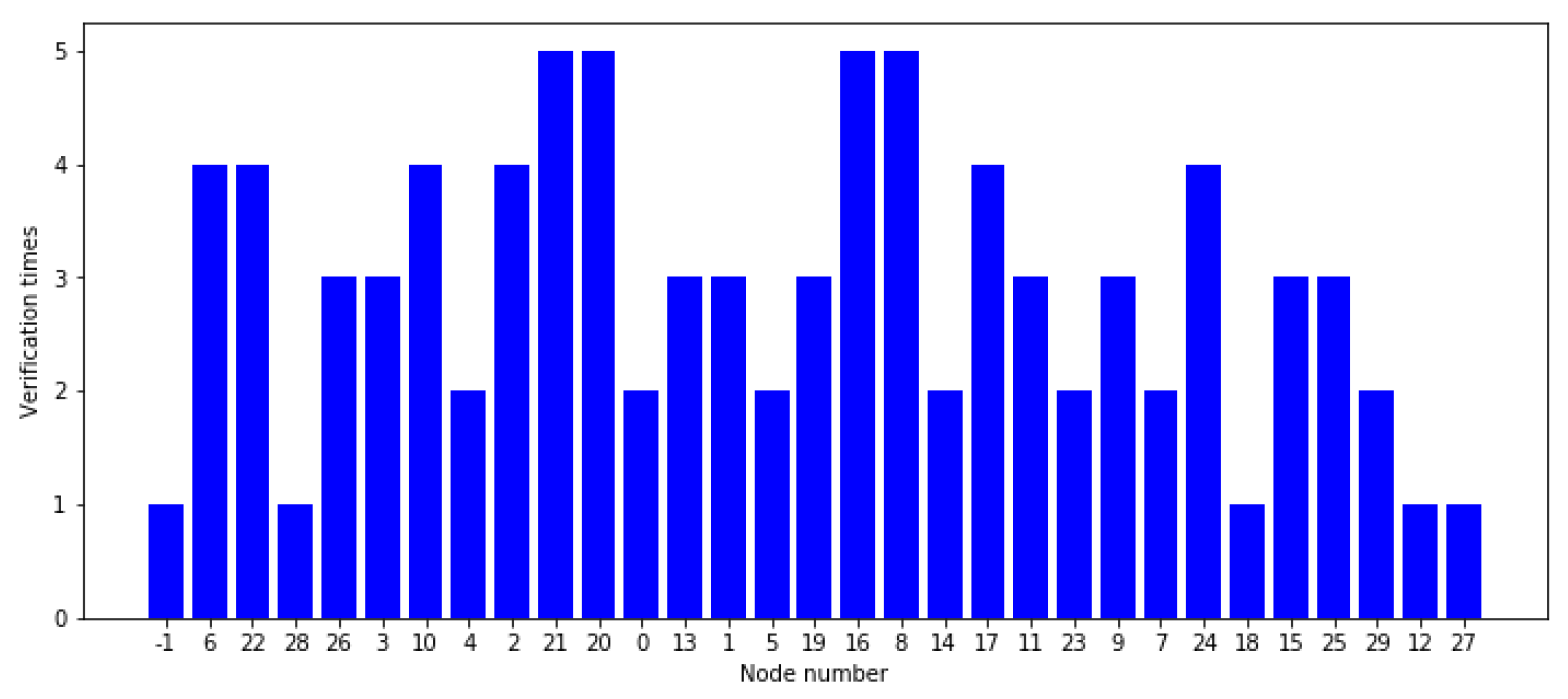
Since verifiers are chosen according to certain resources (electricity generation in PoG, computational power in PoW and staked coins in PoS), verifiers’ distributions are similar under different norm factors. Taking the situation of a small network when norm factor = 10% as an example, we present distributions of validation under three kinds of protocols in Figure 13, Figure 14 and Figure 15. These figures show the verifiers group and number of validations (number of created blocks) conducted by each of them. PoS has the most disperse verifiers group, as any node with coins can run for validation candidates on PoS blockchains. Miners’ verification times on the PoW blockchain present linear correlation with their proportion of hashing power, which confirms PoW’s vulnerability to the concentration of computational resource. The desired situation of a PoW blockchain is that each participant has a small and similar amount of computation resource, while it is hard to realize in practice [55,56].
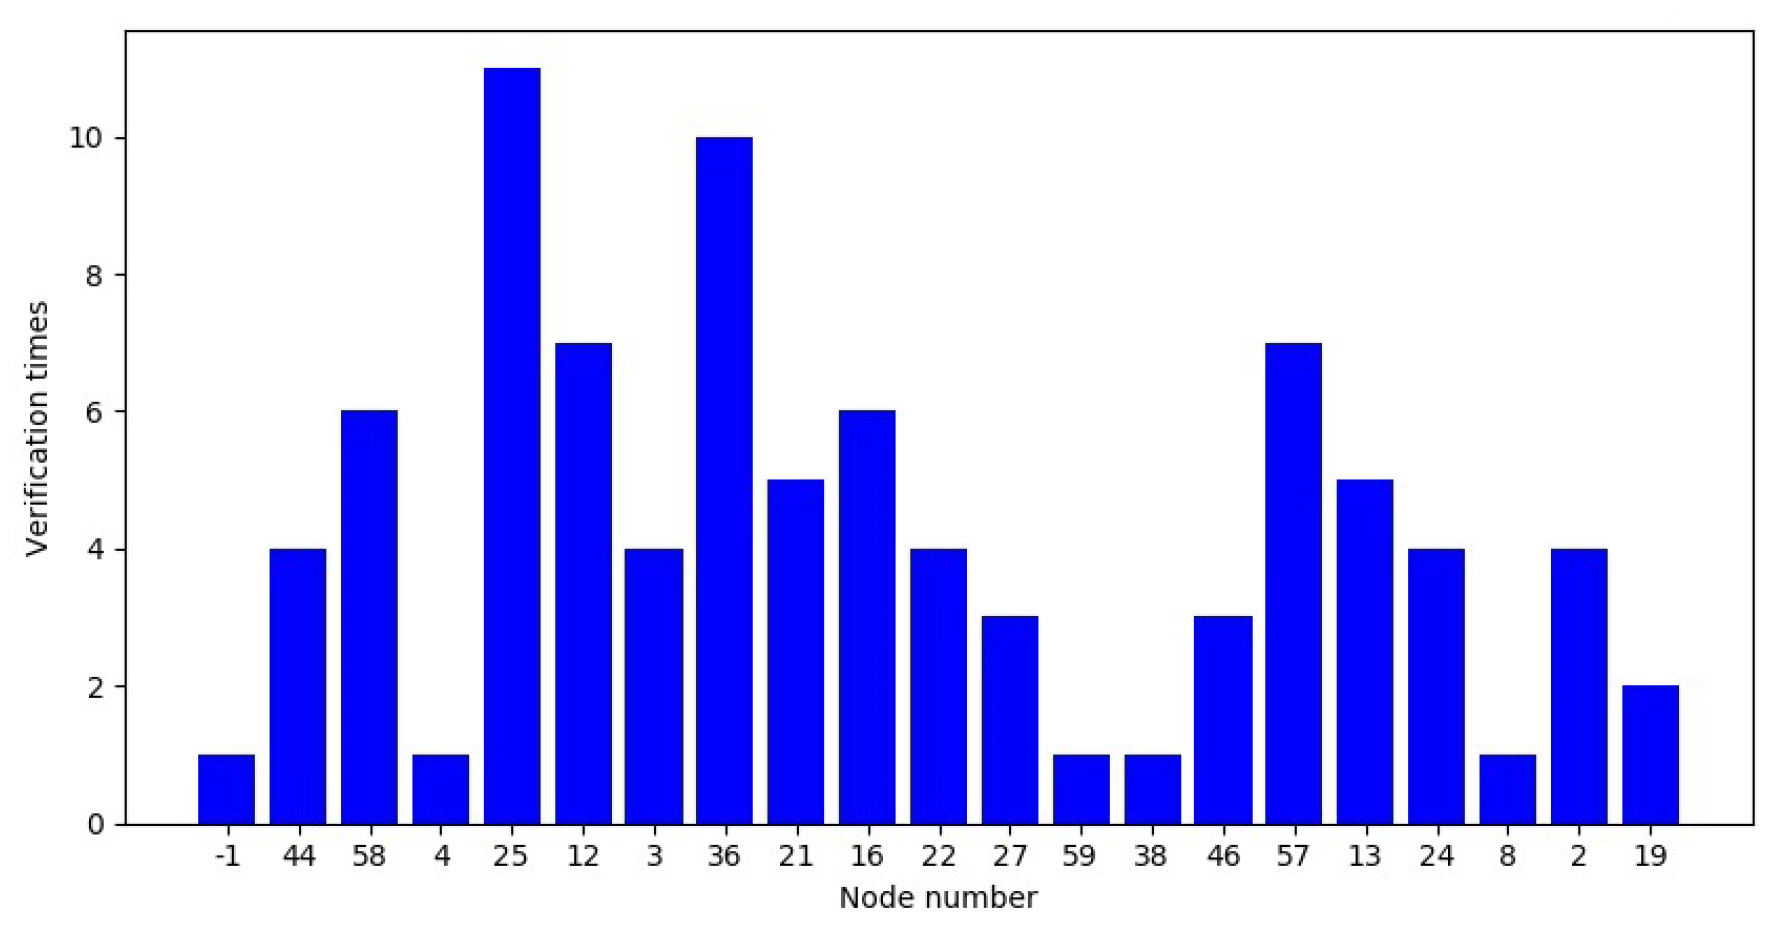
The security of PoG can be improved with a larger group of prosumers or verification candidates. The number of candidates, N is set as 10 in the simulation of PoG blockchain. The distribution of validations when is shown in Figure 16. Compared to Figure 13, verification right of PoG is more decentralized with a larger candidates’ group. On the other hand, the situation of 60% prosumers is simulated, and the result in Figure 17 proves that a higher level of security could be achieved with the increase of prosumer nodes in the network. This is a desired situation, since it is consistent with the goal of the I-Green system to turn more consumers into prosumers.
6. Conclusions
In this paper, the I-Green system is designed and the effectiveness and efficiency are evaluated through a simulation approach. I-Green is a blockchain-based individual green certificates recording and trading system, for promoting distributed generation. It directly involves individual prosumers and consumers, who are not engaged or disadvantaged in conventional green certificates markets. Basing on the theories of social norm and peer effect, and leveraging the transparency and immutability of blockchain technology, we design igreencoin as the cryptocurrency, and the green ratio scheme as the incentive mechanism of I-Green. A novel blockchain consensus protocol, proof of generation (PoG), is particularly designed to synergize the green ratio scheme and improve the efficiency of blockchain.
I-Green system is simulated with different blockchain configurations and varying intensities of the green ratio scheme. Simulated market activities and corresponding green ratios prove the motivation effect of the green ratio scheme. Market is more active with a higher intensity of the incentive scheme, reflecting that more residents are involved in trading igreencoins for adopting renewable energy. Simulation of I-Green with PoG protocol demonstrates its synergy effect—when the intensity of the green ratio scheme is high enough, the incorporation of PoG improves the market liquidity. Simulations of proof of work (PoW) and proof of stake (PoS) protocols do not present the synergy effect as strong as PoG has. According to simulation results, both the green ratio scheme and the PoG protocol are still effective for motivating igreencoins trading as the network scales up from 100 nodes to 10,000 nodes.
Key system properties of I-Green are examined and compared to that of PoW, PoS and private blockchains. The simulation indicates that PoG is more efficient and scalable than PoS and PoW protocols, and that its security can be improved, with more prosumers joining the network. Overall, the simulation provides evidence that I-Green blockchain, with the cryptocurrency igreencoin, green ratio scheme and proof of generation protocol, is an effective and efficient system for promoting distributed renewable energy.
In the design and deployment of blockchains, decisions about configuration options need to be made. Blockchain simulator constructed in this research can be modified to simulate different use cases with blockchain design alternatives, which could provide insights for system performance improvement. Therefore, the simulation framework of this research has potential for facilitating study and test of blockchain applications in broader areas.
Author Contributions
Conceptualization, F.Z. and X.G.; methodology, F.Z. and W.K.C.; software, F.Z.; validation, X.G. and W.K.C.; formal analysis, F.Z.; visualization, F.Z.; writing—original draft preparation, F.Z.; writing—review and editing, F.Z., X.G. and W.K.C.; supervision, X.G. All authors have read and agreed to the published version of the manuscript.
Funding
This research received no external funding.
Conflicts of Interest
The authors declare no conflict of interest.
Abbreviations
The following abbreviations are used in this manuscript:
| ICT | Information communication technology |
| DERs | Distributed energy resources |
| DESS | Distributed energy storage system |
| PV | Photovoltaic |
| RECs | Renewable energy certificates |
| TGCs | Tradable green certificates |
| PoW | Proof of work |
| PoS | Proof of stake |
| DPoS | Delegated proof of stake |
| pBFT | Practical Byzantine fault tolerance |
| PoG | Proof of generation |
| SD | Standard deviation |
Appendix A. Simulation Results of a Small Community
Appendix A.1. Simulated Electricity Data of 100 Nodes
Figure A1.
Statistics of daily consumption of 100 nodes.

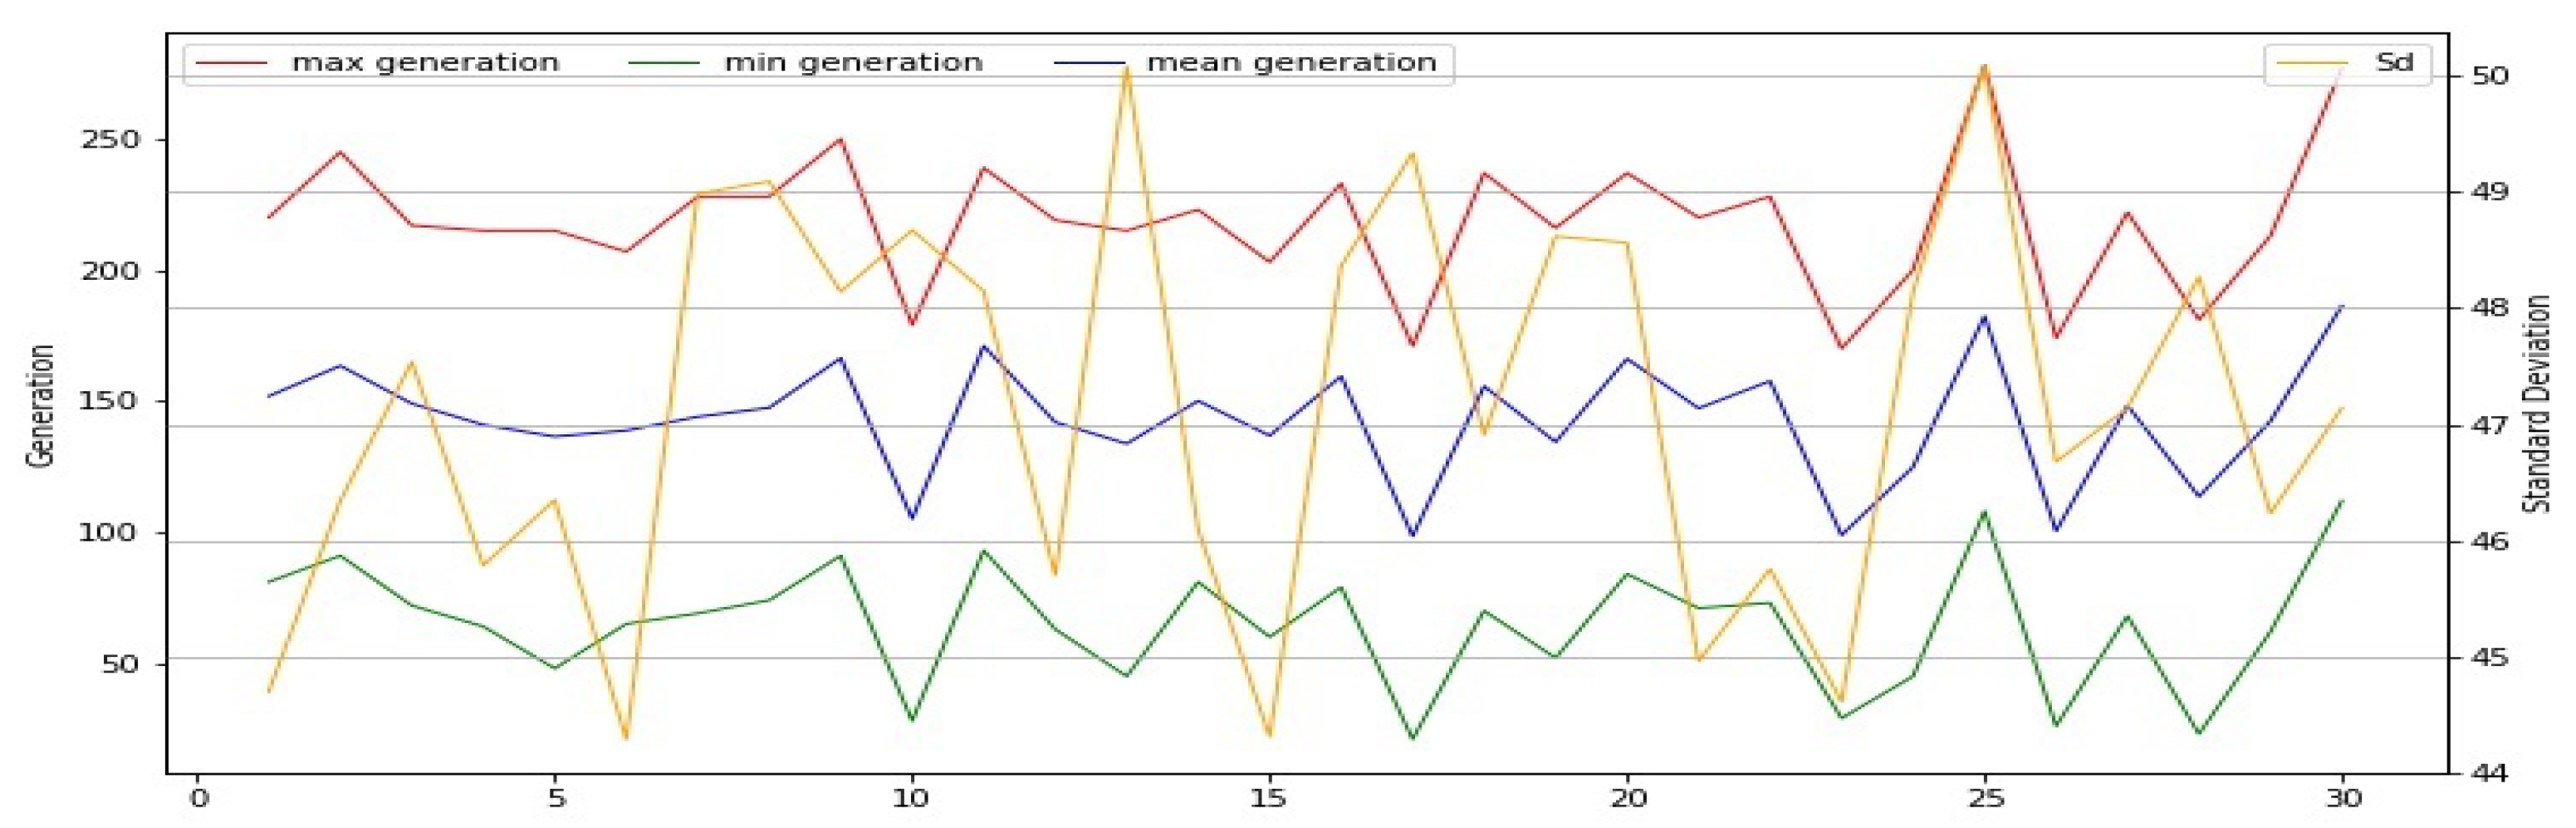
Figure A2.
Statistics of daily generation of 100 nodes.

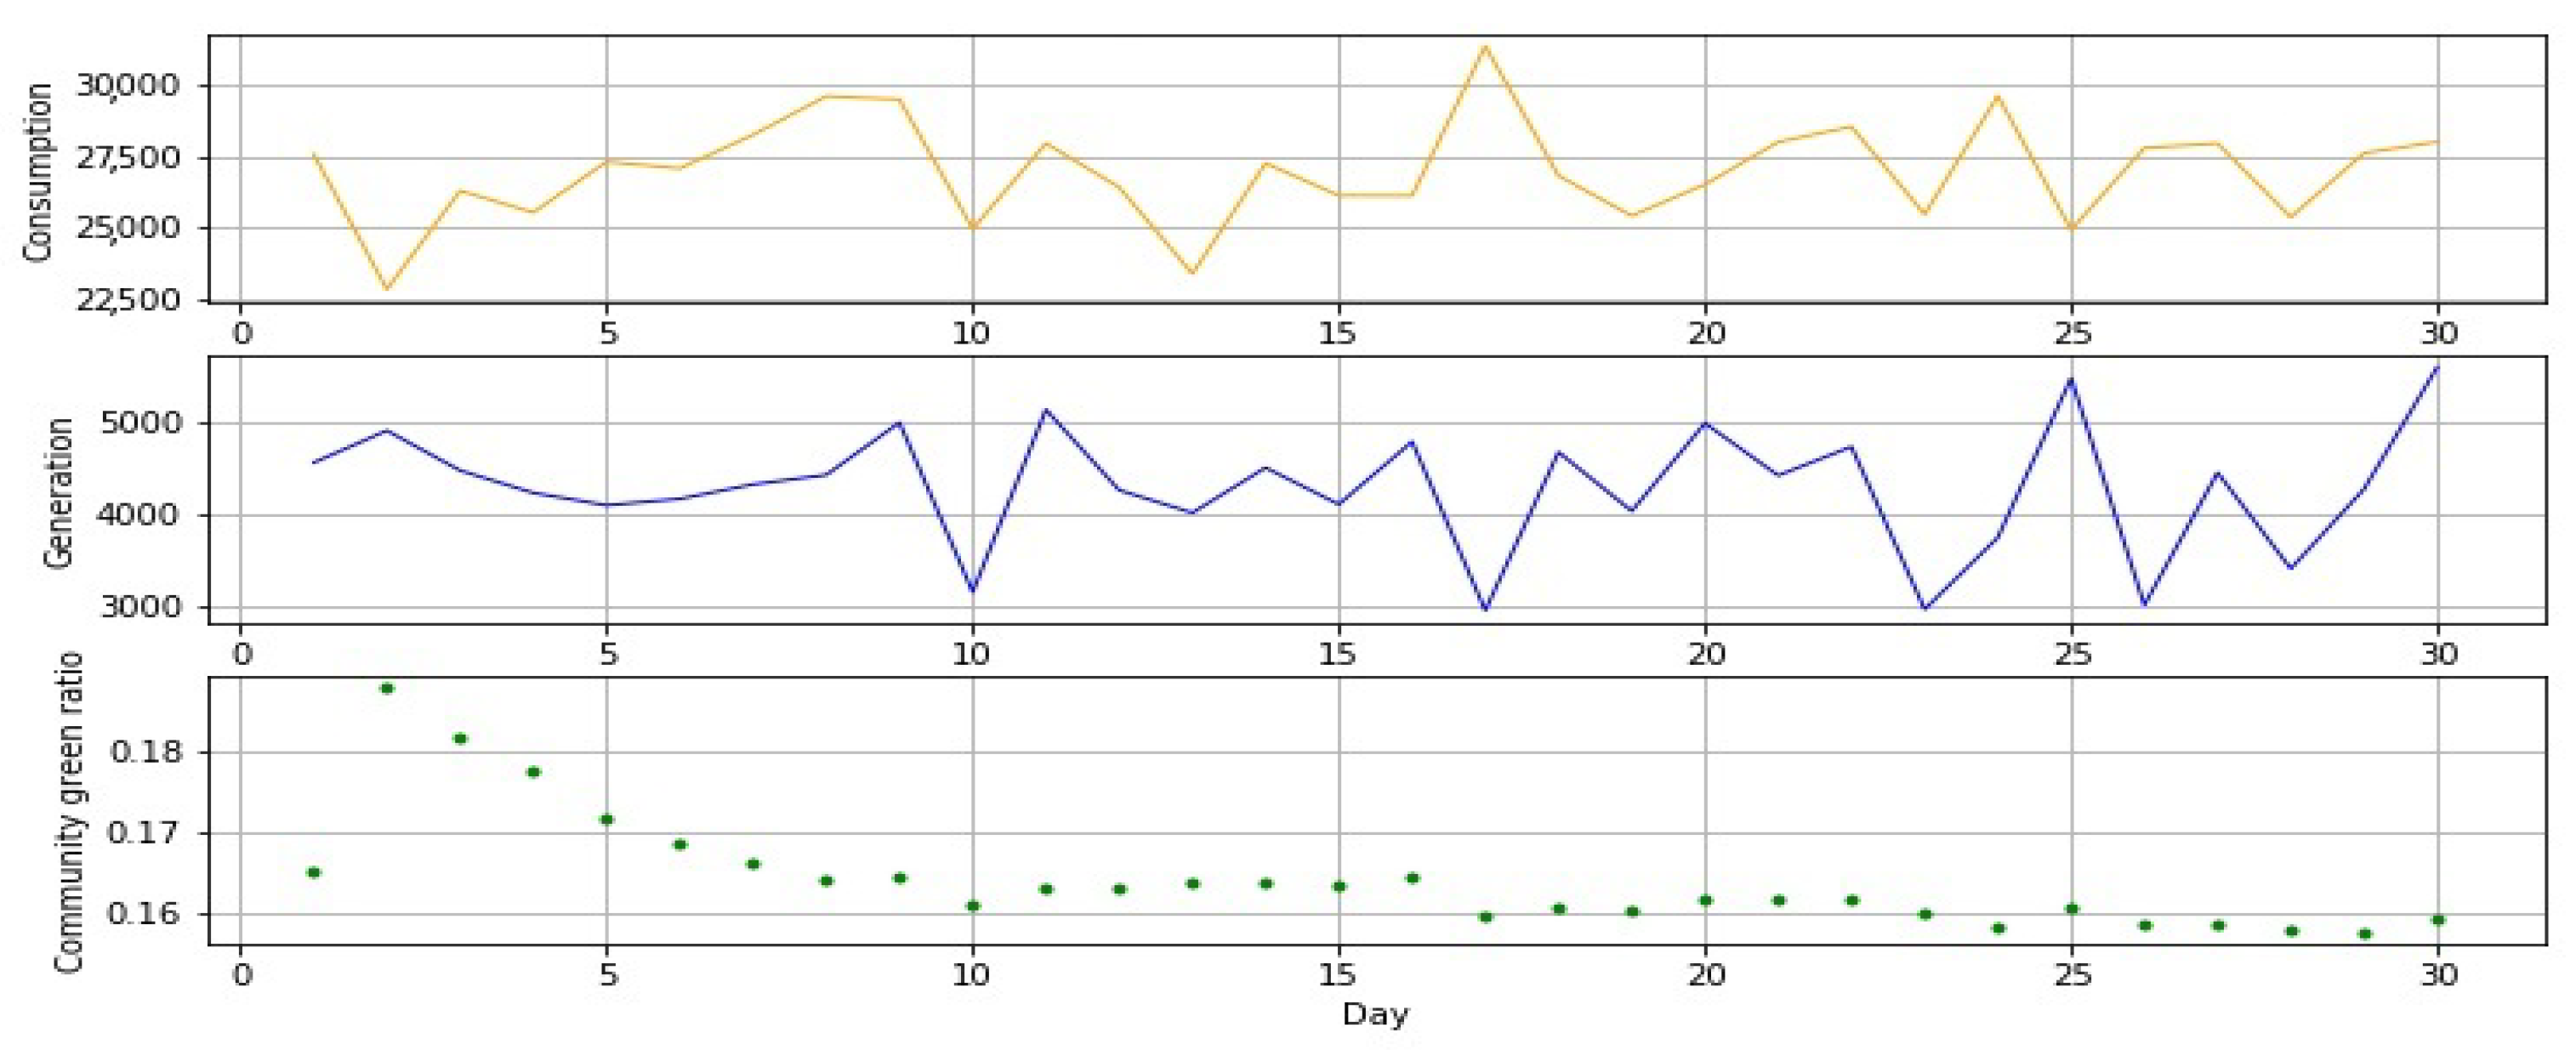
Figure A3.
Daily total generation, total consumption of 100 nodes and community green ratio.

Appendix A.2. Simulation Results of 100 Nodes on a Private Blockchain
Figure A4.
A segment of private blockchain ledger, 100 nodes, norm factor = 10%.

Figure A5.
Change of green ratios’ distribution through trading, norm factor = 90%.

Figure A6.
Statistics of daily individuals’ green ratios, norm factor = 90%.

Appendix A.3. Simulation Results of 100 Nodes on PoG Blockchain
Figure A7.
A segment of PoG blockchain ledger, 100 nodes, norm factor = 10%.

Figure A8.
Statistics of daily individuals’ green ratios, norm factor = 10%.

Figure A9.
Statistics of daily individuals’ green ratios, norm factor = 50%.

Figure A10.
Statistics of daily individuals’ green ratios, norm factor = 90%.

Appendix A.4. Simulation Results of 100 Nodes on PoW Blockchain
Figure A11.
A segment of PoW blockchain ledger, 100 nodes, norm factor = 10%.

Figure A12.
Market of 100 nodes on PoW blockchain, norm factor = 10%.

Figure A13.
Market of 100 nodes on PoW blockchain, norm factor = 50%.

Figure A14.
Market of 100 nodes on PoW blockchain, norm factor = 90%.

Figure A15.
Statistics of daily individuals’ green ratios, norm factor = 10%.

Figure A16.
Statistics of daily individuals’ green ratios, norm factor = 50%.

Figure A17.
Statistics of daily individuals’ green ratios, norm factor = 90%.

Appendix A.5. Simulation Results of 100 Nodes on PoS Blockchain
Figure A18.
Market of 100 nodes on PoS blockchain, norm factor = 10%.

Figure A19.
Market of 100 nodes on PoS blockchain, norm factor = 50%.

Figure A20.
Market of 100 nodes on PoS blockchain, norm factor = 90%.

Figure A21.
Statistics of daily individuals’ green ratios, norm factor = 10%.

Figure A22.
Statistics of daily individuals’ green ratios, norm factor = 50%.

Figure A23.
Statistics of daily individuals’ green ratios, norm factor = 90%.

Appendix B. Simulation Results of a Medium and a Large Community on Private and PoG Blockchain

Table A1.
Mean of market variables, 1000 nodes, PoG blockchain.
| Norm Factor | Number of | Size of | Price | SD (Green Ratios) | ||||
|---|---|---|---|---|---|---|---|---|
| Bid | Ask | Transactions | Bid | Ask | Transactions | |||
| 10% | 65 | 301 | 124 | 7923 | 40,292 | 7923 | 102.06 | 0.25 |
| 50% | 348 | 291 | 462 | 24,887 | 34,580 | 20,474 | 108.75 | 0.12 |
| 90% | 631 | 290 | 601 | 41,084 | 33,659 | 23,285 | 112.99 | 0.11 |
Table A2.
Mean of market variables, 10,000 nodes, PoG blockchain.
| Norm Factor | Number of | Size of | Price | SD (Green Ratios) | ||||
|---|---|---|---|---|---|---|---|---|
| Bid | Ask | Transactions | Bid | Ask | Transactions | |||
| 10% | 625 | 3001 | 1204 | 78,877 | 403,956 | 78,877 | 102.05 | 0.25 |
| 50% | 3463 | 2938 | 4703 | 248,602 | 349,550 | 212,507 | 108.85 | 0.13 |
| 90% | 6307 | 2916 | 6093 | 413,229 | 339,149 | 240,766 | 113.12 | 0.11 |
Table A3.
Mean of market variables, 1000 nodes, private blockchain.
| Norm Factor | Number of | Size of | Price | SD (Green Ratios) | ||||
|---|---|---|---|---|---|---|---|---|
| Bid | Ask | Transactions | Bid | Ask | Transactions | |||
| 10% | 62 | 302 | 118 | 7581 | 40,327 | 7581 | 101.98 | 0.25 |
| 50% | 344 | 292 | 460 | 24,285 | 34,703 | 20,341 | 108.65 | 0.13 |
| 90% | 630 | 292 | 595 | 41,088 | 33,847 | 23,088 | 112.95 | 0.11 |
Table A4.
Mean of market variables, 10,000 nodes, private blockchain.
| Norm Factor | Number of | Size of | Price | SD (Green Ratios) | ||||
|---|---|---|---|---|---|---|---|---|
| Bid | Ask | Transactions | Bid | Ask | Transactions | |||
| 10% | 641 | 3000 | 1233 | 80,385 | 403,390 | 80,385 | 102.09 | 0.25 |
| 50% | 3465 | 2936 | 4699 | 248,472 | 349,593 | 212,424 | 108.87 | 0.13 |
| 90% | 6300 | 2914 | 6105 | 412,533 | 339,005 | 241,203 | 113.12 | 0.11 |
References
- Ackermann, T.; Andersson, G.; Söder, L. Distributed generation: A definition. Electr. Power Syst. Res. 2001, 57, 195–204. [Google Scholar] [CrossRef]
- Akorede, M.F.; Hizam, H.; Pouresmaeil, E. Distributed energy resources and benefits to the environment. Renew. Sustain. Energy Rev. 2010, 14, 724–734. [Google Scholar] [CrossRef]
- Lasseter, R.H. Microgrids and distributed generation. J. Energy Eng. 2007, 133, 144–149. [Google Scholar] [CrossRef]
- Soshinskaya, M.; Crijns-Graus, W.H.; Guerrero, J.M.; Vasquez, J.C. Microgrids: Experiences, barriers and success factors. Renew. Sustain. Energy Rev. 2014, 40, 659–672. [Google Scholar] [CrossRef] [Green Version]
- Zhang, F.; Deng, H.; Margolis, R.; Su, J. Analysis of distributed-generation photovoltaic deployment, installation time and cost, market barriers, and policies in China. Energy Policy 2015, 81, 43–55. [Google Scholar] [CrossRef] [Green Version]
- Von Wirth, T.; Gislason, L.; Seidl, R. Distributed energy systems on a neighborhood scale: Reviewing drivers of and barriers to social acceptance. Renew. Sustain. Energy Rev. 2018, 82, 2618–2628. [Google Scholar] [CrossRef]
- Rai, V.; Robinson, S.A. Effective information channels for reducing costs of environmentally-friendly technologies: Evidence from residential PV markets. Environ. Res. Lett. 2013, 8, 014044. [Google Scholar] [CrossRef]
- Nilsson, M.; Sundqvist, T. Using the market at a cost: How the introduction of green certificates in Sweden led to market inefficiencies. Util. Policy 2007, 15, 49–59. [Google Scholar] [CrossRef]
- Bergek, A.; Jacobsson, S. Are tradable green certificates a cost-efficient policy driving technical change or a rent-generating machine? Lessons from Sweden 2003–2008. Energy Policy 2010, 38, 1255–1271. [Google Scholar] [CrossRef] [Green Version]
- Nakamoto, S. Bitcoin: A Peer-to-Peer Electronic Cash System. 2008. Available online: http://bitcoin.org/bitcoin.pdf (accessed on 23 April 2020).
- Buterin, V. A next-generation smart contract and decentralized application platform. White Pap. 2014, 3, 37. [Google Scholar]
- Adams, R.; Parry, G.; Godsiff, P.; Ward, P. The future of money and further applications of the blockchain. Strateg. Chang. 2017, 26, 417–422. [Google Scholar] [CrossRef]
- Chen, D. Utility of the blockchain for climate mitigation. J. Br. Blockchain Assoc. 2018, 1, 3577. [Google Scholar] [CrossRef] [Green Version]
- Franke, L.A.; Schletz, M.; Salomo, S. Designing a Blockchain Model for the Paris Agreement’s Carbon Market Mechanism. Sustainability 2020, 12, 1068. [Google Scholar] [CrossRef] [Green Version]
- Khaqqi, K.N.; Sikorski, J.J.; Hadinoto, K.; Kraft, M. Incorporating seller/buyer reputation-based system in blockchain-enabled emission trading application. Appl. Energy 2018, 209, 8–19. [Google Scholar] [CrossRef]
- Kouhizadeh, M.; Sarkis, J. Blockchain practices, potentials, and perspectives in greening supply chains. Sustainability 2018, 10, 3652. [Google Scholar] [CrossRef] [Green Version]
- Le Sève, M.D.; Mason, N.; Nassiry, D. Delivering Blockchain’s Potential for Environmental Sustainability. 2018. Available online: https://www.odi.org/sites/odi.org.uk/files/resource-documents/12439.pdf (accessed on 23 April 2020).
- Kounelis, I.; Steri, G.; Giuliani, R.; Geneiatakis, D.; Neisse, R.; Nai-Fovino, I. Fostering consumers’ energy market through smart contracts. In Proceedings of the 2017 International Conference in Energy and Sustainability in Small Developing Economies (ES2DE), Funchal, Portugal, 10–12 July 2017; pp. 1–6. [Google Scholar]
- Aitzhan, N.Z.; Svetinovic, D. Security and privacy in decentralized energy trading through multi-signatures, blockchain and anonymous messaging streams. IEEE Trans. Dependable Secure Comput. 2016, 15, 840–852. [Google Scholar] [CrossRef]
- Münsing, E.; Mather, J.; Moura, S. Blockchains for decentralized optimization of energy resources in microgrid networks. In Proceedings of the 2017 IEEE conference on control technology and applications (CCTA), Mauna Lani, HI, USA, 27–30 August 2017; pp. 2164–2171. [Google Scholar]
- Afzal, M.; Huang, Q.; Amin, W.; Umer, K.; Raza, A.; Naeem, M. Blockchain Enabled Distributed Demand Side Management in Community Energy System With Smart Homes. IEEE Access 2020, 8, 37428–37439. [Google Scholar] [CrossRef]
- Talat, R.; Muzammal, M.; Qu, Q.; Zhou, W.; Najam-ul Islam, M.; Bamakan, S.H.; Qiu, J. A Decentralized System for Green Energy Distribution in a Smart Grid. J. Energy Eng. 2020, 146, 04019036. [Google Scholar] [CrossRef]
- Lansky, J. Possible state approaches to cryptocurrencies. J. Syst. Integr. 2018, 9, 19–31. [Google Scholar] [CrossRef]
- Leonhard, R. Developing Renewable Energy Credits as Cryptocurrency on Ethereum’s Blockchain. 2016. Available online: https://papers.ssrn.com/sol3/papers.cfm?abstract_id=2885335 (accessed on 23 April 2020).
- Imbault, F.; Swiatek, M.; De Beaufort, R.; Plana, R. The green blockchain: Managing decentralized energy production and consumption. In Proceedings of the 2017 IEEE International Conference on Environment and Electrical Engineering and 2017 IEEE Industrial and Commercial Power Systems Europe (EEEIC/I&CPS Europe), Milan, Italy, 6–9 June 2017; pp. 1–5. [Google Scholar]
- Khatoon, A.; Verma, P.; Southernwood, J.; Massey, B.; Corcoran, P. Blockchain in Energy Efficiency: Potential Applications and Benefits. Energies 2019, 12, 3317. [Google Scholar] [CrossRef] [Green Version]
- Castellanos, J.A.F.; Coll-Mayor, D.; Notholt, J.A. Cryptocurrency as guarantees of origin: Simulating a green certificate market with the Ethereum Blockchain. In Proceedings of the 2017 IEEE International Conference on Smart Energy Grid Engineering (SEGE), Oshawa, ON, Canada, 14–17 August 2017; pp. 367–372. [Google Scholar]
- Coignard, J.; Munsing, E.; MacDonald, J.; Mather, J. Co-simulation Framework for Blockchain Based Market Designs and Grid Simulations. In Proceedings of the 2018 IEEE Power & Energy Society General Meeting (PESGM), Portland, OR, USA, 5–10 August 2018; pp. 1–5. [Google Scholar]
- Mengelkamp, E.; Notheisen, B.; Beer, C.; Dauer, D.; Weinhardt, C. A blockchain-based smart grid: Towards sustainable local energy markets. Comput. Sci.-Res. Dev. 2018, 33, 207–214. [Google Scholar] [CrossRef]
- Hayes, B.P.; Thakur, S.; Breslin, J.G. Co-simulation of electricity distribution networks and peer to peer energy trading platforms. Int. J. Electr. Power Energy Syst. 2020, 115, 105419. [Google Scholar] [CrossRef]
- Mihaylov, M.; Jurado, S.; Avellana, N.; Van Moffaert, K.; de Abril, I.M.; Nowé, A. NRGcoin: Virtual currency for trading of renewable energy in smart grids. In Proceedings of the 11th International conference on the European Energy Market (EEM14), Krakow, Poland, 28–30 May 2014; pp. 1–6. [Google Scholar]
- Mihaylov, M.; Jurado, S.; Avellana, N.; Razo-Zapata, I.; Van Moffaert, K.; Arco, L.; Bezunartea, M.; Grau, I.; Cañadas, A.; Nowé, A. Scanergy: A scalable and modular system for energy trading between prosumers. In Proceedings of the 2015 International Conference on Autonomous Agents and Multiagent Systems, Istanbul, Turkey, 4–8 May 2015; pp. 1917–1918. [Google Scholar]
- Mihaylov, M.; Razo-Zapata, I.; Rădulescu, R.; Jurado, S.; Avellana, N.; Nowé, A. Smart grid demonstration platform for renewable energy exchange. In International Conference on Practical Applications of Agents and Multi-Agent Systems; Springer: Berlin, Germany, 2016; pp. 277–280. [Google Scholar]
- Alharby, M.; van Moorsel, A. Blocksim: A simulation framework for blockchain systems. ACM Sigmetrics Perform. Eval. Rev. 2019, 46, 135–138. [Google Scholar] [CrossRef]
- Gervais, A.; Karame, G.O.; Wüst, K.; Glykantzis, V.; Ritzdorf, H.; Capkun, S. On the security and performance of proof of work blockchains. In Proceedings of the 2016 ACM SIGSAC Conference on Computer and Communications Security, Vienna, Austria, 24–28 October 2016; pp. 3–16. [Google Scholar]
- Göbel, J.; Keeler, H.P.; Krzesinski, A.E.; Taylor, P.G. Bitcoin blockchain dynamics: The selfish-mine strategy in the presence of propagation delay. Perform. Eval. 2016, 104, 23–41. [Google Scholar] [CrossRef] [Green Version]
- Yasaweerasinghelage, R.; Staples, M.; Weber, I. Predicting latency of blockchain-based systems using architectural modelling and simulation. In Proceedings of the 2017 IEEE International Conference on Software Architecture (ICSA), Gothenburg, Sweden, 3–7 April 2017; pp. 253–256. [Google Scholar]
- Stoykov, L.; Zhang, K.; Jacobsen, H.A. Vibes: Fast blockchain simulations for large-scale peer-to-peer networks. In Proceedings of the 18th ACM/IFIP/USENIX Middleware Conference: Posters and Demos, Las Vegas, NV, USA, 11–15 December 2017; pp. 19–20. [Google Scholar]
- Schwartz, S.H. Normative influences on altruism. In Advances in Experimental Social Psychology; Elsevier: Amsterdam, The Netherlands, 1977; Volume 10, pp. 221–279. [Google Scholar]
- Cialdini, R.B.; Reno, R.R.; Kallgren, C.A. A focus theory of normative conduct: Recycling the concept of norms to reduce littering in public places. J. Personal. Soc. Psychol. 1990, 58, 1015. [Google Scholar] [CrossRef]
- Schultz, P.W. Changing behavior with normative feedback interventions: A field experiment on curbside recycling. Basic Appl. Soc. Psychol. 1999, 21, 25–36. [Google Scholar] [CrossRef]
- Schultz, P.W.; Nolan, J.M.; Cialdini, R.B.; Goldstein, N.J.; Griskevicius, V. The constructive, destructive, and reconstructive power of social norms. Psychol. Sci. 2007, 18, 429–434. [Google Scholar] [CrossRef] [Green Version]
- Horne, C.; Kennedy, E.H. The power of social norms for reducing and shifting electricity use. Energy Policy 2017, 107, 43–52. [Google Scholar] [CrossRef] [Green Version]
- Rai, V.; Reeves, D.C.; Margolis, R. Overcoming barriers and uncertainties in the adoption of residential solar PV. Renew. Energy 2016, 89, 498–505. [Google Scholar] [CrossRef]
- Ouattara, H.F.; Ahmat, D.; Ouédraogo, F.T.; Bissyandé, T.F.; Sié, O. Blockchain Consensus Protocols. In International Conference on e-Infrastructure and e-Services for Developing Countries; Springer: Berlin, Germany, 2017; pp. 304–314. [Google Scholar]
- Cachin, C.; Vukolić, M. Blockchain consensus protocols in the wild. arXiv 2017, arXiv:1707.01873. [Google Scholar]
- Vukolić, M. The quest for scalable blockchain fabric: Proof-of-work vs. BFT replication. In International Workshop on Open Problems in Network Security; Springer: Berlin, Germany, 2015; pp. 112–125. [Google Scholar]
- Sukhwani, H.; Martínez, J.M.; Chang, X.; Trivedi, K.S.; Rindos, A. Performance modeling of pbft consensus process for permissioned blockchain network (hyperledger fabric). In Proceedings of the 2017 IEEE 36th Symposium on Reliable Distributed Systems (SRDS), Hong Kong, China, 26–29 September 2017; pp. 253–255. [Google Scholar]
- O’Dwyer, K.J.; Malone, D. Bitcoin mining and its energy footprint. In Proceedings of the 25th IET Irish Signals & Systems Conference, Limerick, Ireland, 26–27 June 2014; pp. 280–285. [Google Scholar]
- Vranken, H. Sustainability of bitcoin and blockchains. Curr. Opin. Environ. Sustain. 2017, 28, 1–9. [Google Scholar] [CrossRef] [Green Version]
- Bentov, I.; Lee, C.; Mizrahi, A.; Rosenfeld, M. Proof of activity: Extending bitcoin’s proof of work via proof of stake [extended abstract] y. ACM Sigmetrics Perform. Eval. Rev. 2014, 42, 34–37. [Google Scholar] [CrossRef]
- Kim, S.K.; Jeon, J.H.; Cho, C.H.; Kim, E.S.; Ahn, J.B. Modeling and simulation of a grid-connected PV generation system for electromagnetic transient analysis. Solar Energy 2009, 83, 664–678. [Google Scholar] [CrossRef]
- Park, M.; Yu, I.K. A novel real-time simulation technique of photovoltaic generation systems using RTDS. IEEE Trans. Energy Convers. 2004, 19, 164–169. [Google Scholar] [CrossRef]
- Yamashita, H.; Tamahashi, K.; Michihira, M.; Tsuyoshi, A.; Amako, K.; Park, M. A novel simulation technique of the PV generation system using real weather conditions. In Proceedings of the Power Conversion Conference-Osaka 2002 (Cat. No. 02TH8579), Osaka, Japan, 2–5 April 2002; Volume 2, pp. 839–844. [Google Scholar]
- Karame, G. On the security and scalability of bitcoin’s blockchain. In Proceedings of the 2016 ACM SIGSAC Conference on Computer and Communications Security, Vienna, Austria, 24–28 October 2016; pp. 1861–1862. [Google Scholar]
- Conti, M.; Kumar, E.S.; Lal, C.; Ruj, S. A survey on security and privacy issues of bitcoin. IEEE Commun. Surv. Tutor. 2018, 20, 3416–3452. [Google Scholar] [CrossRef] [Green Version]
Figure 1.
An overview of I-Green system.

Figure 2.
Effects of the green ratio scheme.

Figure 3.
Simulation structure.

Figure 4.
Coin age calculation-case of node A.

Figure 5.
Market of 100 nodes on private blockchain, norm factor = 10%.

Figure 6.
Market of 100 nodes on private blockchain, norm factor = 50%.

Figure 7.
Market of 100 nodes on private blockchain, norm factor = 90%.

Figure 8.
Statistics of daily individuals’ green ratios, norm factor = 10%.

Figure 9.
Statistics of daily individuals’ green ratios, norm factor = 50%.

Figure 10.
Market of 100 nodes on PoG blockchain, norm factor = 10%.

Figure 11.
Market of 100 nodes on PoG blockchain, norm factor = 50%.

Figure 12.
Market of 100 nodes on PoG blockchain, norm factor = 90%.

Figure 13.
Verification distribution of PoG.

Figure 14.
Verification distribution of PoW.

Figure 15.
Verification distribution of PoS.

Figure 16.
Verification distribution of PoG, N = 30.

Figure 17.
Verification distribution of PoG, 60% prosumers.

Table 1.
Variables simulation.
| Variable | Symbol | Distribution | Number of Simulated Values |
|---|---|---|---|
| Temperature | T | Normal(15, 5) | 30 |
| Sunlight intensity | S | Normal(15, 5) | 30 |
| Capacity of panels | P | Uniform(1, 50) | 30/300/3000 |
| Consumption habit | C | Normal(50, 20) | 100/1000/10,000 |
| Random factor of consumption | Normal(0, 1) | 3000/30,000/300,000 | |
| Random factor of generation | Normal(10, 1) | 900/9000/90,000 |
Table 2.
Mean of market variables, 100 nodes, private blockchain.
| Norm Factor | Number of | Size of | Price | SD (Green Ratios) | ||||
|---|---|---|---|---|---|---|---|---|
| Bid | Ask | Transactions | Bid | Ask | Transactions | |||
| 10% | 7 | 30 | 12 | 847 | 4105 | 847 | 102.27 | 0.27 |
| 50% | 34 | 30 | 44 | 2468 | 3585 | 2077 | 108.51 | 0.15 |
| 90% | 64 | 29 | 56 | 4295 | 3391 | 2360 | 113.12 | 0.13 |
Table 3.
Mean of market variables, 100 nodes, PoG blockchain.
| Norm Factor | Number of | Size of | Price | SD (Green Ratios) | ||||
|---|---|---|---|---|---|---|---|---|
| Bid | Ask | Transactions | Bid | Ask | Transactions | |||
| 10% | 6 | 30 | 12 | 814 | 4184 | 814 | 102.29 | 0.29 |
| 50% | 34 | 29 | 43 | 2524 | 3520 | 2115 | 108.96 | 0.16 |
| 90% | 64 | 29 | 57 | 4471 | 3417 | 2437 | 112.88 | 0.14 |
Table 4.
Mean of market variables, 100 nodes, PoG blockchain, block reward = 100.
| Norm Factor | Number of | Size of | Price | SD (Green Ratios) | ||||
|---|---|---|---|---|---|---|---|---|
| Bid | Ask | Transactions | Bid | Ask | Transactions | |||
| 10% | 5 | 30 | 10 | 741 | 4240 | 741 | 102.29 | 0.31 |
| 50% | 35 | 28 | 46 | 2710 | 3462 | 2242 | 109.18 | 0.17 |
| 90% | 65 | 28 | 57 | 4700 | 3369 | 2550 | 113.35 | 0.14 |
Table 5.
Mean of market variables, 100 nodes, 60 prosumers, PoG blockchain.
| Norm Factor | Number of | Size of | Price | SD (Green Ratios) | ||||
|---|---|---|---|---|---|---|---|---|
| Bid | Ask | Transactions | Bid | Ask | Transactions | |||
| 10% | 5 | 49 | 11 | 943 | 6393 | 943 | 101.76 | 0.34 |
| 50% | 27 | 44 | 49 | 2875 | 5236 | 2750 | 108.04 | 0.16 |
| 90% | 51 | 42 | 73 | 4218 | 4807 | 3316 | 113 | 0.14 |
Table 6.
Mean of market variables, 100 nodes, PoW blockchain.
| Norm Factor | Number of | Size of | Price | SD (Green Ratios) | ||||
|---|---|---|---|---|---|---|---|---|
| Bid | Ask | Transactions | Bid | Ask | Transactions | |||
| 10% | 6 | 30 | 11 | 759 | 4127 | 759 | 102.22 | 0.27 |
| 50% | 35 | 30 | 46 | 2555 | 3557 | 2159 | 108.66 | 0.15 |
| 90% | 63 | 29 | 57 | 4303 | 3384 | 2380 | 112.95 | 0.15 |
Table 7.
Mean of market variables, 100 nodes, PoS blockchain.
| Norm Factor | Number of | Size of | Price | SD (Green Ratios) | ||||
|---|---|---|---|---|---|---|---|---|
| Bid | Ask | Transactions | Bid | Ask | Transactions | |||
| 10% | 7 | 31 | 12 | 872 | 4223 | 871 | 102.31 | 0.27 |
| 50% | 34 | 30 | 44 | 2578 | 3569 | 2110 | 108.69 | 0.16 |
| 90% | 63 | 29 | 57 | 4275 | 3443 | 2413 | 112.9 | 0.12 |
Table 8.
Average time consumption of record-keeping.
| Network Scale | Norm Factor | Private | PoG | PoW | PoS |
|---|---|---|---|---|---|
| 100 nodes | 10% | 0.0002 | 0.0002 | 0.0610 | 0.0004 |
| 50% | 0.0002 | 0.0003 | 0.0653 | 0.0003 | |
| 90% | 0.0003 | 0.0003 | 0.0662 | 0.0004 | |
| 1000 nodes | 10% | 0.0015 | 0.0017 | 5.2219 | 0.0021 |
| 50% | 0.0017 | 0.0022 | 6.1665 | 0.0027 | |
| 90% | 0.0019 | 0.0023 | 5.4767 | 0.0029 | |
| 10,000 nodes | 10% | 0.0139 | 0.0214 | 494.1516 | 0.0264 |
| 50% | 0.0185 | 0.0234 | 543.9691 | 0.0377 | |
| 90% | 0.0202 | 0.0259 | 561.3231 | 0.0355 |
Table 9.
Size of blockchain ledgers (KB).
| Network Scale | Norm Factor | Private | PoG | PoW | PoS |
|---|---|---|---|---|---|
| 100 nodes | 10% | 295 | 296 | 297 | 297 |
| 50% | 314 | 316 | 318 | 316 | |
| 90% | 322 | 324 | 325 | 324 | |
| 1000 nodes | 10% | 2963 | 2969 | 2967 | 2969 |
| 50% | 3195 | 3199 | 3200 | 3198 | |
| 90% | 3286 | 3292 | 3292 | 3291 | |
| 10,000 nodes | 10% | 30,442 | 30,423 | 30,430 | 30,434 |
| 50% | 33,071 | 33,077 | 33,080 | 33,080 | |
| 90% | 34,138 | 34,131 | 34,139 | 34,129 |
© 2020 by the authors. Licensee MDPI, Basel, Switzerland. This article is an open access article distributed under the terms and conditions of the Creative Commons Attribution (CC BY) license (http://creativecommons.org/licenses/by/4.0/).
Share and Cite
MDPI and ACS Style
Zhao, F.; Guo, X.; Chan, W.K. Individual Green Certificates on Blockchain: A Simulation Approach. Sustainability 2020, 12, 3942. https://0-doi-org.brum.beds.ac.uk/10.3390/su12093942
AMA Style
Zhao F, Guo X, Chan WK. Individual Green Certificates on Blockchain: A Simulation Approach. Sustainability. 2020; 12(9):3942. https://0-doi-org.brum.beds.ac.uk/10.3390/su12093942
Chicago/Turabian StyleZhao, Fangyuan, Xin Guo, and Wai Kin (Victor) Chan. 2020. "Individual Green Certificates on Blockchain: A Simulation Approach" Sustainability 12, no. 9: 3942. https://0-doi-org.brum.beds.ac.uk/10.3390/su12093942
Note that from the first issue of 2016, this journal uses article numbers instead of page numbers. See further details here.