Dynamic Trends of Urban Flooding Mitigation Services in Shenzhen, China


1
State Key Laboratory of Urban and Regional Ecology, Research Center for Eco-Environmental Sciences, Chinese Academy of Sciences, Beijing 100085, China
2
State Key Laboratory of Urban and Regional Ecology, University of Chinese Academy of Sciences, Beijing 100049, China
*
Author to whom correspondence should be addressed.
Sustainability 2020, 12(11), 4799; https://0-doi-org.brum.beds.ac.uk/10.3390/su12114799
Submission received: 4 May 2020
/
Revised: 3 June 2020
/
Accepted: 9 June 2020
/
Published: 11 June 2020
(This article belongs to the Section Sustainable Urban and Rural Development)
Abstract
:Urbanization is characterized by population agglomeration and the expansion of impervious land surfaces. As a result of ongoing urbanization, rain and flood events have increasingly affected the well-being of residents in cities across the world. This should draw attention to the role of urban ecosystems in providing runoff retention/flood mitigation services. Focusing on Shenzhen, a major city in southern China, we used a hydrologic model based on the Soil Conservation Service curve number (SCS-CN) model to evaluate this flood reduction ecosystem service and its dynamic trends based on long-term remote sensing data from 1980 to 2018. We find that Shenzhen’s capacity for flood reduction gradually decreased due to changes in land use. The spatial distribution showed strong reduction capacity in the eastern part of the city and weak capacity in the western part. Additionally, the city’s total flood reduction capacity decreased by over 1.88 × 10⁸ m3 over the past two decades. This loss of ecosystem-based flood reduction capacity undermines Shenzhen’s resilience against extreme weather events. Due to climate change, Shenzhen should advance its plan to build a “Sponge City” rooted in the conservation, restoration, and construction of urban ecological spaces.
1. Introduction
The frequency of urban flooding, the number of people affected by such flooding, and the frequency and intensity of extreme weather events have increased in recent years, likely due to the ongoing effects of global climate change. In 2019, 194 floods and 91 major storms occurred across the world, affecting nearly 64 million people [1]. Furthermore, approximately 40% of floods and associated economic losses occur in urbanized areas [2].
The world’s urban population continues to grow steadily. From 1960 to 2016, the proportion of the global population living in urban areas increased from 33.6% to 52.3% [3]. It has been estimated that, by 2045, more than six billion people will live in cities around the world [4]. However, urbanization has occurred at an even faster rate in China, growing from 36.2% to 58.5% in the years 2000–2017 [5]. This makes it important to study the relationships between flood mitigation services, population, and land-use change; this topic is central to understanding how rapidly urbanizing areas should adapt to risks related to climate change. The urbanization of a population is usually accompanied by major land-use changes, including the expansion of built-up or impervious surfaces [6]. Consequently, there are major changes in urban hydrological and ecological processes and increases in the risk of urban flooding [7]. For instance, on July 21, 2012, Beijing was hit by flooding and urban waterlogging due to historically heavy rainfall, leaving more than 70 people dead and affecting 1.9 million people. The total economic losses were estimated at 10 billion yuan (1.43 billion USD) [8]. On March 30, 2014, Shenzhen experienced a period of heavy rainfall later classified as a 50-year flood event. This large but relatively young city, in which more than 13,700 km of sewers had been built, was paralyzed, with more than 200 waterlogged areas [9].
An accurate assessment of flood mitigation service capabilities is necessary to achieve effective urban stormwater management. Many models have been developed for the evaluation of flood mitigation services. The US Environmental Protection Agency introduced the Storm Water Management Model to help solve the increasingly serious problems with urban drainage. This model can be used for both single-storm and continuous-rainfall simulation to help land managers address water quantity and quality problems associated with urban drainage systems [10]. Another model, the Soil Water and Assessment Tool, is mainly used to simulate and predict the effects of various management measures and climate change [11]. The CITYgreen model is based on remote sensing and Geographic Information System (GIS) technology. Eco-benefit analyses, including runoff regulation, were conducted in 10 large cities, including Atlanta, Georgia, and Austin, Texas, with satisfactory results [12]. The Long-Term Hydrologic Impact Analysis, developed by Purdue University, provides an assessment model that estimates the amounts of replenishment and runoff and the changes in nonpoint-source pollution in the water cycle based on past or proposed developments. This model uses long-term meteorological, land-use, and soil-type data to estimate the long-term average runoff of a basin [13].
For urban-scale research, spatially lumped or semidistributed models with fewer parameters are more suitable than fully distributed hydrological models [14,15,16]. The United States Department of Agriculture (USDA) Soil Conservation Service curve number (SCS-CN) model is an event-based model with spatially lumped variables developed by the former USDA Water Maintenance Bureau (USDA-SCS; now known as the USDA Natural Resource Conservation Service) based on rainfall–runoff data in small watersheds from different regions of the United States [17]. From its establishment, the SCS-CN model has been widely used to simulate various runoff scenarios, ranging from small urban sites (e.g., highways or residential lots) to neighborhoods and large urban watersheds [18,19,20,21]. Meanwhile, the USDA also provides a curve number (CN) look-up table with assignments of different types of land cover to facilitate hydrological simulation [22]. Consequently, these CN tables make it easy to transfer GIS data into a rainfall–runoff model based on the SCS-CN method.
In this study, we focus on a region experiencing one of the most rapid urbanization processes in China since the country’s “Reform and Opening-Up” period began in 1978: the city of Shenzhen in the Pearl River Delta. Dynamic trends of the flood mitigation service in Shenzhen between 1980 and 2018 were modeled using SCS-CN methods. At the same time, we provide an analysis of the relationship between flooding and the changes in land cover and population density. Policy proposals are also provided, with the goal of improving the flood mitigation service based on the results of this study.
2. Materials and Methods
2.1. Analytical Framework
Simulation of the dynamic trends of the urban flood mitigation service required three steps: data preprocessing, SCS-CN simulation, and results analysis (Figure 1). First, we obtained and preprocessed the data required for the model. Long-term daily precipitation data were converted into daily precipitation maps by interpolation. Moreover, 5-day precipitation maps were also created. Spatial soil attribution data were converted into a soil hydrology group map. In addition, the land cover raster data were reclassified into six land cover types, five of which were based on human land use, including farmland, forest, grassland, wetland, and urban, with the remaining one being the natural ecosystem land type in Shenzhen. Second, we evaluated the urban flood mitigation service using the SCS-CN. Daily CN value maps were made by integrating land cover, soil hydrology group, and accumulated 5-day precipitation maps. The resulting daily CN maps allowed the annual values of the urban flood mitigation service to be evaluated. Third, we analyzed the change in the urban flood mitigation service from 1980 to 2015. The urban flood mitigation (UFM) capacity of each sub-watershed was also assessed to reveal the characteristics of its spatial heterogeneity.
2.2. Study Region
Shenzhen, located in southern Guangdong Province on the eastern coast of the Zhujiang River (113°46′–114°37′ E, 22°27′–22°52′ N), covers an area of 1997.27 km2 (Figure 2). Shenzhen was formerly known as Bao’an County. After 40 years of rapid urbanization, Shenzhen, once a small city (by Chinese standards) with a population of 330,000 and a per capita gross domestic product (GDP) of 606 CNY, has become an international metropolis. It has integrated trade, tourism, finance, and other industries and now boasts a resident population of 11.38 million and a per capita GDP of 157,985 CNY. However, the quantity of stormwater runoff in this urban area increased along with the large expansion of impermeable land surfaces. Shenzhen has abundant rainfall and sunshine due to its mild and subtropical maritime climate. The average annual precipitation is 1935.8 mm, falling on an average of 144 days per year. The city’s rainy season runs from April to September. Shenzhen has reported 278 urban flood-prone points, which contribute to large economic and human losses [23].
2.3. Data Resources
2.3.1. Meteorological Data
First, the meteorological data needed to be generalized for simulation. The daily rainfall data from 1980 to 2010 in Shenzhen and its surrounding areas were obtained from the China Meteorological Data Network. Then, daily rainfall distribution maps were created using the spatial interpolation tool in ArcGIS (ESRI, Redlands, CA, USA). Through the accumulation of the 5-day antecedent precipitation, an Antecedent Moisture Conditions (AMC) attribute raster file of the daily soil moisture degree was obtained by dividing the degrees of soil moisture.
2.3.2. Land-Use Data
Second, we obtained the land-use data of the study area for 1980, 1990, 1995, 2000, 2005, 2010, and 2015 with a resolution of 30 m [24]. Based on the human-dominated land cover and natural ecosystem types in Shenzhen, land-use was reclassified into five types: farmland, forest, grassland, wetland, and urban. A CN value was assigned to each land cover type. Administrative boundary data with a scale of 1:4,000,000 from China’s national basic geographic information system (GIS) database were used to clip the land-use data to this study area.
2.3.3. Soil Spatial Data Processing
Third, by obtaining the spatial soil census data for Guangdong Province, a grid map of the soil’s clay content (%), a map of the soil’s sand content (%), and a plot of the soil’s organic matter content (%) were produced. The raster calculator function in ArcGIS was used to modify three raster files into the soil saturation conductivity calculation formula shown in Equation (1):
where K is the saturated hydraulic conductivity (mm/h), C and S are the ratios of the soil’s clay and sand on the unit grid (%), respectively, and O is the proportion of the soil’s organic matter content in the unit grid (%).
K = (0.056 × C + 0.016 × S + 0.231 × O − 0.693) × 60
The soil’s saturated hydraulic conductivity was calculated using a raster file. The soil was divided into four soil hydrological groups, A, B, C, and D, using the saturated hydraulic conductivity classification standard of hydrological modeling (Table 1). Next, a soil hydrological group raster file was created.
3. Results
3.1. Land Cover Changes in Shenzhen between 1980 and 2015
Shenzhen’s land cover changes were classified using the five types of human land use described above. From 2000 to 2009, large increases in urban land use were observed along with decreases in farmland and forest. This was caused by rapid urbanization (Table 2 and Figure 3). Urban land coverage increased from 13.4% to 43.0%, becoming the main land-use type in Shenzhen. Most of the increase in urban land came at the expense of farmland and forest. A total of 286.25 km2 of farmland had been converted to urban land; that is, 57.3% of the farmland existing in 1980 was converted to urban land by 2015. Additionally, 218.28 km2 of forest was converted to urban land.
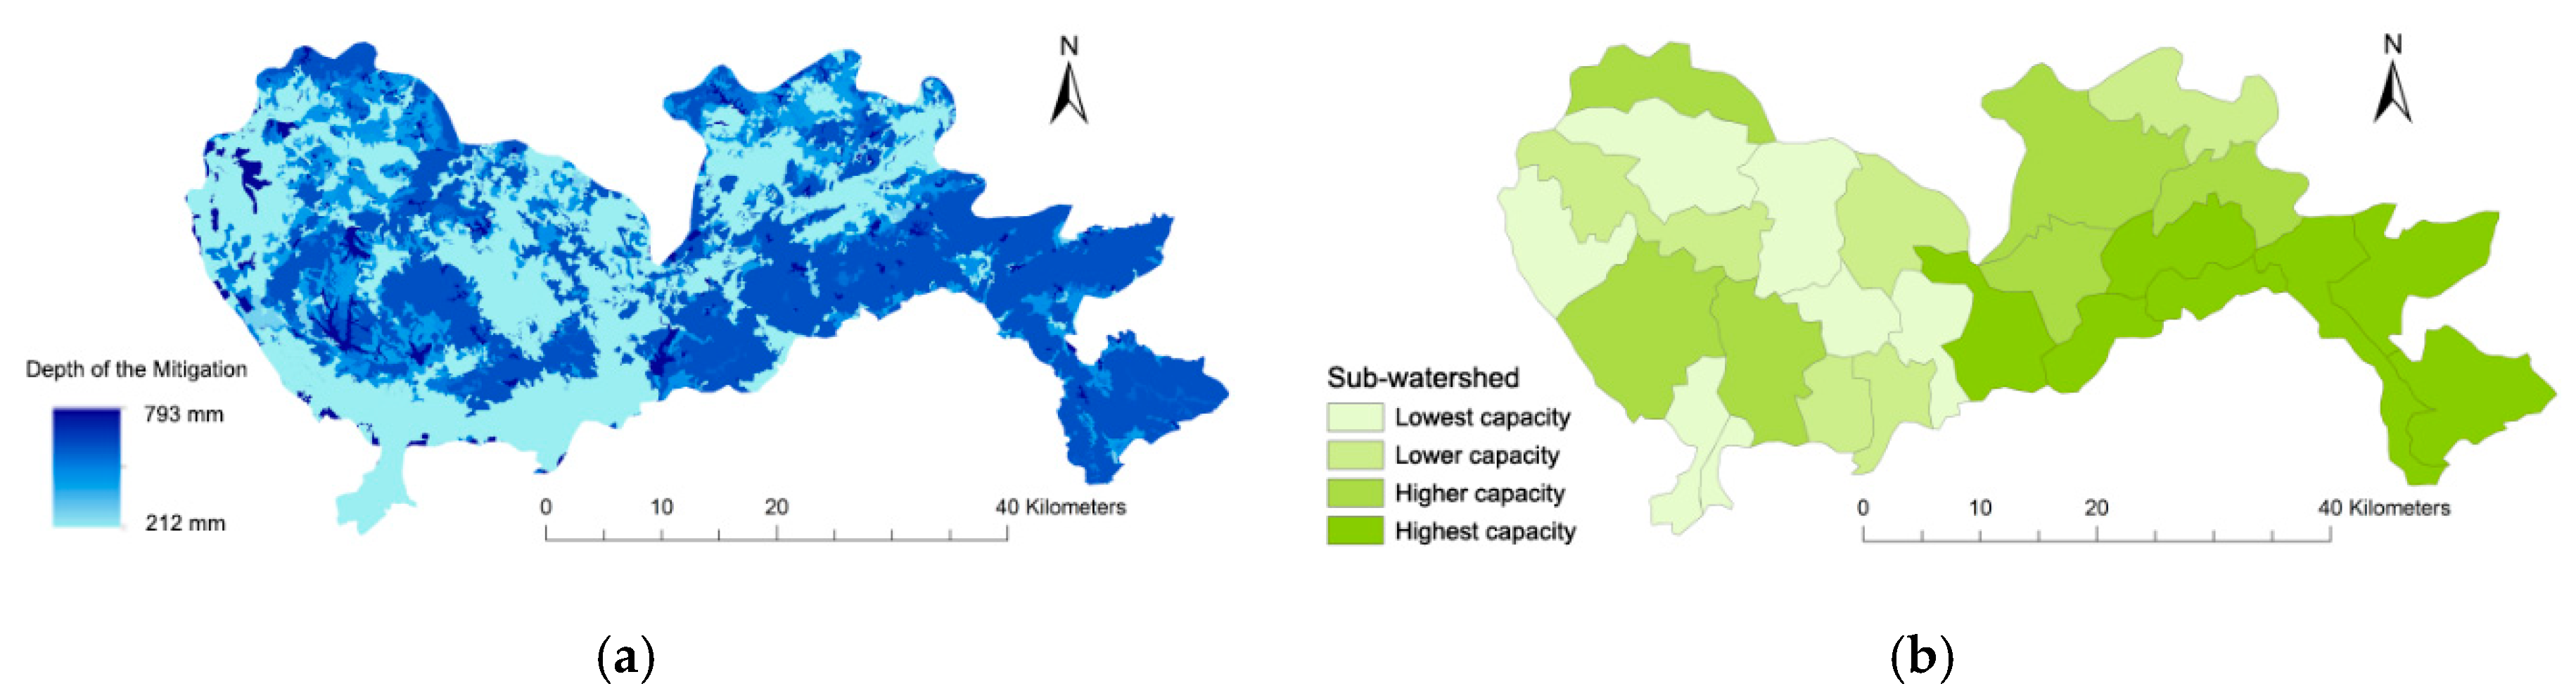
3.2. Flood Mitigation Capacity and the Spatial Distribution of Flooding in Shenzhen in 2015
In 2015, the capacity of the urban flood mitigation service in Shenzhen was 751 million m3, and the water depth of the flood mitigation service was between 212 and 793 mm (average: 375.71 mm; Figure 4a). The nine major watersheds in Shenzhen were divided into 25 sub-watersheds based on the nature of the river water system, elevation, and the planned drainage system. The capacity of the urban flood mitigation service was calculated for each sub-watershed (Figure 4b). The stormwater runoff regulation capacity in Shenzhen presents a spatial pattern ranging from high in the eastern areas to low in the western areas. Three sub-watersheds, Dapeng East, Daya Bay North, and Mesa, had the largest capacity to provide urban flood mitigation. Each of these could mitigate more than 70% of the urban flooding that occurred in their respective watersheds in 2015. The sub-watersheds of Shekou, the upper reaches of the Guanlan River, the western Guanlan River, Dakonggang, and Bujihe essentially lacked the capacity to provide a UFM service, because these sub-watersheds could mitigate less than 40% of the urban flooding that occurred in 2015.
3.3. Runoff Regulation Function and Its Trend in Shenzhen from 1980 to 2015
During the period of 1980−2018, the capacity of the mitigation service related to urban flooding in Shenzhen decreased year by year from 9.62 × 10⁸ m3 in 1980 to 7.74 × 10⁸ m3 in 2015, a decrease of 1.88 × 10⁸ m3. The storm runoff control rate fell from 64.60% in 1980 to 53.21% in 2015, a decrease of 11.39% (Figure 5). Turning to the various timeframes, it can be seen that from 1990 to 1995 the capacity of the urban flood mitigation service decreased from 9.58 × 10⁸ m3 to 8.53 × 10⁸ m3, a decrease of 1.05 × 10⁸ m3, and the storm runoff control rate decreased from 64.02% to 58.04%, a decrease of 5.98%. Between 2000 and 2005, the capacity of the urban flood mitigation service decreased from 8.50 × 10⁸ m3 to 7.98 × 10⁸ m3, while the storm runoff control rate decreased from 58.15% to 54.62%, a decrease of 3.53%. The changes in these two periods were the most significant, accounting for 52.50% and 30.99% of the total change in the decrease of the capacity of urban flood mitigation, respectively.
The spatial distribution of the capacity of the mitigation service related to urban flooding was calculated using the model for four years: 1980, 1995, 2005, and 2015 (Figure 6). After 1980, as the urbanization process continued in Shenzhen, the urban flood mitigation service gradually decreased throughout the city. By 2015, only parts of the southeast and the west of Shenzhen continued to provide most of their historic urban flood mitigation services. Weak functional areas for urban flood mitigation have transformed from exhibiting a sporadic distribution in 1980 to becoming the dominant area of the 2015 formation.
4. Discussion
4.1. Benefit Index for the Runoff Mitigation Service
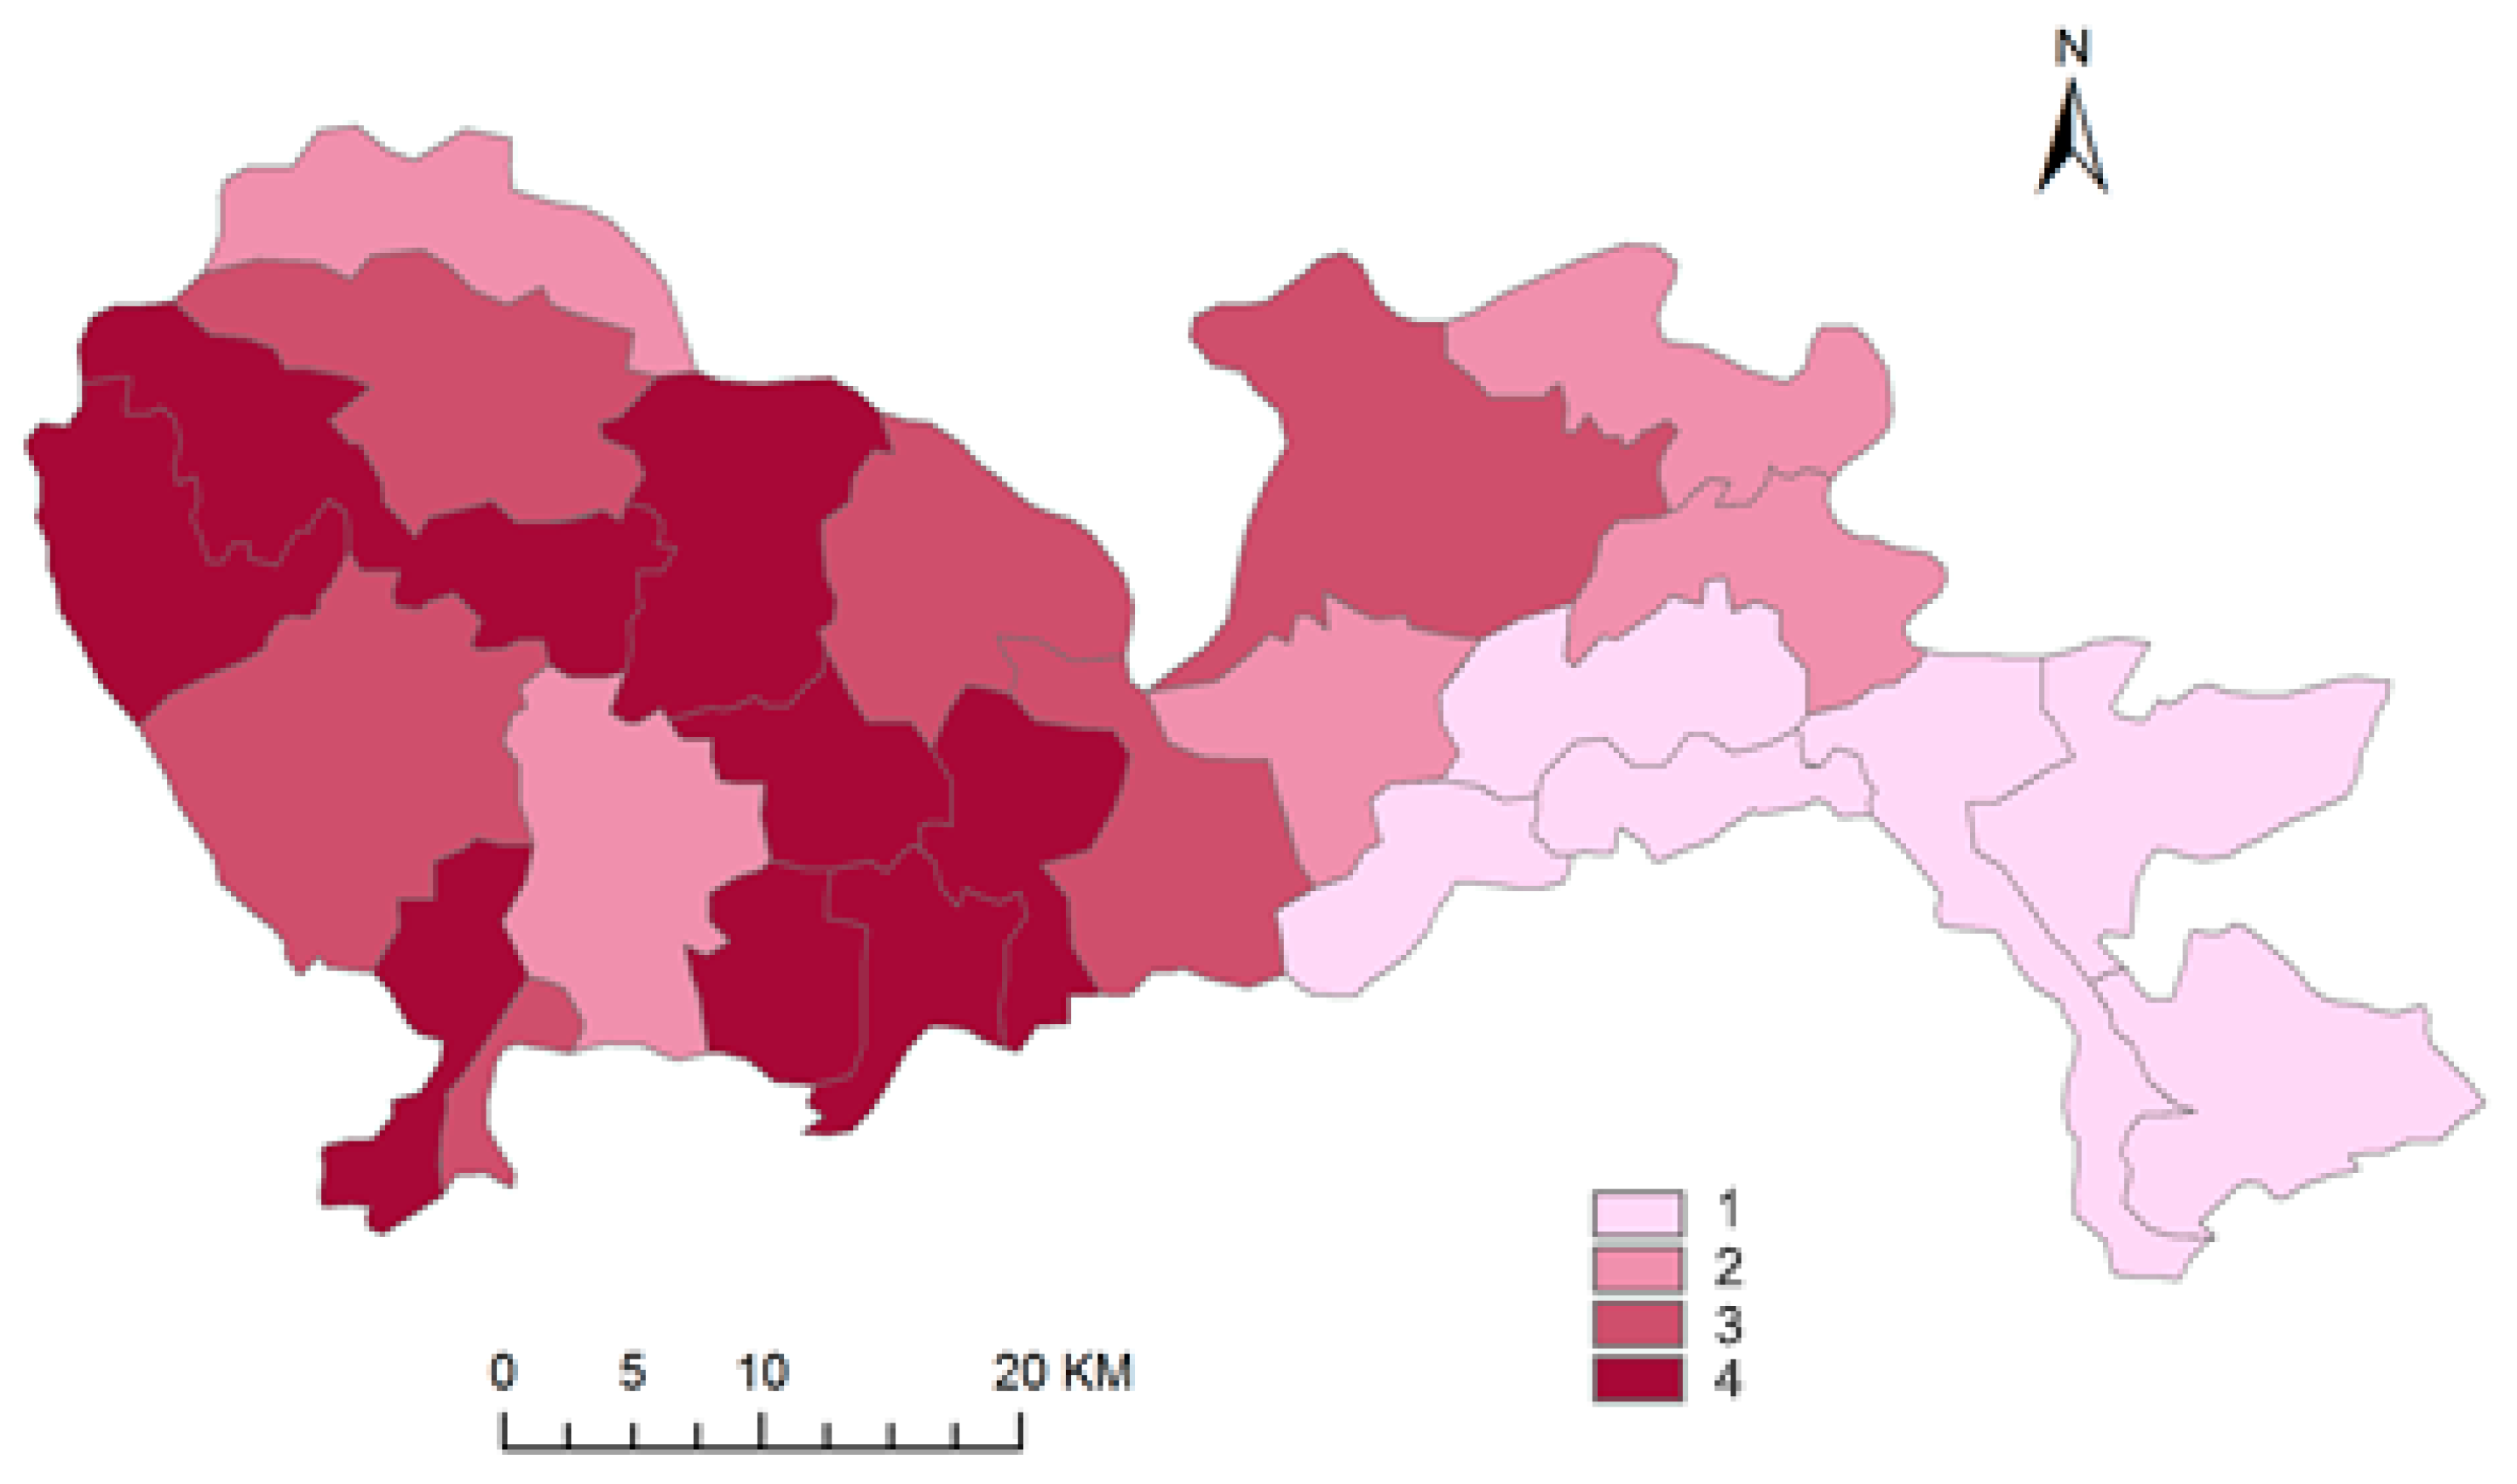
The runoff mitigation service was calculated based on the risk assessment paradigm of the United Nations International Strategy for Disaster Reduction, which is as follows: risk (R) = hazard (H) × vulnerability (V) [25]. Using this theoretical framework, we evaluated the benefit index for the urban flood mitigation service of Shenzhen city (Figure 7). The benefit index (BI) = service factor (S) × exposure (EX), where the service factor S can be characterized by an urban flood mitigation service of 2018. Measures of exposure can include the number of people in an area [12]; therefore, we used Point of Information (POI) data to make a map of the density of the urban population distribution to represent exposure (EX).
The benefit index of the urban flood mitigation service in Shenzhen showed a trend of being high in the west and low in the east. Among the sub-watersheds, the Futian River and the Buji River sub-watersheds had the highest indices, while the Daya Bay sub-watershed in the eastern region had the lowest index. A significant difference was observed between the spatial distribution of urban flood mitigation services and the values of the benefit index. Although the capacity of the service in the eastern sub-watersheds of the city was higher than in the west, the opposite trend was observed for the distribution of benefit index values due to the fact that the urban population is mainly concentrated in the eastern part of the city. This shows that future study of the spatial pattern of urban ecosystem service functions should consider not only the spatial distribution of ecosystem services but also the spatial differences in population densities.
4.2. Trends in Land Cover Change and Storm Runoff Regulation Services
An analysis of the changes in land cover in the study area since 1980 shows that the pattern has changed dramatically over the past 40 years. The area of urban land continued to increase, and many ecological land cover types were converted to urbanized land that is often used for construction. Since 2010, the rate of change of land cover type has been reduced by natural conditions and the government’s land-use control policy. Urban public green space, green corridors, and other green development efforts have resulted in a slight increase in grassland area. This change of land cover pattern coincides with the change trend of the urban flood mitigation service, and it has become the main driver of change in that service.
4.3. The Importance of Storm Runoff Regulation in Extreme Climate Events
The services provided by naturalized urban ecosystems cause cities to become more resilient in the face of extreme weather disasters. On September 16 and 17, 2018, Super Typhoon Mangkhut made landfall in Shenzhen; it was the strongest typhoon to hit the region since 1983 [26]. The resulting heavy rainfall caused Shenzhen to face accumulated rainfall of 225.5 mm, flooding many areas across the city. According to our evaluation, during Typhoon Mangkhut, the urban ecosystems of Shenzhen provided a flood mitigation service with a volume of 232 million m3, equivalent to 24% of the city’s reservoir storage capacity (950 million m3). Using the engineering replacement method, we found that the value of urban flood mitigation services was approximately 1.09 billion USD (7.656 billion yuan).
4.4. Sponge City Construction in Shenzhen
In response to the increased rainwater runoff caused by urban agglomeration and urbanization (which leads to the expansion of impervious surfaces), recent rainwater-management strategies have increasingly recognized the need to mimic predevelopment hydrological conditions [27]. Examples include the UK’s Sustainable Urban Drainage System [28], the United States’ Low Impact Development [29], and Australia’s Water Sensitive Urban Design [30]. In China, Li et al. [31] proposed the “Sponge City” initiative. A Sponge City provides for “Sustainable Urban Development by strengthening flood control, water conservation, water quality improvement measures, and natural ecosystem protection” [31]. In 2015, the General Office of the State Council of China issued official guidance on the promotion and construction of Sponge Cities. The Guiding Opinions on Construction proposes to minimize the impact of urban development and construction on the natural environment so that cities can absorb and use 70% of rainfall locally. By 2020 and 2030, portions of more than 20% and 80%, respectively, of the urbanized area of Shenzhen are expected to meet the Sponge City target requirements.
The Sponge City initiative uses nature-based solutions, such as rain gardens, green roofs, man-made wetlands, and permeable sidewalks to transform existing urban communities, enabling more rainwater to be absorbed, slowed, and filtered by urban ecological spaces. Shenzhen was selected as a pilot city for the construction of a Sponge City in April 2016. In the special planning and implementation plan for the construction, a total of 27 key areas were designated, with a total area of approximately 312.7 km2, of which the construction area of urbanized land was about 235.6 km2. By 2020, these areas will absorb and use 70% of the local rainfall, which will greatly improve Shenzhen’s urban flood mitigation capacity.
5. Conclusions
With rapid urbanization, common problems such as floods and inadequate water storage (which includes insufficient natural water retention and man-made facilities) are becoming increasingly serious. Knowing how to manage urban rains and floods scientifically and sustainably is an urgent challenge for urban planners and land managers. Taking the example of Shenzhen, a rapidly developing city in southern China, this study comprehensively analyzed multiperiod land use, soil spatial attributes, and long-term meteorological data sources. Based on the SCS model, we quantitatively simulated the urban flood mitigation service and assessed the characteristics of its spatial distribution and dynamic trends over the 40 years from 1980 to 2018. This study is an attempt to evaluate the function of urban ecosystem services to help clarify the mechanism linking land-use change to ecological risks from natural disasters, such as urban rainstorms and floods. The results show that Shenzhen’s urban flood mitigation capacity is spatially high in the east and low in the west. From 1980 to 2018, the capacity of the urban flood mitigation service in Shenzhen decreased year by year, a trend consistent with overall urbanization impacts in Shenzhen. The changing land cover pattern was the main driver of the decline in urban flood mitigation capacity. Therefore, the regulation of storm runoff through appropriate ecosystem management can provide a great deal of value during extreme weather events. Building a Sponge City that uses urban ecosystems efficiently is an effective way to solve problems related to urban stormwater and ecosystem management.
Author Contributions
Conceptualization, Z.O., T.W., and B.H.; Data curation, D.X. and B.H.; Formal analysis, D.X.; Investigation, D.X.; Methodology, B.H.; Project administration, Z.O. and B.H.; Software, D.X.; Supervision, Z.O. and T.W.; Writing—Original draft, D.X.; Writing—Review & Editing, D.X., T.W., and B.H. All authors have read and agreed to the published version of the manuscript.
Funding
This research was funded by the National Natural Science Foundation of China (grants no. 71804180). And all the analysis was rechecked with the free online urban ecology analysis platform IUEMS, www.iuems.ac.cn.
Conflicts of Interest
The authors declare no conflicts of interest.
References
- CRED. CRED Crunch 58—Disaster Year in Review (2019); CRED: Brussels, Belgium, 2020. [Google Scholar]
- Güneralp, B.; Güneralp, İ.; Liu, Y. Changing global patterns of urban exposure to flood and drought hazards. Glob. Environ. Chang. 2015, 31, 217–225. [Google Scholar] [CrossRef]
- World Bank Group. World Development Indicators 2017; World Bank: Washington, DC, USA, 2017. [Google Scholar]
- The Department of Economic and Social Affairs of the United Nations. World Urbanization Prospects: The 2014 Revision, Highlights; Department of Economic and Social Affairs: New York, NY, USA, 2014; Volume 32. [Google Scholar]
- Chow, G.C. Capital Formation and Economic Growth in China; Brill: Leiden, The Netherlands, 2017. [Google Scholar]
- Samal, D.R.; Gedam, S.S. Monitoring land use changes associated with urbanization: An object based image analysis approach. Eur. J. Remote Sens. 2015, 48, 85–99. [Google Scholar] [CrossRef]
- Wheater, H.; Evans, E. Land use, water management and future flood risk. Land Use Policy 2009, 26, 251–264. [Google Scholar] [CrossRef]
- Wang, K.; Wang, L.; Wei, Y.-M.; Ye, M. Beijing storm of July 21, 2012: Observations and reflections. Nat. Hazards 2013, 67, 969–974. [Google Scholar] [CrossRef]
- Yin, J.; Ye, M.; Yin, Z.; Xu, S. A review of advances in urban flood risk analysis over China. Stoch. Environ. Res. Risk Assess. 2015, 29, 1063–1070. [Google Scholar] [CrossRef]
- Rossman, L.A. Storm Water Management Model User’s Manual, Version 5.0; US Environmental Protection Agency: Washington, DC, USA, 2010. [Google Scholar]
- Neitsch, S.L.; Arnold, J.G.; Kiniry, J.R.; Williams, J.R. Soil and Water Assessment Tool Theoretical Documentation Version 2009; Texas Water Resources Institute: College Station, TX, USA, 2011. [Google Scholar]
- American Forests. CITYgreen: Calculating the Value of Nature, Version 5.0 User‘s Manual; American Forests: Chicago, IL, USA, 2002. [Google Scholar]
- Mishra, S.K.; Tyagi, J.V.; Singh, V.P.; Singh, R. SCS-CN-based modeling of sediment yield. J. Hydrol. 2006, 324, 301–322. [Google Scholar] [CrossRef]
- Beven, K.J. Rainfall-Runoff Modelling: The Primer; John Wiley & Sons: Hoboken, NJ, USA, 2011. [Google Scholar]
- Lindström, G.; Johansson, B.; Persson, M.; Gardelin, M.; Bergström, S. Development and test of the distributed HBV-96 hydrological model. J. Hydrol. 1997, 201, 272–288. [Google Scholar] [CrossRef]
- Clark, M.P.; Slater, A.G.; Rupp, D.E.; Woods, R.A.; Vrugt, J.A.; Gupta, H.V.; Wagener, T.; Hay, L.E. Framework for Understanding Structural Errors (FUSE): A modular framework to diagnose differences between hydrological models. Water Resour. Res. 2008, 44. [Google Scholar] [CrossRef]
- Boughton, W.C. A review of the USDA SCS curve number method. Soil Res. 1989, 27, 511–523. [Google Scholar] [CrossRef]
- Gajbhiye, S.; Mishra, S. Application of NRSC-SCS curve number model in runoff estimation using RS & GIS. In Proceedings of the IEEE-International Conference on Advances in Engineering, Science and Management (ICAESM-2012), Tamil Nadu, India, 30–31 March 2012; pp. 346–352. [Google Scholar]
- Kadam, A.K.; Kale, S.S.; Pande, N.N.; Pawar, N.J.; Sankhua, R.N. Identifying potential rainwater harvesting sites of a semi-arid, basaltic region of Western India, using SCS-CN method. Water Resour. Manag. 2012, 26, 2537–2554. [Google Scholar] [CrossRef]
- Singh, P.K.; Yaduvanshi, B.K.; Patel, S.; Ray, S. SCS-CN based quantification of potential of rooftop catchments and computation of ASRC for rainwater harvesting. Water Resour. Manag. 2013, 27, 2001–2012. [Google Scholar] [CrossRef]
- Zuo, D.; Xu, Z.; Yao, W.; Jin, S.; Xiao, P.; Ran, D. Assessing the effects of changes in land use and climate on runoff and sediment yields from a watershed in the Loess Plateau of China. Sci. Total Environ. 2016, 544, 238–250. [Google Scholar] [CrossRef] [PubMed]
- NRCS, U. Urban Hydrology for Small Watersheds-Technical Release 55; US Department of Agriculture Natural Resources Conservation: Washington, DC, USA, 1986. [Google Scholar]
- Luo, Z.H.; Zhou, Y.; Chen, D.; Zhao, H.Y.; Zheng, Q.S. Development of the Emergy-GIS Method of Selecting Areas for Sponge-Like Urban Reconstruction. Appl. Ecol. Environ. Res. 2019, 17, 3769–3780. [Google Scholar] [CrossRef]
- Xu, X.L.; Liu, J.Y.; Zhang, S.W.; Li, R.D.; Yan, C.Z.; Wu, S.X. Remote Sensing Monitoring Data Set for Land Use and Cover in China (CNLUCC); Data Registration and Publishing System of Resource and Environment Science Data Center of Chinese Academy of Sciences: Beijing, China, 2018. [Google Scholar] [CrossRef]
- Kofi, A. Living with Risk: A Global Review of Disaster Reduction Initiatives. In International Strategy for Disaster Reduction (ISDR); United Nations: Geneva, Switzerland, 2004; Volume 1. [Google Scholar]
- Huang, J.; Su, Y.; Zhu, G.; Chen, R.; Wu, X. Uprooting of tree induced by typhoon: A case study of super typhoon Mangkhut in university town of Shenzhen. E3S Web Conf. 2019, 92, 12012. [Google Scholar] [CrossRef]
- Hamel, P.; Fletcher, T.D. The impact of stormwater source-control strategies on the (low) flow regime of urban catchments. Water Sci. Technol. 2014, 69, 739–745. [Google Scholar] [CrossRef] [PubMed]
- Abbott, C.L.; Comino-Mateos, L. In-situ hydraulic performance of a permeable pavement sustainable urban drainage system. Water Environ. J. 2003, 17, 187–190. [Google Scholar] [CrossRef]
- Eckart, K.; McPhee, Z.; Bolisetti, T. Performance and implementation of low impact development–A review. Sci. Total Environ. 2017, 607, 413–432. [Google Scholar] [CrossRef] [PubMed]
- Coutts, A.M.; Tapper, N.J.; Beringer, J.; Loughnan, M.; Demuzere, M. Watering our cities: The capacity for Water Sensitive Urban Design to support urban cooling and improve human thermal comfort in the Australian context. Prog. Phys. Geogr. 2013, 37, 2–28. [Google Scholar] [CrossRef]
- Li, H.; Ding, L.; Ren, M.; Li, C.; Wang, H. Sponge city construction in China: A survey of the challenges and opportunities. Water 2017, 9, 594. [Google Scholar] [CrossRef] [Green Version]
Figure 1.
The analytical framework of this study. Note: CN, curve number; SCS, Soil Conservation Service; UFM, urban flood mitigation.
Figure 1.
The analytical framework of this study. Note: CN, curve number; SCS, Soil Conservation Service; UFM, urban flood mitigation.

Figure 2.
Land cover of Shenzhen and its location within China.

Figure 3.
Changes in Shenzhen’s land cover configuration from 1980 to 2015.

Figure 4.
(a) Water depths of the flood mitigation service in Shenzhen. (b) Classification of the 25 sub-watersheds in Shenzhen.
Figure 4.
(a) Water depths of the flood mitigation service in Shenzhen. (b) Classification of the 25 sub-watersheds in Shenzhen.

Figure 5.
Stormwater reduction from 1980 to 2018 in Shenzhen.

Figure 6.
Urban flood mitigation service maps from (a) 1980, (b) 1995, (c) 2005, and (d) 2015.

Figure 7.
The benefit index distribution of Shenzhen; 1 means a low benefit index, 2 means a mid-low benefit index, 3 means a mid-high benefit index, and 4 means a high benefit index.
Figure 7.
The benefit index distribution of Shenzhen; 1 means a low benefit index, 2 means a mid-low benefit index, 3 means a mid-high benefit index, and 4 means a high benefit index.


Table 1.
Soil hydrological component level standard.
| A | B | C | D | |
|---|---|---|---|---|
| Saturated hydraulic conductivity (K) | ≥180 mm/h | 18–180 mm/h | 1.8–18 mm/h | ≤1.8 mm/h |
Table 2.
Shenzhen land-use conversion matrix from 1980 to 2015.
| 1980–2015 | Farmland | Forest | Grassland | Wetland | Urban |
|---|---|---|---|---|---|
| Farmland | 192.36 | 6.65 | 0.08 | 14.23 | 286.25 |
| Forest | 11.59 | 756.88 | 0.78 | 2.52 | 218.28 |
| Grassland | 0.05 | 1.08 | 24.01 | 0.08 | 27.41 |
| Wetland | 0.18 | 0.95 | 0.03 | 37.27 | 10.78 |
| Urban | 0.07 | 0.80 | 0.03 | 0.00 | 245.44 |
© 2020 by the authors. Licensee MDPI, Basel, Switzerland. This article is an open access article distributed under the terms and conditions of the Creative Commons Attribution (CC BY) license (http://creativecommons.org/licenses/by/4.0/).
Share and Cite
MDPI and ACS Style
Xu, D.; Ouyang, Z.; Wu, T.; Han, B. Dynamic Trends of Urban Flooding Mitigation Services in Shenzhen, China. Sustainability 2020, 12, 4799. https://0-doi-org.brum.beds.ac.uk/10.3390/su12114799
AMA Style
Xu D, Ouyang Z, Wu T, Han B. Dynamic Trends of Urban Flooding Mitigation Services in Shenzhen, China. Sustainability. 2020; 12(11):4799. https://0-doi-org.brum.beds.ac.uk/10.3390/su12114799
Chicago/Turabian StyleXu, Dihang, Zhiyun Ouyang, Tong Wu, and Baolong Han. 2020. "Dynamic Trends of Urban Flooding Mitigation Services in Shenzhen, China" Sustainability 12, no. 11: 4799. https://0-doi-org.brum.beds.ac.uk/10.3390/su12114799
Note that from the first issue of 2016, this journal uses article numbers instead of page numbers. See further details here.