Article

Examining the Role of Local Products in Rural Development in the Light of Consumer Preferences—Results of a Consumer Survey from Hungary

1
Faculty of Economics and Social Sciences, Szent István University, H-2100 Gödöllő, Hungary
2
Centre for Research and Development—Innoregio Knowledge Centre, Eszterházy Károly University, H-3300 Eger, Hungary
3
Faculty of Agricultural Sciences and Rural Development, Eszterházy Károly University—Gyöngyös Károly Róbert Campus, H-3200 Gyöngyös, Hungary
*
Author to whom correspondence should be addressed.
Sustainability 2020, 12(13), 5473; https://0-doi-org.brum.beds.ac.uk/10.3390/su12135473
Submission received: 31 May 2020 / Revised: 2 July 2020 / Accepted: 3 July 2020 / Published: 7 July 2020
(This article belongs to the Collection Sustainable Development of Rural Areas and Agriculture)

Abstract

:
The scientific examination of short food supply chains is justified by consumer interest and their role in the European Unions’ subsidy policy and rural development. In our current article, we present the results of a consumer survey of more than a thousand people from Hungary. It was conducted in the North Hungarian (rural) region. Our research goals were: (1) To access consumer demand for short food supply chains and to determine the characteristics of consumers who prefer local foods; and (2) to examine the role of short food supply chains in rural development by a territorial comparison. The results showed that consumers’ willingness to pay a theoretical premium for local products was high (averagely +20.7%). Compared to that, we considered their monthly purchased quantity low. We found a statistically valid, yet weak, correlation that on a monthly basis, the purchase of local products was more significant for consumers from smaller settlements and villages than those from (greater) cities. Furthermore, there were factors in some consumers’ preferences that indicated a greater interest for small producers’ goods. Although it was not possible to assess the absolute demand of the studied rural area, these results (at a certain level) confirm the potential of short food chains in rural development.

1. Introduction

Agriculture is classically considered one of the cornerstones of rural employment. In addition to their economic characteristics, researchers are examining the role of short supply chains in rural development. However, those who want to thrive as individual small-scale producers in today’s food trade may face serious difficulties. In global trade, small producers can be driven out of markets. For them, selling in short supply chains (SSCs) or short food supply chains (SFSCs) can be a sales alternative.
The growing demand for local foods has led to an increase in studies on “alternative agro-food networks”, including researches on consumers’ willingness to pay and consumer attitudes toward local products [1]. According to the report of the European Parliamentary Research Service (EPRS) from 2016 [2], there has been a growing interest in short supply chains and local markets in all European countries, both in rural and urban areas, but their role in European food systems can be described as marginal.
Researchers examined the role of short supply chains in rural development (e.g., Reference [3]). We consider this justified due to their rural development policy implications. In our article, examining the consumer behavior of the Hungarian rural population, we sought to assess the role of short food chains in rural development. We conducted a consumer survey of more than 1000 respondents in the North Hungarian region to assess the consumers’ preference for local products and willingness to pay. We compared our results with the information on relevant case studies from different countries. Our research goal was to determine the responders’ demand for products of short food supply chains and preference for local products. We examined whether respondents living in small settlements (or “rural areas”) prefer local products more than residents from larger cities. Although our sample is not representative, the results of our case study may help to assess the importance of short food supply chains in rural development from the perspective of demand.

1.1. Conceptual Approach

The term “alternative food network” (AFN) refers to commercial networks of producers, consumers, and other participants that are an alternative to standardized, large-scale modes of food supply [3]. In our article, we examine the sales of local products and the sales of small producers. Typical commercial channels for them are the short supply chains (SSCs) or short food supply chains (SFSCs). According to the European Union support policy [4], we considered those supply chains to be “short” where producers sell their products to consumers either directly or by at most one intermediate participant. Another important approach in defining short supply chains is the spatial aspect. According to Kneafsey et al. [5], for “local food systems” (where production, processing, marketing, and consumption take place in a spatially defined proximity), this physical distance was determined differently in the individual countries and sources. In Hungary, based on certain restrictions [6], this distance corresponds to 40 km. In other countries, in different geographical environment and approaches, this determination may have a completely different dimension. In Canada, for example, according to the CFIA (Canadian Food Inspection Agency), this distance is 50 km [7], but an example brought up by Martinez et al. [8] determined the distance of origin in case of “local food” in the United States on an entirely different scale. There are many types of SFSC channels, such as:
-
“Direct on-farm sales: pick your own;
-
direct on-farm sales: sales to individual consumers;
-
direct off-farm sales: internet deliveries;
-
direct off-farm sales: delivery to consumers;
-
direct off-farm sales: farmers’ markets (fairs)
-
sales to small retail outlets (one intermediary)” ([9] p. 5.).
Here we see that a broad conceptual framework for “alternative” supply chains is used in the literature (e.g., alternative food network (AFN) short supply chain (SSC), short food supply chain (SFSC)). In our article, we rely primarily on the concept of “short food supply chain.” According to the official French definition, the “short food chain” also has a maximum of one intermediary [10], similarly to the previously mentioned definition of SSCs [4].
In the study of Marsden et al. [11], the concept of short food supply chains was used as an “umbrella” term. A general aspect that SFSCs are able to engender some form of connection between food producers and consumers. According to the cited authors, in the case of SFSCs “it is not the number of times a product is handled or the distance over which it is ultimately transported which is necessarily critical, but the fact that the product reaches the consumer embedded with information, for example, printed on the packaging or communicated personally at the point of retail. It is this, which enables the consumer to confidently make connections and associations with the place/space of production, and potentially, the values of the people involved and the production methods employed.” [11] p. 425.
The term local product is closely related to the subject of our study and short supply chains. Examining the international and domestic literature, we can find several, sometimes contradictory definitions of the concept of local products, and there is no uniform and accepted interpretation [12,13]. As an alternate solution, we can make a general statement that local and regional products are made with sustainable production methods and can be distributed through shorter supply chains [14,15]. Local products belong to the identity of a given settlement or region [16], embody a local value, and can be linked to a certain settlement mainly through historical heritage and tradition [17]. According to Feldmann and Hamm [18], the most frequently found definition of local food referred to distances, kilometers, or miles. Based on their description (depending on sources), this distance can range from 10 to 30 m, but it can reach up even to 100 m.
In a British study, respondents considered large food chains as their usual place of food purchasing, and locally produced food was considered as “alternative”. This “alternative” food was primarily considered exclusive and expensive [19]. According to a previous study, customers found local products fresher and tastier. For this reason, they expected to have to pay more for these goods. Due to the availability of the premium price, the practice has also developed in hospitality to highlight the unique features of local products better [20].

1.2. The Role of Short Supply Chains in Rural Development

Renting et al. [3] argued that alternative food supply chains (AFNs) might be important elements of certain rural development paradigms. However, at the same time, the referred authors considered it too early to assess their viability and the effectiveness of their contribution to the goals of sustainable agriculture and rural development. According to Martinez [21], in the United States, local products are related to federal, state, and local government policies. They can be linked to more government priorities, such as strengthening the rural economy, enhancing the environment, or supporting farmers. In many cases, local food originates from small-scale farms.
There are many statements in the literature to show that short supply chains have an important role in sustainable rural development. On the other hand, these systems are less present in the Member States that joined the EU in 2004. In these Member States, the low willingness to pay for local products hinders the development opportunities of short supply chains [22,23]. Local food systems are not necessarily sustainable in economic terms [19,24]. Nor can their other sustainability aspects be generalized in all cases [23].
Short supply chains can be connected to the local economy, job creation, wages, family labor, land use [25]. Local food systems and direct sales may be able to increase the incomes of producers [26]. The participant producers of short food supply chains are small-sized (e.g., References [10,27]); however, it is not exclusive, and often large companies also take advantage of it. According to a Swedish study, for example, farms in short food chains had an average area of 51 hectares [28]. It is greater than the average farm size of the country in 2016 (47.9 hectares) [29]. For small farms, in many cases, direct sales are the obvious solution for achieving higher profits. However, the benefits of short supply chains for farmers do not always compensate for the small size of production and high manual labor costs [5].
From a rural development point of view, short food chains can be related to other rural development practices, especially if synergies and multiplier effects are created between different activities. Such a connection could be, for example, their relationship with agritourism, nature, and landscape [3]. Benedek et al. [30] examined the possible multiplier effects of local products in the local economy. The results show that employment- and income multipliers can be considered more evident, but output- and value-added multipliers were more situation-dependent. In addition to financial interests, producer participation in AFNs may be motivated by the satisfaction of certain social and environmental needs (e.g., needs for social connections and producing food using environmentally sustainable practices) [31]. Similar non-material motivations may be included, for example, preserving traditions, building and maintaining relationships with customers, protecting local values, or environmental reasons (such as sustainability or preserving the natural or cultural environment) [32]. Producer-buyer exchanges can act as a community bond, but of course, not in all cases [33]. Trust can build a strong relationship between the participants, which can influence customer decisions. This loyalty can promote the progressive development of SFSCs [34].
Argent [35] studied Australian artisanal breweries. The craft brewers endeavored to re-socialize and re-spatialize local and regional commodity chains, as well as add an additional dimension to local and regional tourism strategies. Blasi et al. [36] found that in the mountainous area of Trentino, based on cultural and structural characteristics, alternative food chains were considered significant for the survival of the local agricultural sector. Activities that go beyond agricultural activities, such as agritourism, (some) catering and accommodation services, educational farms, helped to establish and deepen urban-rural relations. Through these systems, city dwellers could or can learn about the rural world and learn about agro-food systems and the food production process. At the national level, Renting et al. [3] examined the link between SFSC channels and other rural development practices, such as agritourism and nature and landscape management. In their experience, these practices did not necessarily coincide with the practice of short food chains in the countries studied.
Alternative food systems and short food chains appear in both urban and rural areas, but according to the following sources, their effectiveness in rural economy is questionable. Schupp [37] examined the location of the U.S. producers’ markets. In his experience, producers’ markets rarely appear in rural areas. (They are very rare in areas with below-average socioeconomic status.) He also describes sources according to which producers’ markets mainly affected upper and middle-class buyers. Similar results were shown by Low and Vogel [27], according to which local food trade provided opportunities for economic development, mostly in urban areas [23]. Kiss [38] conducted a quantitative survey with 214 small produces selling in the Central Hungarian region and Heves county, which is a part of the North Hungarian region (overlapping with the sample area of our current research.). According to his results, the producers’ markets around Budapest (the Hungarian capital) were a more suitable commercial alternative for small producers selling directly (compared to conventional marketplaces and market halls.) During the survey, he found the following problem: (The good) producers’ markets were very rare in the rural area studied.

1.3. Characteristics of Customers Who Prefer Short Supply Chains (and Local Products)

Based on the experience of Adalja et al. [39] and other sources, it can be said that consumers typically prefer local products because they perceive them fresh, trust their source, attribute health positives, and environmental sustainability to them. Furthermore, they are able to support small farms and the local economy in this manner. Besides, consumers tend to identify local production with “more friendly” production methods (e.g., animal husbandry with grass feeding). Another reason could be, for example, the perception of higher food safety [40]. However, “local product” does not necessarily mean “good quality” [41], and the sustainability characteristics of short supply chains are situation-dependent [23]. Some consumers are fully committed to local food. Other consumers are only willing to prefer local products at reasonable prices [42]. (The number of the first group is presumably low.) Consumers’ eating and food purchasing habits are related to their lifestyle [3]. Local products can often be considered differentiated or value-added products. For this reason, it is important to understand customers’ willingness to pay for the “local feature” [43]. According to Feldman and Hamm [18], most quantitative, topic-related studies can identify the characteristics, attitudes, and buying habits of consumers who support local food. Several studies (based in primary and secondary researches) suggest that certain social-demographic characteristics (depending on the sources) may be related to consumers’ local product choice habits. These factors may include:
  • Higher age [42,44,45,46]
  • Gender (women) [46,47,48]. (In the experience of Carpio and Isengildina-Massa [45], woman were more willing to pay in the case of local animal products).
  • (Higher) level of education [25,46,47,48,49,50]
  • Higher incomes [18,42,47,48]
In some sources, it was also dependent on whether the person had a family [50] or small child(ren) [44]. Case studies on short supply chains typically do not examine consumer preference in the same respect. Sources describing consumers’ characteristics may examine, for example, community-supported agricultural (CSA) systems [50], consumer communities [44], consumers of producers markets [48], or wide-ranging survey on the consumer shopping habits [49]. Some factors may affect not only willingness to pay, but can also influence individual perception [1]. Mundler and Laughrea [25] describe sources that characterize consumers of short food supply chains as generally well-educated and middle-class. Feldmann and Hamm [18] cite references to the fact that consumers’ local product preference was also associated with older age, greater wealth, living in rural areas, and supportive attitudes toward local food. The experiences of Weatherell et al. [51] also suggest that consumers living in rural areas have shown a greater interest in local products. However, these results cannot be generalized. For example, Chambers et al. [52] did not identify spatial differences in urban and rural contexts. In Brown’s [47] survey, in terms of place of residence, rural consumers were more likely to seek local products, then urban residents, but this did not affect actual willingness to pay. Kumpulainen et al. [53] suggest that preference for local products also depends on the products’ type.
It can be declared that consumer preference for local products is varied. The preference is related to personality traits. For example, people with more caring personalities were more likely to be willing to choose locally made products, according to the experiment by Bazzani et al. [1]. For more extroverted personalities, local characteristics were less important. According to Galt et al. [54], CSA (community-supported agriculture) members are characterized by a preference for food-related activities. They are not disturbed by a (possible) lack of choice and also able to pay in advance (and have enough savings for that). They tend to cook and appreciate healthy food.
Nowadays, purchasing motivations such as the protection of local (regional) producers or the social identity of the region have increased. Tradition, support for local economies, and trust in producers can be important motivations for buying local products [55].

1.4. Consumer Perception of Short Supply Chains (and Local Products)

Perhaps the most cardinal issue for the economically successful operation of short supply chains is the consumers’ actual willingness to pay. In general, customers have a positive attitude towards the locality of production. However, this in itself does not mean that they are able and willing to pay premium prices for these products [41]. In contrast, according to Grando et al. [56], consumers concerned in SFSCs are often willing to pay a premium for products that are made or produced in a socially and ecologically sustainable way. Campbell et al. [43] found that—in connection with other research results on local products and willingness to pay (WTP)—consumers perceive local products as fresher and tastier. This may justify the higher price. On the other hand, their results also show that there is an inverse relationship between price sensitivity and willingness to pay.
According to consumer behavior literature, WTP can be evaluated in many ways [57]. Many authors have proposed different hierarchical classification frameworks for organizing existing methods. Breidert et al. [58] divided the methods into four groups based on their use of surveying techniques or actual or simulated price-response data:
  • Revealed preference: (1) Market data, (2) experiments (laboratory experiments, field experiments, auctions);
  • Stated preference: (3) Direct surveys (expert judgement, customer survey), (4) indirect survey (conjoint analysis, discrete choice analysis).
Each method has specific theoretical and practical advantages and disadvantages.
In the absence of revealed preference data in our research, we used a direct survey method, including the customer survey, to estimate the willingness to pay. The open-ended question gives the descriptive amount of the WTP, while the close-ended question can be asked using some methods or tools [59]. For example, it is possible to examine whether the consumers would be willing to buy a given product for a given price. Another example is when they specify a percentage surplus (e.g., 5, 10, or 25%) they are willing to pay for a certain product [43].
According to the results of Carpio and Isengildina-Massa [45], willingness to pay was higher among respondents who attributed higher quality to local products (compared to products originated outside from the Member State, SC, USA). For this reason, communicating the quality characteristics of products can be an effective advertising tool. In the sample of the cited authors, willingness to pay was considered high, averaging 23% and 27%, depending on the given product-category (Table 1).
There are several studies in the international literature that have measured the consumers’ interest and willingness to pay for local products. However, these studies show very different results in space and time. Not all consumer survey results confirmed a stronger preference for local products. According to earlier results of Eastwood [64], (cited in Carpio and Isengildina-Massa [45] p. 423), consumers (at the time of the survey) did not have an obvious preference for selected local products grown in Tennessee. Brown [47] surveyed food consumption habits and local products of certain U.S. households (number of responders—544). The level of preference for local products was rather low—58% of responders said that they would only choose a local product (over non-local one) if it were priced the same as the product used for the basis of comparison. In total, only 12% of the respondents were willing to pay a premium of 10% or more. As a result of a literature review, Checchini et al. [65] concluded that (based on the given examined sources), “local” production generally had less impact on consumers’ willingness to pay. Although few studies deal with comparative examinations on willingness to pay for different local products, experience shows that consumers’ willingness to pay also varies from product to product. In addition to the willingness to pay, the purchased quantity must also be taken into consideration because the two may even contradict each other [18]. According to the experiences of Chambers et al. [52], consumers were mostly deterred from purchasing local products by the high prices and inconvenience associated with shopping.
Based on our own previous experience and the experiences of other Hungarian studies, it can be said that Hungarian consumers are very price sensitive [63]. Apart from producers’ goods or local products, Lehota and Lencsés [66] assessed the willingness to pay of Hungarian consumers on a sample of more than 1000 people. The examined factors were: safety, quality, taste and freshness, environmental impact, and ethical factors. In their experience, the willingness to pay a premium price in connection with these factors was very low.

2. Materials and Methods

2.1. Background of the Primary Research

Our online consumer survey was conducted in the framework of the research project “EFOP-3.6.2-16-2017-00001 (Full title of the research project: EFOP-3.6.2-16-2017-0000: “EFOP-3.6.2-16-2017-00001 Complex rural economic development and sustainability research, development of the service network in the Carpathian Basin.”) We aimed to make a comprehensive survey on consumers’ food purchase preferences, focusing on the demand for local products and willingness to pay. The questionnaire contained 18 questions (and question groups) based on single choice or Likert-scale assessments. The sampling was done online in 2018 and 2019. 1034 respondents participated with evaluable answers (in the case of minimal missing answers or values, the responders were not excluded.)
The research project is related to the North Hungarian region; accordingly, 86% of the participants in the sample lived in Heves, Nógrád, or Borsod-Abaúj-Zemplén counties. The remaining respondents originated mainly from settlements close to these county borders, or Pest county or Budapest (the Hungarian capital). The questionnaires were collected online with the help of our colleagues involved in the project. Using the internal email system, we asked the staff and students of Eszterházy Károly University to fill out the questionnaire. Furthermore, we sent the request to all the settlements’ local government offices in the region and asked them to fill out and distribute it. We also used the opportunities provided by social media; for example, we shared the questionnaire in Facebook groups and distributed it to our friends and acquaintances. Our survey is a general consumer survey, but it is not considered representative.
The result of the survey was analyzed using IBM SPSS statistical software and Microsoft Excel. Chi-square (χ2) tests and Cramer’s V coefficient were calculated to compare non-metric data in the evaluation. Analysis of variance (ANOVA) was used to compare non-metric and metric data. In one case, the Pearson correlation coefficient was used to compare metric data. The statements were based on the significance level of 5% (widely used in statistics). In another case, factor analysis was used to reduce the number of variables.
The strength of Cramer’s V coefficient was evaluated based on the “statistics how to” website [67]. According to that source, our statistically significant results can be considered as having “weak or medium” strength. According to a different source [68] and scaling, all of our results count as “weak.” For the avoidance of doubt, the exact value of the coefficient is described in the text or appendixes.
Our survey was an online questionnaire with a total of 18 questions or a group of questions. They were mostly based on single choices or Likert-scales. The advantages and disadvantages of the online survey were experienced during our survey. The questionnaires could be sent to a potentially large number of responders quickly, cheaply, and through a variety of online channels. The filling out process was convenient and easy for respondents. In contrast, the group of internet users does not represent, for example, the population of a given country or territory. Surveying methods, like widespread emailing, are criticized by many researchers. Furthermore, online fills are impersonal and “self-administrated.” For this reason, it is essential to formulate the exact response instructions. (More information on the advantages and disadvantages of online surveys [69].)
The subject of our study is a short food chain and local food. Referring back to the “Conceptual approach” chapter, the definition of local products is not uniform. In our research, we examined the food products of small local producers. From the authors’ point of view, in this respect, we considered products to be “local foods” if they originated from a local (small) producer and were traded typically through short food supply chains. Based on the previously cited Hungarian legislation [6], the distance of 40 km between the place of production and the trade was considered “local.” It should be noted that the opinions of our respondents may have been different, as we did not explain this definition to them. It is possible that consumers did not think in this way of a uniform concept about local products. In hindsight, this could even lead to a distortion of results.
We used terms of “products of local (small) producers” and “foods from local producers” in the questionnaire. We used these terms synonymously with “local products.” For example, our question on respondents’ theoretical willingness to pay was the following: “What percentage are you willing to pay more for a local producer’s product, compared to a “large-scale product” in the same quality?” In addition to assessing the theoretical willingness to pay, we also asked the consumers about their monthly spending on “local producers’ products.”
We asked the respondents the following open-ended question: “What local product brands do you know?” A total of 375 valid answers were received to this question. From this group, 321 respondents (85.6%) mentioned products of relatively small food-producers originated relatively close to their place of residence. We received a lot of feedback that they cannot mention given brands, just the person producing it. As another point of reference, we mention that according to the feedback from our preliminary survey of 30 people, the respondents considered “goods purchased from producers at marketplaces” as “local products.” (In the survey, we dealt only with food products.) Based on these examples, the application of the “local product definition,” we formulated earlier, can be justified.
The EUR values presented in the study have been converted from HUF to an exchange rate valid in 2019. Consumers’ expenditures can only be interpreted in relation to Hungarian prices from 2018 and 2019.

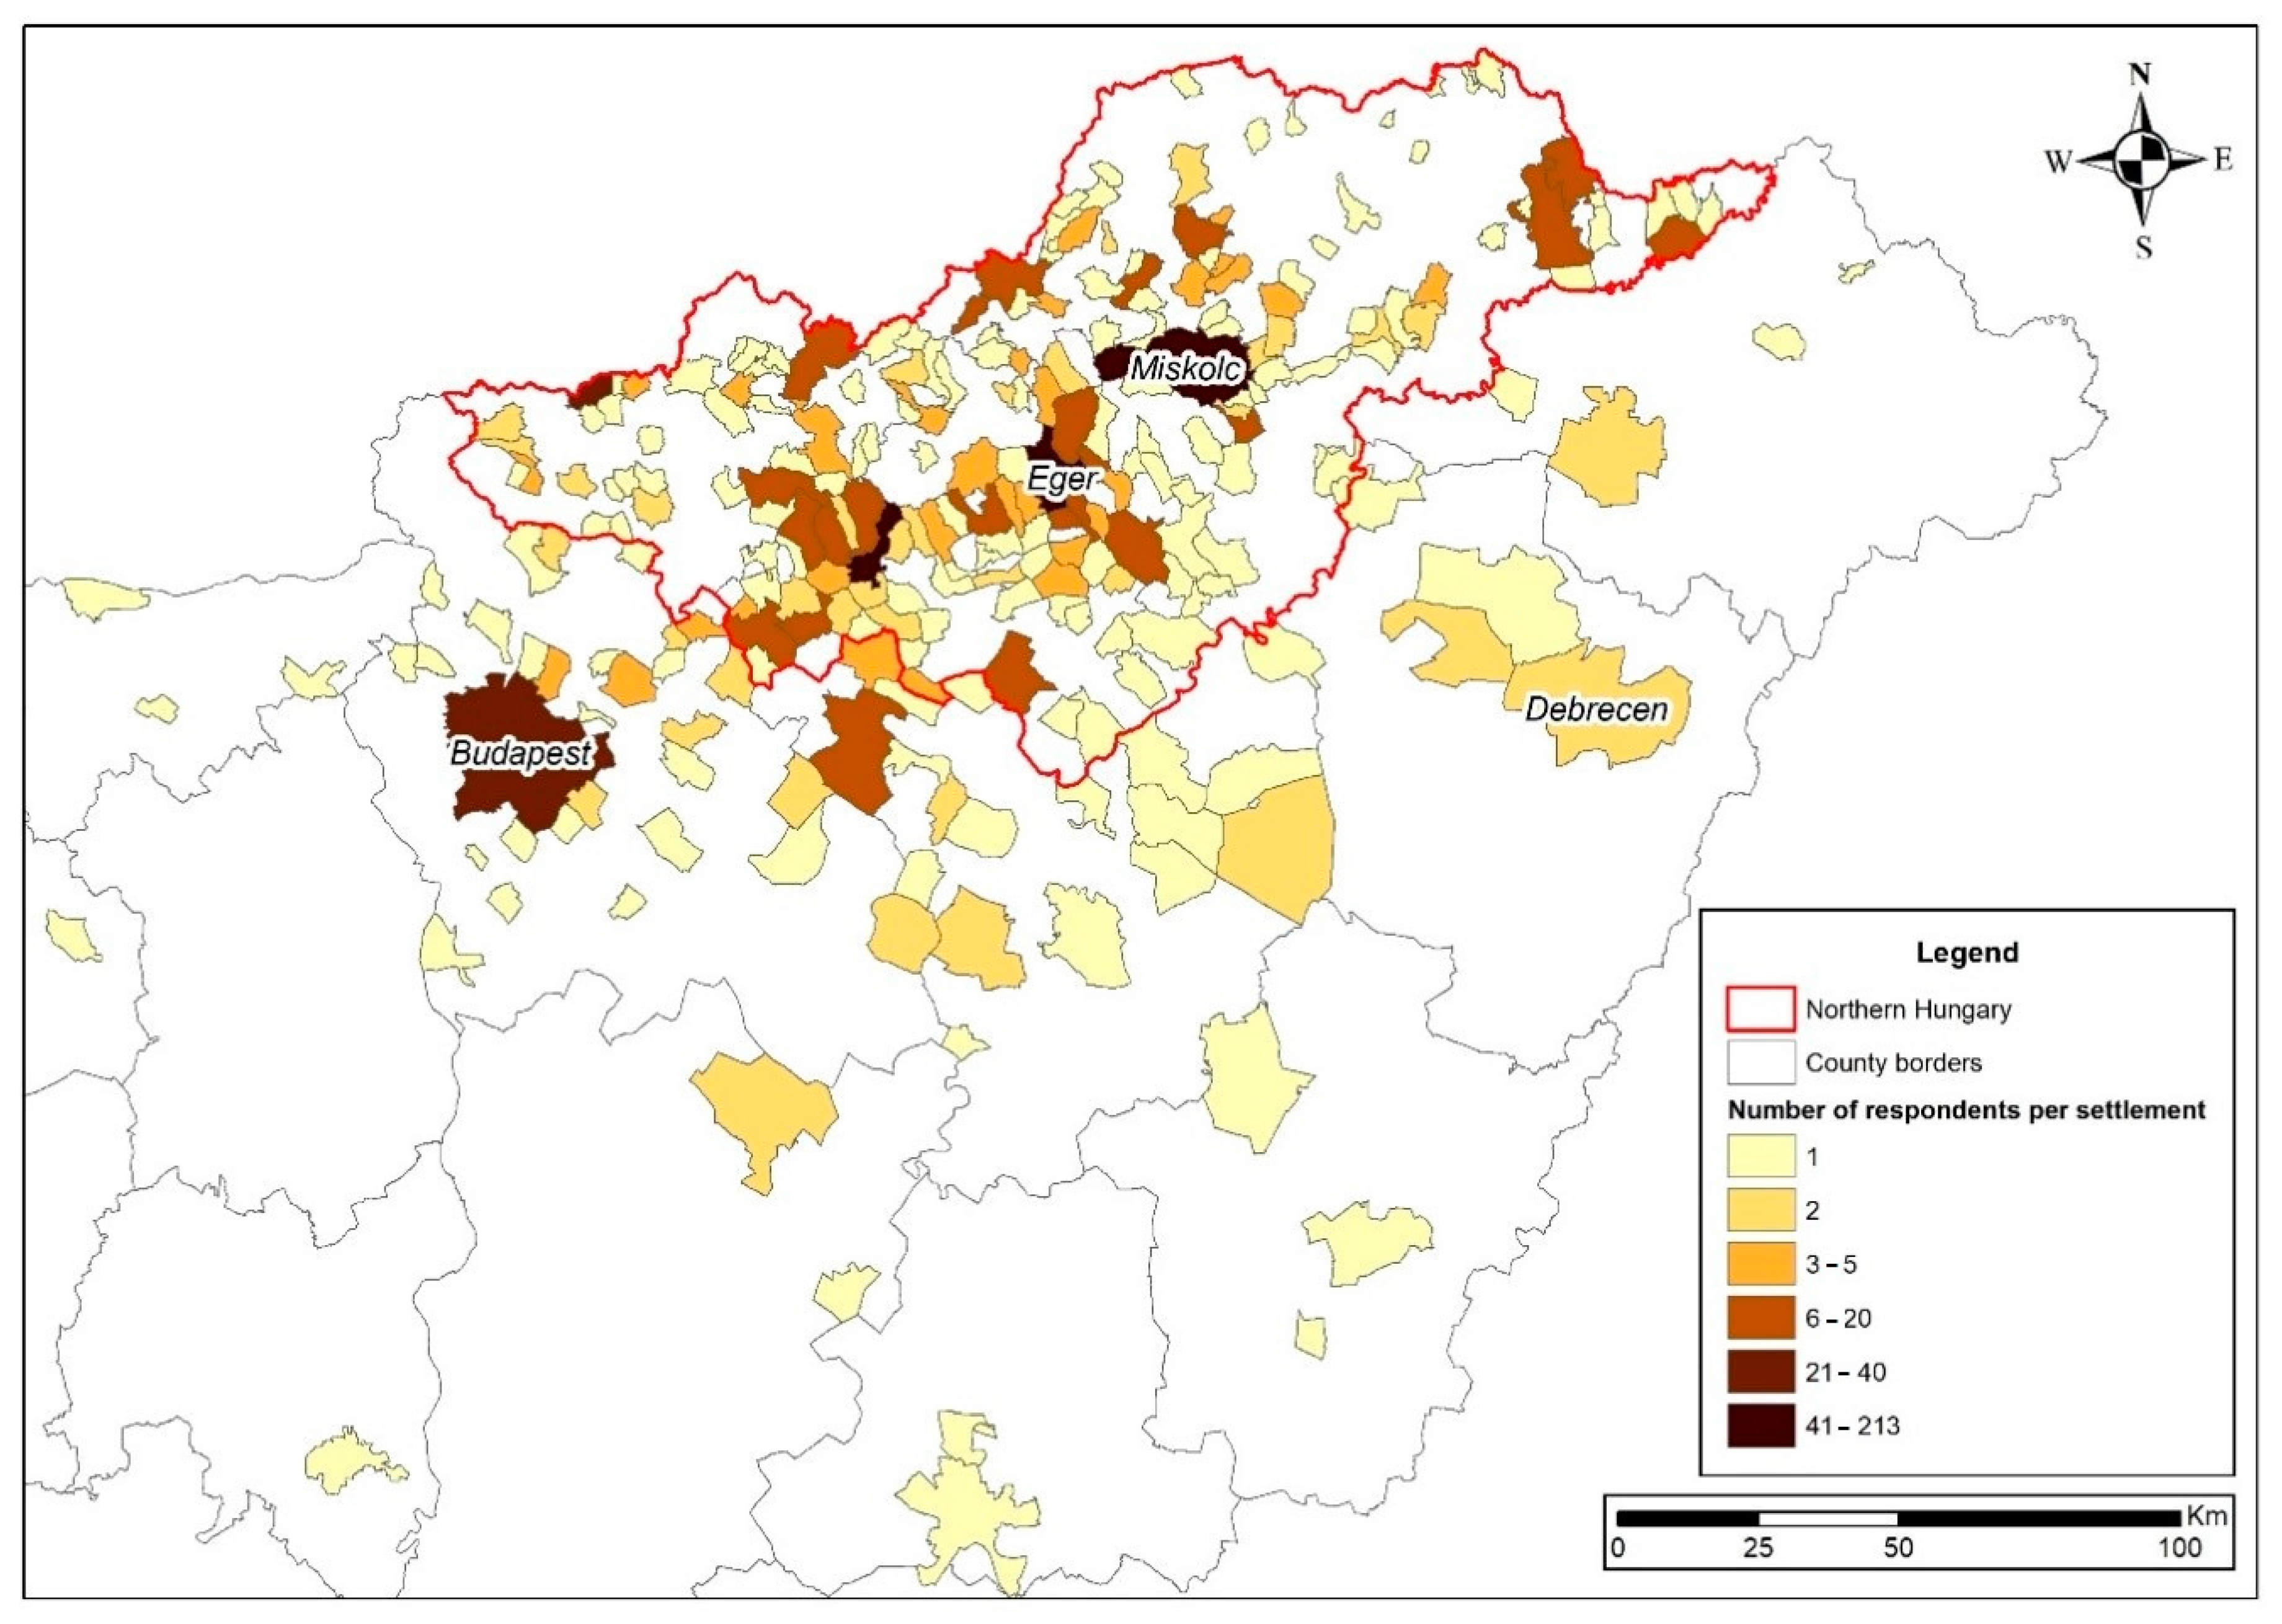
2.2. Sample Area of the Research

The region of North Hungary is considered a rural area. The North Hungarian region is on the second level (NUTS2) according to the NUTS nomenclature of the EU, which means that it has at least 800.000 inhabitants, but fewer than 2.8 million) [70]. This classification is valid for the next planning period of 2021–2027. These regions have a different scale in GDP, which determines three categories:
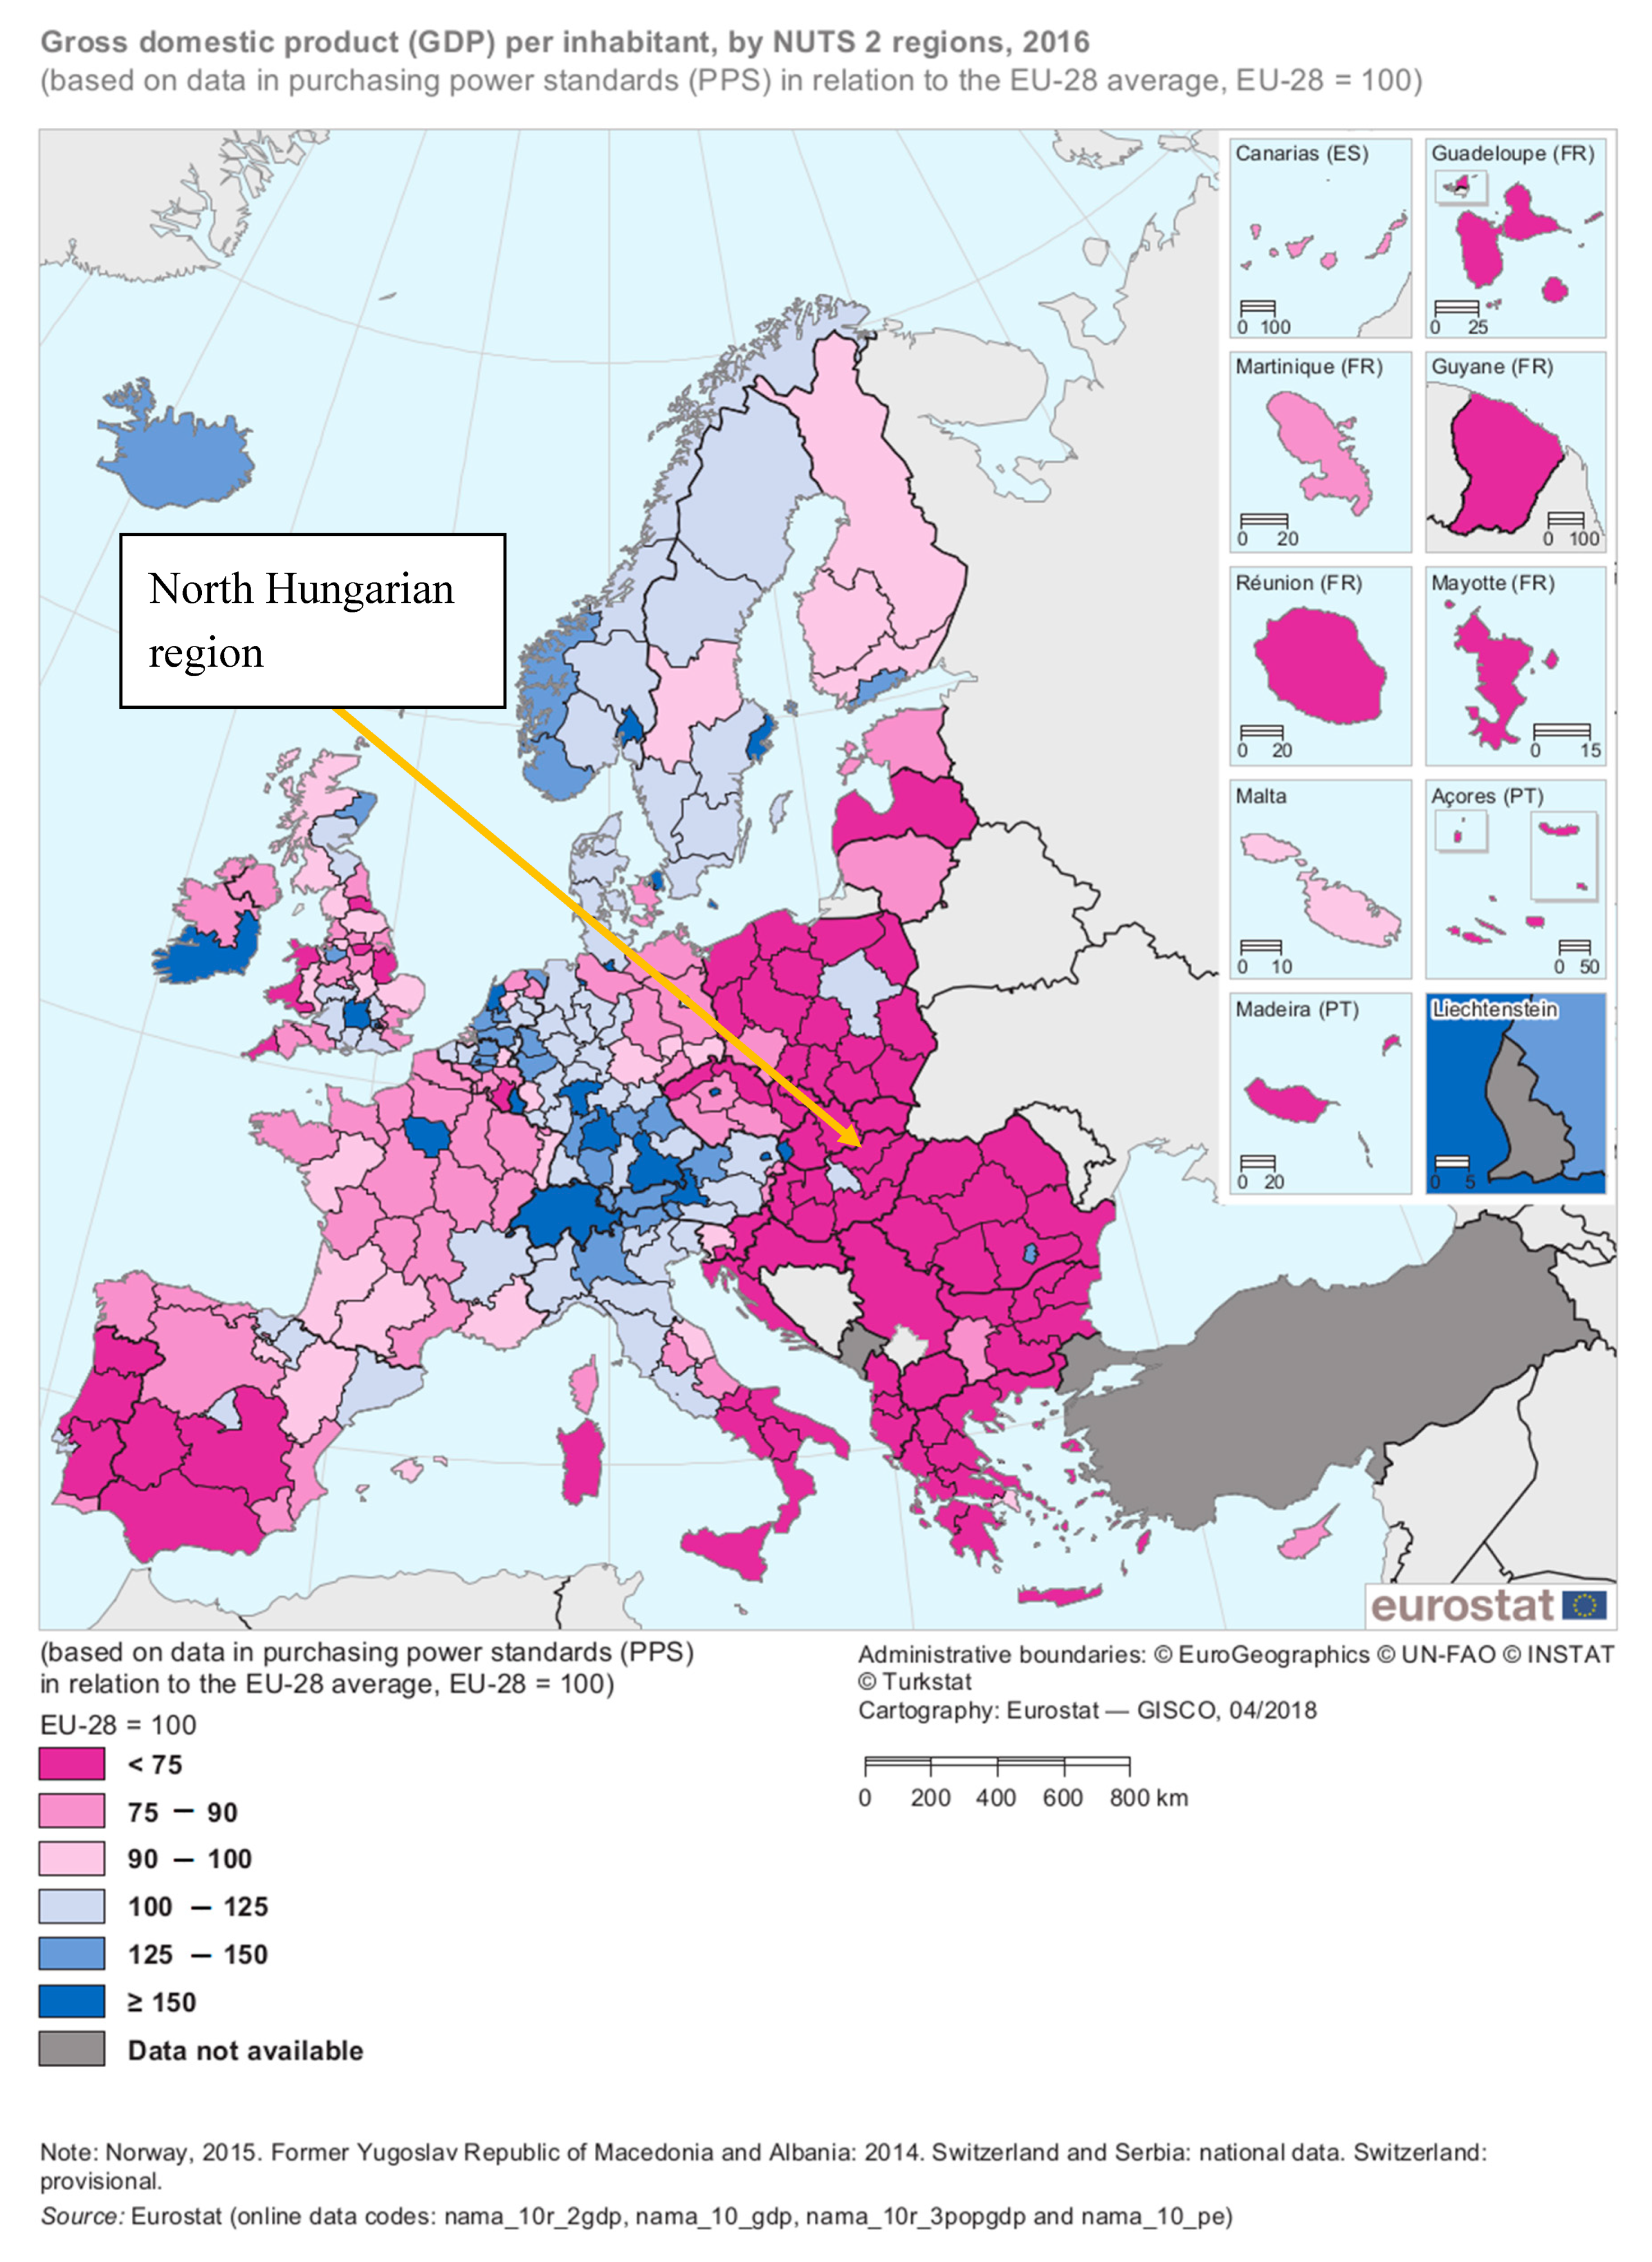
  • Less developed regions (where GDP per inhabitant was less than 75% of the EU average);
  • Transition regions (where GDP per inhabitant was between 75% and 90% of the EU average);
  • More developed regions (where GDP per inhabitant was more than 90% of the EU average) [71]
The North Hungarian region is a relatively underdeveloped NUTS 2 unit in the EU because it has a lower GDP value than the EU average (because of its predominantly rural position). (Appendix A). It can be considered as a lagging, old industrial region and a modest innovator [72]
Its low population density evidences the rural character of the region. Based on “The Wye Group Handbook” [73], it can be said that in Hungary, based on population density, areas below 120 people per km2 are typically considered rural regions. (However, this measure varies from country to country.) In comparison, the population density of the North Hungarian region was 83.88 persons/km2, in 2018, which is slightly lower than the regional average without the capital (87.71 persons/km2). As a comparison, the population density of the urban Central Hungarian region (without Budapest, the capital) was 200.1 persons/km2. (Source: Calculated from HCSO (Hungarian Central Statistical Office, Budapest, Hungary) data [74]).
In the North Hungarian region, the population density exceeds 120 persons/km2 exclusively in the districts of the county seats and the most industrialized areas. In more than half of the districts, it does not even reach 60 persons/km2 [75].

3. Results

3.1. Demographic Characteristics of the Sample

The composition of the sample was determined by the fact that the questionnaire was queried online. Among the participants, the women (69%), people younger than 35 years (49%), with a college or university degree (50%) were overrepresented compared to the national average. (This is not surprising, because a higher proportion of young people use the internet regularly.) The average age of the sample was 37.76 years (with a standard deviation of 13.43 years). Responders of retirement age were minimally represented in the sample. In terms of marital status, the majority of respondents were married (41%) or had a common law-partner (not married) (24%). The number of people living in one household was evenly distributed:
  • One person—8.5%
  • Two people—26.7%;
  • Three people—26.6%;
  • Four people—25.1%;
  • Five people—9.6%;
  • (and some larger households and missing values) [76]
As already mentioned, 86% of the 1034 responders originated from the settlements of the North Hungarian region (Figure 1).

3.2. Consumer Preference for Local Products—Compared to the International Literature

In the “Literature review” chapter, we stated that the definitions of “local products” are not uniform [12,13]. As we explained in the “Materials and Methods” chapter, we did not provide a previous definition of local products for the respondents. Everyone could determine for themselves what they considered a local product.
The results of the survey support the trend presented in the “Literature review” [2] that local producers’ sales had only a minor role in the food trade. One third part of the respondents bought only up to 16 EUR worth from local producers on a monthly average. Another third of them bought between 16 and 31 EUR. (Only) the remaining part of the customers had a more significant demand. (Figure 2).
Among the food categories we examined, consumers mainly bought honey, eggs, fruits, and vegetables form small producers. (The least typical foods were sweets, cooking oil, fat, margarine, and flour, dry pasta.)
Based on these monthly expenditures on local producers’ goods, we examined the consumers as separated groups. We compared these groups based on the demographic characteristics and purchasing habits of the customers. The majority of the sample consisted of women; however, there was no statistically significant correlation between the gender of the respondent and the monthly expenditure on local producers’ goods. Marital status also did not cause significant differences between the groups examined on the basis of monthly expenditures (Table 2). These results are not related to the results presented in the “Literature review” that consumers preferring local products are mainly women [46,47,48] or those who have a family [50]. An important note is that our survey did not examine the number of children of consumers. The survey included a question on the number of people living in one household, but it was not possible to identify the given persons. For this reason, there is no information on whether responders have children or not. Therefore, we could not support or reject Bakos’s [44] experience that mothers with small children are also significant (potential) consumers of local food. According to our results, the number of people living in single households was positively correlated with monthly expenditures on local producers’ goods only in the case of an 8% significance level. Therefore, the strength of this relationship is weak (value of Cramers’ V association: 0,086).
In contrast, statistically significant correlations were observed in the case of a higher level of education, age, and financial status. However, based on the Cramer’s V coefficient, these results can be considered just weak or moderate in strength. The results of the literature [42,44,45,46] were confirmed, that the preference for producers’ goods or local products increased with age, and younger responders were less interested in these products. Responders with a higher level of education were more receptive to local products (presumably related to their higher age also) [25,46,47,48,49,50]. (It should be noted that some of the 20–35 years old respondents presumably are not the main purchasers in their households.) Consumers with higher incomes were also more interested in producers goods, similarly to the trends presented in the “Literature review” [18,42,47,48] (Table 2).
Consumers were asked—in order to assess their theoretical willingness to pay—about the percentage of premium they are willing to pay for local products compared to a factory-made product of the same quality and type. (By the term “factory-made” we referred to non-local products originated from mass-production). In the whole sample, the average value of this premium is +20.7%, and it was positively related to the monthly values of the local product purchased (Table 2). This percentage is a relatively strong preference compared to the sources presented in the “literature review” (see Table 1). Compared to this willingness to pay, we consider the monthly quantity of purchased products low. An explanation for this phenomenon may be Feldmann and Hamm’s (2015) [16] remark that, in addition to examining willingness to pay, the purchased quantity should also be taken into account. The two may even contradict each other.
In addition to demographic characteristics, we also examined the consumers’ attitudes. As consumer behavior is related to several factors, we have included many aspects of product quality and product selection in the survey.
The general attitudes of product choice were measured by 11 indicators. Determining factors in consumers’ product choices can also influence their preferences for buying local products. Consumer decision is influenced by price sensitivity. Based on the “Literature review” (Section 1.3 and Section 1.4) and the experience of the current survey, it can be concluded that perceived good product quality can increase preference for local products. Preference can also be related to environmental awareness and local attachment. Our survey on consumers’ product choices was based on these factors, and other elements like the demand for organic products, the influencing effect of advertisements, as well as family traditions, were added. The examined indicators were rated by responders on 5-rank Likert scales. The results help to determine the preferences of consumers who are more interested in local producers’ goods (Table 3).
Examining the aspects of product selection, it can be concluded that the price and quality of the products were important for all groups. The consumer group that mostly preferred small producers’ goods was less price sensitive. (This obviously related to higher incomes.) For them, the producer, the (Hungarian or local) origin, quality, and uniqueness of the product were more important. Our results are related to case studies which show that consumers seek good quality in local products, and it is an important reason for their preference (e.g., Reference [39]), and the reliable (or local) origin is important to them.
A pronounced need for organic products was not observed, but this factor was also most important for consumers with higher monthly expenditures. The importance of personal contact, environmental awareness, and family traditions were also most noticeable among the groups with higher expenditures. The significance of the differences was examined with Chi-square tests and Cramer’s V coefficients. Except for the influence of advertising, all factors were statistically significant in relation to monthly expenditures on producers’ goods. However, with the exception of the demand for organic products, these relationships cannot be considered determinant (Appendix C).
The correlation between perceived product quality and preference for local products could also be demonstrated by a deeper empirical analysis. We asked consumers if they perceived the following factors on local products, and whether this influenced their purchasing decisions: freshness, constant quality, good taste and smell of the products, high nutritional value (e.g., vitamins), naturalness, good appearance (color, size, shape, soundness) and cleanness. With factor analysis, these attributes could be easily reduced to one factor; thus, we had the opportunity to treat them as one. (The value of the KMO (Kaiser-Meyer-Olkin) indicator used as a criterion test is 0.833. This indicates that factor analysis could be performed) The values of this factor representing product quality were positively and significantly related to monthly expenditures on local producers’ goods. (Test method: One-way ANOVA (analysis of variance). F value: 17.032, degree of freedom (df): 4, significance level: 5%. As a criterion test, the homogeneity of variance was examined with Levene’s test. The condition was fulfilled). Furthermore, there was a positive correlation between the values of this product quality factor and the theoretical willingness to pay on local products. (Test method: Pearson correlation coefficient: After excluding distorting (high) values, 879 consumers were included in the calculation. The result showed that even with a significance level of 1%, there is a positive relationship between the numerical value of the examined quality parameters and the willingness to pay. The value of Pearson’s correlation coefficient was 0.129).
The respondents were asked to rate different sales channels on a five-rank Likert-scale, according to how important they are in the case of food purchasing (Table 4). The most important food purchasing channels were supermarkets and discounts. They were followed by (conventional) markets, where both traders and producers could sell. In the third place were hypermarkets. Sales channels for small-sized producers, such as producers’ markets, fairs or festivals, purchasing at the producers’ place, or home delivery, were pushed in the background on the list.

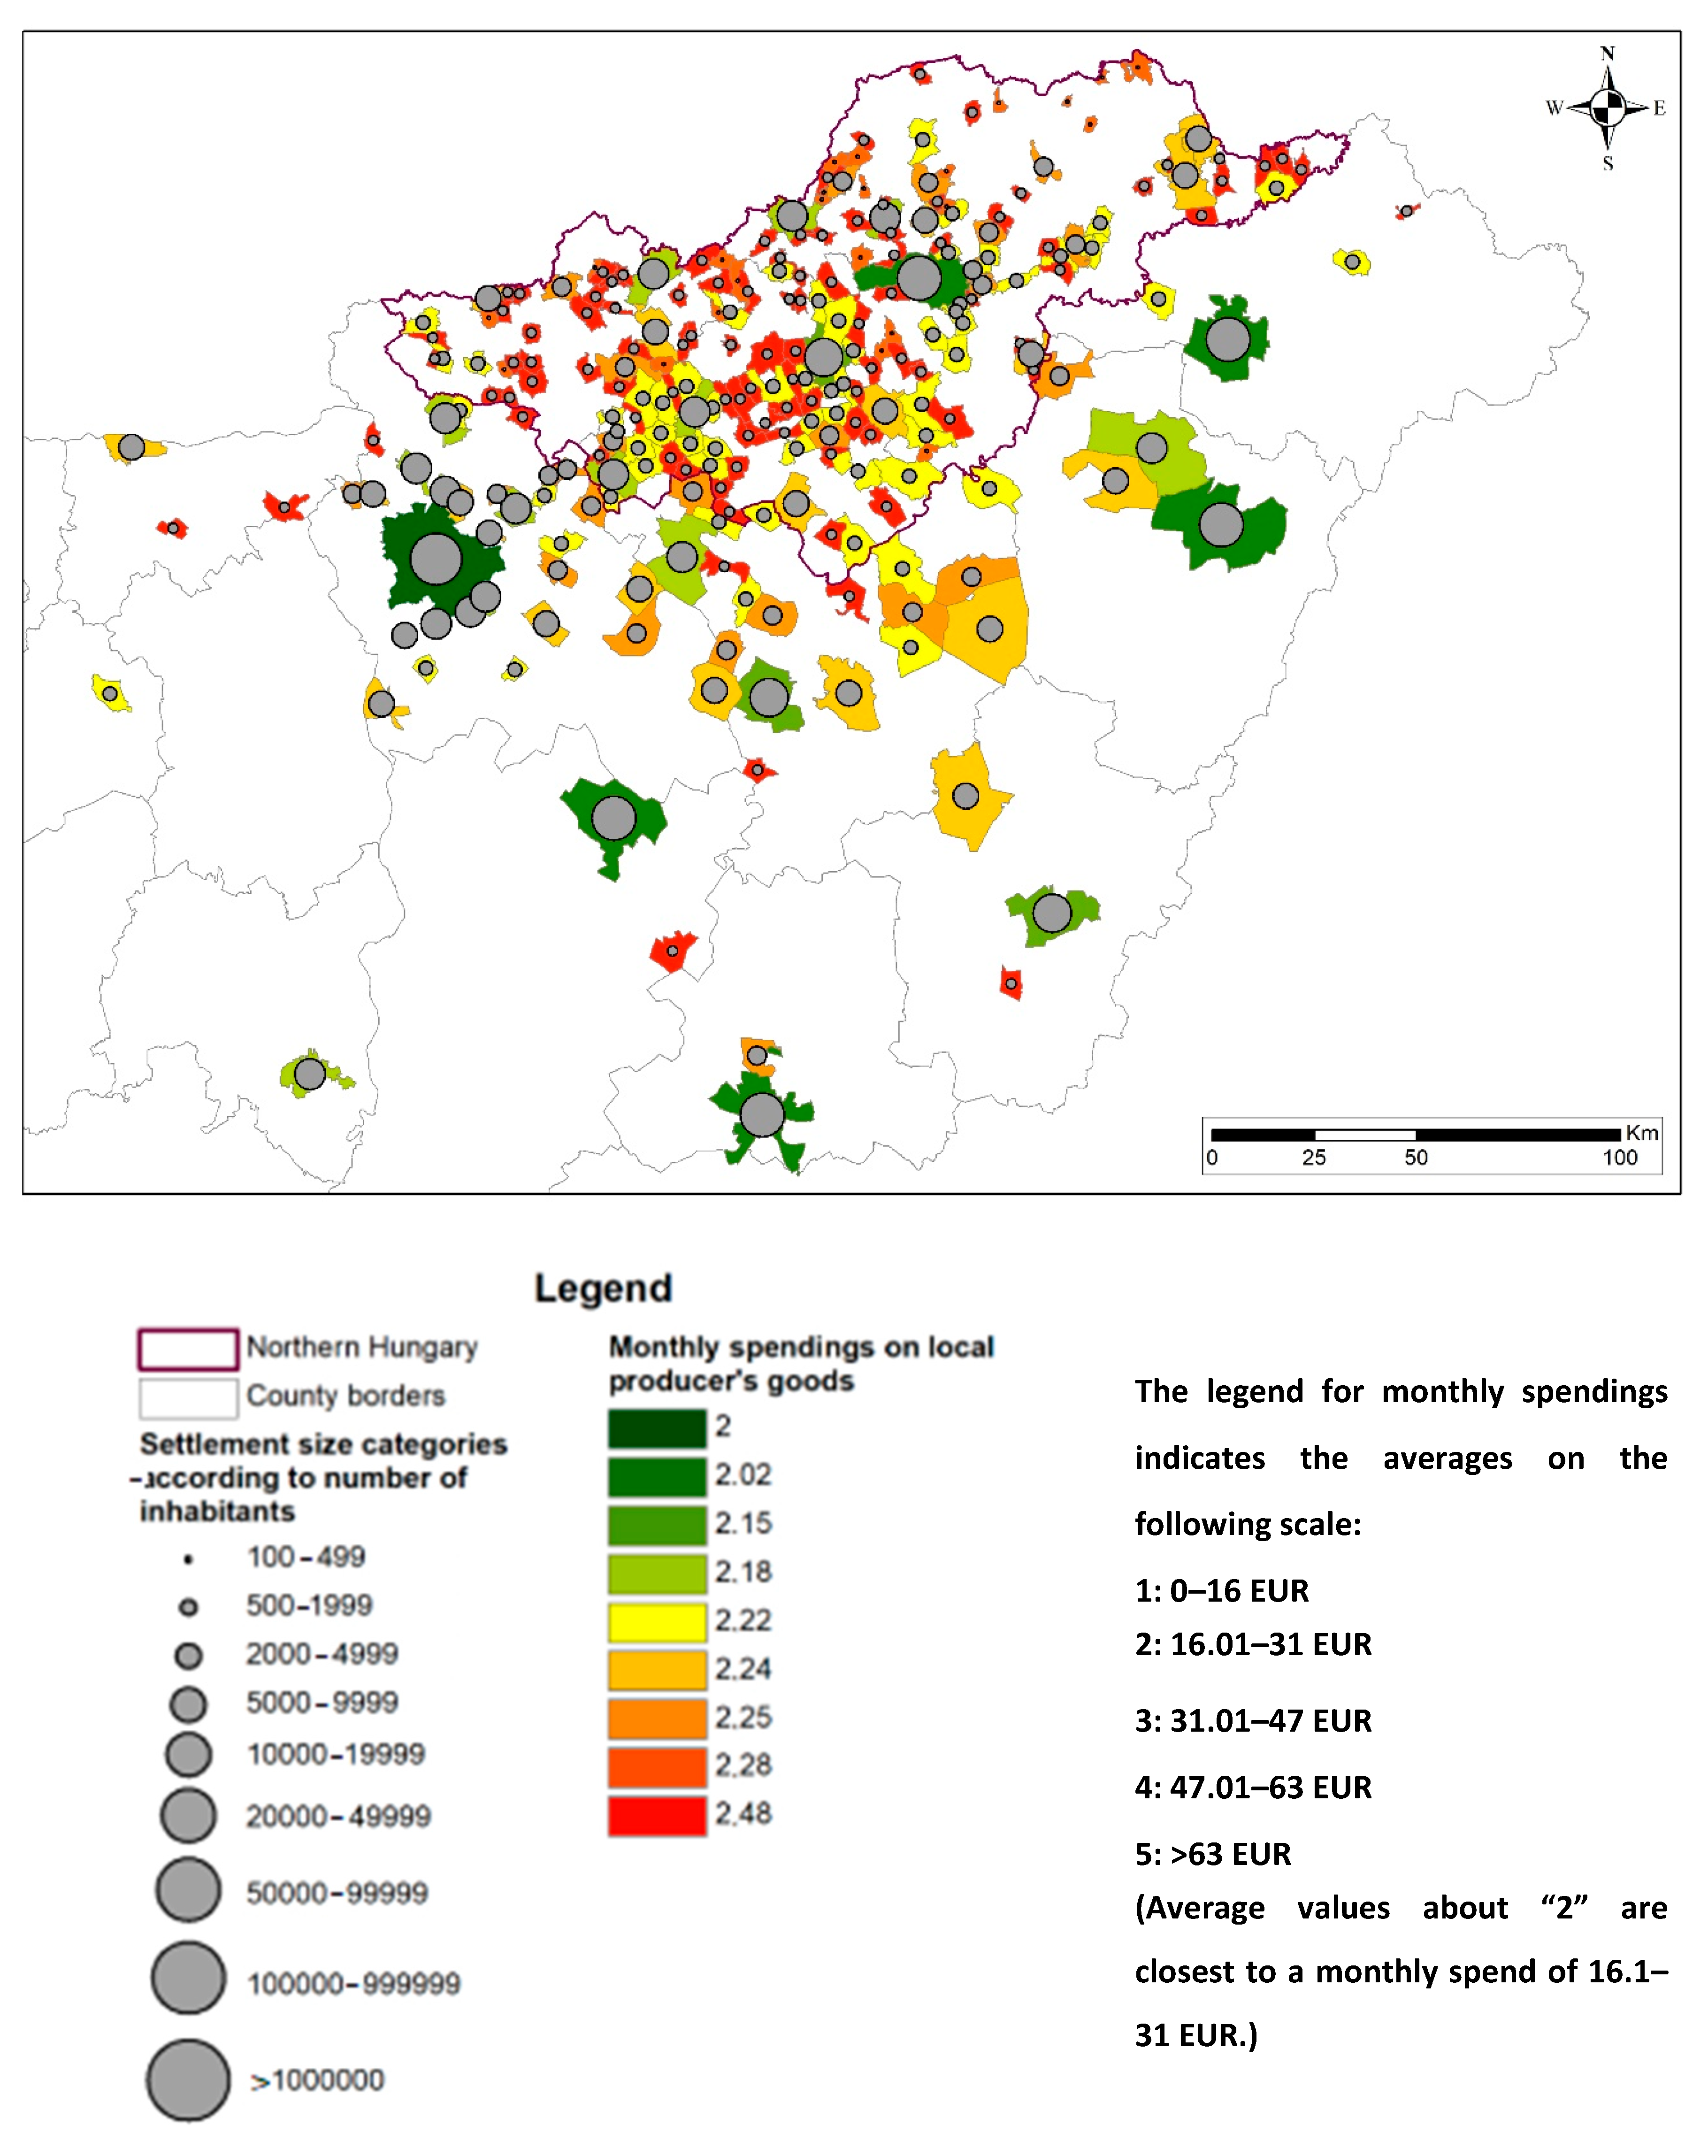
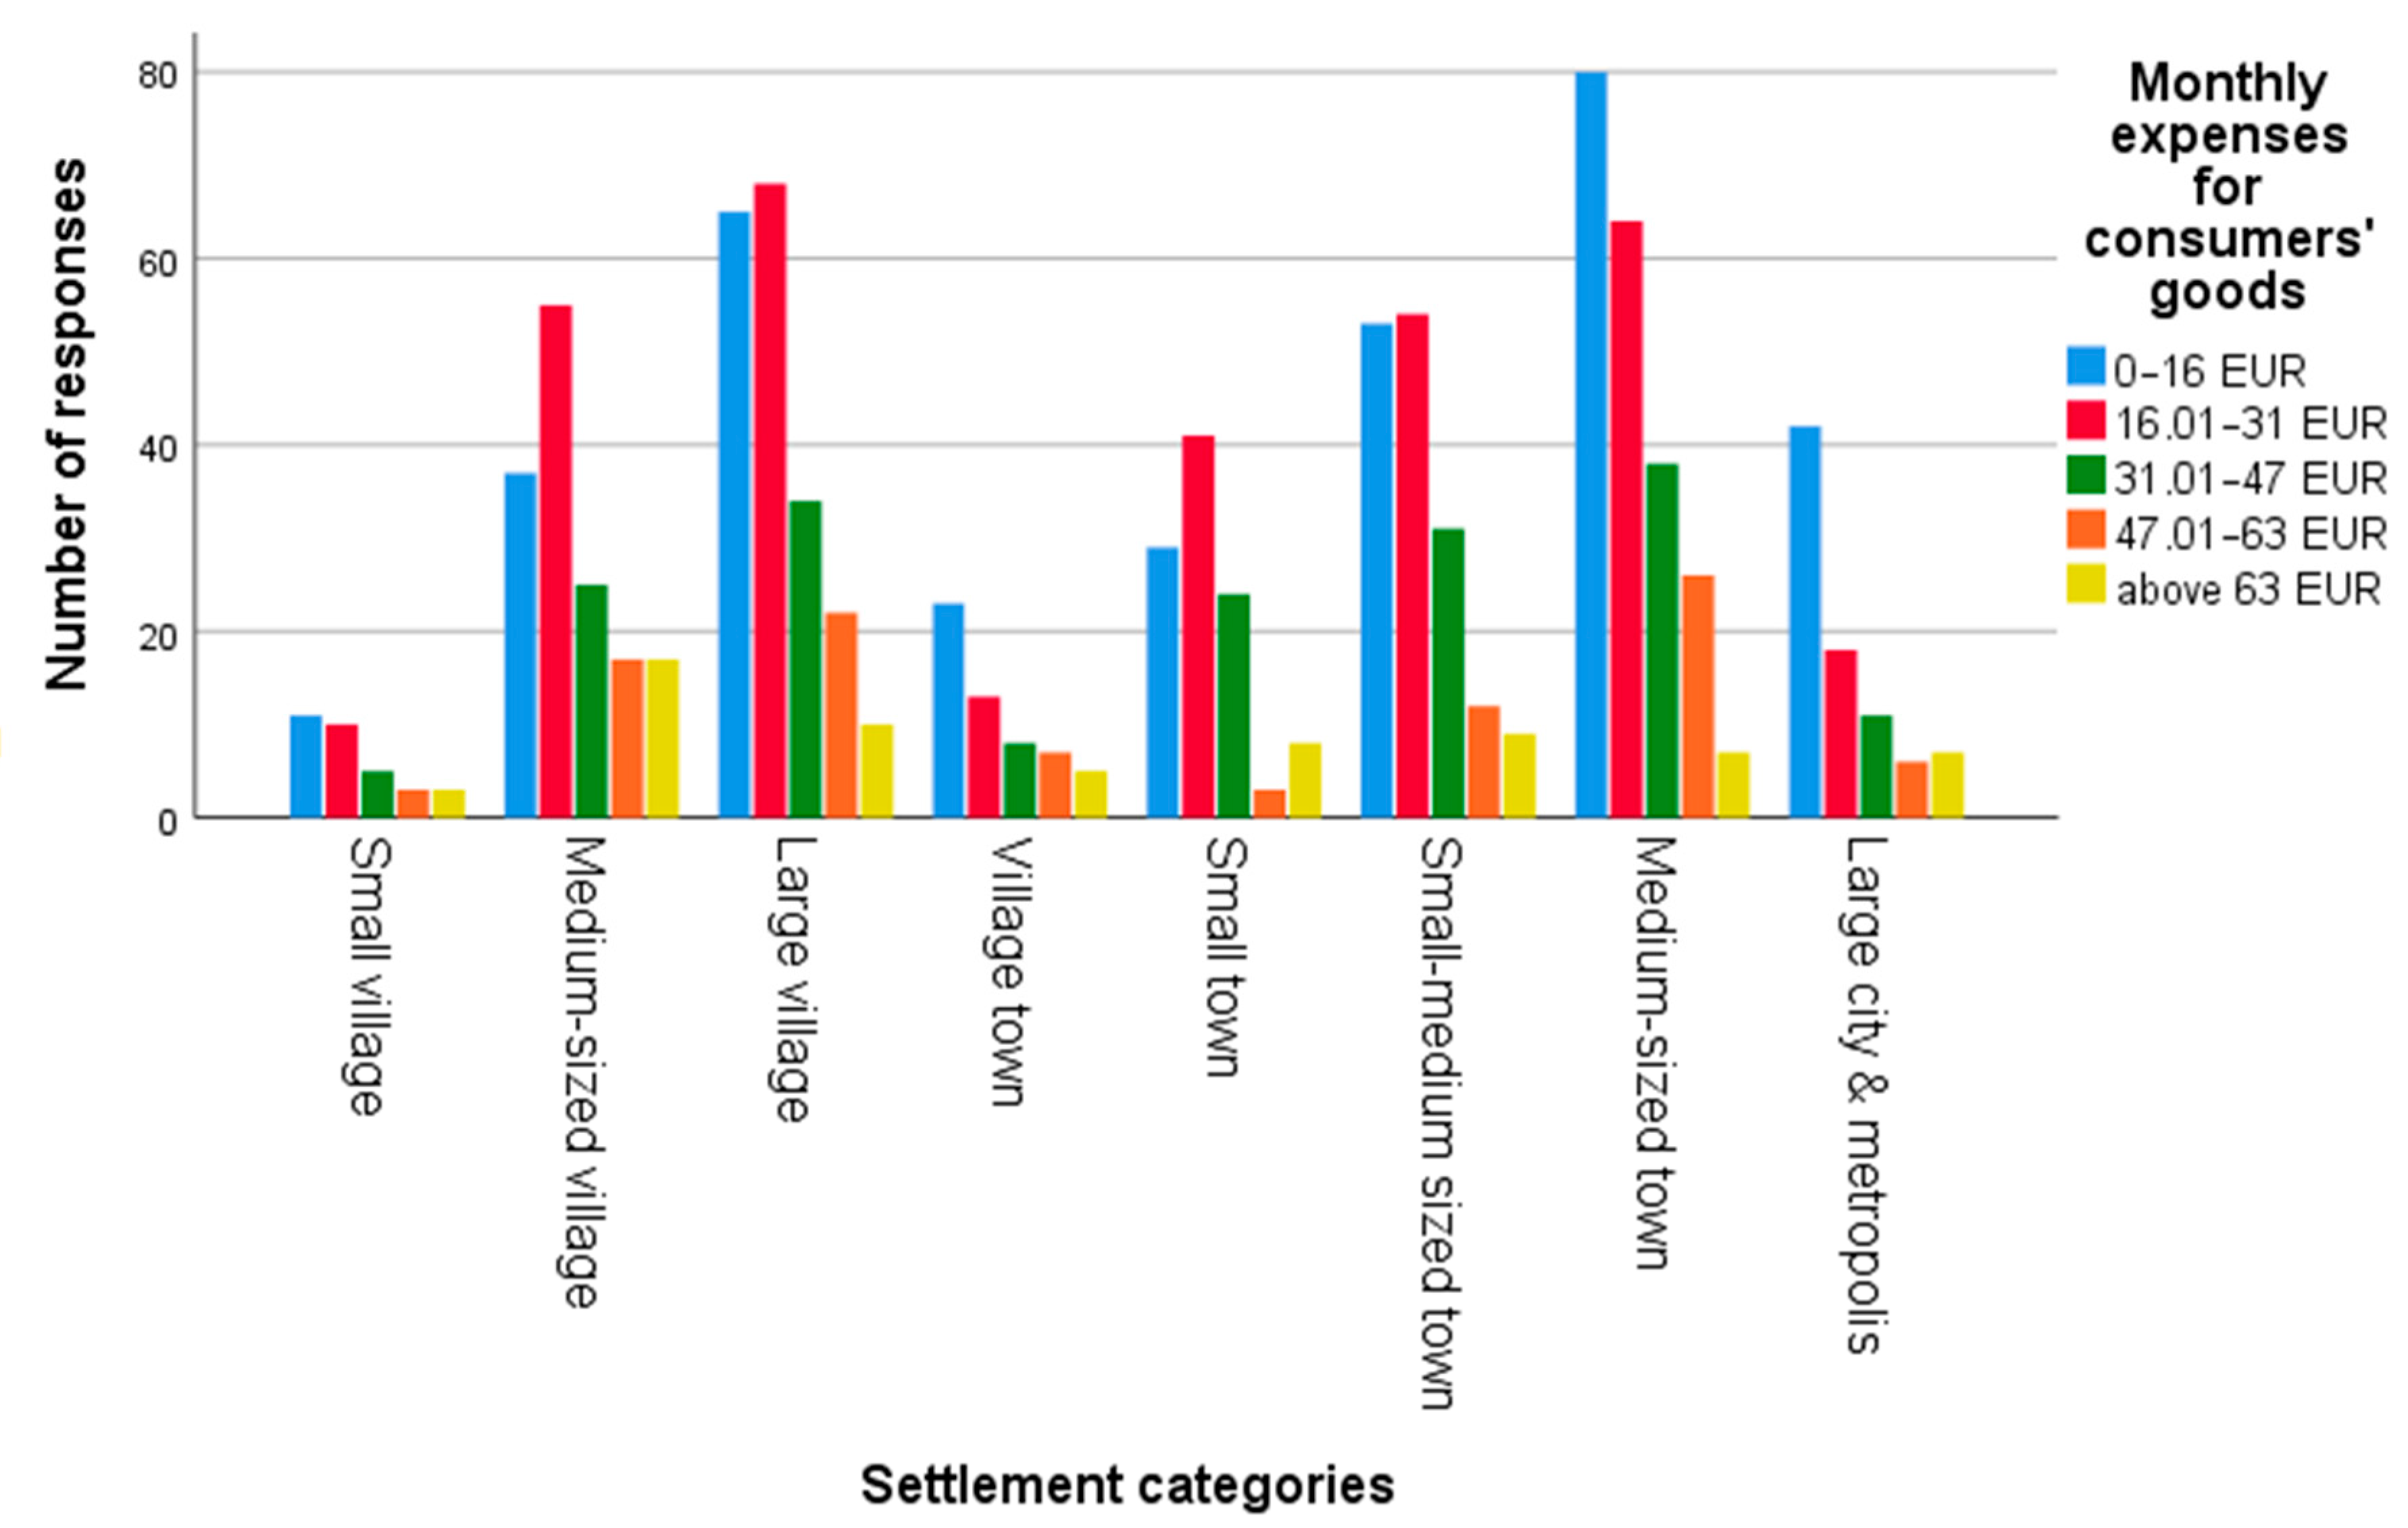
3.3. Territorial Correlations of Demand for Small Producer Goods

The respondents who completed the questionnaire originated from settlements of different sizes and functions. There was a significant relationship between the respondents’ types of residence and their monthly expenditure on local products. (χ2 = 46.480, df = 32, Cramer’s V = 0.108). (Table 5, Figure 3 and Figure 4). The relationship is medium or weak. The results are coherent, for example, to Weatherell et al. [51] findings, who also found the rural residence of customers decisive.
We can see that the theoretical willingness to pay was also slightly higher in villages and small towns than in larger settlements (with the exception of the “large city” category). We calculated ANOVA to compare differences. Based on the previous Levene’s test, the ANOVA does not meet the necessary criterion on the homogeneity of variance. However, apart from this, the result of the Analysis of Variance can be considered statistically significant only at the significance level of 10%. (F value: 1.698, df: 8, level of significance: 0.095). Therefore, the result is significant.
We did not find a statistically significant relationship between the self-reported income level of the respondents and the place of residence.
Respondents living in villages and small towns spent, on average more on small producers’ goods per month than those living in towns and cities with a population of more than 20,000. (The 20,000 residents in our survey indicated the upper limit of the “small town” category.)

3.4. Further Contexts Suggesting the Importance of Local Products in Rural Settlements

We have successfully identified additional relationships that suggest that respondents living in smaller settlements (‘rural areas’) are more receptive to local products than respondents living in towns. Chi-square tests, Cramer’s V coefficients were used to show the following correlations. (Table 6).
We found statistically significant spatial differences between respondents’ place of residence and preference for different shopping places.
  • Based on our Chi-square tests, there was a statistically significant difference in people that lived in large cities and preferred the hypermarkets as food-shopping channels. The relationship is not strong (the value of the Cramer’s V coefficient showing that the strength of the relationship is 0.116).
  • It showed a slightly stronger correlation (Cramer’s V: 0.128), that discount stores and supermarkets were preferred by urban respondents over those living in villages.
  • In contrast, village respondents rated higher the importance of convenience stores (Cramer’s V: 0.130).
  • Villagers had a slightly greater appreciation for the marketplaces as sales channels (on a five-rank scale with an average of a few hundredth-place values), but the difference is not statistically significant.
  • Shopping in specialized grocery stores (such as bakeries) was less common in large cities (Cramer’s V: 0.115).
  • There was a weak yet statistically significant difference in the greater importance of purchases from producers, on farms, and by home delivery in rural areas and smaller settlements. (Cramer’s V: 0.120).
  • There was a strong correlation between the importance of own production and the place of residence of the respondents (Cramer’s V: 0.170). The importance of own production was highest in small villages (an average of 3.97 on the five-point Likert scale) and gradually decreased as the size of the settlement increased; in the case of large cities and metropolis, it decreased to an average of 2.45.
These weak but statistically significant results suggest that for people living in villages, shopping in smaller-scale commercial channels were more determinant. The importance of purchases in marketplaces did not show a statistically significant difference in terms of territory. Whereas, small producers’ sales and direct sales are also considered to be a decentralized small-scale trade, we conclude that buyers in rural areas are more likely to participate in sales channels where it is easier for small producers to assert their interests than, for example, as a supplier of supermarkets. (Examples for such sales channels, in our cases: Sales from the house, home delivery, convenience stores, and with minimal differences, in marketplaces). The importance of consumers’ own production was more significant in villages and especially in settlements with less than 5000 people. This may indicate that local products are easier to obtain in these villages, and there is a larger number of active primary producers.
In the case of vegetables and fruits (χ2 = 69.787, df = 28 Cramer’s V = 0.132), as well as meat and meat products (χ2 = 55.709, df = 28 Cramer’s V = 0.118), it is a statistically significant correlation, that consumers in villages have obtained a greater proportion of these needs from producers. In the case of honey, the demand for producer goods was higher in villages and small towns than in large cities (χ2 = 44.504, df = 28 Cramer’s V = 0.105)
We examined whether aspects of consumer product choice is influenced by the place of residence. We found that the influence of family traditions on product choice was stronger in villages and small towns (with a relatively weak but statistically significant relationship: Cramer’s V: 0.110, χ2 = 49.366, df = 28). Demand for organic products was not a decisive factor at the sample level. However, it was slightly more important for respondents from villages (χ2 = 40.797, df = 28), which is relevant at a significance level of 6%. The value of Cramer’s V is 0.100).
In our research, we also examined that in which marketing channels can the customers get information about the goods of small producers. A moderately strong (Cramer’s V: 0.146; χ2 = 43.296, df = 14) statistically significant correlation is that in villages, as well as in small towns, the personal relationship with the producer influences the customer’s decision to a greater extent. (In contrast, nearly half of the respondents in large cities and metropolis stated that it is not typical to contact the producer and collect information from them.) From this, we conclude that the producer-consumer relationship is more living in villages and smaller towns than in metropolises and cities.

4. Discussion and Conclusions

In our article, we drew conclusions about the role of local food products, and (thus) short food supply chains in rural development, on the basis of our consumer survey of 1034 responders from mainly the North Hungarian region. According to the literature, there is a growing interest in short supply chains and local markets in both rural and urban areas [2]. Researchers are examining their role in rural development [3]. However, in our experience, it is very difficult to quantify whether short food chains can really be “breakout points” for underdeveloped rural areas. 86% of our sample originates from the North Hungarian region. It is a “less developed” region at the NUTS2 level. In our survey, we examined the extent of consumers’ preferences on local food products, short food supply chains, and purchasing from local producers. In our sample, younger and higher educated respondents were overrepresented. These results are in line with literature sources that age [42,44,45,46], level of education [25,46,47,48,49,50], as well as higher income [18,42,47,48] have a positive relationship with preferences for local food. (In contrast, gender and marital status did not result in statistically significant correlations.) Although the success of marketing activities is difficult to judge, we agree with Bakos’s [44] conclusions that informing and promoting campaigns and programs (among others) for young people can have an important role.
Product promotion should have a key role in these marketing activities, as there was a statistically significant correlation between perceived positive quality characteristics of local products and expenditures on and willingness to pay for local products [76]. Based on the literature (e.g., References [23,41]), the “superiority” of small producer goods in terms of product quality cannot be generalized. However, it is a fact that if consumers consider local products to be of good quality and unique, then their willingness to pay may be increased with a good chance.
Consumers in the sample had an average +20.7% (theoretical) willingness to pay for a local product compared to a product of the same type and quality made under factory conditions. This premium is relatively high compared to the values of the examined literature sources (see Table 1). Although we did not find similar references in the literature, it was contrary to this premium that one-third of consumers bought at most only 16 EUR worth from local producers in an average month (including zero values). Furthermore, another third bought from these small producers for an average value of over 31 EUR. In our opinion, this contradiction is resolved by the noticing of Feldmann and Hamm [18] that, in addition to the willingness to pay, the purchased quantities should also be taken into consideration in the examination of preferences for local products.
The experiences of our spatial survey results show that rural responders—living in villages or smaller settlements—had a certain higher demand for local products than respondents from larger cities (see Table 5). We identified additional factors that suggest a higher preference of the rural residents for local products. Although these results are statistically significant, they usually cover weak or not very strong correlations:
  • Hypermarkets, supermarkets, discount stores (to a certain extent) were preferred more by people living in larger cities.
  • Small shops (as deconcentrated sales channels), as well as purchasing at the producers’ place or home delivery by producers, were more popular in the villages.
  • Own growing or production as a food source was most popular in small villages, and its importance gradually decreased with the increase in the size of the settlements, which also covered a statistically stronger correlation.
  • Consumers living in villages purchased more vegetables, fruits, meat and meat products from local producers than those living in cities.
  • The demand for local producers’ honey was higher in villages and small towns than in large cities.
  • The influence of family traditions on product choice decisions was also more characteristic in villages and small towns than in medium-sized towns.
  • According to the sample, respondents from villages had a higher demand for organic products.
  • In villages and small towns, consumers received more information from small producers (about their wares). This indicates a stronger nature of producer-consumer relations.
From this information, it can be concluded that residents of smaller settlements (“countryside” villages) had a slightly higher preference for local products. There were also elements in their consumer attitudes that supported purchasing from local producers. (For example, the greater importance of own growing or production, the importance of traditions, moderate need or demand for organic products, getting information directly from the producer.)
These results reinforce the potential of short food supply chains in rural development. However, it is difficult to assess the necessary demand or economic sustainability of a given rural area regarding short food chains. From our research, it was not possible to assess the absolute demand of a rural area for local products. The results show a higher preference by rural residents; whereas, for the sustainable economic operation of a short food supply chain, territorial demand conditions need to be taken into consideration. In our sample, urban residents preferred local products less to some extent. However, a larger population, and potentially higher income levels and population densities presumably result in higher absolute territorial demand than, a small-village area. Based on the findings of Schupp [37], and the experiences of a previous study [38] (whose area overlaps the current sample area), SFSC channels (such as well-functioning producers’ markets) are rare in a rural or less developed area. According to Low and Vogel [27], local food trade has mostly provided opportunities in urban areas for economic development.
The limitation of this survey is mentioned in our study. Our sample is not representative, and the respondents’ conception of local products may differ according to the individual.

Author Contributions

Conceptualization, K.K. and G.K.; methodology, K.K. and G.K.; software, K.K. and G.K.; validation, K.K., G.K., S.A. and C.R.; formal analysis, K.K. and G.K.; investigation, K.K., G.K. and A.S.; resources, C.R.; data curation, K.K.; writing—original draft preparation, K.K., G.K., A.S. and C.R.; writing—review and editing, K.K., G.K., A.S. and C.R.; visualization, K.K., G.K., C.R.; supervision, K.K.; project administration, C.R.; funding acquisition, C.R. All authors have read and agreed to the published version of the manuscript.

Funding

This research was funded by the project entitled: “EFOP-3.6.2-16-2017-00001 Complex rural economic development and sustainability research, development of the service network in the Carpathian Basin” (In original, Hungarian language: “EFOP-3.6.2-16-2017-00001 Komplex vidékgazdasági és fenntarthatósági fejlesztések kutatása, szolgáltatási hálózatának kidolgozása a Kárpát-medencében”).

Acknowledgments

We are grateful to Balázs Magyar, a GIS colleague, for preparing the thematic maps. We are grateful to Bálint Varró and colleagues working at the INNOREGIO Knowledge Center of the Eszterházy Károly University for distributing our questionnaire. We would also like to thank everyone who contributed to the study by completing or distributing the questionnaire. We are also grateful to Lindsey Cuen for her advice in translation.

Conflicts of Interest

The authors declare no conflict of interest.

Appendix A. Gross Domestic Product (GDP) Per Inhabitant, by NUTS 2 Regions (2016)

Figure A1. Gross domestic product (GDP) per inhabitant, by NUTS 2 regions, (2016). Source: Eurostat [77] and own editing.
Sustainability 12 05473 g0a1

Appendix B. Addendum to Table 2

Table A1. Statistical parameters for relations between monthly expenditures and consumer demographics (level of significance 5%).
Consumer CharacteristicsValue of Chi-Square Test (χ2) Decrees of Freedom (df)Cramer’s V Coefficient
Gender6.0940.08
Age categories37.31120.11
Highest level of education36.83120.11
Marital status14.44120.07
Income level35.4580.13
Place of residence45.63280.11
Source: Own work.

Appendix C. Addendum to Table 3

Table A2. Statistical parameters for relations between the factors determining the product choices and the monthly expenditures on goods of small producers.
Determinants of Product ChoosingValue of Chi-Square Test (χ2) Decrees of Freedom (df)Cramer’s V Coefficient
- price44.25120.120
- brand, manufacturer (generally)27.96160.083
- Hungarian (domestic) origin80.38160.141
- actual (price) discounts36.32160.095
- quality42.8780.145
- need for organic products97.46160.155
- uniqueness51.47160.113
- advertisements10.53 12 -
- personal relationship, emotional attachment27.66160.083
- environmental awareness66.67160.128
- family traditions47,05160,108
Source: Own work.

Appendix D. Addendum to Table 6

Table A3. Statistical parameters for relations between the place of purchase and the place of residence of the respondents.
Sales ChannelsValue of Chi-Square Test (χ2) Decrees of Freedom (df)Cramer’s V Coefficient
- hypermarkets53.680320.116
- supermarkets66.505320.128
- convenience stores, small shops67.393320.130
- (conventional) marketplaces19.462320.070
- producers’ markets (marketplaces)31.460320.089
- specialized grocery stores (e.g., bakeries)52.575320.115
- purchasing at the producers’ place or home delivery by producers57.915320.120
- fairs, festivals38.014320.097
- online shopping32.133320.090
- own growing or production115.070320.170
Source: Own work.

References

  1. Bazzani, C.; Caputo, V.; Nayga, R.M.; Canavari, M. Revisiting consumers’ valuation for local versus organic food using a non-hypothetical choice experiment: Does personality matter? Food Qual. Prefer. 2017, 62, 144–154. [Google Scholar] [CrossRef]
  2. Augère-Granier, M.-L. Short Food Supply Chains and Local Food Systems in the EU—Think Tank. Available online: http://www.europarl.europa.eu/thinktank/en/document.html?reference=EPRS_BRI(2016)586650 (accessed on 19 July 2019).
  3. Renting, H.; Marsden, T.K.; Banks, J. Understanding Alternative Food Networks: Exploring the Role of Short Food Supply Chains in Rural Development. Environ. Plan. A 2003, 35, 393–411. [Google Scholar] [CrossRef] [Green Version]
  4. Regulation (EU) No 807/2014: Commission Delegated Regulation (EU) No 807/2014 of 11 March 2014 supplementing Regulation (EU) No 1305/2013 of the European Parliament and of the Council on support for rural development by the European Agricultural Fund for Rural Development (EAFRD) and introducing transitional provision. Available online: https://eur-lex.europa.eu/legal-content/EN/TXT/PDF/?uri=CELEX:32014R0807&from=EN (accessed on 7 July 2020).
  5. Kneafsey, M.; Venn, L.; Schmutz, U.; Balázs, B.; Trenchard, L.; Eyden-Wood, T.; Bos, E.; Foster, G.; Blackett, M. Short Food Supply Chains and Local Food Systems in the EU. A State of Play of their Socio-Economic Characteristics; Publications Office of the European Union: Luxembourg, 2013; ISBN 978-9-27-929288-0. [Google Scholar]
  6. 52/2010 (IV.30.) MARD (The Hungarian Ministry of Agriculture and Regional Development) regulation on the conditions of the production, manufacture and sale of food by small producers (Unoffitial translation. In original Hungarian language: FVM rendelet a kistermelői élelmiszer-termelés, -előállítás és -értékesítés feltételeiről). Available online: https://net.jogtar.hu/jogszabaly?docid=a1000052.fvm (accessed on 29 May 2020).
  7. Government of Canada, Canadian Food Inspection Agency. Local Food Claims Interim Policy. Available online: https://www.inspection.gc.ca/food-label-requirements/labelling/industry/origin-claims-on-food-labels/local-food-claims/eng/1368135927256/1368136146333 (accessed on 22 May 2020).
  8. Martinez, S.; Hand, M.; Da Pra, M.; Pollack, S.; Ralston, K.; Smith, T.; Vogel, S.; Clarke, S.; Lohr, L.; Low, S.; et al. Local Food Systems: Concepts, Impacts, and Issues; United States Department of Agriculutre (USDA)—Economic Research Service: Washington, DC, USA, 2010; p. 80.
  9. Malak-Rawlikowska, A.; Majewski, E.; Wąs, A.; Borgen, S.O.; Csillag, P.; Donati, M.; Freeman, R.; Hoàng, V.; Lecoeur, J.-L.; Mancini, M.C.; et al. Measuring the Economic, Environmental, and Social Sustainability of Short Food Supply Chains. Sustainability 2019, 11, 4004. [Google Scholar] [CrossRef] [Green Version]
  10. Chiffoleau, Y.; Millet-Amrani, S.; Canard, A. From Short Food Supply Chains to Sustainable Agriculture in Urban Food Systems: Food Democracy as a Vector of Transition. Agriculture 2016, 6, 57. [Google Scholar] [CrossRef] [Green Version]
  11. Marsden, T.; Banks, J.; Bristow, G. Food Supply Chain Approaches: Exploring their Role in Rural Development. Sociol. Rural. 2000, 40, 424–438. [Google Scholar] [CrossRef]
  12. Coelho, F.C.; Coelho, E.M.; Egerer, M. Local food: Benefits and failings due to modern agriculture. Sci. Agric. 2018, 75, 84–94. [Google Scholar] [CrossRef] [Green Version]
  13. Deller, S.C.; Lamie, D.; Stickel, M. Local foods systems and community economic development. Community Dev. 2017, 48, 612–638. [Google Scholar] [CrossRef]
  14. Bowen, S.; Mutersbaugh, T. Local or localized? Exploring the contributions of Franco-Mediterranean agrifood theory to alternative food research. Agric. Hum. Values 2014, 31, 201–213. [Google Scholar] [CrossRef]
  15. Garnett, T. Food sustainability: Problems, perspectives and solutions. Proc Nutr Soc 2013, 72, 29–39. [Google Scholar] [CrossRef] [Green Version]
  16. Berti, G. Sustainable Agri-Food Economies: Re-Territorialising Farming Practices, Markets, Supply Chains, and Policies. Agriculture 2020, 10, 64. [Google Scholar] [CrossRef] [Green Version]
  17. Sonnino, R. The power of place: Embeddedness and local food systems in Italy and the UK. Anthropol. Food 2007. [Google Scholar] [CrossRef]
  18. Feldmann, C.; Hamm, U. Consumers’ perceptions and preferences for local food: A review. Food Qual. Prefer. 2015, 40, 152–164. [Google Scholar] [CrossRef]
  19. Blake, M.K.; Mellor, J.; Crane, L. Buying Local Food: Shopping Practices, Place, and Consumption Networks in Defining Food as “Local”. Ann. Assoc. Am. Geogr. 2010, 100, 409–426. [Google Scholar] [CrossRef]
  20. Alfnes, F.; Sharma, A. Locally produced food in restaurants: Are the customers willing to pay a premium and why? Int. J. Revenue Manag. 2010, 4, 238. [Google Scholar] [CrossRef]
  21. Martinez, S.W. Policies Supporting Local Food in the United States. Agriculture 2016, 6, 43. [Google Scholar] [CrossRef] [Green Version]
  22. Popp, J.; Oláh, J.; Kiss, A.; Temesi, Á.; Fogarassy, C.; Lakner, Z. The socio-economic force field of the creation of short food supply chains in Europe. J. Food Nutr. Res. 2019, 58, 31–41. [Google Scholar]
  23. Kiss, K.; Ruszkai, C.; Takács-György, K. Examination of Short Supply Chains Based on Circular Economy and Sustainability Aspects. Resources 2019, 8, 161. [Google Scholar] [CrossRef] [Green Version]
  24. Benedek, Z.; Balázs, B. Current status and future prospect of local food production in Hungary: A spatial analysis. Eur. Plan. Stud. 2016, 24, 607–624. [Google Scholar] [CrossRef] [Green Version]
  25. Mundler, P.; Laughrea, S. The contributions of short food supply chains to territorial development: A study of three Quebec territories. J. Rural Stud. 2016, 45, 218–229. [Google Scholar] [CrossRef]
  26. Schneider, M.L.; Francis, C.A. Marketing locally produced foods: Consumer and farmer opinions in Washington County, Nebraska. Renew. Agric. Food Syst. 2005, 20, 252–260. [Google Scholar] [CrossRef] [Green Version]
  27. Low, S.A.; Vogel, S.J. Direct and Intermediated Marketing of Local Foods in the United States; U.S. Department of Agriculture, Economic Research Service: Rochester, NY, USA, 2011; p. 32.
  28. Aggestam, V.; Fleiß, E.; Posch, A. Scaling-up short food supply chains? A survey study on the drivers behind the intention of food producers. J. Rural Stud. 2017, 51, 64–72. [Google Scholar] [CrossRef]
  29. European Comission. Statistical Factsheet—Sweden. 2019. Available online: https://ec.europa.eu/info/sites/info/files/food-farming-fisheries/farming/documents/agri-statistical-factsheet-se_en.pdf (accessed on 31 May 2020).
  30. Benedek, Z.; Fertő, I.; Szente, V. The Multiplier Effects of Food Relocalization: A Systematic Review. Sustainability 2020, 12, 3524. [Google Scholar] [CrossRef]
  31. Migliore, G.; Schifani, G.; Romeo, P.; Hashem, S.; Cembalo, L. Are Farmers in Alternative Food Networks Social Entrepreneurs? Evidence from a Behavioral Approach. J Agric Env. Ethics 2015, 28, 885–902. [Google Scholar] [CrossRef]
  32. Dunay, A.; Lehota, J.; Mácsai, É.; Illés, C.B. Short Supply Chain: Goals, Objectives and Attitudes of Producers. Acta Polytech. Hung. 2018, 15, 199–217. [Google Scholar]
  33. Garner, B. Communicating social support during crises at the farmers’ market: A social exchange approach to understanding customer-farmer communal relationships. Int. J. Consum. Stud. 2017, 41, 422–430. [Google Scholar] [CrossRef]
  34. Giampietri, E.; Verneau, F.; Del Giudice, T.; Carfora, V.; Finco, A. A Theory of Planned behaviour perspective for investigating the role of trust in consumer purchasing decision related to short food supply chains. Food Qual. Prefer. 2018, 64, 160–166. [Google Scholar] [CrossRef]
  35. Argent, N. Heading down to the local? Australian rural development and the evolving spatiality of the craft beer sector. J. Rural Stud. 2018, 61, 84–99. [Google Scholar] [CrossRef]
  36. Blasi, E.; Cicatiello, C.; Pancino, B.; Franco, S. Alternative food chains as a way to embed mountain agriculture in the urban market: The case of Trentino. Agric. Econ. 2015, 3, 3. [Google Scholar] [CrossRef] [Green Version]
  37. Schupp, J.L. Just where does local food live? Assessing farmers’ markets in the United States. Agric. Hum. Values 2016, 33, 827–841. [Google Scholar] [CrossRef]
  38. Kiss, K. The satisfaction of producers, selling in various marketplaces-results of a primary survey from Hungary. Ann. Pol. Assoc. Agric. Agribus. Econ. (Ann. PAAAE) 2019, XXI, 183–190. [Google Scholar] [CrossRef]
  39. Adalja, A.; Hanson, J.; Towe, C.; Tselepidakis, E. An Examination of Consumer Willingness to Pay for Local Products. Agric. Resour. Econ. Rev. 2015, 44, 253–274. [Google Scholar] [CrossRef] [Green Version]
  40. Rihn, A.L.; Yue, C. Visual Attention’s Influence on Consumers’ Willingness-to-Pay for Processed Food Products. Agribusiness 2016, 32, 314–328. [Google Scholar] [CrossRef]
  41. Demartini, E.; Gaviglio, A.; Pirani, A. Farmers’ motivation and perceived effects of participating in short food supply chains: Evidence from a North Italian survey. Agric. Econ. (Czech Repub.) 2017, 63, 204–216. [Google Scholar] [CrossRef] [Green Version]
  42. Berg, N.; Preston, K.L. Willingness to pay for local food?: Consumer preferences and shopping behavior at Otago Farmers Market. Transp. Res. Part A Policy Pract. 2017, 103, 343–361. [Google Scholar] [CrossRef]
  43. Campbell, J.; DiPietro, R.B.; Remar, D. Local foods in a university setting: Price consciousness, product involvement, price/quality inference and consumer’s willingness-to-pay. Int. J. Hosp. Manag. 2014, 42, 39–49. [Google Scholar] [CrossRef]
  44. Bakos, I.M. Local food systems supported by communities nationally and internationally. Deturope 2017, 9, 59–79. [Google Scholar]
  45. Carpio, C.E.; Isengildina-Massa, O. Consumer willingness to pay for locally grown products: The case of South Carolina. Agribusiness 2009, 25, 412–426. [Google Scholar] [CrossRef] [Green Version]
  46. Hempel, C.; Hamm, U. How important is local food to organic-minded consumers? Appetite 2016, 96, 309–318. [Google Scholar] [CrossRef]
  47. Brown, C. Consumers’ preferences for locally produced food: A study in southeast Missouri. Am. J. Altern. Agric. 2003, 18, 213–224. [Google Scholar] [CrossRef]
  48. Betz, M.E.; Farmer, J.R. Farmers’ market governance and its role on consumer motives and outcomes. Local Environ. 2016, 21, 1420–1434. [Google Scholar] [CrossRef]
  49. Szabó, D. Determining the target groups of Hungarian short food supply chains based on consumer attitude and socio-demographic factors. Stud. Agric. Econ. 2017, 119, 115–122. [Google Scholar] [CrossRef] [Green Version]
  50. Balázs, B.; Pataki, G.; Lazányi, O. Prospects for the future: Community supported agriculture in Hungary. Futures 2016, 83, 100–111. [Google Scholar] [CrossRef]
  51. Weatherell, C.; Tregear, A.; Allinson, J. In search of the concerned consumer: UK public perceptions of food, farming and buying local. J. Rural Stud. 2003, 19, 233–244. [Google Scholar] [CrossRef]
  52. Chambers, S.; Lobb, A.; Butler, L.; Harvey, K.; Bruce Traill, W. Local, national and imported foods: A qualitative study. Appetite 2007, 49, 208–213. [Google Scholar] [CrossRef] [PubMed]
  53. Kumpulainen, T.; Vainio, A.; Sandell, M.; Hopia, A. The effect of gender, age and product type on the origin induced food product experience among young consumers in Finland. Appetite 2018, 123, 101–107. [Google Scholar] [CrossRef] [PubMed]
  54. Galt, R.E.; Bradley, K.; Christensen, L.O.; Munden-Dixon, K. The (un)making of “CSA people”: Member retention and the customization paradox in Community Supported Agriculture (CSA) in California. J. Rural Stud. 2019, 65, 172–185. [Google Scholar] [CrossRef] [Green Version]
  55. Gaviglio, A.; Bertocchi, M.; Marescotti, M.E.; Demartini, E.; Pirani, A. The social pillar of sustainability: A quantitative approach at the farm level. Agric. Food Econ. 2016, 4, 15. [Google Scholar] [CrossRef] [Green Version]
  56. Grando, S.; Carey, J.M.; Hegger, E.; Jahrl, I.; Ortolani, L. Short Food Supply Chains in Urban Areas: Who Takes the Lead? Evidence from Three Cities across Europe. Urban Agric. Reg. Food Syst. 2017, 2, 1–11. [Google Scholar] [CrossRef] [Green Version]
  57. Schmidt, J.; Bijmolt, T.H.A. Accurately measuring willingness to pay for consumer goods: A meta-analysis of the hypothetical bias. J. Acad. Mark. Sci. 2020, 48, 499–518. [Google Scholar] [CrossRef] [Green Version]
  58. Breidert, C.; Hahsler, M.; Reutterer, T. A Review of Methods for Measuring Willingness-to-Pay. Innov. Mark. 2006, 2, 8–32. [Google Scholar]
  59. Aizuddin, A.N.; Sulong, S.; Aljunid, S.M. Methods and tools for measuring willingness to pay for healthcare: What is suitable for developing countries? BMC Public Health 2014, 14, O20. [Google Scholar] [CrossRef] [Green Version]
  60. Gracia, A. Consumers’ preferences for a local food product: A real choice experiment. Empir. Econ. 2014, 47, 111–128. [Google Scholar] [CrossRef]
  61. Onozaka, Y.; Mcfadden, D.T. Does Local Labeling Complement or Compete with Other Sustainable Labels? A Conjoint Analysis of Direct and Joint Values for Fresh Produce Claim. Am. J. Agric. Econ. 2011, 93, 693–706. [Google Scholar] [CrossRef]
  62. Willis, D.B.; Carpio, C.E.; Boys, K.A. Supporting local food system development through food price premium donations: A policy propsal. J. Agric. Appl. Econ. 2016, 48, 192–217. [Google Scholar] [CrossRef] [Green Version]
  63. Dogi, I.; Nagy, L.; Csipkés, M.; Balogh, P. Kézműves élelmiszerek vásárlásának fogyasztói magatartásvizsgálata a nők körében (Attitudes of Female Consumers to Purchasing Artisan Foods). Gazdálkodás Sci. J. Agric. Econ. 2014, 58, 1–13. [Google Scholar]
  64. Eastwood, D.B.; Brooker, J.R.; Orr, R.H. Consumer Preferences for Local Versus Out-Of-State Grown Selected Fresh Produce: The Case of Knoxville, Tennessee. J. Agric. Appl. Econ. 1987, 19, 183–194. [Google Scholar] [CrossRef] [Green Version]
  65. Cecchini, L.; Torquati, B.; Chiorri, M. Sustainable agri-food products: A review of consumer preference studies through experimental economics. Agric. Econ. 2018, 64, 554–565. [Google Scholar] [CrossRef]
  66. Lehota, Z.; Lencsés, E. Consumer willingness and price premium characteristics in the Hungarian food supply chain. In Proceedings of the 9th International Conference on Management: “People, Planet and Profit: Sustainable Business and Society, Gödöllő, Hungary, 13–14 June 2019; Dunay, A., Ed.; Szent István University Publishing House: Gödöllő, Hungary, 2019; Volume 2, pp. 199–203. [Google Scholar]
  67. Correlation Coefficient: Simple Definition, Formula, Easy Calculation Steps. Available online: https://www.statisticshowto.com/probability-and-statistics/correlation-coefficient-formula/ (accessed on 29 May 2020).
  68. Cramér’s V—Description. Available online: https://www.ibm.com/support/knowledgecenter/SSEP7J_11.1.0/com.ibm.swg.ba.cognos.ug_ca_dshb.doc/cramersv.html (accessed on 6 June 2020).
  69. Evans, J.R.; Mathur, A. The value of online surveys. Internet Res. 2005, 15, 195–219. [Google Scholar] [CrossRef]
  70. HCSO Hungarian Central Statistical Office: Interactive Charts and maps-Regional Breakdown: The NUTS Classification. Available online: https://www.ksh.hu/interactive_eumaps_nuts2 (accessed on 29 May 2020).
  71. European Commisson—Eurostat (Background). Available online: https://ec.europa.eu/eurostat/web/regions/background (accessed on 29 May 2020).
  72. European Comission—Regional Innovation Monitor Plus North Hungary. Available online: https://ec.europa.eu/growth/tools-databases/regional-innovation-monitor/base-profile/north-hungary-2 (accessed on 29 May 2020).
  73. United Nations: The Wye Group Handbook. Rural Households’ Livelihood and Well-Being. Statistics on Rural Development and. Agriculture Household Income; United Nations: New York, NY, USA; Genava, Switzerland, 2007; ISBN 978-9-21-116967-6.
  74. HCSO Hungarian Central Statistical Office: Annual statistical data—Settlements in Hungary. Available online: http://statinfo.ksh.hu/Statinfo/haDetails.jsp?query=kshquery&lang=en (accessed on 29 May 2020).
  75. HCSO Hungarian Central Statistical Office: TIMEA—Térképes Interaktív Megjelenítő Szolgáltatás (Map Interactive Display Service-Unofficial Translation). Available online: https://map.ksh.hu/timea/?locale=en (accessed on 29 May 2020).
  76. Kiss, K.; Koncz, G.; Nagy-Demeter, D.; Varró, B.; Németh, M.; Ruszkai, C. Survey of Consumers Responsiveness to Small-Scale Producers Marketing in the Northern Hungary Region. TMP 2019, 15, 25–34. [Google Scholar] [CrossRef]
  77. Eurostat—Statistics Explained File:Gross Domestic Product (GDP) per Inhabitant, by NUTS 2 Regions, 2016 (Based on Data in Purchasing Power Standards (PPS) in Relation to the EU-28 Average, EU-28 = 100)-RYB18.png—Statistics Explained. Available online: https://ec.europa.eu/eurostat/statistics-explained/index.php?title=File:Gross_domestic_product_(GDP)_per_inhabitant,_by_NUTS_2_regions,_2016_(based_on_data_in_purchasing_power_standards_(PPS)_in_relation_to_the_EU-28_average,_EU-28_%3D_100)-RYB18.png (accessed on 29 May 2020).
Figure 1. The place of residence of the respondents (mainly from the North Hungarian region) Source: Own survey and editing.
Sustainability 12 05473 g001
Figure 2. Monthly spending on local producers’ goods. Source: Own survey.
Sustainability 12 05473 g002
Figure 3. Representation of monthly expenditure on local producers’ goods by place of residence. Source: Own survey (2020).
Sustainability 12 05473 g003
Figure 4. Relationships between respondents’ place of residence and their monthly expenditures on local producers’ goods. Source: Own survey (2020).
Sustainability 12 05473 g004
Table 1. Some international examples of consumers’ willingness to pay for local products in different approaches.
The Base of Comparison * Willingness to Pay
(Average Premium)
Source
- consumers’ preference for local lamb meats (location of the survey: Spain)9%, and 13% depending on the products[60]
- consumers’ “positive preference for locally-grown products in comparison to domestically-grown products” (location of the survey: U.S.)+9–15%Onozaka and Mcfadden [61],—cited by Campbell et al. [43] p. 44.
- willingness to pay for a locally-grown product compared to non-local agricultural products (location of the survey: South Carolina)+11%[62]
- preference for handicraft products compared to conventional, non-local foods (location of the survey: Hungary)10–25%, for 2/3 part of the responders[63]
- respondents’ willingness to pay for local products compared to products from the other Member States (location of the survey: South Carolina)23% and 27% depending on the products [45]
Source: Own editing. * (It should be noted that definitions of “local products” or “handicraft products” used as a reference may differ from source to source).
Table 2. Relationships between the purchase of local producers’ goods and different consumer characteristics.
Consumer Characteristics
(and Corresponding Response Categories)
Average Monthly Expenditure on Local Producers’ GoodsSignificant Relationship *
Appendix B
0–16 EUR
(n = 346)
16.01–31 EUR
(n = 331)
31.01—47 EUR
(n = 178)
47.01—63 EUR
(n = 97)
63 EUR <
(n = 68)
Gender ratioWomen72.5%70.0%62.9%64.6%67.6%No
Men27.5%30.0%37.1%35.4%32.4%
Age distributionunder 20 years0.6%0.9%2.8%1.0%0.0%Yes; medium/weak relationship
20–35 years55.2%46.2%43.3%36.1%38.2%
36–50 years24.0%32.9%37.6%43.3%45.6%
51–65 years14.2%16.9%12.4%19.6%14.7%
above 65 years6.1%3.0%3.9%0.0%1.5%
Highest level of education (distribution)elementary school0.3%0.9%0.6%0.0%1.5%Yes; medium/weak relationship
skilled worker certificate5.2%4.5%2.2%2.1%11.9%
graduation/technical school33.8%27.3%24.7%18.6%16.4%
higher vocational training18.2%13.3%15.7%19.6%22.4%
college or university degree42.5%53.9%56.7%59.8%47.8%
Marital status
(distribution)
unmarried31.5%25.4%28.1%20.8%19.1%No
common law-partner 24.3%22.9%24.7%20.8%23.5%
married35.3%43.4%38.8%52.1%48.5%
divorced7.5%7.0%7.3%4.2%8.8%
widow/widower1.4%1.2%1.1%2.1%0.0%
Income level
(distribution)
significantly below average1%0%1%0%1%Yes, medium relationship
below average12%5%7%8%4%
average73%77%65%63%66%
above average13%17%25%28%21%
significantly above average1%1%3%1%7%
Willingness to pay (how much premium the responders are willing to pay for local producers’ goods)—averages of answers+15.7%+20.7%+24%+25.3%+31.1%Yes
Place of residence
(distribution by settlement size)
small village3%3%3%3%5%Yes; medium/weak relationship
medium-sized village11%17%14%18%26%
large village19%21%19%23%15%
village town7%4%5%7%8%
small town9%13%14%3%12%
small-medium sized town16%17%18%13%14%
medium-sized town23%20%22%27%11%
large city7%3%4%5%5%
metropolis5%2%2%1%6%
Source: Own survey. * Presence of statistically significant relationship between the average monthly spending on local producers’ goods and the given examined consumer characteristic.
Table 3. Examining the aspects influencing consumers’ product choice—evaluation of responses given by consumer groups.
Determinants of Product ChoosingConsumer Groups on the Basis of Average Monthly Expenditure on Local Producers’ Goods
0–16 EUR
(n = 336)
16.01–31 EUR
(n = 318)
31.01–47 EUR
(n = 173)
47.01–63 EUR
(n = 95)
63 EUR<
(n = 66)
(Averages of Responses on a Five-Rank Likert-Scale)
- price4.183.963.913.873.58
- brand, manufacturer (generally)3.413.543.533.743.74
- Hungarian (domestic) origin3.383.843.944.064.15
- actual (price) discounts3.993.823.743.713.52
- quality4.444.634.694.734.79
- need for organic products2.503.033.063.273.48
- uniqueness2.763.133.203.423.32
- advertisements1.901.991.881.971.74
- personal relationship, emotional attachment2.943.073.353.393.20
- environmental awareness3.403.773.983.943.95
- family traditions2.963.233.543.393.50
Source: Own survey.
Table 4. Importance of different sales channels in the case of food shopping, accessed on a five-rank Likert scale.
Sales ChannelsAverage Ratings
- supermarkets and discount stores3.67
- (conventional) marketplaces3.17
- hypermarkets2.98
- own growing or production2.90
- convenience stores, small shops2.88
- producers’ markets (marketplaces)2.85
- specialized grocery stores (e.g., bakeries)2.63
- online shopping2.28
- fairs, festivals2.13
- purchasing at the producers’ place or home delivery by producers2.12
Source: Own survey.
Table 5. Relationships between respondents’ place of residence and preference for local producer goods.
Settlement CategoriesPopulation Number of the Settlement Category (People)Number of Respondents
(n = 1001) *
Monthly Expenditure on Local Products
(Averages of Answer-Categories)* (n = 1001) **
Responders’ willingness to Pay—Average Theoretical Price Premium for Local Goods (%)
(n = 959) **
- small village100–499322.2821.12%
- medium-sized village500–19991512.4821.49%
- large village2000–49991992.2223.46%
- village town5000–9999562.2517.95%
- small town10,000–19,9991052.2420.56%
- small-medium sized town20,000–49,9991592.1818.78%
- medium-sized town50,000–99,9992152.1518.08%
- large city100,000–999,999502.0225.64%
- metropolis1,000,000-342.2219.12%
* (Averages of responses on the five-point scale presented earlier: 1: 0–16 EUR; 2: 16.1–31 EUR (Average values about “2” are closest to a monthly spend of 16,1–31 EUR.); 3: 31.1–47 EUR; 4: 47.1–63 EUR; 5: more than 63 EUR); ** After exclusion of missing values. On the level of the sample (n=1034) mean of the theoretical willingness to pay is 20.7%. Source: Own survey.
Table 6. Relations between the place of purchase and the place of residence of the respondents.
Sales ChannelsSmall VillageMedium-Sized VillageLarge VillageVillage TownSmall TownSmall-Medium Sized TownMedium-Sized TownLarge CityMetropolisPresence and Strength of Statistically Significant Relationship (Appendix D)
- hypermarkets2.913.112.933.002.682.843.023.583.15Yes, moderate/weak
- supermarkets3.453.503.443.613.823.813.813.583.15Yes, moderate
- convenience stores, small shops3.093.193.112.762.862.542.792.552.94Yes, moderate
- (conventional) marketplaces3.213.203.243.183.153.153.142.863.36No
- producers’ markets (marketplaces)3.152.982.992.842.852.672.842.372.85No
- specialized grocery stores (e.g., bakeries)2.612.662.802.562.802.532.632.282.18Yes, moderate/weak
- purchasing at the producers’ place or home delivery by producers2.272.292.352.382.161.92.001.761.61Yes, moderate/weak
- fairs, festivals2.482.112.202.162.062.052.202.021.91No
- online shopping2.182.972.522.492.082.132.162.162.24No
- own growing or production3.973.323.263.002.932.462.572.492.39Yes, strong
Source: Own work, Appendix D.

