Effects of COVID-19 on Indian Energy Consumption


1
Graduate School of Humanities and Social Sciences, Saitama University, 255 Shimo-Okubo, Sakura-ku, Saitama 338-8570, Japan
2
Department of Agricultural Economics, Bangladesh Agricultural University, Mymensingh 2202, Bangladesh
3
Graduate School of Life and Environmental Sciences, University of Tsukuba, Tsukuba 305-8572, Japan
4
Institute of Agribusiness and Development Studies, Bangladesh Agricultural University, Mymensingh 2202, Bangladesh
*
Author to whom correspondence should be addressed.
Sustainability 2020, 12(14), 5616; https://0-doi-org.brum.beds.ac.uk/10.3390/su12145616
Submission received: 25 June 2020
/
Revised: 2 July 2020
/
Accepted: 10 July 2020
/
Published: 13 July 2020
(This article belongs to the Special Issue Energy Economics and Sustainability)
Abstract
:Just after the Indian government issued the first lockdown rule to cope with the increasing number of COVID-19 cases in March 2020, the energy consumption in India plummeted dramatically. However, as the lockdown relaxed, energy consumption started to recover. In this study, we investigated how COVID-19 cases affected Indian energy consumption during the COVID-19 crisis by testing if the lockdown release had a positive impact on energy consumption and if richer regions were quicker to recover their energy consumption to the level before the lockdown. Using the autoregressive distributed lag (ARDL) model, the study reveals that a long-run relationship holds between the COVID-19 cases and energy consumption and that the COVID-19 cases have a positive effect on Indian energy consumption. This result indicates that as lockdown relaxed, energy consumption started to recover. However, such a positive impact was not apparent in the Eastern and North-Eastern regions, which are the poorest regions among the five regions investigated in the study. This implies that poorer regions need special aid and policy to recover their economy from the damage suffered from the COVID-19 crisis.
1. Introduction
The COVID-19 pandemic has forced governments around the world to impose tough restrictions on daily life to prevent the spread of the virus. With these restrictions, roads and airports are nearly empty, shops and restaurants are closed, and industrial activities are largely at a halt worldwide. As strict lockdown was imposed all over India from 25 March 2020 to May 2020, a significant decline in power demand was seen, a nearly 20% to 40% drop. Conversely, this declining trend started to reverse from May 2020. According to Pillay [1], the rate of the demand for energy depreciation has recovered from 22% to 17%, and residential demand emerged compared to the industrial demand in May compared to April.
India’s power consumption shrunk 9.24% and 22.75% in March and April, but this slump in power consumption narrowed down in May to 14.16% [2,3]. The Economic Times [4] suggests that this recovery of the energy demand is related to the government starting to implement relaxations for economic activities and the increased use of air conditioners as the temperature soared beyond 45 degrees Celsius in May. The country’s electricity consumption fell by nearly 19% on 3 April 2020, and coal-based power generation reduced by 26% in the two weeks just after the lockdown began [5], but levels of electricity demand recovered in late May as the lockdown relaxed.
The International Energy Agency (IEA) [6] asserts that the reduction in the energy demand after the lockdown occurs due to a decrease in the demand from the service and industry sector, but a study shows that the domestic household consumption tends to increase during the lockdown [7]. However, the amount of energy consumed in the service and industry sector exceeds the household use, and thus lockdown, in general, has a negative impact on energy consumption. Therefore, in many countries, the energy demand plummeted after the lockdown as the level of industrial activities shrunk, and it only started to surge when business restarted as restrictions relaxed.
The outbreak of COVID-19 is indeed causing dramatic impacts on energy consumption as explained above. However, since the world is still far from controlling the pandemic, not much is known about how the increased number of COVID-19 cases is affecting energy consumption. To shed light on this issue, we examined how changes in the total number of COVID-19 cases influenced energy consumption by investigating cases in India. As of 12 June 2020, India is ranked fourth in the world in terms of its COVID-19 caseload and is one of the most populated countries among the emerging economies. Hence, understanding the effects of the COVID-19 cases on energy consumption for India provides valuable information for other developing countries struggling to supply energy effectively during the COVID-19 crisis and seeking to implement energy policy plans afterward. The current study is innovative as we investigated how COVID-19 cases influenced energy consumption not only at the national level but also at the regional level. We compared and found out whether income gaps among the Indian regions led to differences in the way their energy consumption was affected by the COVID-19 cases.
In many countries, lockdown measures have softened as the growth of new COVID-19 cases declines. This was also the condition of lockdown release in India, but in India, the relaxation process was conducted gradually by extending the lockdown five times [8]. Although the number of cases itself continued to increase during each successive lockdown period, the growth rate of the cases slowed down, and regulations have been relaxed as time passed from the first lockdown rule (Lockdown 1.0) on 25 March 2020 to the latest Lockdown 5.0 extended on 1 June 2020 [8,9]. Hence, we expected that the changes in the number of COVID-19 cases had a positive impact on energy consumption, and based on this anticipation, we stated the following hypothesis.
Hypothesis 1 (H1):
As lockdown measures are relaxed, energy consumption in India is inclined to increase to levels before the lockdown.
As half of India’s annual power consumption comes from industries and offices, we conjectured that an increase in energy consumption after the lockdown release would be more apparent in regions with a higher income level, since most of the major industries and large companies in India are located in these regions. Thus, the following hypothesis was also tested in this study.
Hypothesis 2 (H2):
Regions with higher income levels are quicker to recover their energy consumption to levels before the lockdown.
Pachauri [10] identifies that in India the household income level is the most important factor in household energy consumption. Therefore, it is likely that the economy of regions with low average energy consumption is more susceptible to the impact from the COVID-19 crisis, and we hypothesize that these regions are slower to recover their energy consumption.
Studies have investigated the impact of COVID-19 on air pollution [11,12], but as yet, no studies have examined the effects of the COVID-19 pandemic on energy consumption, which is an important issue for countries like India that are on the verge of development.
In the next section, we discuss the previous studies relevant to the study. The third section describes the methods of the study, and the fourth section displays the results and provides discussions based on the results. Finally, we conclude in the last section.
2. Literature Review
The current pandemic situation has made remarkable socioeconomic, health, and environmental impacts due to the imposition of strict restrictions worldwide. There was an immediate positive effect on global CO2 emission, which dropped by 17% in April 2020 compared to the average emission level of 2019 [13]. NASA released an image on 21 April 2020 that showed aerosol levels at a 20-year low for this time of the year in Northern India, an area that is among the most highly polluted regions of the world [5].
On the economic side, the creation of a global recession due to COVID-19 is unavoidable. The impact of the current pandemic on economic activity and energy demand has been unexpectedly severe compared with the 2008–2009 financial crisis [14,15]. A recent study of the impact of COVID-19 on household energy and food security in Kenya showed that 25% of the respondents are paying more for primary fuel than they would under normal conditions [16]. Another study highlights that shutting down all modes of travel has caused a massive fall in the crude oil price [17]. Governments are implementing huge stimulus packages for these sectors to recover from the damage [18].
COVID-19 has an especially adverse impact on the energy sector directly and indirectly. A study on crises and opportunities in terms of energy and artificial intelligence (AI) technologies during the COVID-19 pandemic for India found that the decline in electricity demand has directly resulted in a decrease in the use of coal by power plants [19]. India’s energy demand fell 26% within 10 days after imposing lockdown [20]. This drop is much larger than the average global energy demand reduction of 6% [21]. Another study observed that before starting the lockdown, the daily energy consumption across the country attained a greater magnitude of around 3500 GWh. Then, its consumption started to fall and reached near 2500 GWh on 1 April 2020 [22].
Quite a few studies investigate India’s economic growth and energy consumption. For example, Nain et al. [23] examine the short-run and long-run causal relationships among economic growth, energy consumption, and CO2 by using aggregate and disaggregate (sectoral) energy consumption measures from the annual data (1971–2011). The study applied the Toda–Yamamoto causality test, and the result showed that there are no symmetrical relationships among the variables included in the model. There is a significant number of studies examining the direction of the causal relationship between energy consumption and economic growth for India [24,25].
Among the studies investigating the effects of a crisis on energy markets, most of them focus on the global oil shocks in the 1970s and 1980s [26,27,28], energy shocks after the 2008–2009 financial crisis [29,30,31], and the shocks after the Fukushima disaster [32,33,34]. More studies will likely be coming out after the COVID-19 crisis, but at the moment, not many studies exist analyzing the energy shocks resulting from a global pandemic.
Studies exploring the impact of the COVID-19 outbreak include the work of Bao and Zhang [11], who tested how the lockdown has affected the level of air pollution in Northern Chinese cities. They find that the emissions of the five air pollutants (SO2, PM2.5, PM10, NO2, and CO) have decreased after the lockdown restrictions, suggesting that the air quality has improved after the COIVD-19 outbreak. Similarly, Sarfraz et al. [12] find evidence of air pollution improvement in Delhi and Mumbai after the spread of COVID-19. They reveal that the NO2 emissions have declined after the lockdown started. Therefore, the lockdown is suggested to have a positive effect on the environment. Our study is different from these studies because the focus is on the effects of the pandemic on energy consumption and how the energy consumption might recover as lockdown relaxes.
As the use of the autoregressive model is becoming popular for analyzing the changes in the spread of disease over time [35], our study is also modeled using this method. For example, Laguna et al. [36] tested how climatic variables such as local rainfall, temperature, and humidity affect the weekly cases of malaria using the autoregressive distributed lag (ARDL) model, and Upshur et al. [37] examine the relationship between the number of influenza isolates and hospital admissions for pneumonia. Recently, the importance of considering the effects of spatial autocorrelation in the autoregressive model was suggested [38,39], but the current study used the simple ARDL model, since our study applied a separate ARDL model for each Indian region and did not use panel data.
The current study is the first study to investigate how energy consumption is affected by the COVID-19 pandemic in India and how the effects might be different among the five geographical regions of India. As COVID-19 is causing devastating impacts on the world’s energy markets, this study not only contributes to understanding how the coronavirus shock has influenced the Indian energy sector but will also become a good reference for analyzing the effects of the pandemic on other countries’ energy sectors.
3. Overview of the Energy Consumption and COVID-19 Cases of India
3.1. Geographical Regions
India is a country in South Asia, with a rich cultural heritage and versatile socio-economic progress since its independence. It is the second-largest country in terms of population and has the world’s seventh-largest area [40]. Unofficially, there are 29 states, which are grouped into six regions to develop a cooperative working environment within these states. According to the Power System Operation Corporation Limited (POSOCO) regional electricity consumption data, India is divided into five major geographical regions: Northern (NR), Western (WR), Southern (SR), Eastern (ER), and North-Eastern (NER) [41]. The analyses performed in the current research are based on this regional classification. Table 1 presents the list of the states consisting of the five regions.
Karnataka is the richest state followed by Maharashtra, Telangana, Gujarat, and Tamil Nadu, whereas Uttarakhand of the NER is ranked top among the Hill States of India [42]. On the other hand, Bihar, Uttar Pradesh, Manipur, Jharkhand, and Assam are the five poorest states. Gross state domestic product (GSDP) per capita of Goa is 3.56 times more than the Indian average and 11.0 times greater than the lowest-ranked state Bihar. Maharashtra has the highest GSDP among the 29 Indian States [43].
The Northern Region (NR) is mainly agrarian but is changing fast with rapid economic growth that is typically above 8% annually. As a consequence of the Green Revolution, several parts of North India have prospered, including Punjab, Haryana, and Western Uttar Pradesh, and have experienced both economic and social development. Due to the unavailability of local jobs, a large number of unskilled and skilled workers have moved to Southern India and other nations. As shown in Table 2, the NR is ranked third for both GSDP and net state domestic product (NSDP) per capita among the five regions.
The Western Region (WR) is highly industrialized, with a large urban population. The WR comprises Goa, Gujarat, Maharashtra, Chhattisgarh, and the Madhya Pradesh, where Gujarat is highly industrialized and Goa and Rajasthan are tourist magnets. The WR generates 24% of the national GDP of the country, with an annual growth rate of 14.5% as of 2006. The states engender about 23% of the tax returns of the country. More than 85% and 65% of the households have access to electricity and television facilities, respectively [45]. It has the highest NSDP and is the second for GSDP among the five regions (see Table 2).
The Southern Region (SR) consists of the states of Andhra Pradesh, Karnataka, Kerala, Tamil Nadu, and Telangana having GDP per capita of 2964 USD and is ranked fourth among all Indian states. Telangana is the second most industrialized state in India next to Maharashtra. Tamil Nadu is among the most industrialized states in the country and is known for its automobile industry containing Chennai, which is the largest industrial center of the SR. The SR has the highest GSDP and the second NSDP per capita among the five regions.
The Eastern Region (ER) states of West Bengal, Bihar, Orisha, Jharkhand, and Sikkim are expected to contribute at least 25% of the country’s GDP by 2035 [46]. The annual per capita income of the ER has been on a steady rise during 2019–2020 [46]. Among the Eastern region states, West Bengal has the highest share of GSDP (39%), followed by Bihar at 18% and Odisha at 15% [46]. The ER’s GSDP and NSDP are the fourth among the five regions.
The North-Eastern Region (NER) includes Arunachal Pradesh, Assam, Manipur, Meghalaya, Mizoram, Nagaland, and Tripura. The economy of the NER is primarily agrarian. In this region, a very insignificant area of land is available for slash-and-burn agriculture known as jhum. The inaccessible terrain and internal disturbances have made rapid industrialization difficult in the region [47]. Both the GSDP and NSDP of the NER are the lowest among the five regions (see Table 2).
According to the Centre for Research on Energy and Clean Air (CREA), there has been a significant reduction in overall power demand and associated coal consumption by power generation facilities across the country. For example, all coal-based power plants within a 300 km radius of Delhi (Haryana, Punjab, and Uttar Pradesh) except two units at Dadri Power Plant have been shut down due to low demand caused by the lockdown restriction [48]. Data from POSOCO also show the steepest decline in consumption in the Western region, where it fell 35% to 771 GWh on 26 March 2020, as compared to 1187 GWh on 18 March 2020. Moreover, it is suggested that the power demand from the industrial hubs of Maharashtra, Gujarat, Rajasthan, and Tamil Nadu declined dramatically [49]. However, in Southern and Western India, some increase in the energy demand occurred due to hot weather conditions [50].
3.2. Energy Consumption and COVID-19 Cases of India
The daily energy consumption of the five geographical regions and the entirety of India was obtained from POSOCO [41], an independent company owned by the government of India. Data for the COVID-19 cases for the regions and the entirety of India were collected from Our World in Data (ourworldindata.org). The data period covered in this study is from 24 March 2020 to 11 June 2020. One reason for using 24 March as the initial period is because this is the date when the first COVID-19 cases were detected in North-Eastern India. Another reason is that on 24 March, the Indian prime minister declared a nationwide lockdown, and the first phase of the lockdown of India began on 25 March. Since the lockdown announcement, the Indian government has extended its lockdown by relaxing its regulation little by little, but India is still under the lockdown restrictions as of June 2020.
Table 3 illustrates the descriptive statistics of the energy consumption and COVID-19 cases of India and its five regions. It is observable that the order of the mean energy consumption and COVID-19 cases among the five regions is the same. In both mean energy consumption and COVID-19 cases, the WR is ranked the highest, the SR is the second, the NR is the third, the ER is the fourth, and, with a gap, the NER has the smallest mean.
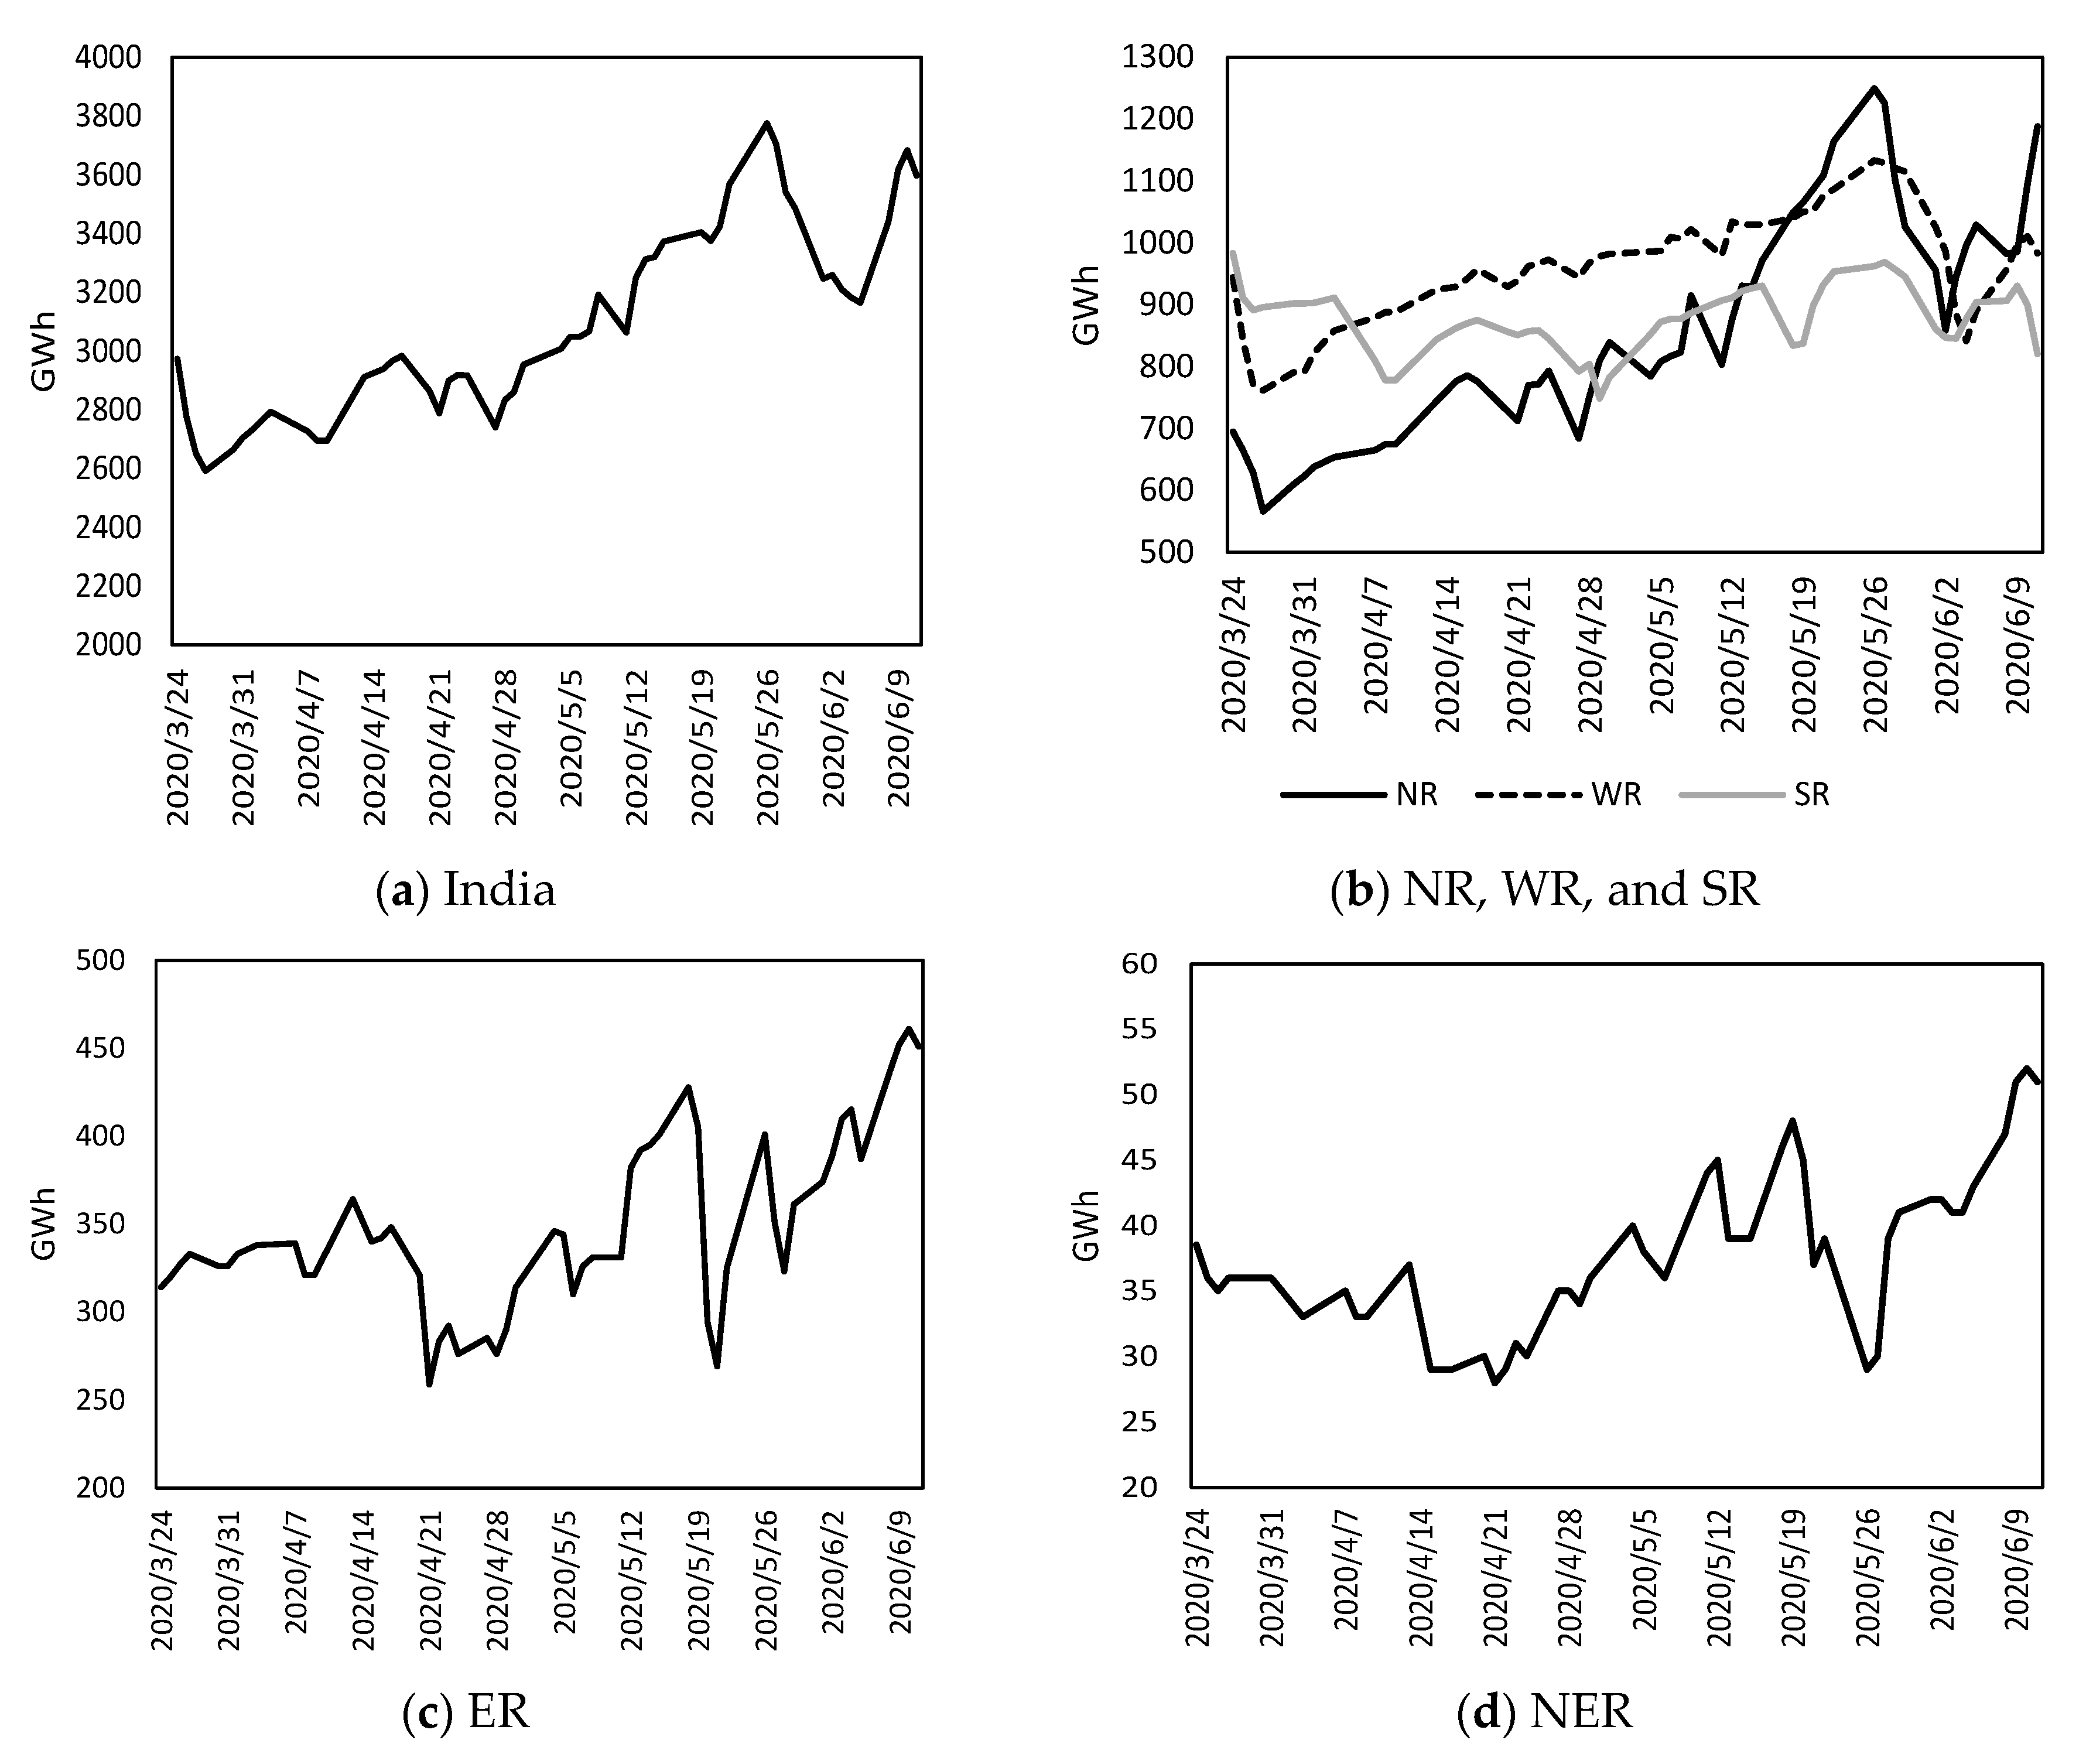
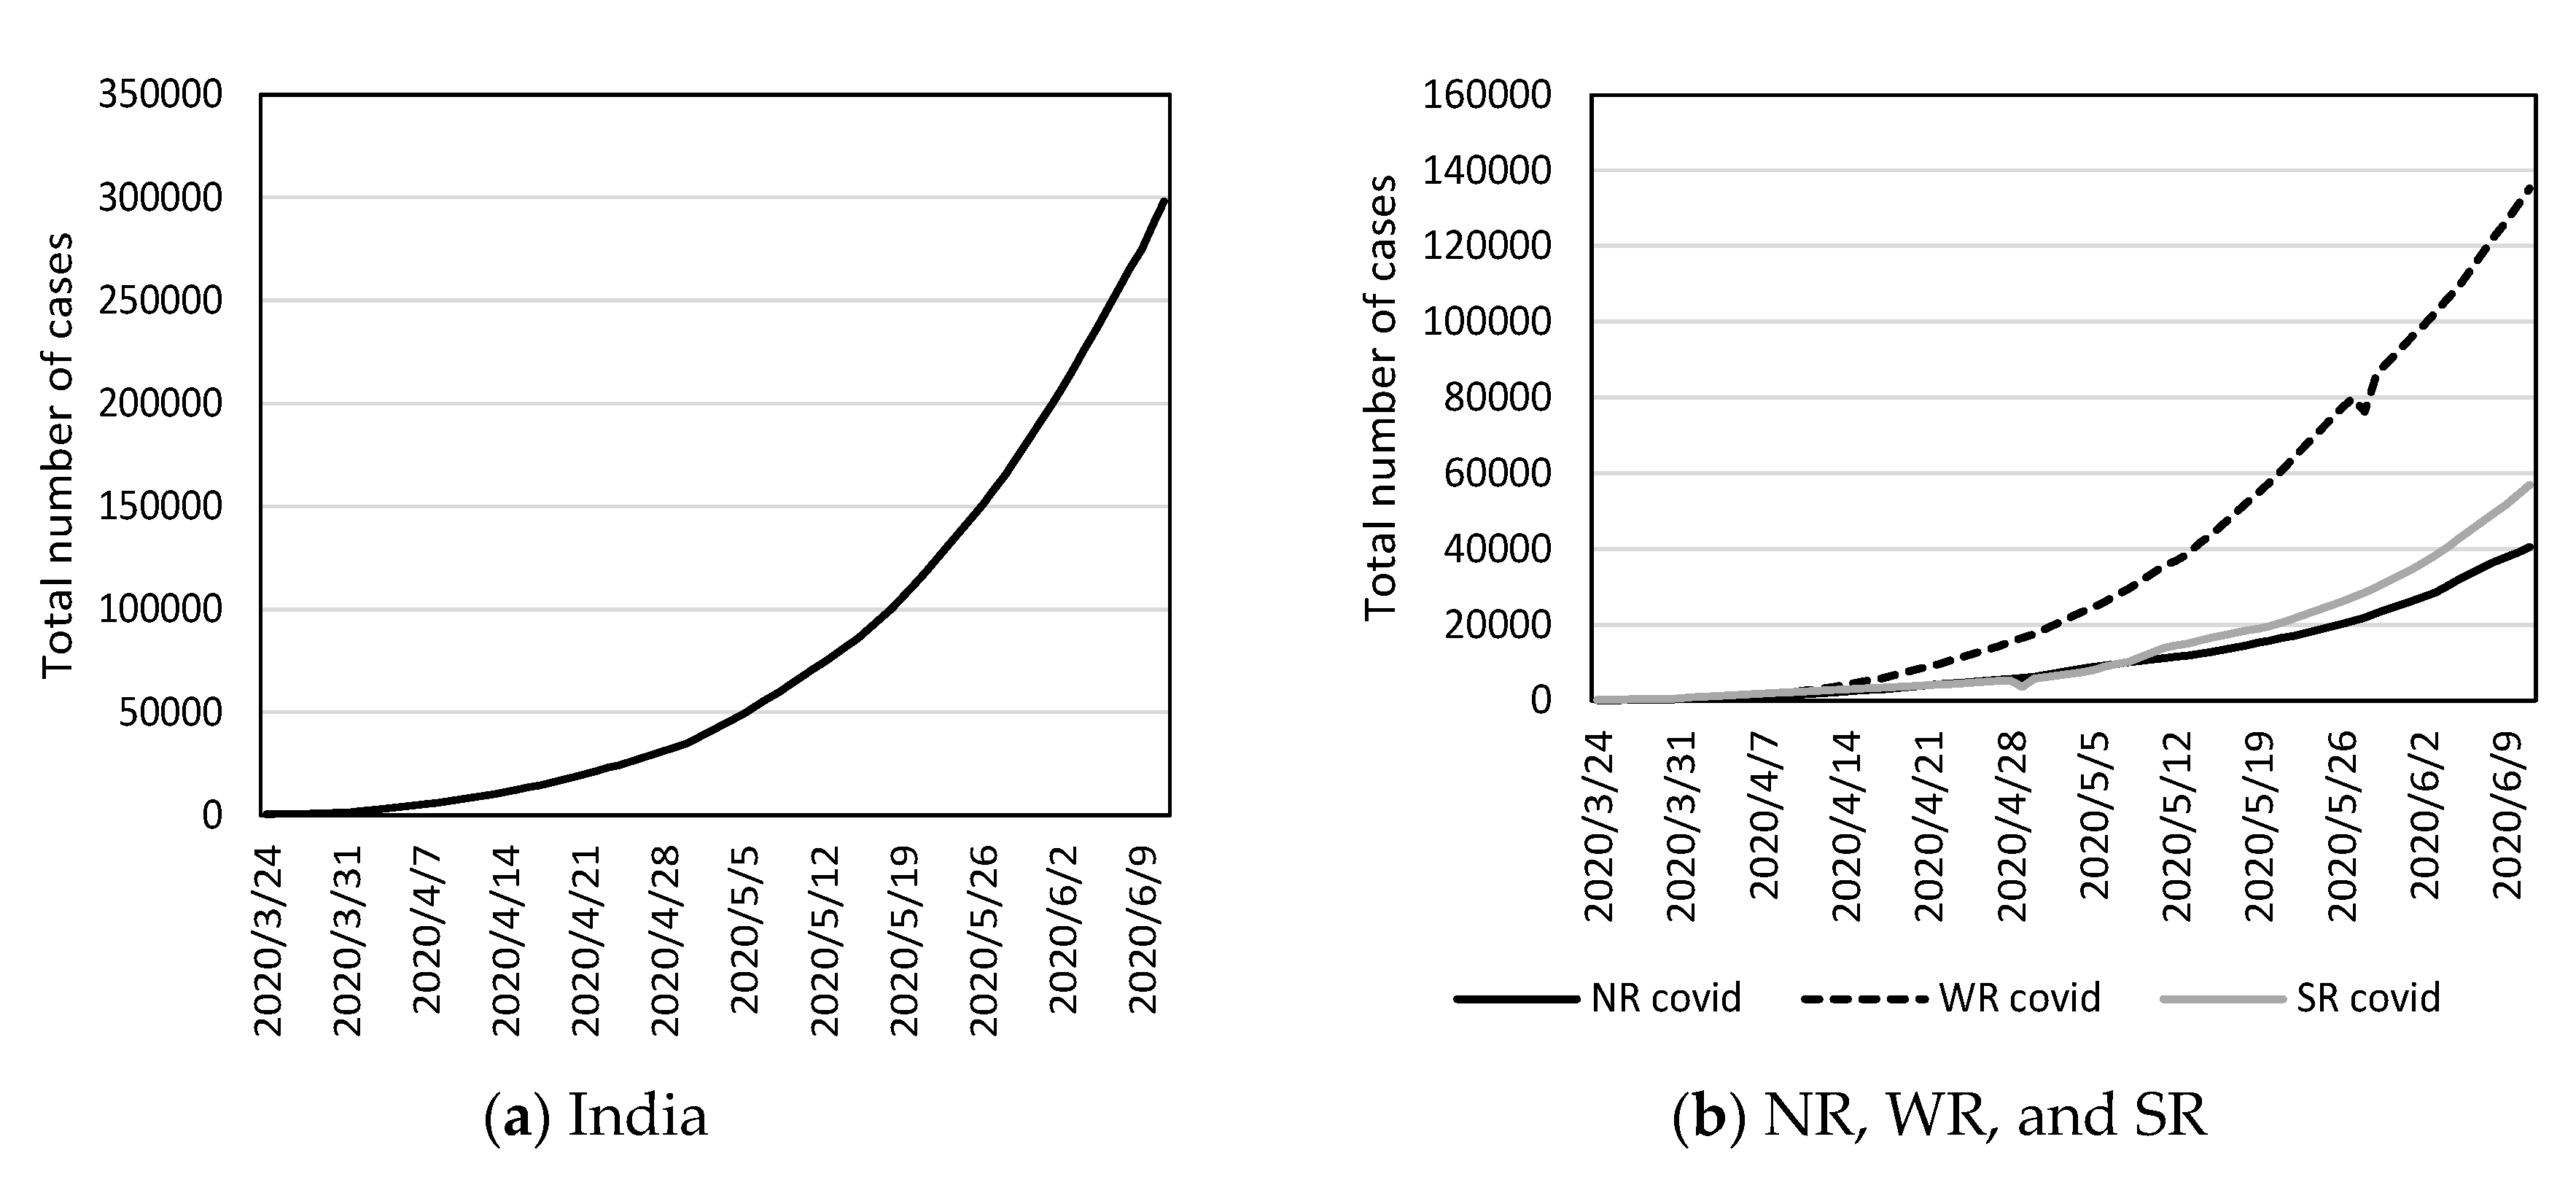
Figure 1 and Figure 2 are the plots of energy consumption and COVID-19 cases. It is apparent from Figure 1 that in all regions except the SR, the energy consumption had an upward trend until mid-May when the Ministry of Home Affairs (MHA) implemented Lockdown 4.0, the fourth phase of the lockdown, on 18 May 2020. After the drop related to this new lockdown rule, the energy consumption of all regions except the SR again started to increase. From Figure 2, we can see that in all figures there is a continuous upward trend in the total accumulative number of COVID-19 cases. However, the level of the growth of the cases is slower for the NR, WR, and SR compared to the ER and NER. After mid-May, the growth of the former three regions was less than twofold, but that of the ER and NER was more than fourfold. This suggests that the growth rate of people getting infected with the virus was higher in the ER and NER.
4. Methods
To capture the effects of the changes in the COVID-19 cases on energy consumption, we used the log series of COVID-19 and energy consumption data. Hence, all our analyses were performed using the log form of the series.
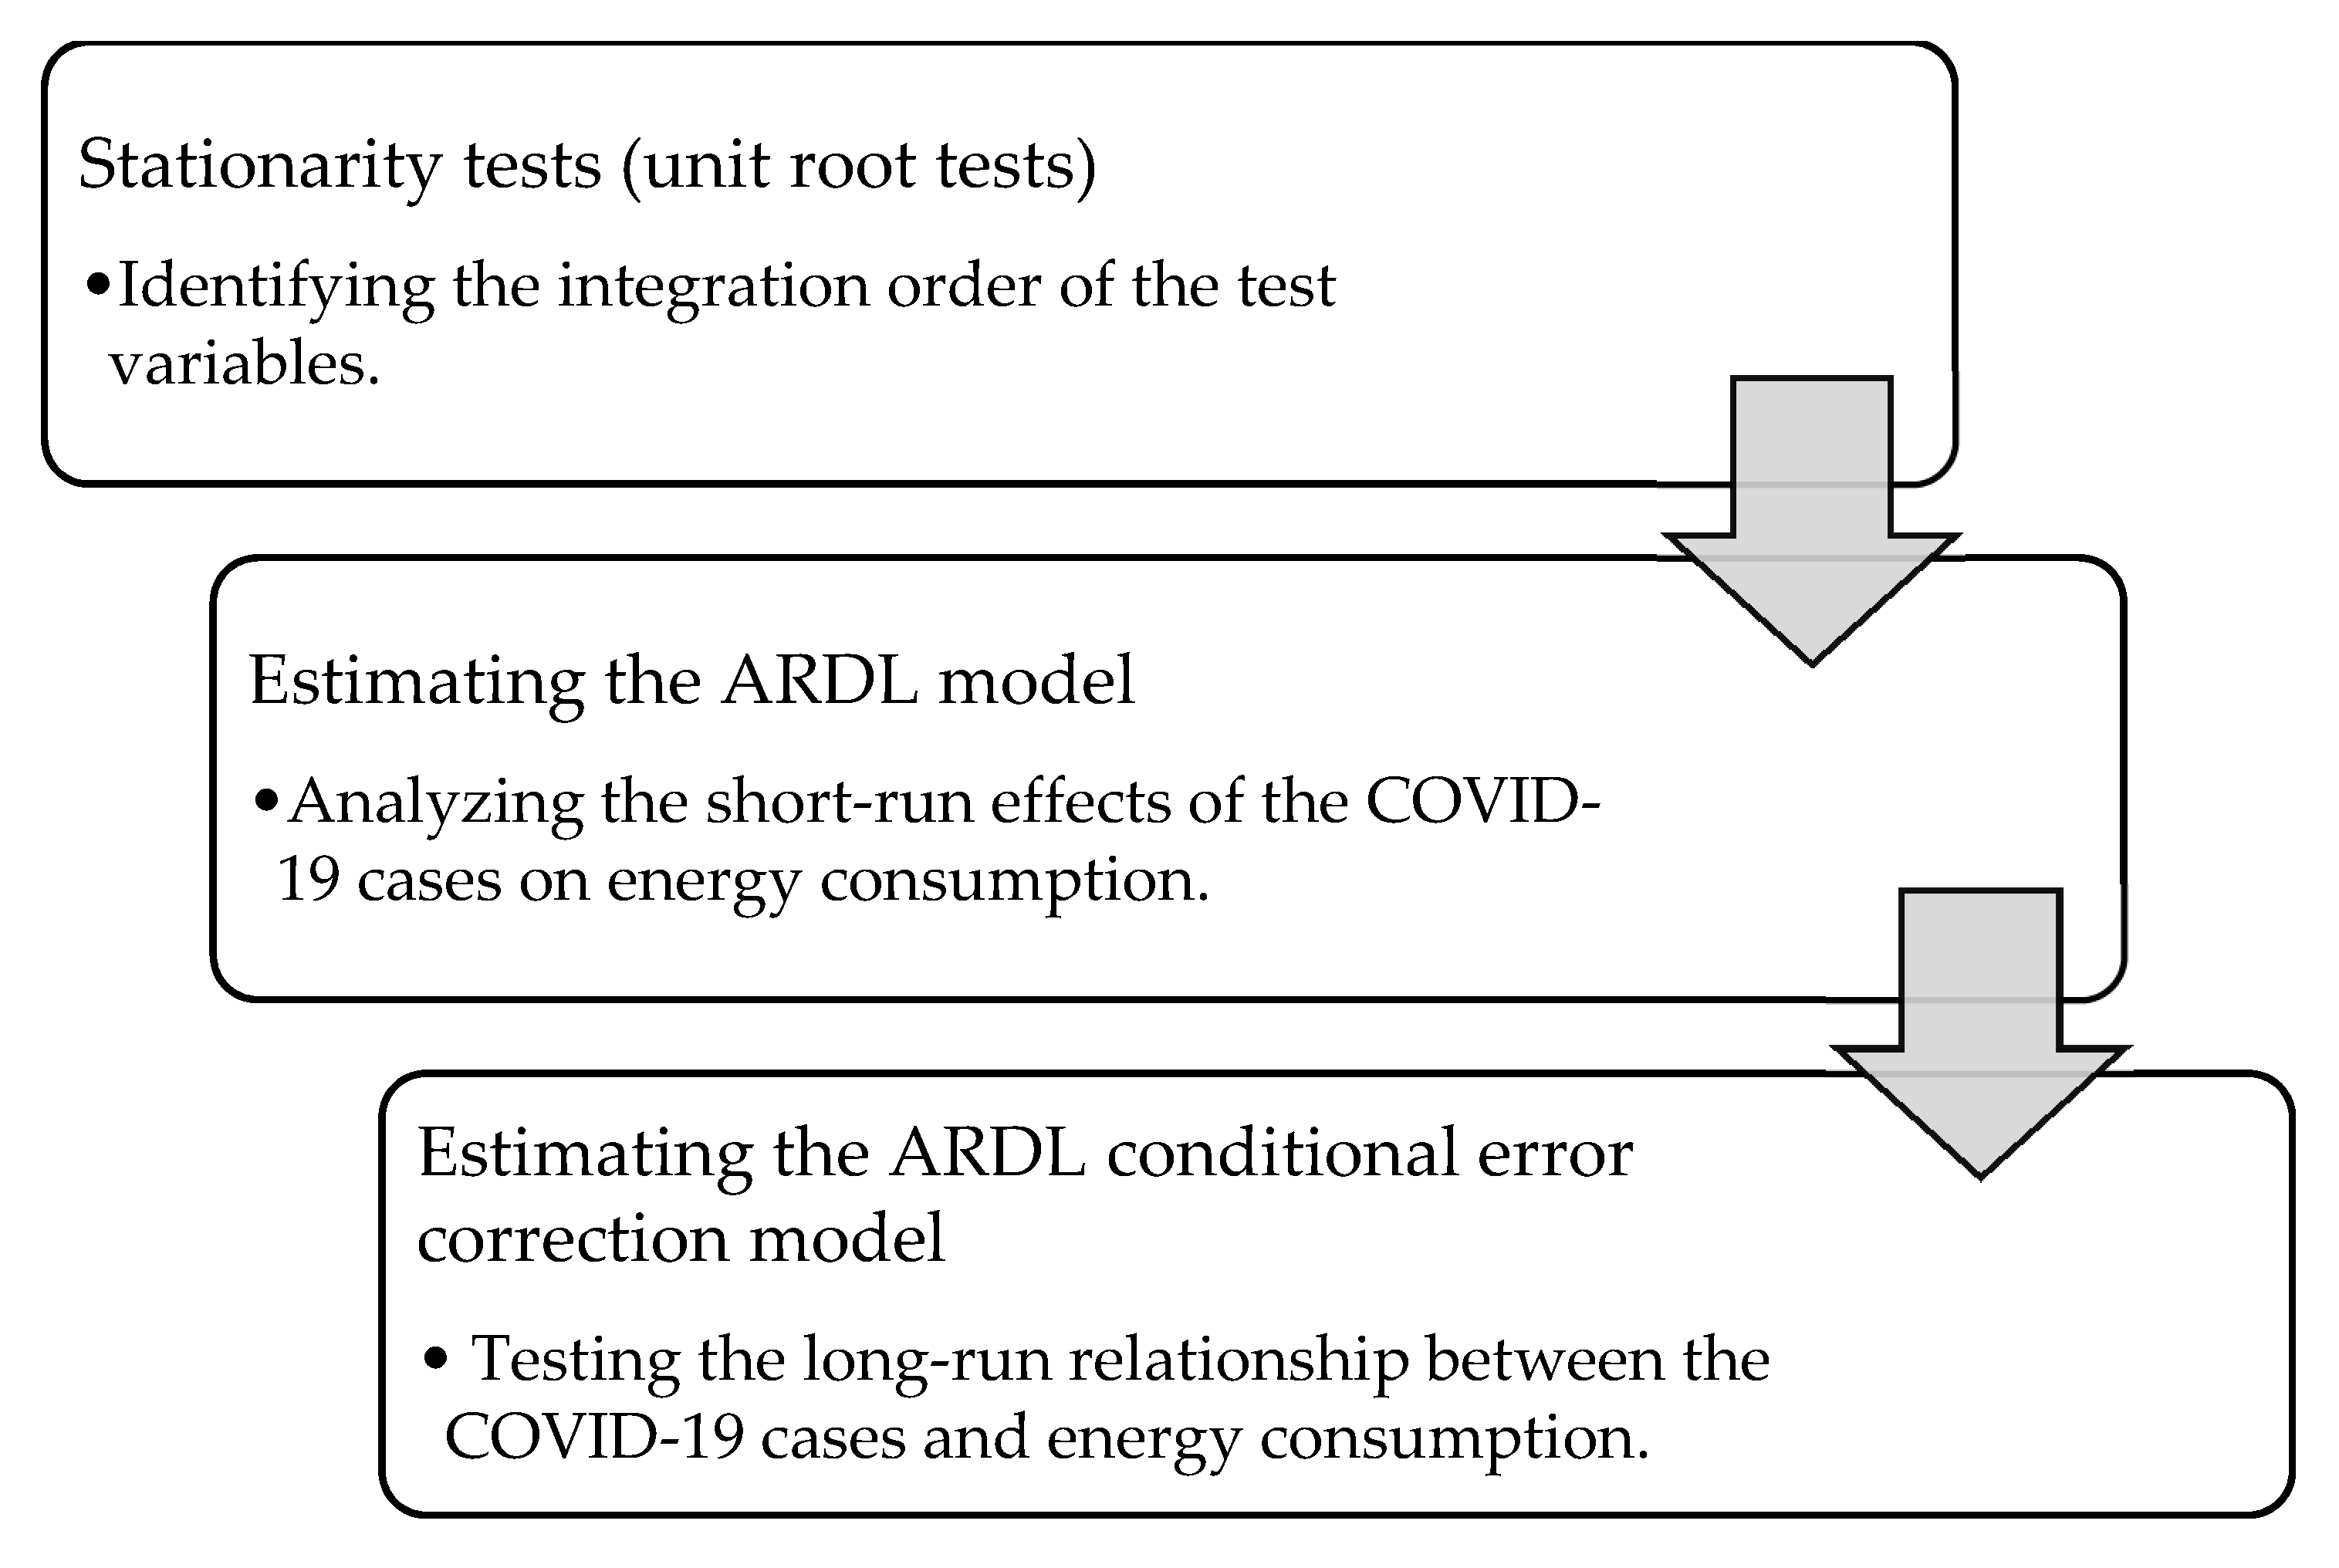
To identify both the short-run and long-run relationships between Indian energy consumption and the number of accumulative confirmed COVID-19 cases, we used the ARDL model developed by Pesaran et al. [49]. As not much time has passed since the spread of COVID-19, it was not possible to obtain large sample data. One of the main reasons we used the ARDL model is because this model is effective even when the sample size is small and can avoid omitted variables and auto-correlation issues. Figure 3 illustrates the steps of the methods followed in the study.
To use the ARDL model, the endogenous variables in the model must be either integrated of order zero or one. To test this, we initially performed stationarity tests on energy consumption and COVID-19 variables. For this purpose, we performed the augmented Dickey–Fuller (ADF), Phillips–Perron (PP), and the Kwiatkowski–Phillips–Schmidt–Shin (KPSS) unit root tests. Table 4 illustrates the results of these tests. All three unit root tests suggest that the energy consumption variables of the WR, NR, and ER, and the COVID-19 variable for the SR are integrated of order one at the 5% significance level. The unit root tests suggest that the other variables are also either integrated of order zero or one, suggesting all our test variables satisfy the precondition of the ARDL model.
The ARDL model used in this study has the following form:
where energy cons is the log of the daily energy consumption in gigawatt hours (GWh), c is the constant term, COVID is the log of the accumulative number of COVID-19 cases, X includes the log converted fixed variables to control the effects from economic and energy-related factors that are likely to have influences on energy consumption, and is the error term. and are the coefficient parameters of the lags of energy cons and COVID. The optimal lag length of the ARDL model is identified by the Akaike information criterion (AIC). For the fixed variables, we used the Nifty 50, Nifty Energy, Nifty Oil and Gas, and Nifty Auto indices. These data were obtained from the homepage of the National Stock Exchange of India Ltd. Nifty 50 is one of the major benchmark stock indices in India and was added to the model to control the impact of the Indian economy on energy consumption. Nifty Energy consists of companies representing petroleum, gas, and power sector to consider the influence of the energy sectors. Nifty Oil and Gas and Nifty Auto are indices related to the gas and petroleum and the automobiles sectors [51]. Using Equation (1), we estimated the short-run effects of the COVID-19 cases on energy consumption for all of India and the five geographical regions (the WR, NR, SR, ER, and NER).
To examine the long-run relationship between energy consumption and COVID-19 cases, the ARDL conditional error correction model was estimated with Equation (2):
where is the first difference operator and is the error correction term, which captures the long-run relationship between energy consumption and COVID-19 cases.
Based on this equation, the ARDL cointegration test, which is also known as the bounds testing, was conducted. For the two variables of our interest to be cointegrated, the F-test statistic computed from the equation must be higher than both the lower and upper bound critical values provided in Pesaran et al. [49].
To check if the residuals of the ARDL model faced serial correlation and heteroskedasticity issues, the Breusch–Godfrey (BG) and Breusch–Pagan–Godfrey (BPG) tests were performed. Table 5 depicts the summary results of these tests for the entirety of India and five geographical regions. It is discernible from the table that all our models do not have serial correlations. However, we found that the WR model has a heteroskedasticity problem. Thus, we used the heteroskedasticity and autocorrelation corrected (HAC) standard errors proposed by Newey and West [52], which enabled us to reduce the biases when measuring the standard errors of the ARDL models in the presence of heteroskedasticity.
5. Results and Discussions
We estimated the ARDL model to investigate if the daily changes in the total accumulative number of COVID-19 cases in India along with its five regions have an impact on daily energy consumption. The results of the model estimations are presented in Table 6. It is apparent from Table 6 that the daily changes in the accumulative number of COVID-19 cases had a statistically positive effect on the daily energy consumption of all of India and the NR, WR, and ER based on the 5% significance level. The SR was only significant at the 10% level, but the direction of the impact indicates that the COVID-19 cases have a positive influence on energy consumption. It is also noticeable from the result of the SR and ER models that the total COVID-19 cases of one day before negatively impacted the energy consumption. COVID-19 did not have a significant short-run impact on energy consumption in the NER. As shown in Table 2, the NSDP per capita of the NER is the lowest among the five regions, and it could be that this region was less solvent compared to other regions in terms of recovering its economic activities to the level of the period before the COVID-19 outbreak. Furthermore, as seen in Figure 2d, the level of the growth of COVID-19 cases for the NER was higher compared to the other regions even after mid-May, and thus, its energy consumption remained stagnant after the lockdown relaxation. This could be also the reason for the COVID-19 cases not having a statistically significant effect on the NER.
To find out if cointegration relationships were sustained between the COVID-19 cases and energy consumption during our whole test period, the bounds F-test was conducted. According to Table 7, cointegration relationships exist for the entirety of India and the NR, WR, and SR models indicating that there is a long-run relationship between the COVID-19 cases and energy consumption in these regions. Meanwhile, the table suggests that such linkages do not hold in the ER and NER. To identify if the long-run relationship is sustained through the effects of COVID-19 cases, we examined the coefficients of the cointegrating equation.
As seen in Table 8, India, the NR, and the WR had long-run impacts from the COVID-19 cases on energy consumption, but the SR, ER, and NER did not have the effects from the COVID-19 cases. Thus, the results of Table 7 and Table 8 suggest that the long-run relationship was caused by the COVID-19 cases in all of India, the NR, and the WR but not in the SR, ER, and NER. The reason for the ER and NER not having effects from the COVID-19 cases is likely to be related to the same reason as the case of the short-run relationship. The ER and NER are the poorest regions among the five regions and are the regions where the growth of COVID-19 cases continued to be high even after mid-May. It is believable that these factors have slowed down the recovery of the energy consumption levels for these regions. The SR not revealing impacts from the COVID-19 cases on energy consumption is perhaps because, as seen in Figure 1b, the SR did not have an increasing trend in its energy consumption during our test period. Although the cool weather kept the power demand low despite a partial easing of the lockdown from 20 April, the temperature of the SR is generally hot, which causes less variation of electricity consumption even during the COVID-19 crisis.
Finally, as India, the NR, and the WR had a cointegration relationship between the COVID-19 cases and energy consumption, we present the error correction model of these regions. As seen in Table 9, all these regions show a positive impact from the COVID-19 cases on their regional energy consumption levels. This indicates that in these regions, the COVID-19 cases had a positive impact on their energy consumptions.
6. Conclusions
As COVID-19 spread out worldwide, India was not an exception to the high infection rate of the virus, and the government had to impose severe stay-at-home restrictions. The energy consumption in India plummeted dramatically by the end of March 2020 because of this lockdown regulation. However, since the end of April, energy consumption started to recover as the regulation relaxed. This study investigated how India has recovered its energy consumption after the decline in its energy consumption in March 2020.
We investigated if the release of lockdown positively influenced the energy consumption (H1) and if this positive reaction differed among regions at different average income levels. We examined if regions with higher income levels were more likely to recover their energy consumption to pre-crisis levels faster than those with lower income levels (H2). The results of our analyses indicated that both hypotheses H1 and H2 prevailed. This implies that even during the middle of the spread of the pandemic, energy consumption increased as lockdown regulation relaxed.
However, we found that this recovery of energy consumption is not occurring in the ER and NER. These two regions are the poorer regions among the five geographical regions investigated in this study. In India, the level of energy consumption is strongly connected to household income levels [10], and the reduction in energy consumption indicates that the individual’s economic conditions are deteriorating. Therefore, the result of our study, revealing that poorer regions are struggling to recover their energy consumption to levels before the pre-COVID-19, crisis imply that the economic damage to these regions was more critical than the impact on the regions with higher average income levels. This suggests the importance of providing special economic aid and policies for these two regions to recover their economy to levels before the pre-COVID-19 crisis.
Our study is limited in the sense that it only used short-term data because the study was performed in the middle of the COVID-19 pandemic. Since the effects of COVID-19 are changing as time goes by, we would like to note that the results are likely to change when the same analyses are performed for different periods.
Author Contributions
Conceptualization, K.A., M.M.I. and A.J.; methodology, K.A.; formal analysis, K.A.; data curation, K.A., M.M.I. and A.J.; writing—original draft preparation, K.A., M.M.I., and A.J.; writing—review and editing, K.A., M.M.I., and A.J.; supervision, K.A. All authors have read and agreed to the published version of the manuscript.
Funding
This work was supported by JSPS KAKENHI Grant Number 18K12763.
Conflicts of Interest
The authors declare no conflict of interest.
References
- Pillay, A. Lockdown Knocked Power Consumption Down by Up to 40% in Large Cities. The Business Standard. 2020. Available online: https://www.business-standard.com/article/printer-friendly-version?article_id=120061800951_1 (accessed on 18 June 2020).
- The Economic Times. India’s Power Consumption Shrinks 9.24% at 100.13 BU in March. 2020. Available online: https://economictimes.indiatimes.com/industry/energy/power/indias-power-consumption-shrinks-9-24-at-100-13-bu-in-march/re_show/74933363.cms (accessed on 12 June 2020).
- The Economic Times. The Economic Times, Lockdown Pulls down Power Consumption by 22.75% to 85.05 BU in April. 2020. Available online: https://economictimes.indiatimes.com/industry/energy/power/lockdown-pulls-down-power-consumption-by-22-75-pc-to-85-05-bu-in-apr/articleshow/75533685.cms (accessed on 12 June 2020).
- The Economic Times. The Economic Times: India’s Fuel Demand Nearly Doubles in May as Lockdowns Ease. 2020. Available online: https://economictimes.indiatimes.com/industry/energy/oil-gas/indias-fuel-demand-nearly-doubles-in-may-as-lockdowns-ease/articleshow/76308664.cms (accessed on 13 June 2020).
- Aggarwal, M. India’s Power Consumption Falls by 19 Percent During COVID-19 Lockdown. 2020. Available online: https://india.mongabay.com/2020/04/indias-power-consumption-falls-by-19-percent-during-covid-19-lockdown/ (accessed on 17 June 2020).
- IEA. International Energy Agency, COVID-19 Impact on Electricity. 2020. Available online: https://www.iea.org/reports/covid-19-impact-on-electricity (accessed on 16 June 2020).
- The Earth Institute, Columbia University, New Data Suggest COVID-19 Is Shifting the Burden of Energy Costs to Households. 2020. Available online: https://blogs.ei.columbia.edu/2020/04/21/covid-19-energy-costs-households/ (accessed on 22 June 2020).
- ACKO General Insurance. New Lockdown Rules from June 1: What Is Allowed and Banned in Green, Orange, and Red Zones. ACKO General Insurance. 5 May 2020. Available online: https://www.acko.com/health-insurance/new-lockdown-rules-what-is-allowed-banned-green-orange-red-zones/ (accessed on 22 June 2020).
- Rukmini, S. What Has Changed from Lockdown 1.0 to Lockdown 3.0? India Today. 14 May 2020. Available online: https://www.indiatoday.in/diu/story/india-coronavirus-what-has-changed-from-lockdown-1-to-lockdown-3-1677824-2020-05-14 (accessed on 22 June 2020).
- Pachauri, S. An analysis of cross-sectional variations in total household energy requirements in India using micro survey data. Energy Policy 2004, 32, 1723–1735. [Google Scholar] [CrossRef]
- Bao, R.; Zhang, A. Does lockdown reduce air pollution? Evidence from 44 cities in northern China. Sci. Total Environ. 2020. [Google Scholar] [CrossRef]
- Sarfraz, M.; Shehzad, K.; Meran Sha, S.G. The impact of COVID-19 as a necessary evil on air pollution in India during the lockdown. Environ. Pollut. 2020. [Google Scholar] [CrossRef]
- Le Quéré, C.; Jackson, R.B.; Jones, M.W.; Smith, A.J.; Abernethy, S.; Andrew, R.M.; De-Gol, A.J.; Willis, D.R.; Shan, Y.; Friedlingstein, P.; et al. Temporary reduction in daily global CO2 emissions during the COVID-19 forced confinement. Nat. Clim. Chang. 2020, 1–8. [Google Scholar] [CrossRef]
- Suehiro, S. Impact of Covid-19 on Energy Demand. IEEJ e-Newsl. 2020, 184, 3. Available online: https://eneken.ieej.or.jp/data/8938.pdf (accessed on 24 June 2020).
- Tahir, M.B.; Sohaib, M. Social and Environmental Impact of COVID-19: Positive and negative aspects. J. Jpn. Soc. Pediatr. Surg. 2020, 8, 255–256. [Google Scholar] [CrossRef]
- Shupler, M.; Mwitari, J.; Gohole, A.; de Anderson Cuevas, R.; Puzzolo, E.; Cukic, I.; Nix, E.; Pope, D. COVID-19 Lockdown in a Kenyan Informal Settlement: Impacts on Household Energy and Food Security. MedRxiv 2020. [Google Scholar] [CrossRef]
- Mehta, K.; Jha, S.S. COVID-19: A Nightmare for the Indian Economy. SSRN Electron. J. 2020, 31, 333–347. [Google Scholar] [CrossRef]
- Mori, H.; Takahashi, Y.; Zusman, E.; Mader, A.; Kawazu, E.; Otsuka, T.; Moinuddin, M.; King, P.; Elder, M.; Takai, E. Implications of COVID-19 for the Environment and Sustainability; Institute for Global Environmental Strategies: Hayama, Japan, 2020; Available online: https://www.iges.or.jp/en/pub/covid19-e/en (accessed on 18 June 2020).
- Wang, B.; Yang, Z.; Xuan, J.; Jiao, K. Crises and opportunities in terms of energy and AI technologies during the COVID-19 pandemic. Energy AI 2020. [Google Scholar] [CrossRef]
- Energy World. Coronavirus Impact: Within Ten Days, a 26 Percent Fall in India’s Energy Consumption. 2020. Available online: https://energy.economictimes.indiatimes.com/news/power/coronavirus-impact-withinten-days-26-per-cent-fall-in-indias-energy-consumption/74854825 (accessed on 21 June 2020).
- IEA. Global Energy Demand to Plunge This Year as a Result of the Biggest Shock Since the Second World War. 2020. Available online: https://www.iea.org/news/global-energy-demand-to-plunge-this-year-as-a-result-of-thebiggest-shock-since-the-second-world-war (accessed on 21 June 2020).
- Shafiullah, G.; Raju, K.; Jamal, T.; Reddy, S.K. COVID-19: Impact Analysis and Recommendations for Power and Energy Sector Operation EnerarXiv-Preprint Preprint. 2020. Available online: https://www.researchgate.net/publication/341204513%0ACOVID-19 (accessed on 22 June 2020).
- Nain, M.Z.; Ahmad, W.; Kamaiah, B. Economic growth, energy consumption and, CO2. Int. J. Sustain. Energy 2017, 36, 807–824. [Google Scholar] [CrossRef]
- Paul, S.; Bhattacharya, R.N. Causality between energy consumption and economic growth in India: A note on conflicting results. Energy Econ. 2004, 26, 977–983. [Google Scholar] [CrossRef]
- Nain, Z.; Ahmad, W. Energy Consumption and India’s Economic Growth. A disaggregated Analysis. Indian Econ. J. 2012, 60, 41–59. [Google Scholar] [CrossRef]
- Lonergan, S.C.; Cocklin, C. In the aftermath of the energy crisis: New Zealand’s energy policy in the 1970s and 1980s. Energy Policy 1990, 18, 100–116. [Google Scholar] [CrossRef]
- Mukhopadhyay, K.; Chakraborty, D. India’s energy consumption changes during 1973/74 to 1991/92. Econ. Syst. Res. 1999, 11, 423–438. [Google Scholar] [CrossRef]
- Hunt, B. Oil price shocks and the U.S. stagflation of the 1970s: Some insights from GEM. Energy J. 2006, 27, 61–80. [Google Scholar] [CrossRef]
- Sinha, A. Nature of Energy index volatility in post financial crisis period: Evidences from India. Energy Procedia 2015, 75, 2556–2562. [Google Scholar] [CrossRef] [Green Version]
- Kayalar, D.E.; Kucukozmen, C.C.; Selcuk-Kestel, A.S. The impact of crude oil prices on financial market indicators: Copula approach. Energy Econ. 2017, 61, 162–173. [Google Scholar] [CrossRef]
- Sadorsky, P. Energy related CO2 emissions before and after the financial crisis. Sustainability 2020, 12, 3867. [Google Scholar] [CrossRef]
- Vivoda, V. Japan’s energy security predicament post-Fukushima. Energy Policy 2012, 46, 135–143. [Google Scholar] [CrossRef] [Green Version]
- Hayashi, M.; Hughes, L. The policy responses to the Fukushima nuclear accident and their effect on Japanese energy security. Energy Policy 2013, 59, 86–102. [Google Scholar] [CrossRef]
- Aruga, K. Analyzing the condition of Japanese electricity cost linkages by fossil fuel sources after the Fukushima disaster. Energy Transit. 2020, 4, 91–100. [Google Scholar] [CrossRef] [Green Version]
- Allard, R. Use of time-series analysis in infectious disease surveillance. Bull. Word Health Organ. 1998, 76, 327–333. [Google Scholar] [CrossRef] [Green Version]
- Laguna, F.; Grillet, M.E.; Leon, J.R.; Ludena, C. Modelling malaria incidence by an autoregressive distributed lag model with spatial component. Spat. Spatio-Temporal Epidemiol. 2017, 22, 27–37. [Google Scholar] [CrossRef] [PubMed]
- Upshur, R.E.G.; Knight, K.; Goel, V. Time-series analysis of the relation between influenza virus and hospital admissions of the elderly in Ontario, Canada, for pneumonia, chronic lung disease, and congestive heart failure. Am. J. Epidemiol. 1999, 149, 85–92. [Google Scholar] [CrossRef] [Green Version]
- Corizzo, R.; Ceci, M.; Japkowicz, N. Anomaly detection and repair for accurate predictions in geo-distributed big data. Big Data Res. 2019, 16, 18–35. [Google Scholar] [CrossRef]
- Ceci, M.; Corizzo, R.; Malerba, D.; Rashkovska, A. Spatial autocorrelation and entropy for renewable energy forecasting. Data Min. Knowl. Discov. 2019, 33, 698–729. [Google Scholar] [CrossRef]
- India Brand Equity Foundation (IBEF). India: A Snapshot. 2020. Available online: https://www.ibef.org/economy/indiasnapshot/about-india-at-a-glance (accessed on 25 June 2020).
- POSOCO. Power System Operation Corporation Limited. National Load Despatch Centre, Daily Reports–2020-21. 2020. Available online: https://posoco.in/reports/daily-reports/daily-reports-2020-21/?fbclid=IwAR1WE51WnwwJcYjXMV37pJHsNQyQHafn2BlO_rMrxGyP1FXKiYElaT8ZFWk (accessed on 13 June 2020).
- Handbook of Statistics. Reserve Bank of India–Publications. 2017. Available online: www.rbi.org.in (accessed on 13 June 2020).
- MOSPI Net State Domestic Product. Ministry of Statistics and Programme Implementation, Government of India. 2020. Available online: http://www.mospi.gov.in/ (accessed on 17 June 2020).
- IMF. Report for Selected Countries and Subjects. IMF, 2020. Available online: https://www.imf.org/external/pubs/ft/weo/2017/01/weodata/weorept.aspx?pr.x=31&pr.y=13&sy=2016&ey=2020&scsm=1&ssd=1&sort=country&ds=.&br=1&c=534&s=NGDPD%2CNGDPDPC%2CPPPGDP%2CPPPPC&grp=0&a= (accessed on 12 June 2020).
- Parthasamy, R.; Sudarshan, I. New Development Paradigms and Challenges for Western and Central India; Concept Publishing Company: New Delhi, India, 2006; Volume 85, ISBN 9788180692802. [Google Scholar]
- Business Line. Eastern Region to Contribute 25% of India’s GDP: KPMG. 2020. Available online: https://www.thehindubusinessline.com/economy/eastern-region-to-contribute-25-of-indias-gdp-kpmg/article10048013.ece (accessed on 19 June 2020).
- Nandy, S.N. Agro-Economic Indicators: A Comparative Study of North-Eastern States of India. J. Land Rural Stud. 2014, 2, 75–88. [Google Scholar] [CrossRef]
- Aggarwal, M. Within 10 Days of the Lockdown, India Was Consuming 20% Less Power than Usual. 2020. Available online: https://qz.com/india/1844956/indias-coronavirus-lockdown-drastically-cuts-power-consumption/ (accessed on 20 June 2020).
- Pesaran, M.; Shin, Y.; Smith, R. Bounds testing approaches to the analysis of level relationships. J. Appl. Econom. 2001, 16, 289–326. [Google Scholar] [CrossRef]
- The Economic Times. Covid-19 Lockdown Impact: Power Demand Drops as Offices Stay Plugged Out. 2020. Available online: https://economictimes.indiatimes.com/industry/energy/power/power-demand-drops-as-offices-stay-plugged-out/articleshow/74819188.cms?from=mdr (accessed on 20 June 2020).
- NSE (National Stock Exchange of India Ltd.). NSE Indices Limited: Methodology Document for NIFTY Indices. 2020. Available online: https://www1.nseindia.com/content/indices/Method_NIFTY_Equity_Indices.pdf (accessed on 18 June 2020).
- Newey, W.; West, K. A simple positive sei-definite, heteroskedasticity and autocorrelation consistent covariance matrix. Econometrica 1987, 55, 703–708. [Google Scholar] [CrossRef]
Figure 1.
Energy consumption in India.

Figure 2.
COVID-19 cases in India.


Figure 3.
Overview of the steps of the methods.


Table 1.
All states of India with regions.
| Regions | States |
|---|---|
| Northern Region (NR) | Punjab |
| Haryana | |
| Rajasthan | |
| Uttar Pradesh | |
| Uttarakhand | |
| Himachal Pradesh | |
| Jammu and Kashmir (UT) and Ladakh (UT) | |
| Western Region (WR) | Chhattisgarh |
| Gujarat | |
| Madhya Pradesh | |
| Maharashtra | |
| Goa | |
| Southern Region (SR) | Andhra Pradesh |
| Telangana | |
| Karnataka | |
| Kerala | |
| Tamil Nadu | |
| Eastern Region (ER) | Bihar |
| Jharkhand | |
| Orisha | |
| West Bengal | |
| Sikkim | |
| North-Eastern Region (NER) | Arunachal Pradesh |
| Assam | |
| Manipur | |
| Meghalaya | |
| Mizoram | |
| Nagaland | |
| Tripura |
Table 2.
Gross state domestic product (GSDP) and net state domestic product (NSDP) per capita of the five regions (USD).
Table 2.
Gross state domestic product (GSDP) and net state domestic product (NSDP) per capita of the five regions (USD).
| Regions | 2017 GSDP | 2018–2019 Average NSDP Per Capita |
|---|---|---|
| WR | $812 billion | $3026 |
| NR | $438 billion | $2167 |
| SR | $1.1 trillion | $2819 |
| ER | $365 billion | $1994 |
| NER | $80 billion | $1627 |
Source: IMF [44] and Ministry of Statistics and Programme Implementation, Gov. of India.
Table 3.
Descriptive statistics.
| Variable | Mean | Median | Maximum | Minimum | Std. Dev. |
|---|---|---|---|---|---|
| All India energy cons. | 3103.04 | 3049.50 | 3775 | 2592 | 320.96 |
| WR energy cons. | 963.94 | 975.50 | 1133 | 761 | 91.04 |
| NR energy cons. | 861.60 | 813.50 | 1250 | 566 | 177.89 |
| SR energy cons. | 877.94 | 877.00 | 983 | 749 | 52.81 |
| ER energy cons. | 347.67 | 335.50 | 461 | 259 | 50.21 |
| NER energy cons. | 37.65 | 37.00 | 52 | 28 | 6.12 |
| All India COVID | 84,463.29 | 51,193.50 | 298,283 | 536 | 88,997.86 |
| WR COVID | 40,504.87 | 25,412.00 | 135,264 | 151 | 41,838.18 |
| NR COVID | 12,150.58 | 9099.00 | 40,604 | 137 | 11,728.35 |
| SR COVID | 15,404.10 | 8491.00 | 56,955 | 215 | 16,196.14 |
| ER COVID | 4992.81 | 2259.00 | 20,714 | 14 | 6066.16 |
| NER COVID | 799.48 | 115.50 | 5078 | 1 | 1391.82 |
Table 4.
Unit root tests.
| Level | First differences | |||||||||||
|---|---|---|---|---|---|---|---|---|---|---|---|---|
| ADF | PP | KPSS | ADF | PP | KPSS | |||||||
| All India energy cons. | −3.678 | ** | −3.658 | ** | 0.219 | *** | −6.088 | *** | −6.273 | *** | 0.112 | |
| WR energy cons. | −2.664 | −2.756 | 0.160 | ** | −4.397 | *** | −5.488 | *** | 0.084 | |||
| NR energy cons. | −3.420 | * | −2.862 | 0.072 | −7.237 | *** | −8.305 | *** | 0.073 | |||
| SR energy cons. | −3.638 | ** | −3.361 | * | 0.124 | * | −5.185 | *** | −4.874 | *** | 0.148 | ** |
| ER energy cons. | −2.089 | −2.812 | 0.229 | *** | −8.044 | *** | −13.803 | *** | 0.111 | |||
| NER energy cons. | −2.846 | −2.862 | 0.109 | −7.490 | *** | −8.305 | *** | 0.082 | ||||
| All India COVID | −7.220 | *** | −1.518 | 0.219 | *** | −0.981 | −10.651 | *** | 0.112 | |||
| WR COVID | −8.635 | *** | −1.278 | 0.230 | *** | −1.373 | −9.847 | *** | 0.112 | |||
| NR COVID | −5.994 | *** | −1.582 | 0.216 | *** | −1.042 | −9.898 | *** | 0.122 | * | ||
| SR COVID | −2.477 | −2.477 | 0.175 | ** | −10.313 | *** | −10.400 | *** | 0.119 | * | ||
| ER COVID | −4.453 | *** | −1.922 | 0.229 | *** | −2.381 | −17.921 | *** | 0.111 | |||
| NER COVID | −2.686 | −2.807 | 0.088 | −5.720 | *** | −5.673 | *** | 0.106 | ||||
Note: All the unit root tests include both a constant and a linear trend. ***, **, and * denote significance at 1%, 5%, and 10% levels, respectively.
Table 5.
Serial correlation and heteroskedasticity tests.
| Model | BG F-stat. | BPG F-stat. | |
|---|---|---|---|
| All India | 0.632 | 1.203 | |
| NR | 0.205 | 1.217 | |
| WR | 1.691 | 5.418 | *** |
| SR | 0.317 | 0.994 | |
| ER | 0.463 | 0.991 | |
| NER | 1.877 | 1.893 |
Note: *** denotes significance at the 1% level.
Table 6.
Autoregressive distributed lag (ARDL) estimations.
| Variables | All India | Variables | NR | ||||
| Coef. | t-stat | Coef. | t-stat | ||||
| Intercept | 7.33 | *** | 3.16 | Intercept | 10.95 | *** | 2.98 |
| Energy cons.(−1) | 0.80 | *** | 5.64 | Energy cons.(−1) | 0.58 | *** | 9.38 |
| Energy cons.(−2) | −0.28 | ** | −2.42 | COVID | 0.08 | *** | 3.69 |
| COVID | 0.03 | ** | 2.55 | NIFTY50 | −0.68 | −1.03 | |
| NIFTY50 | −0.93 | *** | −2.85 | NIFTY Oil&Gas | 0.07 | 0.06 | |
| NIFTY Oil&Gas | −0.44 | −0.70 | NIFTY Energy | −0.77 | −0.52 | ||
| NIFTY Energy | 0.45 | 0.58 | NIFTY Auto | 0.47 | 1.47 | ||
| NIFTY Auto | 0.49 | *** | 2.70 | ||||
| Variables | WR | Variables | SR | ||||
| Coef. | t-stat | Coef. | t-stat | ||||
| Intercept | 5.34 | *** | 3.59 | Intercept | 5.66 | *** | 4.37 |
| Energy cons.(−1) | 0.91 | *** | 8.21 | Energy cons.(−1) | 0.84 | *** | 11.89 |
| Energy cons.(−2) | −0.01 | −0.06 | Energy cons.(−2) | −0.43 | *** | −5.90 | |
| Energy cons.(−3) | −0.25 | *** | −4.93 | COVID | 0.07 | * | 1.84 |
| COVID | 0.02 | *** | 3.18 | COVID(−1) | −0.06 | * | −2.01 |
| NIFTY50 | −0.42 | −0.91 | NIFTY50 | −1.05 | ** | −2.62 | |
| NIFTY Oil&Gas | −0.48 | −0.75 | NIFTY Oil&Gas | −1.26 | ** | −2.26 | |
| NIFTY Energy | 0.53 | 0.54 | NIFTY Energy | 1.39 | *** | 2.85 | |
| NIFTY Auto | −0.04 | −0.21 | NIFTY Auto | 0.62 | ** | 2.18 | |
| Variables | ER | Variables | NER | ||||
| Coef. | t-stat | Coef. | t-stat | ||||
| Intercept | 4.27 | 1.19 | Intercept | −4.13 | −0.66 | ||
| Energy cons.(−1) | 0.95 | *** | 7.06 | Energy cons.(−1) | 0.79 | *** | 9.04 |
| Energy cons.(−2) | −0.51 | ** | −2.49 | COVID | 0.01 | 0.50 | |
| Energy cons.(−3) | 0.30 | *** | 4.60 | NIFTY50 | 0.50 | 0.52 | |
| COVID | 0.18 | *** | 5.61 | NIFTY Oil&Gas | −0.64 | −0.30 | |
| COVID(−1) | −0.19 | *** | −4.25 | NIFTY Energy | 0.70 | 0.30 | |
| NIFTY50 | −1.14 | −1.44 | NIFTY Auto | −0.12 | −0.26 | ||
| NIFTY Oil&Gas | 2.07 | 1.41 | |||||
| NIFTY Energy | −2.06 | −1.19 | |||||
| NIFTY Auto | 1.15 | *** | 2.73 | ||||
Note: ***, **, and * denote significance at 1%, 5%, and 10% levels, respectively.
Table 7.
Bounds F-test for cointegration.
| Models | F-Stat. | |
|---|---|---|
| India | 7.09 | *** |
| NR | 4.87 | ** |
| WR | 9.19 | *** |
| SR | 9.82 | *** |
| ER | 1.92 | |
| NER | 1.80 | |
Note: *** and ** denote rejection of the null hypothesis of no cointegration (I (1)) at the 1% and 5% levels, respectively. The 1% and 5% lower bound (I (0)) critical values are 4.94 and 3.62, and those of the upper bound (I(1))critical values are 5.58 and 4.16, respectively.
Table 8.
Long-run coefficients estimation.
| Models | Variables | Coef. | t-Value | |
|---|---|---|---|---|
| India | Intercept | 15.161 | *** | 3.793 |
| COVID | 0.055 | *** | 3.095 | |
| NR | Intercept | 25.992 | *** | 2.785 |
| COVID | 0.189 | *** | 4.036 | |
| WR | Intercept | 15.177 | *** | 2.868 |
| COVID | 0.066 | ** | 2.556 | |
| SR | Intercept | 9.473 | *** | 3.643 |
| COVID | 0.004 | 0.134 | ||
| ER | Intercept | 16.312 | 0.288 | |
| COVID | −0.057 | 0.385 | ||
| NER | Intercept | −19.918 | −0.652 | |
| COVID | 0.031 | 0.543 | ||
Note: *** and ** denote significance at the 1% and 5% levels, respectively.
Table 9.
Conditional error correction ARDL estimations.
| Variables | All India | NR | WR | ||||||
|---|---|---|---|---|---|---|---|---|---|
| Coef. | t-stat | Coef. | t-stat | Coef. | t-stat | ||||
| Intercept | 7.331 | *** | 3.151 | 10.949 | ** | 2.442 | 5.343 | ** | 2.470 |
| Energy cons.(−1) | −0.484 | *** | −4.571 | −0.421 | *** | −3.681 | −0.352 | *** | −5.231 |
| COVID | 0.027 | ** | 2.346 | 0.080 | *** | 2.846 | 0.023 | ** | 2.621 |
| ΔEnergy cons.(−1) | 0.280 | ** | 2.283 | na | 0.258 | ** | 2.437 | ||
| ΔEnergy cons.(−2) | na | na | 0.249 | ** | 2.338 | ||||
| NIFTY50 | −0.931 | ** | −2.238 | −0.682 | −0.876 | −0.423 | −1.167 | ||
| NIFTY Oil&Gas | −0.438 | −0.654 | 0.069 | 0.055 | −0.481 | −0.759 | |||
| NIFTY Energy | 0.447 | 0.550 | −0.766 | −0.481 | 0.534 | 0.680 | |||
| NIFTY Auto | 0.487 | ** | 2.268 | 0.473 | 1.185 | −0.036 | −0.221 | ||
Note: *** and ** denote significance at 1% and 5% levels, respectively.
© 2020 by the authors. Licensee MDPI, Basel, Switzerland. This article is an open access article distributed under the terms and conditions of the Creative Commons Attribution (CC BY) license (http://creativecommons.org/licenses/by/4.0/).
Share and Cite
MDPI and ACS Style
Aruga, K.; Islam, M.M.; Jannat, A. Effects of COVID-19 on Indian Energy Consumption. Sustainability 2020, 12, 5616. https://0-doi-org.brum.beds.ac.uk/10.3390/su12145616
AMA Style
Aruga K, Islam MM, Jannat A. Effects of COVID-19 on Indian Energy Consumption. Sustainability. 2020; 12(14):5616. https://0-doi-org.brum.beds.ac.uk/10.3390/su12145616
Chicago/Turabian StyleAruga, Kentaka, Md. Monirul Islam, and Arifa Jannat. 2020. "Effects of COVID-19 on Indian Energy Consumption" Sustainability 12, no. 14: 5616. https://0-doi-org.brum.beds.ac.uk/10.3390/su12145616
Note that from the first issue of 2016, this journal uses article numbers instead of page numbers. See further details here.