Article

Assessing Polyphenol Components and Antioxidant Activity during Fermented Assam Tea Ball Processing

by
Pimpinan Somsong
1,2,
Chalat Santivarangkna
3,
Pimsiri Tiyayon
1,
Chi-Ming Hsieh
4,* and
Warangkana Srichamnong
3,*
1
School of Agricultural Resources, Chulalongkorn University, Bangkok 10330, Thailand
2
Emerging Process for Food Functionality Design Research Unit, Chulalongkorn University, Bangkok 10330, Thailand
3
Institute of Nutrition, Mahidol University, Salaya, Nakhon Pathom 73170, Thailand
4
International Bachelor Program of Agribusiness, National Chung Hsing University, Taichung 402, Taiwan
*
Authors to whom correspondence should be addressed.
Sustainability 2020, 12(14), 5853; https://0-doi-org.brum.beds.ac.uk/10.3390/su12145853
Submission received: 9 June 2020 / Revised: 4 July 2020 / Accepted: 13 July 2020 / Published: 21 July 2020

Abstract

:
Fermented tea is traditionally consumed in many Asian countries. In Thailand, the product is made by anaerobic submerged fermentation of semi-mature tea leaves before being made into a ball form. This study aims to investigate the composition of health-associated bioactive compounds in fermented tea balls made from Camellia sinensis var. assamica, which is naturally grown in the forests of northern Thailand. The processing involves steaming semi-mature tea leaves followed by anaerobic fermentation in 2% NaCl solution (1:5 w/v of tea leaves solution). Levels of catechin (C), epicatechin (EC), epicatechin gallate (ECG), epigallocatechin gallate (EGCG), gallocatechin (GC), flavonols (myricetin, quercetin, and kaempferol), phenolic acids (caffeic acid, chlorogenic acid, coumaric acid, and sinapic acid), total phenolic content, and in vitro antioxidant activity were evaluated in fresh tea leaves, steamed tea leaves, and fermented tea leaves over a period of 60 days’ monitoring. The results indicated that fermented tea balls still contain significant amounts of tea polyphenols, although their processing may result in some loss of most bioactive compounds. The antioxidant activity measured by Ferric Reducing Antioxidant Power (FRAP), 2,2-diphenyl-1-picrylhydrazyl (DPPH), and Oxygen Radical Absorbance Capacity (ORAC) assays also declined as the fermentation time was extended. However, phenolic acids, including caffeic acid and sinapic acid, contrastingly increased during prolonged fermentation by 74.35% and 171.43% from fresh leaves, respectively.

1. Introduction

Assam tea, belonging to Camellia sinensis var. assamica, is one of the major tea varieties produced in many parts of the world. Due to its ability to grow in humid and warm areas, Assam tea is distributed in India, Southern China, and many Southeast Asian countries, including Myanmar, Laos, Vietnam, and Thailand [1]. In northern Thailand, Assam tea is grown as part of a forest, which can be recognized as an agroforestry system. Unlike practice in the tea industry, the tea in those areas is allowed to grow naturally without the use of chemicals or other agricultural practices, such as pruning or soil tillage. The tea tree has become an integral part of community life in that its semi-mature leaves, instead of its tea shoots, are used to make fermented tea balls, locally called “Miang”, and serve as refreshments for consumption during working hours or when welcoming guests into households. The local people of northern Thailand would nib a bite of Miang and chew until its flavor becomes plain. It is also socioeconomically important, as some local villagers run small household industries for fermented tea and hire people from the neighborhood to work.
The processing of fermented tea involves steaming semi-mature tea leaves followed by anaerobically submerged fermentation in a big tank filled with NaCl solution. The addition of NaCl solution is considered a traditional method for fermented tea production in this area of study, as it keeps unwanted bacteria from propagating and adds flavor to the product. The fermentation time can range from approximately two weeks up to several years. The final product has the unique flavor of tea blended with an acidic taste. The main strains of microbes that isolate from the leaves and are characterized are mostly in the Lactobacillus genus [2,3,4]. Similar fermented tea products can also be found in other countries, such as Laos (Miang), Myanmar (Lahpet), China (Yancha), and Japan (Goishi-cha and Awaban-cha), where it is eaten as an ingredient in food or salad or is brewed as a drink [3,5,6].
Tea leaves are known to contain health-promoting components, which include alkaloids, polyphenols, amino acids, polysaccharides, volatiles, vitamins, lipids, and mineral elements [7,8]. They are well known for being antimicrobial, antiaging, and antioxidant; for lowering blood cholesterol levels; for reducing cardiovascular risk; and for reducing risk of cancers—properties that they owe to their polyphenol components [9,10]. The predominant polyphenols in tea leaves are catechins, which include epigallocatechin gallate (EGCG), epigallocatechin (EGC), epicatechin gallate (ECG), gallocatechin (GC), and epicatechin (EC) [11,12,13,14,15]. Other polyphenols, such as flavonols, including quercetin, kaempferol, and myricetin, as well as their glycosides, are also found in leaves, flowers, and tea products but in lesser amounts than catechins [15,16]. However, these polyphenols can vary greatly according to the manufacturing process. For example, green tea generally contains higher amounts of catechins, especially EGCG, than black tea because of the polymerization and enzymatic oxidation of catechins into theaflavins, thearubigin, and theabrownin [17]. A post-fermented Pu-erh tea contains lower amounts of catechins than other types of tea, but new compounds, such as 8-C N-ethyl-2-pyrrolidinone, are reportedly formed [18].
Unlike other tea products, fermented tea leaves obtained by submerged fermentation are not yet popular. In addition, the reports on anaerobically submerged fermentation of semi-mature tea leaves are still limited. However, they are of interest due to their potential as sources of bioactive compounds, along with the benefits of the conservation of local wisdom and the sustainability of the surrounding environment. Therefore, we aim to investigate the composition of health-associated bioactive compounds in a fermented tea product that was made in a controlled environment. This paper presents the levels of total phenolic and antioxidant activity as well as polyphenol components (including catechins, flavonols, and phenolic acids) that existed during a fermentation period of 60 days.

2. Materials and Methods

2.1. Chemicals and Reagents

The standards were of High Performance Liquid Chromatography (HPLC) grade; (+)-catechin (≥99%), (-)-epicatechin (≥98%), (-)-epicatechin gallate (≥98%), (-)-epigallocatechin gallate (≥97%), (-)-gallocatechin (≥98%), caffeic acid (≥98%), chlorogenic acid (≥95%), p-coumaric acid (≥98%), sinapic acid (≥98%), myricetin (≥96%), quercetin (≥95%), kaempferol (≥97%), and 6-hydroxy-2,5,7,8-tetramethylchroman-2-carboxylic acid (Trolox) were purchased from Sigma-Aldrich/Merck. Gallic acid (certified reference material, TraceCERT®) was purchased from Fluka Analytical. 2,4,6-tris(2-pyridyl)-s-triazine (TPTZ, ≥98%), and Folin–Ciocalteu’s phenol reagent (2N) and 2,2-diphenyl-1-picrylhydrazyl (DPPH) were purchased from Sigma-Aldrich/Merck. 2,2′-Azobis (2-methylpropionamidine) dihydrochloride (AAPH, 98%) was purchased from Acros OrganicTM, Thermo Fisher Scientific. Fluorescein sodium salt (Indicator, 98.5–100.5%) was purchased from Honeywell Fluka. Formic acid and acetonitrile (HPLC grade) were purchased from Sigma-Aldrich/Merck. All other chemicals and reagents not mentioned were of analytical grade.

2.2. Sample Collection

Assam tea shoots and leaves in the semi-mature stage were handpicked from a mountainous area (elevation up to 1000 m asl) of Sakard Tai village, Nan, Thailand. The sample was collected during June 2018, which was during the rainy season, with an average temperature range of approximately 22–30 °C. The leaves were kept in a plastic bag and transported to the laboratory in an ice cooler box. Leaves damaged by ice burn were sorted out; only the shoots and leaves in good condition were then freeze-dried or fermented for further analysis.

2.3. Fermentation of Tea Leaves

Prior to fermentation, semi-mature tea leaves were placed in a steaming pot in a bundle form (each bundle contained 50 leaves) to simulate traditional processing. They were then steamed under water vapor at 100–105 °C for 30 min. The NaCl solution (2%) was added to the steamed sample that was left to cool to room temperature at a ratio 1:5 (w/v) and fermented in a sealed, sterile glass jar under a controlled temperature at 25 °C. The fermentation was performed in triplicate. The sample was anaerobically fermented for 60 days, based on economic reasons and consumer taste. The fermented sample was freeze-dried before further analysis.

2.4. Extraction of Phenolic Compounds

One gram of freeze-dried powder sample was extracted in 25 mL of 25% ethanol using an ultrasonicator (Vibra cell TM Ultrasonic Liquid Processor, Sonics & Materials, Inc.) at an energy output of 15,000 J. The temperature was controlled at under 40 °C throughout the experiment. The sample was then centrifuged (Sigma 3–18 KS, Sigma, Germany) at 10,000 rpm, 15 °C for 10 min. The supernatant was collected, and the remaining residue was extracted twice until reaching a total extract volume of 75 mL. The extract was filtered through a 0.45 µm nylon syringe filter (Whatman, Inc.) before the subsequent total phenolic content antioxidant activity analyses.

2.5. Determination of Total Phenolic Content

Total phenolic content (TPC) was determined using the Folin–Ciocalteu method [19] with some modifications. Twenty microliters of the extract were mixed with 1/10 diluted Folin–Ciocalteu solution (160 µL). After 3 min, 20 µL of 7.5% (w/v) Na2CO3 was added. The mixture was allowed to incubate at room temperature for 2 h before measuring the absorbance at 765 nm using a microplate reader (FLUOstar Omega, BMG Labtech, Germany). Gallic acid was used to establish a standard curve, and the results were calculated using the following equation and were reported in terms of milligram gallic acid equivalent per gram dry sample weight (mg GAE/g DW).
C = c * v/m
where C is total phenolic content (mg GAE/g), c is the concentration of gallic acid obtained from a calibration curve (mg/mL), v is the volume of extract (mL), and m is the mass of the extract (g).

2.6. Determination of Antioxidant Activity

Antioxidant activity (AA) was determined by three methods, using Trolox as a standard. Ferric Reducing Antioxidant Power (FRAP) assay was done using a method modified from Benzie et al. [20]. A FRAP working solution was prepared by mixing 300 mM acetate buffer (pH 3.6) with 10 mM 2,4,6-tri(2-pyridyl)-s-triazine (TPTZ) in 40 mM HCL and 20 mM FeCl3·6H20 at a ratio of 10:1:1. Then, 200 µL of the FRAP working solution was mixed with 20 µL of diluted extracts and incubated at 37 °C for 30 min. The absorbance was measured at 593 nm (FLUOstar Omega, BMG Labtech, Germany). The results were reported in terms of µmol Trolox equivalent per gram dry sample weight (µmol TE/g DW).
The 2,2-diphenyl-1-picrylhydrazyl (DPPH) radical scavenging capacity assay was performed according to Cheng et al. [21] with some modifications. The diluted extract (40 µL) was pipetted into a 96-well plate. DPPH solution was freshly prepared at a concentration of 0.2 mM in methanol and injected into each well before measuring the absorbance at 517 nm (FLUOstar Omega, BMG Labtech, Germany). The results were reported as µmol TE/g DW.
The Oxygen Radical Absorbance Capacity (ORAC) assay was modified from Huang et al. [22] by pipetting 20 µL of the extracts into a 96-well plate. The addition of 160 µL of 120 nM fluorescein, followed by 20 µL of 480 µM AAPH was done using an auto-injection system. All solutions were prepared in a phosphate-buffered saline (PBS, 75 mM, pH 7.0). A calibration curve was constructed by plotting the concentration of the Trolox standard (µM) against the area under the curve (AUC), computed by the equipment software (FLUOstar Omega, BMG Labtech, Germany). The results were reported as µmol TE/g DW.

2.7. Determination of Catechins and Phenolic Acids Content

A freeze-dried tea sample (40 mg) was extracted with 10 mL of 25% ethanol and sonicated for 15 min. It was then centrifuged at 4600 rpm, 4 °C, for 15 min. The supernatant was collected and filtered through a 0.45 µm nylon syringe filter (Whatman, Inc.) for analysis with an HPLC (Agilent technologies 1100 series) equipped with photodiode array detector and Phenomenex kinetex C18 column (250 × 4.6 mm, 5 µm). The mobile phase A was formic acid–acetonitrile (2.5:97.5 v/v). The mobile phase B was formic acid–water (2.5:97.5 v/v). The condition was 0–5 min, 5% A; 5–15 min, 5–13% A; 15–20 min, 13–30% A; 20–25 min, 30% A; 25–26 min, 30–45% A; 28–32 min, 45% A; 32–35 min, 45–90% A; 35–40 min, 90% A; 40–45 min, 90–95% A. The flow rate was 1 mL/min throughout the analysis. Catechin (C), epicatechin (EC), epicatechin gallate (ECG), epigallocatechin gallate (EGCG), and gallocatechin (GC) were quantified by comparison with the standards at 280 nm. Caffeic acid, chlorogenic acid, p-coumaric acid, and sinapic acid were quantified by comparison with the standards at 320 nm.

2.8. Determination of Tea Pigment (Theaflavins, Theabrownins, and Thearubigins)

Determination of Theaflavins (TF), Theabrownins (TB), and Thearubigins (TR) followed the method described in Yao et al. [23]. Three grams of a freeze-dried tea sample were extracted with 125 mL of 90 °C water for 10 min; centrifuged at 10,000 rpm, 15 °C for 10 min; and filtered through a 0.45 µm nylon filter (Whatman, Inc.). The tea solution (30 mL) was then mixed with 30 mL ethyl acetate for 5 min. The top layer of the ethyl acetate solution (2 mL) was increased to 25 mL with 95% ethanol (solution A). The other portion (15 mL) of the ethyl acetate layer was mixed with 2.5% (w/v) NaHCO3 (15 mL) for 30 s, and 4 mL of ethyl acetate layer was increased to 25 mL with 95% ethanol (solution C). The bottom aqueous layer (2 mL) was mixed with 6 mL water and 2 mL saturated oxalic acid, and then, it was finally increased to 25 mL with 95% ethanol (solution D). Another portion of extracted tea solution (15 mL) was mixed with butyl alcohol for 3 min. The 2 mL of aqueous layer was mixed with 2 mL saturated oxalic acid and 6 mL water and was then increased to 25 mL with 95% ethanol (solution B). The absorbance of solutions A–D was measured at 380 nm using a microplate reader (FLUOstar Omega, BMG Labtech, Germany). Calculation of TF, TB, and TR are as follows:
%TF = 2.25 × EC/ (1−M)
%TR = 7.06 × (2EA + 2ED − 2EB − EC)/(1−M)
%TB = 7.06 × 2EB/(1−M)
where E is the absorbance of their corresponding solutions and M is the moisture content.

2.9. Determination of Flavonols Content

The content of myricetin, quercetin, and kaempferol were analyzed. The extraction procedure followed the method described by Wang and Helliwell [24] with some modifications. One gram of sample was mixed with 40 mL of 60% ethanol and 30 mL of 0.1 N HCl and refluxed at 95 °C for 2 h. The sample was centrifuged at 10,000 rpm, 25 °C, for 15 min. The supernatant was collected in a 100 mL volumetric flask and increased in volume with 60% ethanol. The extract of flavonols was filtered through a nylon syringe filter, 0.45 µm (Whatman, Inc.), for the analysis with an HPLC (Varian Prostar) equipped with a photodiode array detector and Phenomenex Luna C18 column (250 × 4.6 mm, 5 um). Mobile phase A was 30% acetonitrile in 0.025 M KH2PO4, pH 2.5, and mobile phase B was 100% acetonitrile. It was run under isocratic mode with 85% A and 15% B at 1 mL/min flow rate. The result was calculated by comparison with the standards at 370 nm.

2.10. Statistical Analysis

The statistical analysis was conducted using the SPSS (version 22.0 for windows, SPSS Inc., CO, USA) program. All tests were conducted with at least 3 replications. An ANOVA test was used to determine the differences between the mean content of analyzed compounds, followed by Fisher’s least significant difference test (LSD). A statistically significant difference was declared at p < 0.05.

3. Results and Discussion

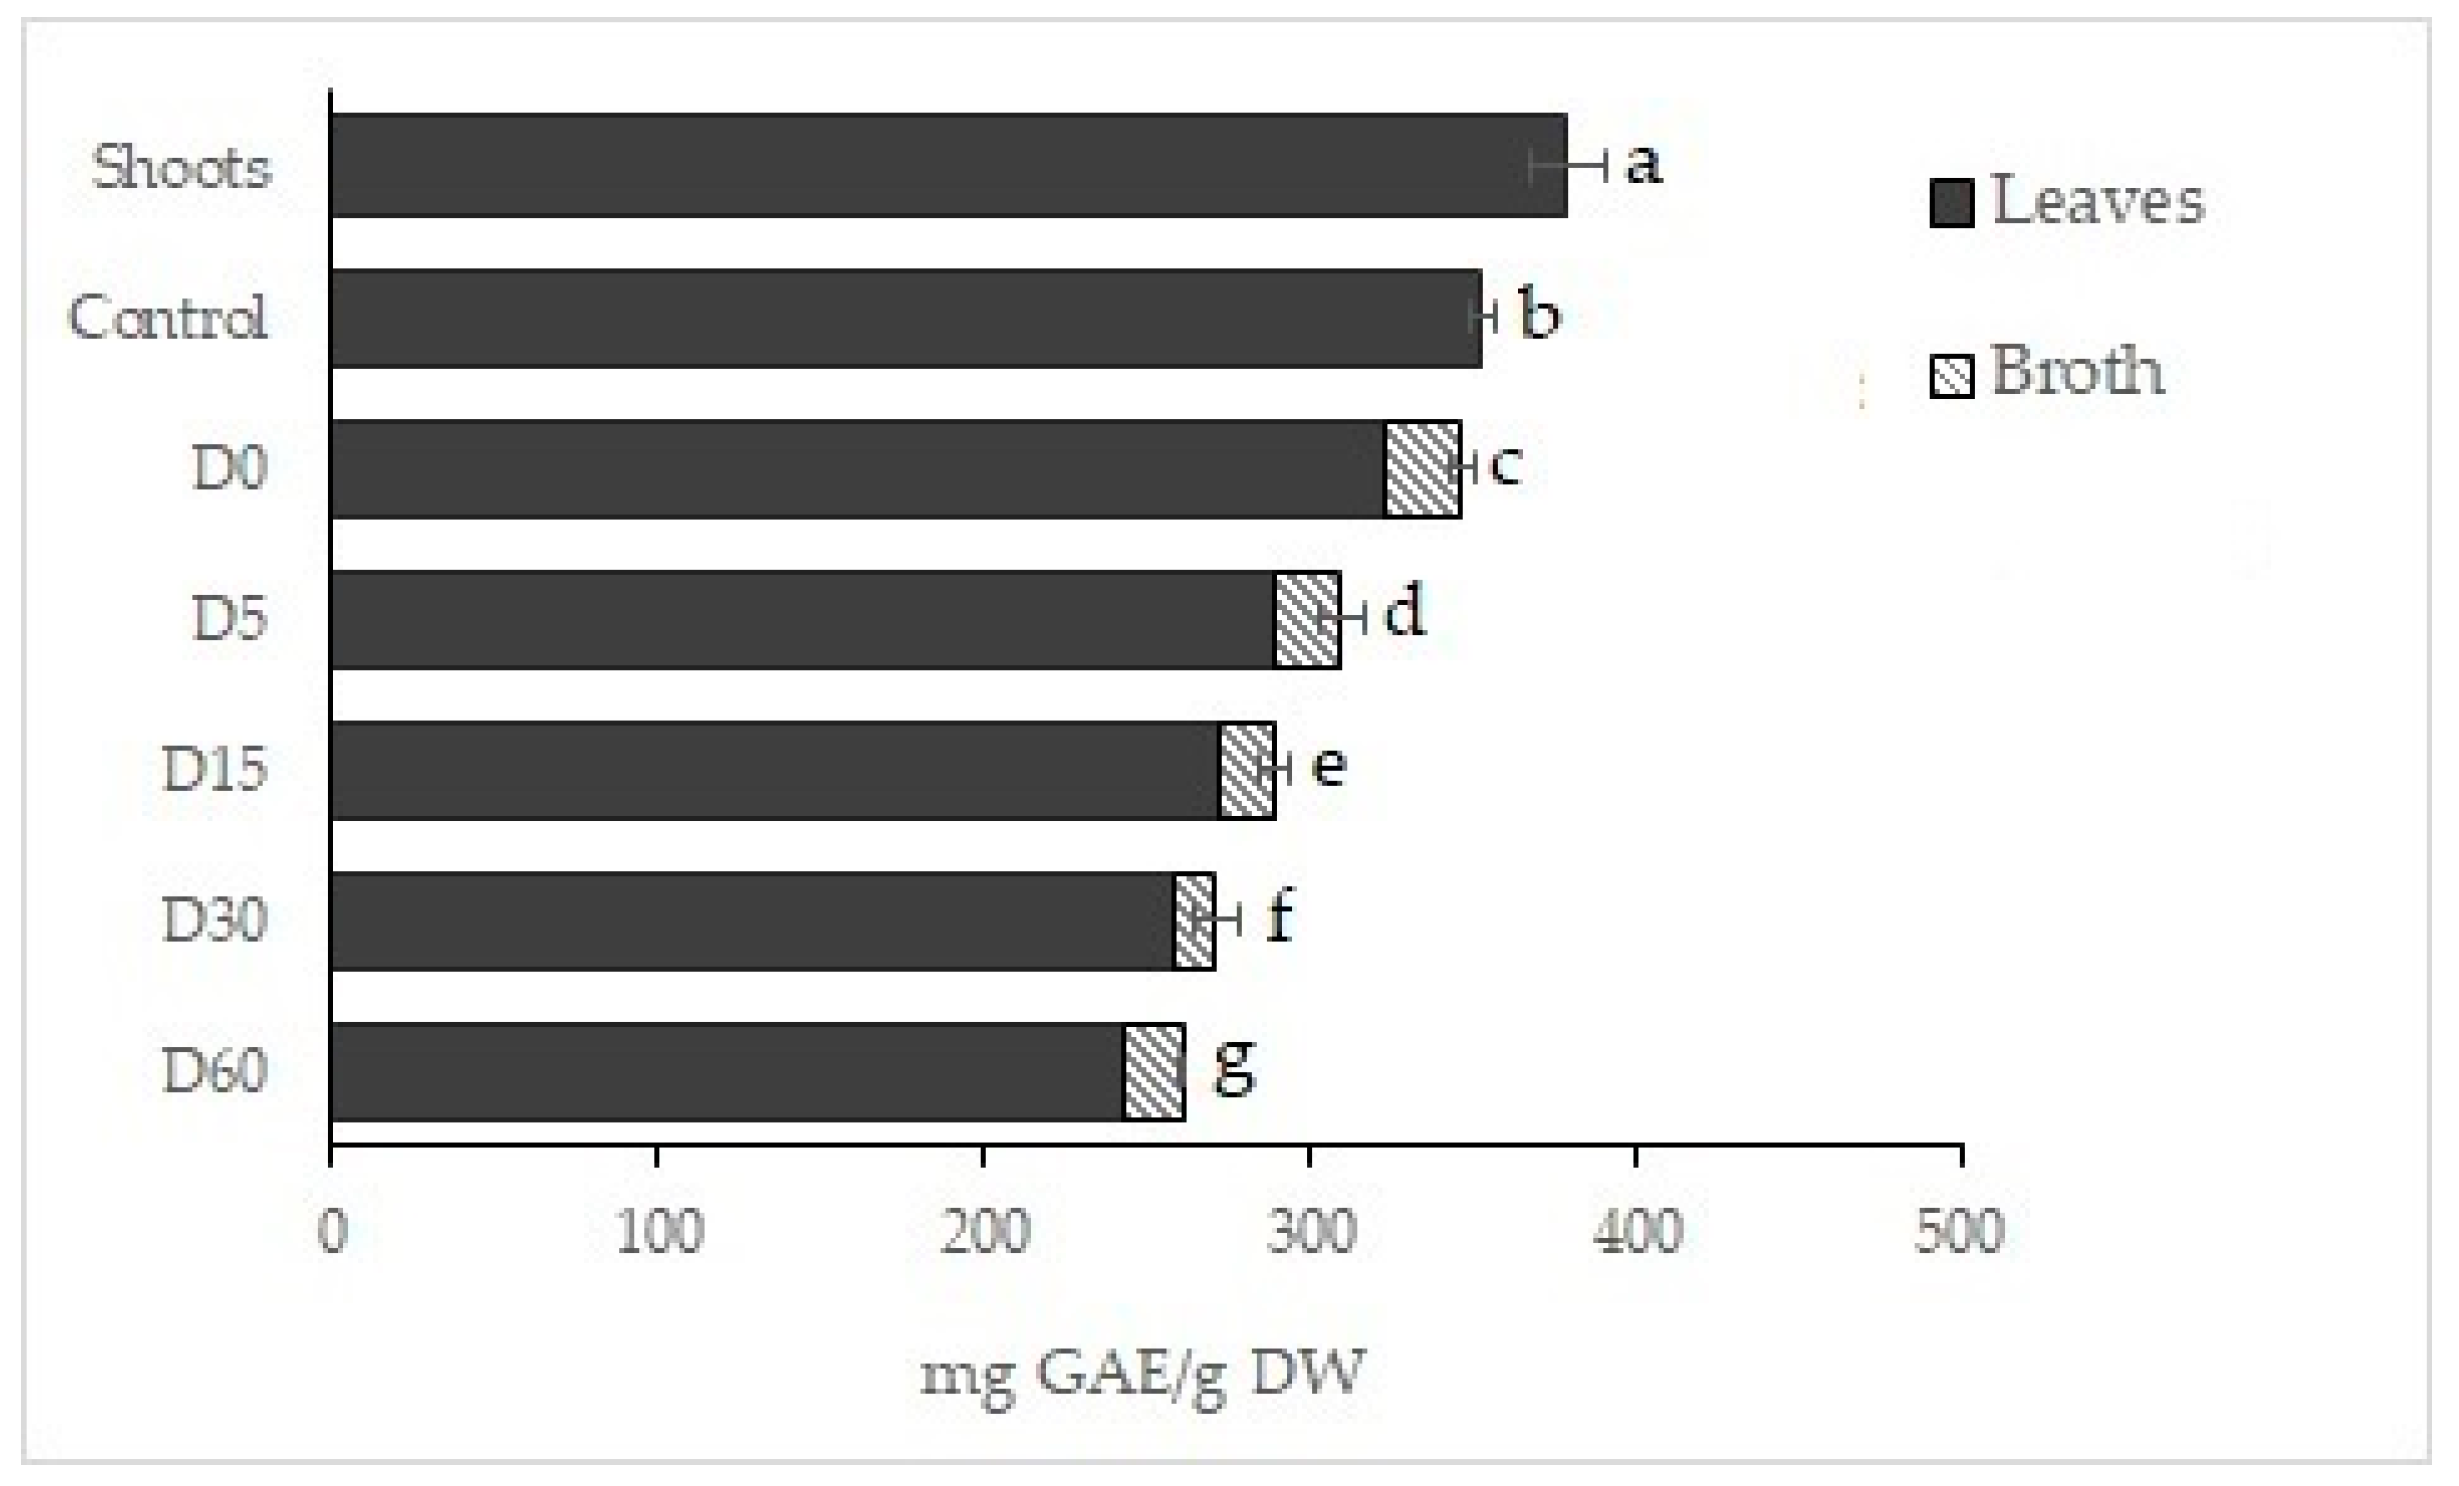
3.1. Total Phenolic Content of Fresh and Fermented Tea at Different Fermentation Period

Fermented Assam tea ball or Miang, unlike other tea products, is made from semi-mature tea leaves instead of tea shoots. As shown in Figure 1, fresh semi-mature tea leaves contained lower TPC (352.84 ± 3.52 mg GAE per g DW) than the shoots (379.01 ± 11.93 mg GAE per g DW). During the processing of semi-mature leaves, the TPC was reduced to 322.33 ± 24.16, 289.86 ± 19.75, 272.95 ± 15.81, 258.66 ± 12.74, and 242.76 ± 18.36 mg GAE per g DW at D0, D5, D15, D30, and D60, respectively. It was calculated that steaming (D0) caused a 8.6% decrease from the control and that the fermentation additionally reduced TPC by up to 24.7% from the D0. The loss during steaming could be due to the instability of phenolic compounds when exposed to heat. For example, Zeng et al. [25] reported a substantial decline in total catechins when heating at 100 °C. Furthermore, some of the phenolic compounds may leach out to the steaming and fermentation broth due to their solubility in water. A previous study reported that tea catechins can be extracted to water even under temperatures as low as 5 °C [26]. This was also shown in Figure 1—6.8% of TPC in control was lost to the steaming broth after steaming of tea leaves (D0). During fermentation, it was speculated that some of the phenolic compounds may be transformed into other compounds due to the metabolism of the microorganisms presented in the fermented environment [27]. Furthermore, the decrease in pH of the solution and disintegration of cell walls would cause extraction of some catechins into the surrounding fermentation broth [28]. TPC in broth at each stage were 24.16, 19.75, 15.81, 12.74, and 18.36 mg GAE per g DW at D0, D5, D15, D30, and D60, respectively. The fermentation broth with additional phenolic compounds can also be developed into functional products such as kombucha [29] or tea vinegar.

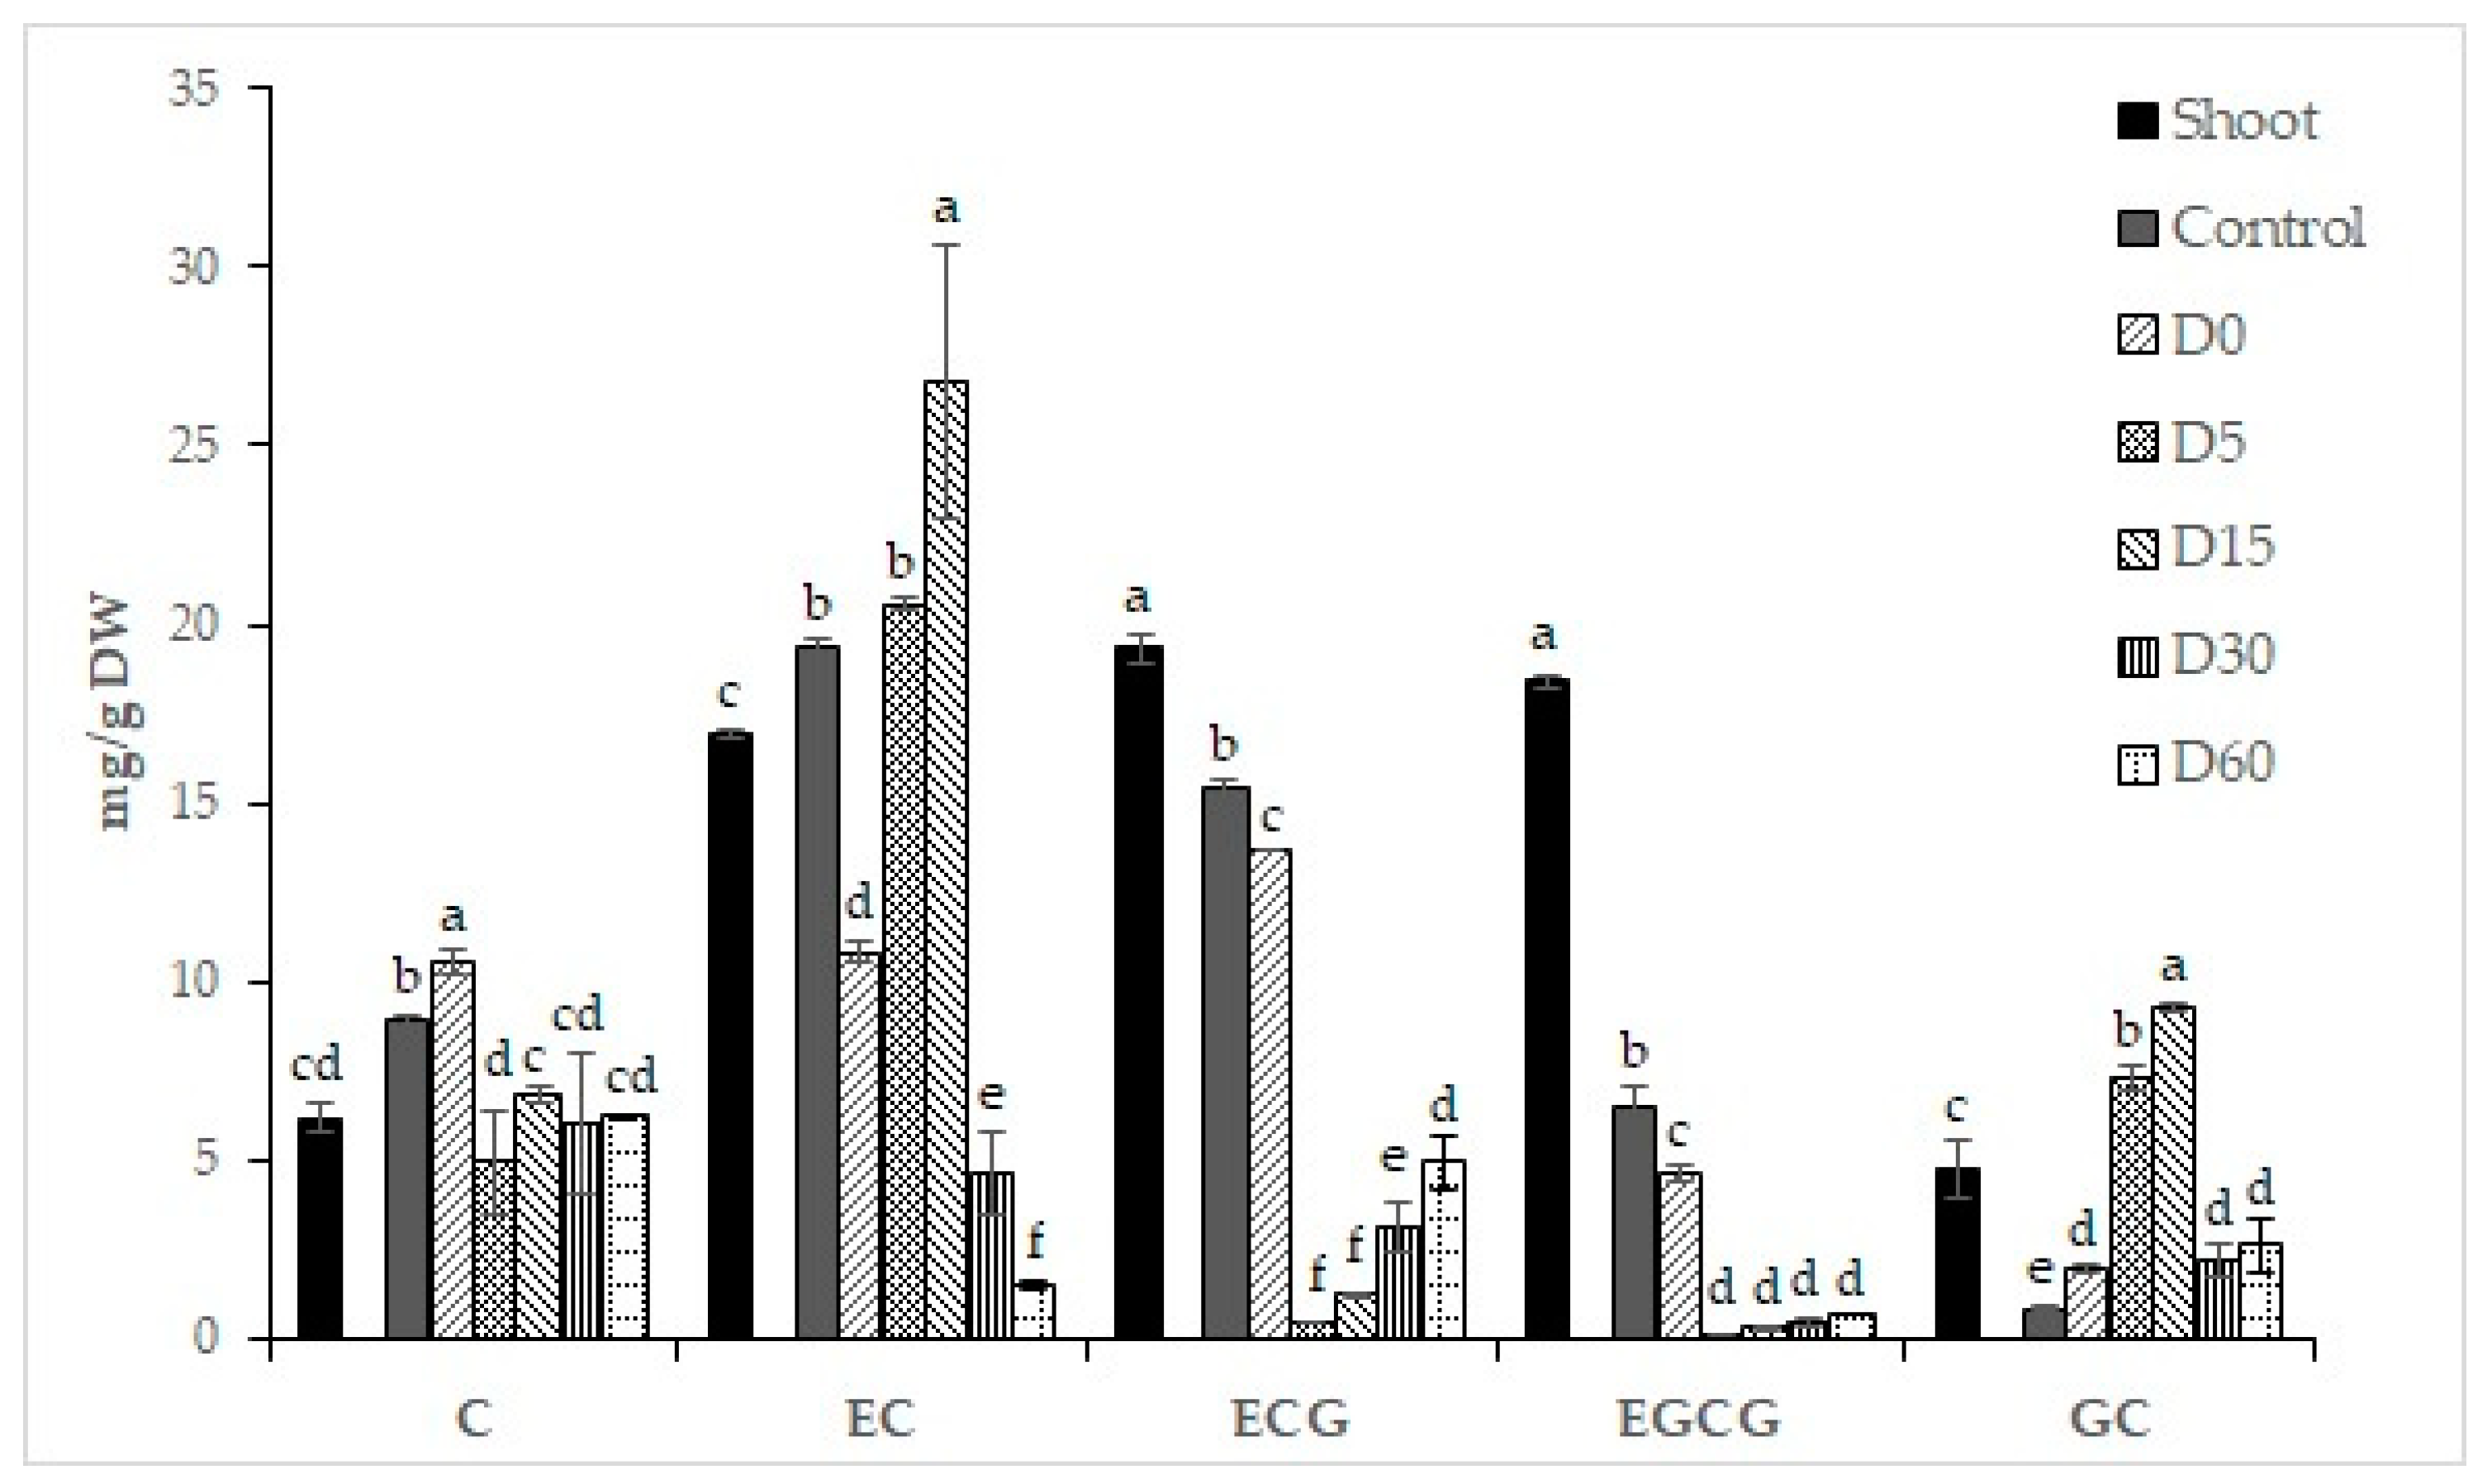
3.2. Measurement of Catechins of Fermented Tea during Fermentation Period

Catechins are regarded as characteristic polyphenols in tea. They provide many health benefits due to their free radical scavenger properties. The results of individual catechins concentration are presented in Figure 2. Fresh tea shoots contained high levels of ECG, followed by EGCG, EC, C, and GC (19.32 ± 0.43, 18.38 ± 0.17, 16.95 ± 0.11, 6.19 ± 0.44 and 4.77 ± 0.79 mg/g DW, respectively). Tea shoots in this study contained more ECG than EGCG, while previous studies generally found that EGCG was abundantly present [15,30,31]. The difference could be due to the tea variety, growing location, nutrients in the soil, or climate. Semi-mature tea leaves (control) contained higher C and EC (8.95 ± 0.11 and 19.33 ± 0.25 mg/g DW) but were lower in ECG, EGCG, and GC (15.46 ± 0.18, 6.44 ± 0.57, and 0.82 ± 0.05 mg/g DW, respectively) than the shoots.
After the steaming process (D0) of the control, the concentrations of EC, ECG, and EGCG decreased significantly to 10.83 ± 0.29 mg/g DW, 13.69 ± 0.04 mg/g DW, and 4.61 ± 0.23 mg/g DW, respectively, while the concentration of C and GC increased to 10.54 ± 0.38 mg/g DW and 2.00 ± 0.12 mg/g DW. The degradation of EC, ECG, and EGCG could come from their instability at elevated temperatures and pH [32]. Furthermore, EC, ECG, and EGCG may be partially epimerized into C and GC. Previous studies have suggested that the epi-structure catechins were epimerized into a non-epi structure when the temperature was raised above 80 °C [33,34].
The fermentation process affected the concentrations of C, ECG, and EGCG to be lower than D0; the lowest concentration was found at D5 (4.96 ± 1.44 mg/g DW, 0.42 ± 0.002 mg/g DW, and 0.16 ± 0.004 mg/g DW, respectively). In contrast, the concentration of EC and GC increased at D5 (20.57 ± 0.20 and 7.34 ± 0.33 mg/g DW) and D15 (26.78 ± 3.82 and 9.28 ± 0.12 mg/g DW) before dramatically dropping again at D30 (4.65 ± 1.16 and 2.21 ± 0.51 mg/g DW) and D60 (1.54 ± 0.14 and 2.63 ± 0.79 mg/g DW). The fluctuation of catechin levels at different fermentation times may be due to the microbial species and their metabolism, which needs further investigation. However, it can be seen that overall catechin levels were lower than the control. Degradation of catechins also generally occurred in the processing of enzymatic fermented tea such as black tea and oolong tea and microbial fermented tea such as pu-erh tea, which was suggested to be due to polymerization and oxidative cleavage of the aromatic ring in the catechins structure [27,35,36].

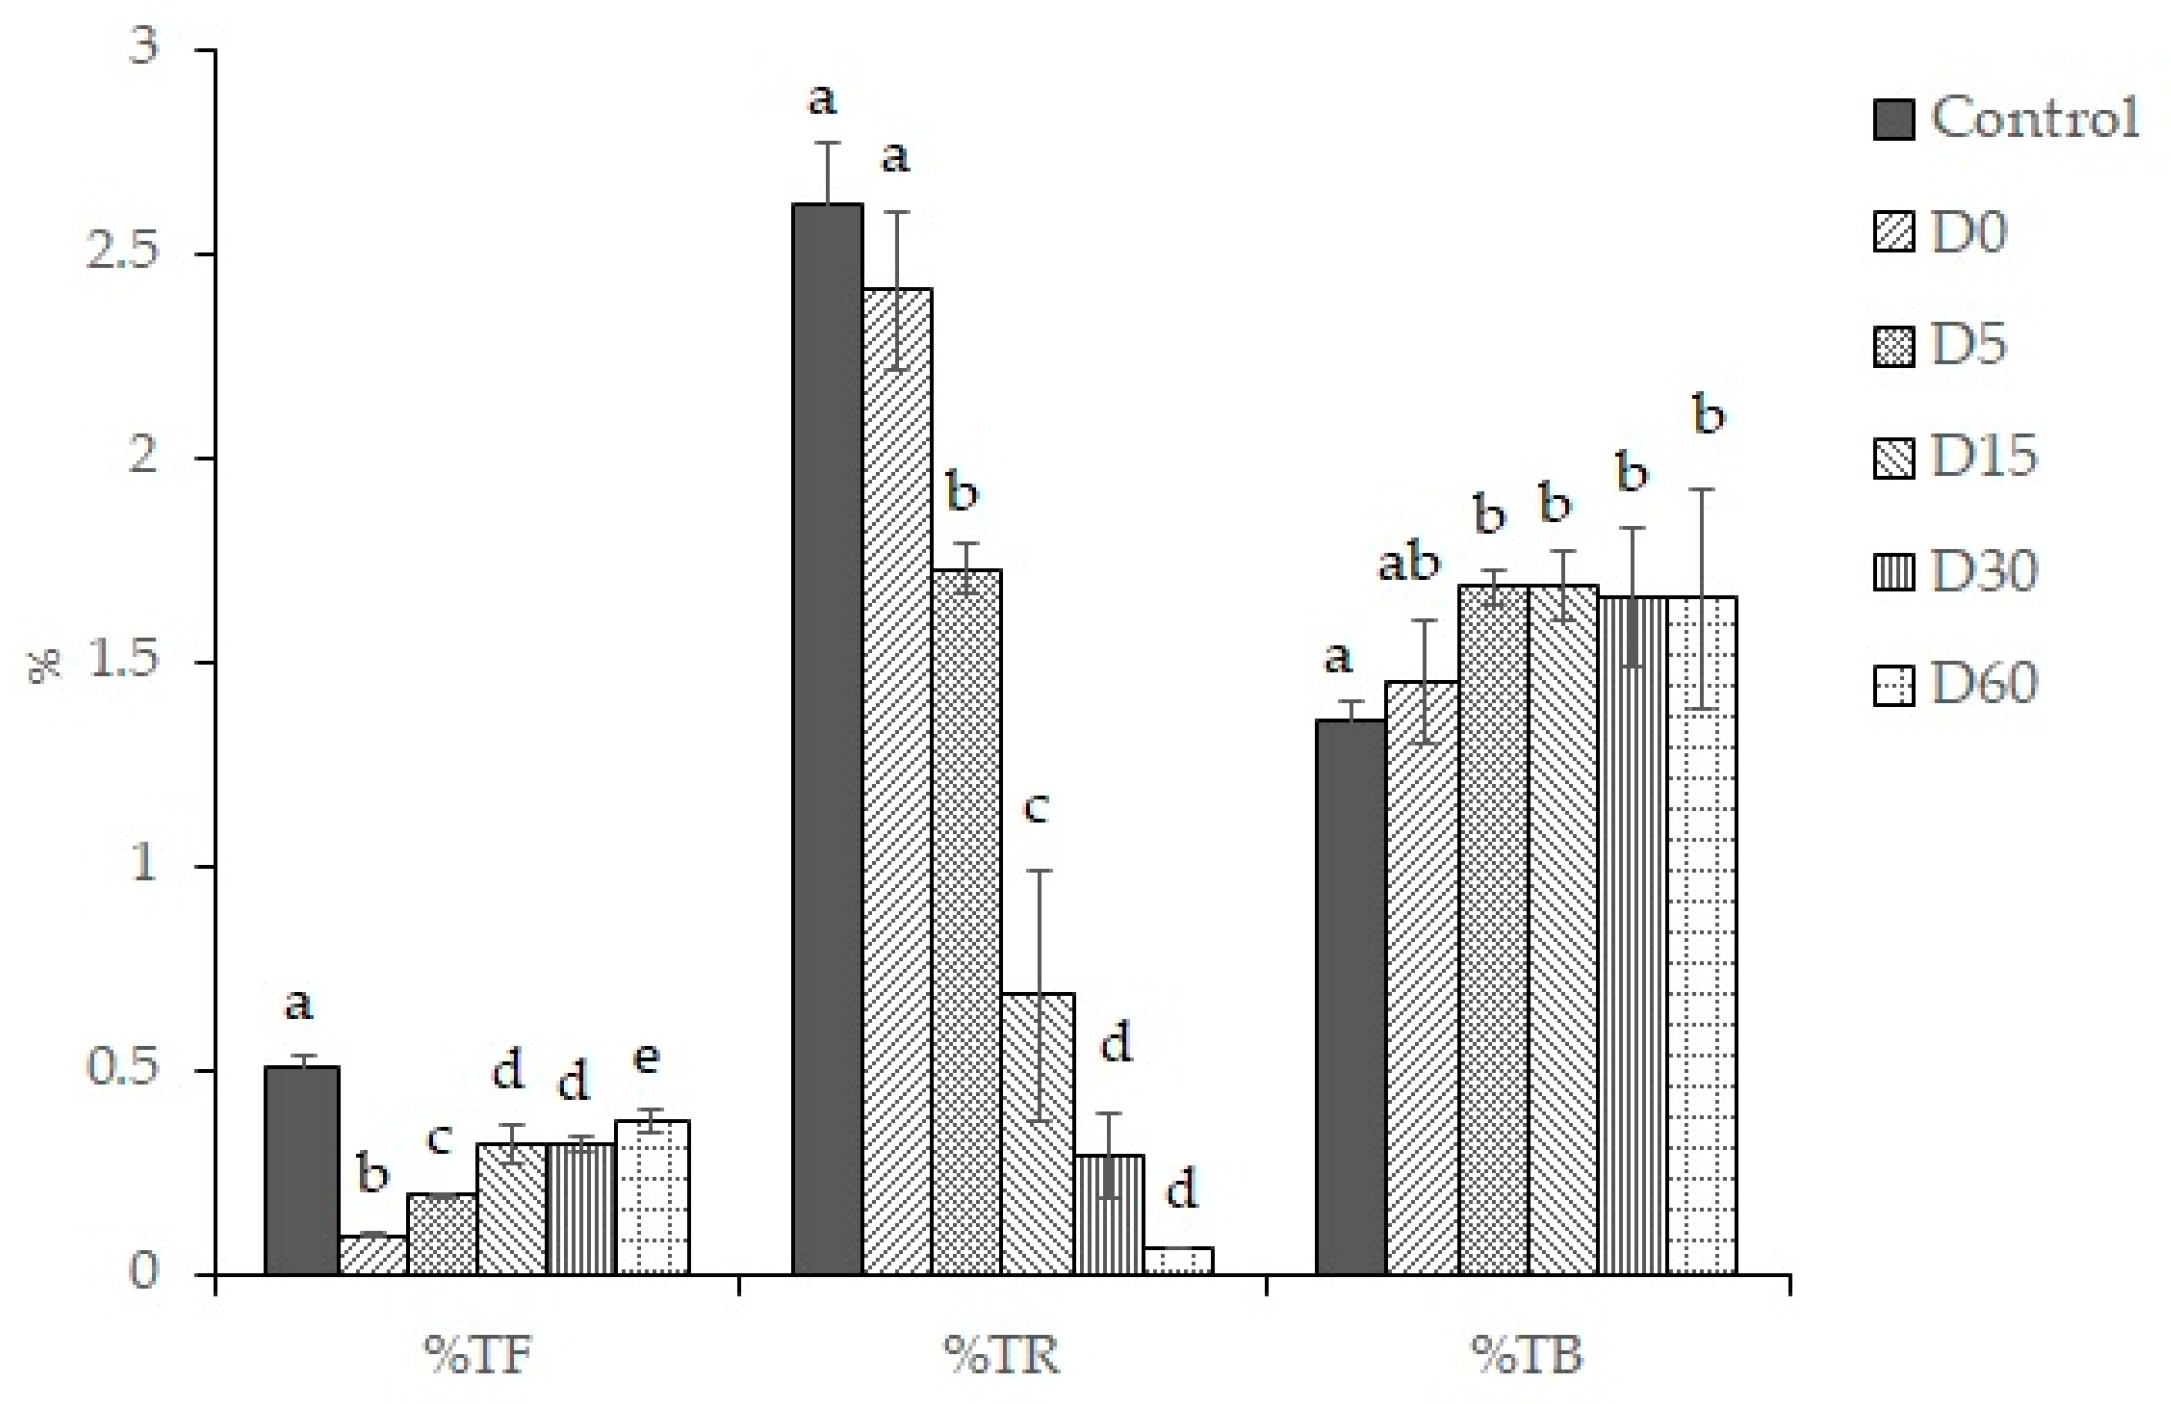
3.3. Theaflavins (TF), Thearubigins (TR), and Theabrownins (TB) Content

TF, TR, and TB are bioactive components that are produced from an enzymatic oxidation reaction of tea polyphenols. They are considered key compounds in fermented tea such as black tea. From our results, the levels of TF, TR, and TB in semi-mature leaves were 0.51%, 2.63%, and 1.36%, respectively (Figure 3). This indicated that the tea leaves may have undergone a certain level of oxidation before they were processed. After steaming (D0), the amount of TF and TR were reduced to 0.1% and 2.4%, respectively. This could have been causes by the degradation of compounds at high temperatures. Su et al. [32] also reported an absolute loss in TF after heating at 100 °C for 3 h. However, TF levels increased after fermentation to reach 0.38% at D60, although the amount remained lower than its original content in the control. Since polyphenol oxidase and peroxidase could be denatured to some extent during steaming [37], the amount of TF produced during fermentation was assumed to also derive from microbial metabolism. This amount of TF in the fermented tea ball was similar in range to what has been found in other fermented tea products. Yao et al. [23] reported that black tea from an Australian supermarket contained 0.29–1.25% TF. Similarly, Tong et al. [38] reported that black tea contained 460.73 mg/100 g (approximately 0.46%) TF while their novel fermented tea contained as high as 1109.78 mg/100 g (approximately 1.11%)
TR clearly showed a reduction trend throughout the 60 days of fermentation, which could be due to its high solubility in water. Previous studies reported that a dry weight of black tea leaves contained only 10–20% TR but that up to 60% TR was found in a black tea infusion [39,40]. The results agreed with Huang et al. [6], who also indicated the lower content of TF and TR after 30 days of pickle tea fermentation in comparison with the fresh leaves. In contrast, a slight rise in TB from 1.36% in the control to 1.66% at D60 was detected. This was similar to the study in Pu-erh tea [41], in which the level of TB increased over the fermentation time while the level of total polyphenols and TR decreased.

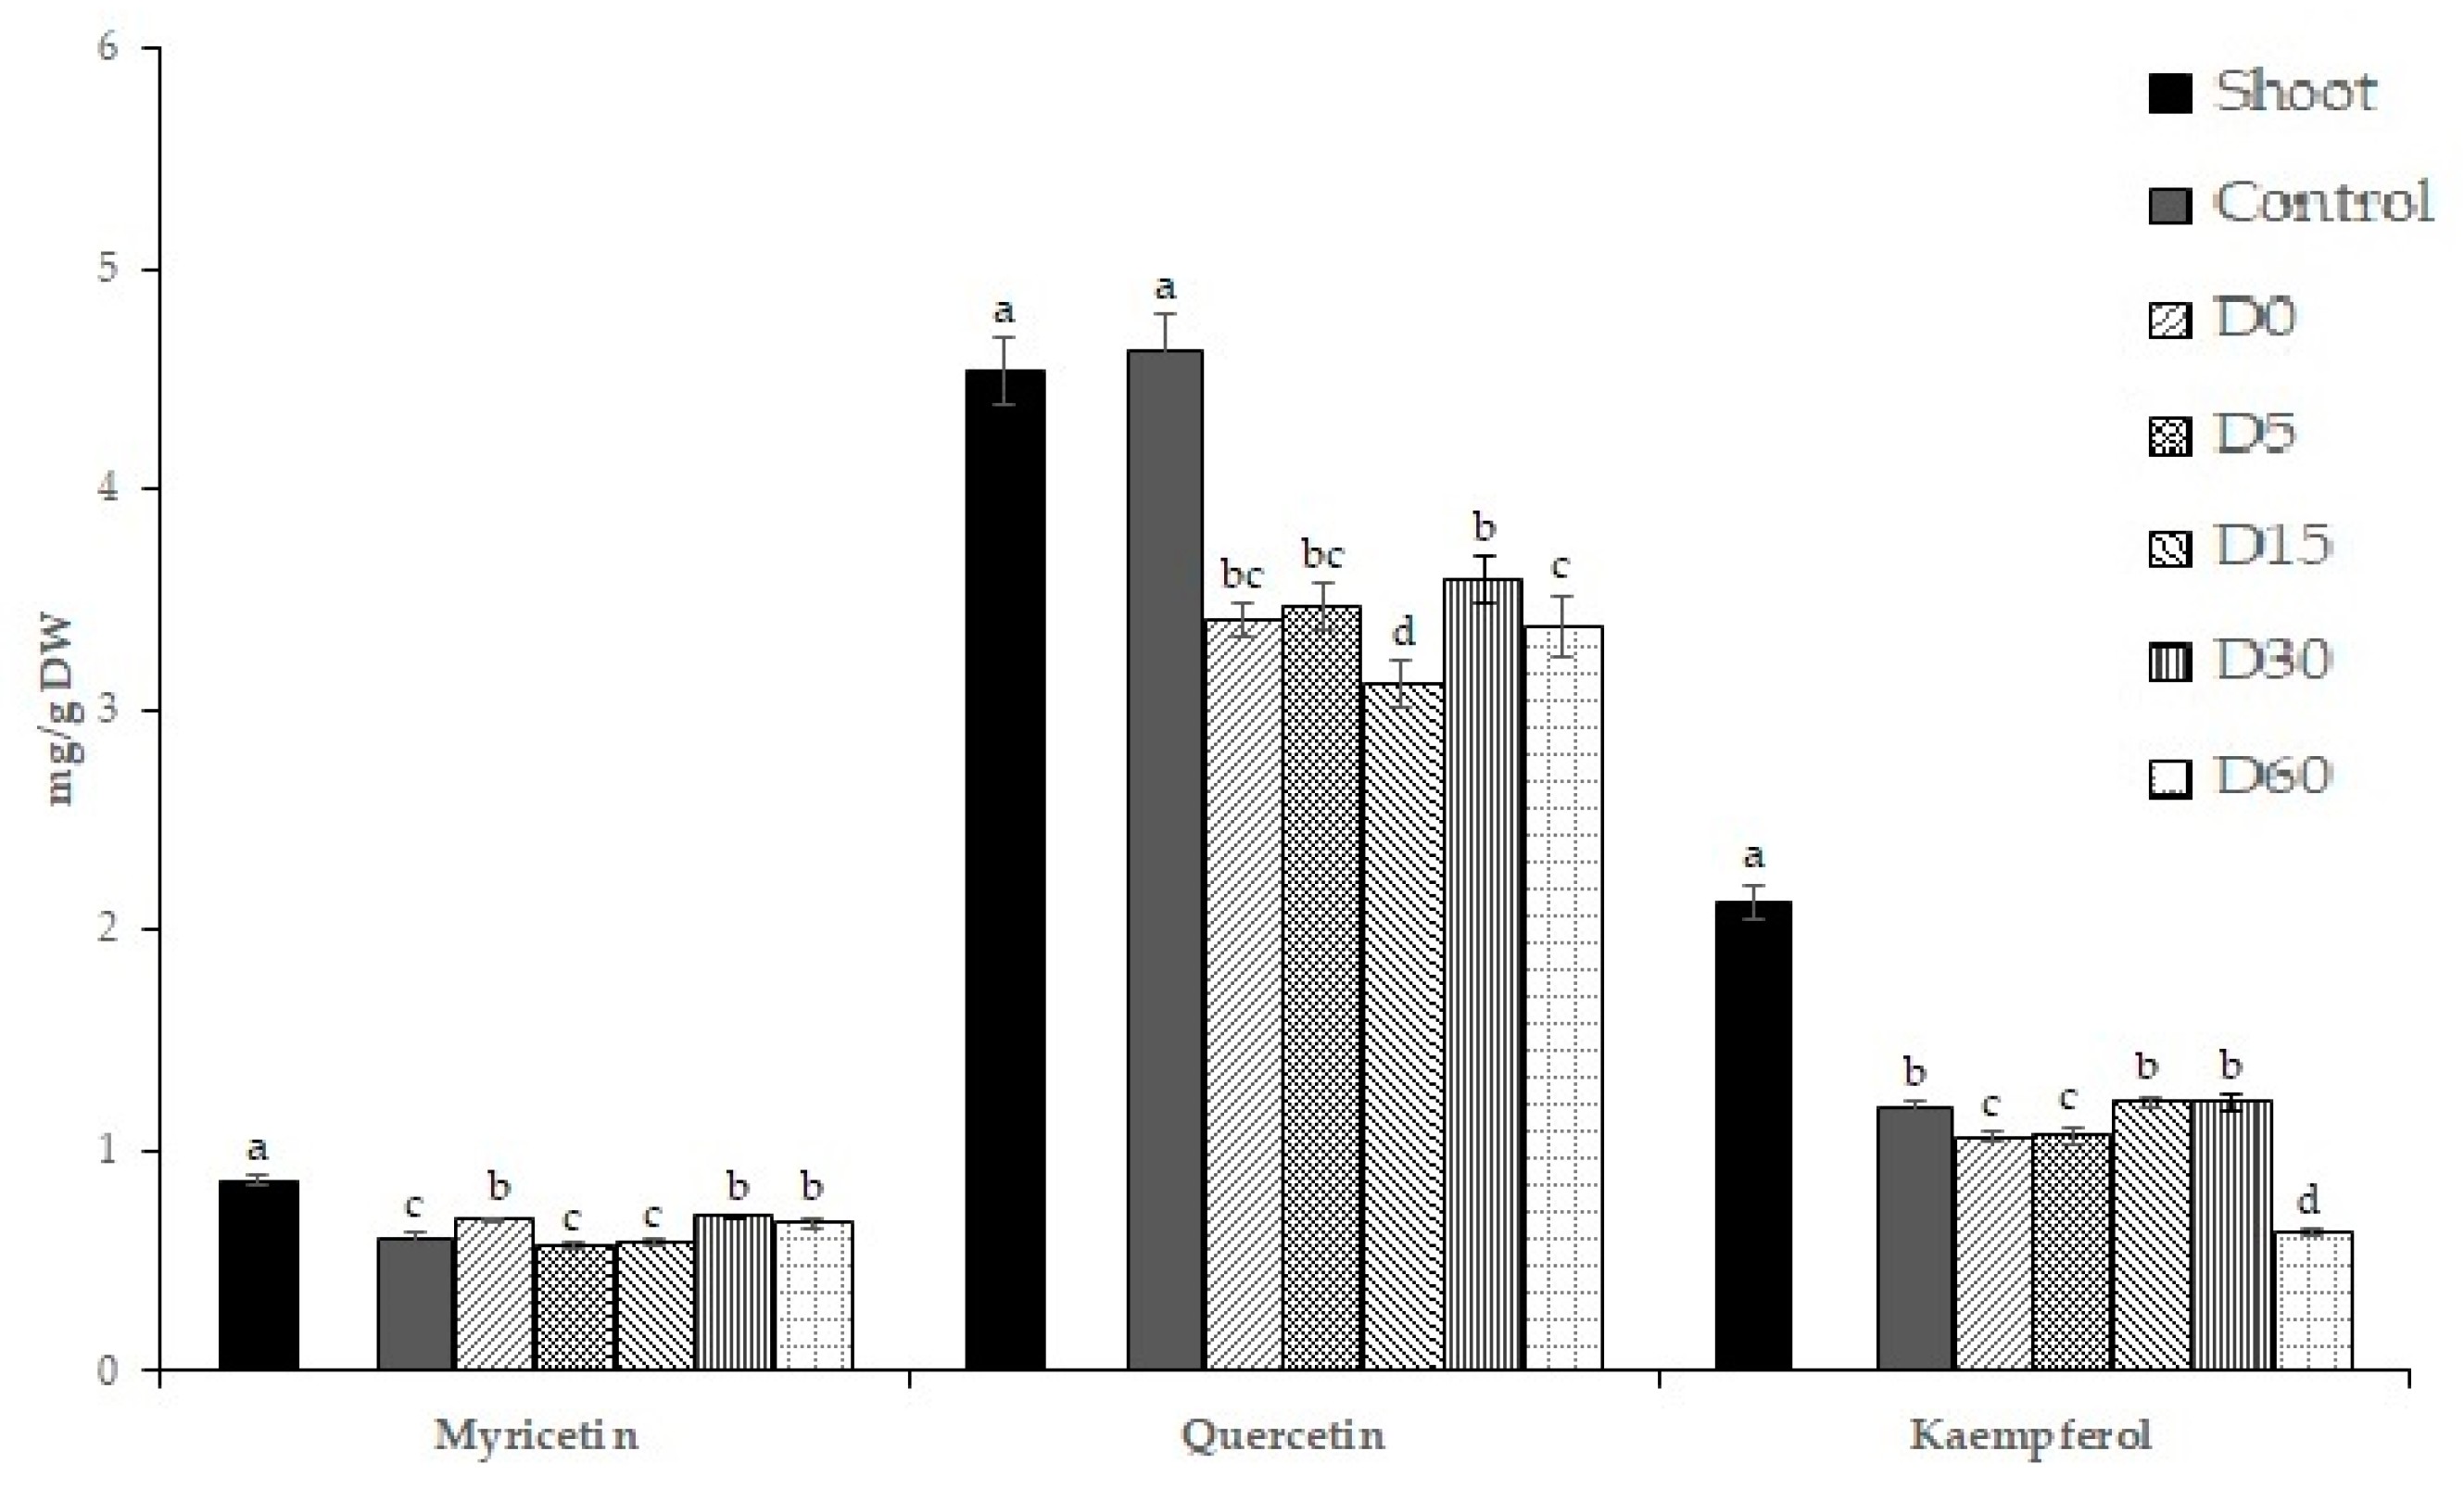
3.4. Measurement of Flavonols of Fermented Tea during Fermentation Period

Figure 4 shows the concentrations of the three main flavonol aglycones in tea, namely, quercetin, myricetin, and kaempferol, which were obtained by acid hydrolysis treatment. It was obvious that quercetin existed most abundantly in fresh tea leaves, both in tea shoots and in semi-mature stage leaves, which agreed with a previous report [15]. In addition, no significant difference in quercetin concentration was presented between shoots (4.54 ± 0.15 mg/g DW) and semi-mature stage leaves (4.62 ± 0.17 mg/g DW). The shoots did, however, contain a higher concentration of myricetin (0.86 ± 0.03 mg/g DW) and kaempferol (2.13 ± 0.08 mg/g DW) than the semi-mature leaves (0.60 ± 0.02 mg/g DW and 1.19 ± 0.03 mg/g DW, respectively).
Processing the fermented tea ball affected the level of each flavonol aglycone differently. The steaming process caused a loss of 26.4% of quercetin (from 4.62 ± 0.17 to 3.40 ± 0.08 mg/g DW) and 10.83% of kaempferol (from 1.19 ± 0.03 to 1.06 ± 0.03 mg/g DW) from the control, while the myricetin increased by 14.3% (from 0.60 ± 0.02 to 0.68 ± 0.01 mg/g DW). Fermentation caused varying results which did not show an obvious trend during the different fermentation periods. It could be due to the change in the metabolism of the microorganism in the environment, which would require further study.

3.5. Measurement of Phenolic Acids of Fermented Tea during Diferrent Fermentation Period

Phenolic acids are abundantly present within plant cytoplasm or bound to plant cell walls. The phenolic acids analyzed in this study were hydroxycinnamic acids, including caffeic acid, chlorogenic acid, p-coumaric acid, and sinapic acid (Table 1). Among the four acids, p-coumaric acid appeared in relatively lower concentrations than the other acids, to the extent that it was not detected in the control (fresh semi-mature leaves) using the current detection method, whereas caffeic acid was found in the highest amount compared to the other acids. The control contained 5.73 ± 0.24 mg/g DW of caffeic acid, 0.47 ± 0.19 mg/g DW of chlorogenic acid, and 0.28 ± 0.002 mg/g DW of sinapic acid. The level of these acids was not affected by the steaming process, which can be seen at D0. The levels of caffeic acid and of sinapic acid tended to increase through prolonged fermentation; their levels reached the highest concentration at D60 (9.99 ± 1.29 and 0.76 ± 0.17 mg/g DW, respectively), which was 1.7 and 2.7 times the control. The caffeic acid concentrations at D15, D30, and D60 were found to be comparable to fresh tea shoots, and the concentration of sinapic acid at D30 and D60 was approximately twice the concentration in tea shoots. The increase in phenolic acids was also reported in solid-state fermented Pu-erh tea [41] and some other fermented products such as kimchi [42], fermented wheat [43] and fermented oyster mushrooms [44]. However, fermentation did not affect the level of p-coumaric acid and chlorogenic acid in this study. It could be explained that lactic acid bacteria fermentation could either stimulate the production of phenolic acids or degrade them. The hydrolytic enzymes from lactic acid bacteria metabolism can decompose plant cell walls, thus releasing its bound contents [45]. At the same time, phenolic acids may be metabolized through the action of the decaxoxylase or reductase enzyme into other compounds. For example, Lactobacillus brevis and Lactobacillus plantarum can metabolize p-coumaric acid and caffeic acid produce their corresponding vinyl derivatives, which contribute to the aroma of fermented food [46,47]. A previous study suggested that heterofermentative lactic acid bacteria use hydroxycinnamic acids as an external acceptor of electrons to gain cellular energy [48].

3.6. In Vitro Antioxidant Activity of Fresh and Fermented Tea Leaves during Different Fermentation Periods

The in vitro AA results are shown in Table 2. Fresh tea shoots contained the highest level of AA in all assays and all analyzed samples. Fresh semi-mature leaves (control) contained only 39.8%, 80.3%, and 50.6%. The AA of the fresh tea shoots was measured by FRAP, DPPH, and ORAC assays, respectively. This could be due to the comparatively lower amount of esterified catechins, EGCG and ECG, in semi-mature tea leaves that are generally highly correlated with tea antioxidant activity [49].
AA also showed a reduction after the steaming (D0), in which their level remained at 46.6%, 87.3%, and 56.3% of the control, measured by FRAP, DPPH, and ORAC, respectively. The subsequent fermentation reduced FRAP, DPPH, and ORAC by 51.8%, 59.2%, and 30.6%, respectively, from D0, so the sample contained only 950.72 ± 6.25, 1970.73 ± 178.89, and 1391.42 ± 143.19 µmol TE per g DW at D60. The differences between the results of each AA assay could be explained by their differences in reaction mechanism. DPPH and FRAP involve an electron transfer principle, while ORAC is based on hydrogen atom transfer [50]. Although, AA and TPC are generally highly correlated; the results of ORAC did not follow exactly the same pattern as TPC. TPC was continually reduced during the fermented-tea-ball-making process (Figure 1), whereas the ORAC at D0 was 2004.84 ± 33.81 µmol TE/g DW and remained insignificantly different until D30 (1990.69 ± 147.27 µmol TE/g DW), before being significantly reduced to 1391.42 ± 143.19 µmol TE/g DW at D60.
It may be speculated that, since semi-mature leaves had lower polyphenols and AA than the shoots, the subsequent fermented tea ball product may also have lower AA than the infused tea. The previous study on Japanese microbial fermented tea (Awaban cha) also reported that green tea contains higher AA [51]. However, it should take into consideration that the way a fermented tea ball is consumed is different from infused tea. While hot water is used to brew infused tea products, a fermented tea ball is consumed by chewing a whole bunch of leaves and by sucking the juice until its flavor becomes plain or by directly eating a ball as an ingredient in a dish. Our previous experiment showed that fermented tea balls have a comparable amount of TPC and AA to infused green tea when using the extraction procedures that mimic their consumption, i.e., brewing for green tea and grinding for fermented tea ball [52].
However, since the AA of a fermented tea ball tends to decrease during fermentation, the fermentation period should be performed in as short a time as possible to retain more polyphenols, given that the flavor is still acceptable. The local villagers suggested that two-week fermentation is usually enough to give an acceptable sensory characteristic. Continued fermentation will render a product more sour and with a softer texture. In general, if the tea was only for household consumption, it could be kept fermented up to a year. Nevertheless, too long a fermentation will result in an excessively sour taste and too soft a texture of the tea leaves, which may not be suitable for economic reasons.

4. Conclusions

This paper investigated polyphenol content during the processing of a fermented Assam tea ball. The results showed that fermented tea still contains a significant amount of health benefit compounds, although it seemed that most of the compounds degraded when the fermentation continued for too long, except for caffeic acid and sinapic acid, which increased considerably. From a conservative perspective as well as a viewpoint of rural development, the production of fermented Assam tea balls (i.e., Miang) could cause the villagers to perceive it as a community forest-grown tea in their area, which may in turn trigger their sense of conservation of the forest near their households, integrating both biodiversity conservation and a sustainable diet and lifestyle in Northern Thailand. However, from a socioeconomic perspective, sufficient scientific evidence is needed of consumers adopting the fermented Assam tea ball instead of other tea products for local residents to raise additional income. Future research could be aimed at identifying its potential value for health and at promoting this local product as a functional food.

Author Contributions

Five authors together contributed to this study: P.S. acted as the first author throughout the whole research conceptualization, drafting, methodology, and data analysis; C.S. contributed to revising the materials and methods, and results and discussion; P.T. reviewed and revised the methods, results, and discussion; C.-M.H. contributed to manuscript review and to revision of the results, discussion, and conclusion; and W.S. contributed to research idea, data analysis, and revision of the results and discussion. All authors read and approved the final manuscript.

Funding

This research was funded by the Ratchadaphiseksomphot Endowment Fund, Chulalongkorn University, grant No. GB-B_CU_61_09_40_01.

Conflicts of Interest

The authors declare no conflict of interest.

References

  1. Taylor, S. Tea/type, production and trade. In Encyclopedia of Food Sciences and Nutrition; Caballero, B., Trugo, L., Finglas, P.M., Eds.; Academic Press: Oxford, UK, 2003; pp. 5737–5743. [Google Scholar]
  2. Chaikaew, S.; Baipong, S.; Sone, T.; Kanpiengjai, A.; Chui-chai, N.; Asano, K.; Khanongnuch, C. Diversity of lactic acid bacteria from Miang, a traditional fermented tea leaf in northern Thailand and their tannin-tolerant ability in tea extract. J. Microbiol. 2017, 55, 720–729. [Google Scholar] [CrossRef]
  3. Tanasupawat, S.; Pakdeeto, A.; Thawai, C.; Yukphan, P.; Okada, S. Identification of lactic acid bacteria from fermented tea leaves (miang) in Thailand and proposals of Lactobacillus thailandensis sp. nov., Lactobacillus camelliae sp. nov., and Pediococcus siamensis sp. nov. J. Gen. Appl. Microbiol. 2007, 53, 7–15. [Google Scholar] [CrossRef] [Green Version]
  4. Xiao, P.; Huang, Y.Y.; Yang, W.P.; Zhang, B.W.; Quan, X.X. Screening lactic acid bacteria with high yielding-acid capacity from pickle tea for their potential uses of inoculating to ferment tea products. J. Food Sci. Technol. 2015, 52, 6727–6734. [Google Scholar] [CrossRef] [PubMed] [Green Version]
  5. Han, T.; Aye, K.N. The legend of laphet: A Myanmar fermented tea leaf. J. Ethn. Foods. 2015, 2, 173–178. [Google Scholar] [CrossRef] [Green Version]
  6. Huang, Y.; Xiao, X.; Cong, L.; Wu, M.; Huang, Y.; Yao, Y. A fermented tea with high levels of gallic acid processed by anaerobic solid-state fermentation. LWT 2016, 71, 260–267. [Google Scholar] [CrossRef]
  7. Xu, Y.Q.; Liu, P.P.; Shi, J.; Gao, Y.; Wang, Q.S.; Yin, J.F. Quality development and main chemical components of Tieguanyin oolong teas processed from different parts of fresh shoots. Food Chem. 2018, 249, 176–183. [Google Scholar] [CrossRef] [PubMed]
  8. Ye, X.; Jin, S.; Wang, D.; Zhao, F.; Yu, Y.; Zheng, D.; Ye, N. Identification of the origin of white tea based on mineral element content. Food Anal. Method 2017, 10, 191–199. [Google Scholar] [CrossRef]
  9. Coopers, R.; Morre, D.J.; Morre, D.M. Medicinal benefit of green tea. J. Altern. Complement Med. 2005, 11, 639–652. [Google Scholar] [CrossRef] [PubMed]
  10. Miyata, Y.; Shida, Y.; Hakariya, T.; Sakai, H. Anti-cancer effects of green tea polyphenols against prostate cancer. Molecules 2019, 24, 193. [Google Scholar] [CrossRef] [PubMed] [Green Version]
  11. Almajano, M.P.; Carbó, R.; Jiménez, J.A.L.; Gordon, M.H. Antioxidant and antimicrobial activities of tea infusions. Food Chem. 2008, 108, 55–63. [Google Scholar] [CrossRef]
  12. Chan, E.W.C.; Lim, Y.Y.; Chew, Y.L. Antioxidant activity of Camellia sinensis leaves and tea from a lowland plantation in Malaysia. Food Chem. 2007, 102, 1214–1222. [Google Scholar] [CrossRef]
  13. Wakamatsu, M.; Yamanouchi, H.; Sahara, H.; Iwanaga, T.; Kuroda, R.; Yamamoto, A.; Minami, Y.; Sekijima, M.; Yamada, K.; Kajiya, K. Catechin and caffeine content in green tea at different harvest periods and their metabolism in miniature swine. Food Sci. Nutr. 2019, 7, 2769–2778. [Google Scholar] [CrossRef] [Green Version]
  14. Wang, Y.Y.; Yang, X.R.; Li, K.K.; Li, C.R.; Li, L.L.; Li, J.X.; Huang, H.; Ho, Y.; Ye, C.; Song, X. Simultaneous determination of theanine, gallic acid, purine alkaloid, catechins and theaflavins in black tea using HPLC. Int. J. Food Sci. Technol. 2010, 45, 1263–1269. [Google Scholar] [CrossRef]
  15. Wu, C.; Xu, H.; Hertia, J.; Andlauer, W. Determination of catechins and flavonol glycosides in Chinese tea varieties. Food Chem. 2012, 132, 144–149. [Google Scholar] [CrossRef] [PubMed]
  16. Jiang, H.; Engelhardt, U.H.; Thrane, C.; Maiwald, B.; Stark, J. Determination of flavonol glycosides in green tea, oolong tea and black tea by UHPLC compared to HPLC. Food Chem. 2015, 183, 30–35. [Google Scholar] [CrossRef] [PubMed]
  17. Dwyer, J.T.; Perterson, J. Tea and flavonoids: Where we are, where to go next. Am. J. Clin. Nutr. 2013, 98, 1611S–1618S. [Google Scholar] [CrossRef] [Green Version]
  18. Wang, W.N.; Zhang, L.; Wang, S.; Shi, S.P.; Jiang, Y.; Li, N.; Tu, P.F. 8-C N-ethyl-2-pyrrolidinone substituted flavan-3-ols as the marker compounds of Chinese dark teas formed in the post-fermentation process provide significant antioxidative activity. Food Chem. 2014, 152, 539–545. [Google Scholar] [CrossRef]
  19. Slinkard, K.; Singleton, V.L. Total phenol analysis: Automation and comparison with manual methods. Am. J. Enol. Viticult. 1977, 28, 49–55. [Google Scholar]
  20. Benzie, F.F.; Strain, J.J. The ferric reducing ability of plasma (FRAP) as a measure of “Antioxidant Power”: The FRAP assay. Anal. Biochem. 1996, 239, 70–76. [Google Scholar] [CrossRef] [Green Version]
  21. Cheng, Z.; Moore, J.; Yu, L. High-throughput relative DPPH radical scavenging capacity assay. J. Agric. Food Chem. 2006, 54, 7429–7436. [Google Scholar] [CrossRef]
  22. Huang, D.; Ou, B.; Hampsch-Woodill, M.; Flanagan, J.A.; Prior, R.L. High-throughput assay of oxygen radical absorbance capacity (ORAC) using a multichannel liquid handling system coupled with a microplate fluorescence reader in 96-well format. J. Agric. Food Chem. 2002, 50, 4437–4444. [Google Scholar] [CrossRef] [PubMed]
  23. Yao, L.H.; Jiang, Y.M.; Caffin, N.; D’Arcy, B.; Datta, N.; Liu, X.; Singanusong, R.; Xu, Y. Phenolic compounds in tea from Australian supermarkets. Food Chem. 2006, 96, 614–620. [Google Scholar] [CrossRef]
  24. Wang, H.; Helliwell, K. Determination of flavonols in green and black tea leaves and green tea infusions by high-performance liquid chromatrography. Food Res. Int. 2001, 34, 223–227. [Google Scholar] [CrossRef]
  25. Zeng, L.; Ma, M.; Li, C.; Luo, L. Stability of tea polyphenol solution with different pH at different temperature. Int. J. Food Prop. 2014, 20, 1–18. [Google Scholar] [CrossRef] [Green Version]
  26. Vuong, Q.V.; Golding, J.B.; Stathopoulos, C.E.; Nguyen, M.H.; Roach, P.D. Optimizing conditions for the extraction of catechins from green tea using hot water. J. Sep. Sci. 2011, 34, 3099–3106. [Google Scholar] [CrossRef]
  27. Jiang, H.Y.; Shii, T.; Matsuo, Y.; Tanaka, T.; Jiang, Z.H.; Kouno, I. A new catechin oxidation product and polymeric polyphenols of post fermented tea. Food Chem. 2011, 129, 830–836. [Google Scholar] [CrossRef] [PubMed] [Green Version]
  28. Yoshida, Y.; Kiso, M.; Goto, T.M. Effect of pH and tea concentration on extraction of catechins from Japanese Green Tea. ACS Symp. Ser. 2000, 754, 347–354. [Google Scholar]
  29. Jakubczyk, K.; Kalduńska, J.; Kochman, J.; Janda, K. Chemical profile and antioxidant activity of the kombucha beverage derived from white, green, black and red tea. Antioxidants 2020, 9, 447. [Google Scholar] [CrossRef]
  30. Gai, Z.; Wang, Y.; Jiang, J.; Xie, H.; Ding, Z.; Ding, S.; Wang, H. The quality evaluation of tea (Camellia sinensis) varieties based on the metabolomics. HortScience 2019, 54, 409–415. [Google Scholar] [CrossRef] [Green Version]
  31. Yao, Y.; Jiang, Y.; Datta, N.; Singanusong, R.; Liu, X.; Duan, J.; Raymont, K.; Lisle, A.; Xu, Y. HPLC analyses of flavonols and phenolic acids in the fresh young shoots of tea (Camellia sinensis) grown in Australia. Food Chem. 2004, 84, 253–263. [Google Scholar] [CrossRef]
  32. Su, Y.L.; Leung, L.K.; Huang, Y.; Chen, Z.-Y. Stability of tea theaflavins and catechins. Food Chem. 2003, 83, 189–195. [Google Scholar]
  33. Chen, Z.Y.; Zhu, Q.Y.; Tsang, D.; Huang, Y. Degradation of green tea catechins in tea drinks. J. Agric. Food Chem. 2001, 49, 477–482. [Google Scholar] [CrossRef] [PubMed]
  34. Liang, H.; Liang, Y.; Dong, J.; Lu, J. Tea extraction methods in relation to control of epimerization of tea catechins. J. Sci. Food. Agric. 2007, 87, 1748–1752. [Google Scholar] [CrossRef]
  35. Das, S.; Samanta, T.; Datta, A.K. Analysis and modeling of major polyphenols during oxidationin production of black tea. J. Food Process. Preserv. 2019, 43, e14283. [Google Scholar] [CrossRef]
  36. Jiang, H.; Yu, F.; Qin, L.; Zhang, N.; Cao, Q.; Schwab, W.; Li, D.; Song, C. Dynamic change in amino acids, catechins, alkaloids, and gallic acids in six types of tea processed from the same batch of fresh tea (Camellia sinensis L.) leaves. J. Food Compost. Anal. 2019, 77, 28–38. [Google Scholar] [CrossRef]
  37. Altunkaya, A. Partial purification and characterization of polyphenoloxidase from Turkish tea leaf (Camellia sinensis L.). Int. J. Food Prop. 2014, 17, 1490–1497. [Google Scholar] [CrossRef]
  38. Tong, T.; Liu, Y.J.; Kang, J.; Zhang, C.M.; Kang, S.G. Antioxidant activity and main chemical components of a novel fermented tea. Molecules 2019, 24, 2917. [Google Scholar] [CrossRef] [PubMed] [Green Version]
  39. Izawa, K.; Amino, Y.; Kohmura, M.; Ueda, Y.; Kuroda, M. 4.16-human–environment interactions—Taste. In Comprehensive Natural Products II.; Mander, L., Liu, H.W., Eds.; Elsevier: Oxford, UK, 2010; pp. 631–671. [Google Scholar]
  40. Kuhnert, N. Unraveling the structure of the black tea thearubigins. Arch. Biochem. Biophys. 2010, 501, 37–51. [Google Scholar] [CrossRef] [PubMed]
  41. Wang, Q.; Peng, C.; Gong, J. Effect of enzymatic action on the formation of theabrownin during solid state fermentation of Pu-erh tea. J. Sci. Food Agric. 2011, 91, 2412–2418. [Google Scholar] [CrossRef] [PubMed]
  42. Park, S.Y.; Jang, H.L.; Lee, J.H.; Choi, Y.; Kim, H.; Hwang, J.; Seo, D.; Kim, S.; Nam, J.S. Changes in the phenolic compounds and antioxidant activities of mustard leaf (Brassica Juncea) kimchi extracts during different fermentation periods. Food Sci. Biotechnol. 2017, 26, 105–112. [Google Scholar] [CrossRef] [PubMed]
  43. Zhang, Z.; Lv, G.; Pan, H.; Fan, L.; Soccol, C.R.; Pandey, A. Production of powerful antioxidant supplements via solid-state fermentation of wheat (Triticum aestivum Linn.) by Cordyceps militaris. Food Technol. Biotech. 2012, 50, 32–39. [Google Scholar]
  44. Jabloñska-Ryoe, E.; Slawiñska, A.; Szwajgier, D. Effect of lactic acid fermentation on antioxidant properties and phenolic acid contents of oyster (Pleurotus ostreatus) and chanterelle (Cantharellus cibarius) mushrooms. Food Sci. Biotechnol. 2016, 25, 439–444. [Google Scholar] [CrossRef]
  45. Adebo, O.A.; Medina-Meza, I.G. Impact of fermentation on phenolic compounds and antioxidant activity of whole cereal grains: A mini review. Molecules 2020, 25, 927. [Google Scholar] [CrossRef] [Green Version]
  46. Curiel, J.A.; Rodríguez, K.; Landete, J.M.; de las Rivas, B.; Muñoz, R. Ability of Lactobacillus brevis strains to degrade food phenolic acids. Food Chem. 2010, 120, 225–229. [Google Scholar] [CrossRef] [Green Version]
  47. Rodríguez, H.; Curiel, J.A.; Landete, J.M.; de las Rivas, B.; de Felipe, F.L.; Gómez-Cordovés, C.; Mancheño, J.M.; Muñoz, R. Food phenolics and lactic acid bacteria. Int. J. Food Microbiol. 2009, 132, 79–90. [Google Scholar] [CrossRef] [Green Version]
  48. Filannino, P.; Gobbetti, M.; De Angelis, M.; Di Cagno, R. Hydroxycinnamic acids used as external acceptors of electrons: An energetic advantage for strictly heterofermentative lactic acid bacteria. Appl. Environ. Microbiol. 2014, 80, 7574–7582. [Google Scholar] [CrossRef] [PubMed] [Green Version]
  49. Zhao, C.; Li, C.; Liu, S.; Yang, L. The Galloyl catechins contributing to main antioxidant capacity of tea made from Camellia sinensis in China. Sci. World J. 2014, 2014, 863984. [Google Scholar] [CrossRef] [PubMed]
  50. Huang, D.; Ou, B.; Prior, R.L. The chemistry behind antioxidant capacity assays. J. Agric. Food Chem. 2005, 53, 1841–1856. [Google Scholar] [CrossRef]
  51. Horie, M.; Nara, K.; Sugino, S.; Umeno, A. Comparison of antioxidant activities among four kinds of Japanese traditional fermented tea. Food Sci. Nutr. 2017, 5, 639–645. [Google Scholar] [CrossRef] [PubMed] [Green Version]
  52. Somsong, P.; Tiyayon, P.; Srichamnong, W. Antioxidant of green tea and pickle tea product, miang, from northern Thailand. Acta Hortic. 2018, 1210, 241–247. [Google Scholar] [CrossRef]
Figure 1. Total phenolic content measured in tea shoots, semi-mature tea leaves, fermented tea, and fermentation broth at different fermentation periods. The results are expressed as mean ± SD (n = 3). Bars with different letters are significantly different at p < 0.05. If there is no significant differences between two bars, they get the same letters. Control = freeze-dried fresh semi-mature leaves, D0 = steamed unfermented, D5 = 5th day of fermentation, D15 = 15th day of fermentation, D30 = 30th day of fermentation, and D60 = 60th day of fermentation.
Sustainability 12 05853 g001
Figure 2. Tea catechin levels at different fermentation periods. The results are expressed as mean ± SD (n = 3). Bars with different letters (within the same compound) are significantly different at p < 0.05. Control = freeze-dried fresh semi-mature leaves, D0 = steamed unfermented, D5 = 5th day of fermentation, D15 = 15th day of fermentation, D30 = 30th day of fermentation, D60 = 60th day of fermentation, C = catechin, EC = epicatechin, ECG = epicatechin gallate, EGCG = epigallocatechin gallate, and GC = gallocatechin.
Sustainability 12 05853 g002
Figure 3. Theaflavin, thearubigin, and theabrownin levels at different fermentation periods.The results are expressed as mean ± SD (n = 3). Bars with different letters (within the same compound) are significantly different at p < 0.05. Control = freeze-dried fresh semi-mature leaves, D0 = steamed unfermented, D5 = 5th day of fermentation, D15 = 15th day of fermentation, D30 = 30th day of fermentation, and D60 = 60th day of fermentation.
Sustainability 12 05853 g003
Figure 4. Tea flavonols levels at different fermentation periods. The results are expressed as mean ± SD (n = 3). Bars with different letters (within the same compound) are significantly different at p < 0.05. Control = freeze-dried fresh semi-mature leaves, D0 = steamed unfermented, D5 = 5th day of fermentation, D15 = 15th day of fermentation, D30 = 30th day of fermentation, and D60 = 60th day of fermentation.
Sustainability 12 05853 g004
Table 1. Phenolic acid levels of fermented tea at different fermentation times.
Phenolic Acids (mg/g DW)
Caffeic AcidChlorogenic Acidp-coumaric AcidSinapic Acid
Shoots10.46 ± 0.18 a2.26 ± 0.19 a0.19 ± 0.01 a0.33 ± 0.013 d,e
Control5.73 ± 0.24 b0.47 ± 0.19 bND0.28 ± 0.002 d,e
D05.73 ± 0.09 b0.27 ± 0.00 b0.11 ± 0.01 b0.46 ± 0.006 c,d
D54.12 ± 0.62 b0.32 ± 0.08 b0.07 ± 0.03 b0.19 ± 0.091e
D158.67 ± 1.22 a0.34 ± 0.03 b0.11 ± 0.09 b0.45 ± 0.079 c,d
D309.90 ± 1.95 a0.30 ± 0.13 b0.12 ± 0.04 b0.59 ± 0.145 a,b,c
D609.99 ± 1.29 a0.38 ± 0.19 b0.08 ± 0.05 b0.76 ± 0.17 a,b
The results are expressed as mean ± SD (n = 3). Values within the same column with different superscript are significantly different at p < 0.05. Control = freeze-dried fresh semi-mature leaves, D0 = steamed unfermented, D5 = 5th day of fermentation, D15 = 15th day of fermentation, D30 = 30th day of fermentation, and D60 = 60th day of fermentation.
Table 2. In vitro antioxidant activity of fermented tea at different fermentation times.
In Vitro Antioxidant Activity (µmol TE per g DW)
FRAPDPPHORAC
Shoots10,614.39 ± 259.84 a6892.68 ± 68.95 a7037.17 ± 310.15 a
Control4228.29 ± 110.18 b5535.67 ± 181.79 b3561.11 ± 309.21 b
D01971.53 ± 27.27 c4832.79 ± 36.35 c2004.84 ± 33.81 c
D51843.28 ± 17.52 d4182.08 ± 101.35 d2049.88 ± 217.75 c
D151563.62 ± 31.71 e3945.87 ± 137.926 e2250.25 ± 145.95 c
D301371.37 ± 12.56 f3168.12 ± 111.09 f1990.69 ± 147.27 c
D60950.72 ± 6.25 g1970.73 ± 178.89 g1391.42 ± 143.19 d
The results are expressed as mean ± SD (n = 5). Values within the same column with different superscript are significantly different at p < 0.05. Control = freeze-dried fresh semi-mature leaves, D0 = steamed unfermented, D5 = 5th day of fermentation, D15 = 15th day of fermentation, D30 = 30th day of fermentation, and D60 = 60th day of fermentation.

