Article

Mechanisms Implemented for the Sustainable Development of Agriculture: An Overview of Cabo Verde Performance

by
Danilson Varela
1,2,3,4,*,†,
Filipa Monteiro
1,5,*,†,
Patrícia Vidigal
1,
Luís Silva
2 and
Maria M. Romeiras
1,5
1
Linking Landscape Environment, Agriculture and Food (LEAF) Research Center, School of Agriculture, University of Lisbon, 1349-017 Lisbon, Portugal
2
Research Centre in Biodiversity and Genetic Resources–Azores (CIBIO-Azores), InBIO Associate Laboratory, Faculty of Sciences and Technology, University of Azores, 9500-321 Ponta Delgada, Portugal
3
Nova School of Business and Economics, Campus de Carcavelos, Nova University of Lisbon, Lisbon, 2775-405 Carcavelos, Portugal
4
African Studies Center for Development and Innovation (CEADI), 7310 Assomada, Cabo Verde
5
Centre for Ecology, Evolution and Environmental Changes (cE3c), Faculty of Sciences, University of Lisbon, 1349-017 Lisbon, Portugal
*
Authors to whom correspondence should be addressed.
The authors have contributed equally to this work.
Sustainability 2020, 12(14), 5855; https://0-doi-org.brum.beds.ac.uk/10.3390/su12145855
Submission received: 15 June 2020 / Revised: 10 July 2020 / Accepted: 15 July 2020 / Published: 21 July 2020

Abstract

:
In 2005, the Economic Community of West African States (ECOWAS) adopted the Common Agricultural Policy of ECOWAS (ECOWAP), as an instrument for implementing the Comprehensive Africa Agriculture Development Program (CAADP). The main goals of ECOWAP/CAADP were set to promote agriculture development and end hunger by 2025. In this study we focused on the Cabo Verde archipelago as one of the best performing countries within ECOWAS in terms of overall sustainable development. In this paper, the evolution of the ECOWAP implementation and of the Sustainable Development Goals (SDGs) associated with agriculture in Cabo Verde, were assessed by semi-quantitative (e.g., agricultural policies, agrarian periodical literature) and quantitative (modeling regression of ECOWAP implementation and Sustainable Development Goals—SDGs—performance) analyses. Our integrated results suggest that the agriculture development strategies, the signature of ECOWAP/CAADP by the national government, and political stability might explain the progress made towards poverty reduction and the improvement of food security. The results also show that agriculture-related SDGs in Cabo Verde are higher than the mean values obtained from the remaining West African countries, well above the top 25% WA countries. Nevertheless, Cabo Verde public expenditure into agriculture under the ECOWAP was generally below the targeted 10% of the national budget, with food import required to meet internal food demands.

1. Introduction

In the middle of the 20th century, political leaders made an important step forward in enhancing global peace and human development by starting a new way of handling one of the world’s major problems through the creation of the Food and Agriculture Organization (FAO) of the United Nations (UN), on 16 October 1945, an important landmark of the struggle against hunger and underdevelopment [1].
From the 1980s onwards, development theories began to focus not only on economic growth per se, but also to take into account the distribution of the world’s wealth [2,3]. In September 2000, world leaders gathered at the Millennium Summit to shape a broad vision to fight poverty in its many dimensions, which was translated into eight Millennium Development Goals (MDGs) [4]. The MDGs were seen as a way to mobilize all nations to solve major world problems and to achieve the defined goals by 2015 [5], where countries were positioned according to the compliance (or not) with pre-defined indicators [6]. After this initiative, which proved to be less effective in most of the developing countries, particularly those in the African continent [7], a new set of global objectives were defined as the Sustainable Development Goals (SDGs) [8]. The 2030 Agenda for Sustainable Development has established 17 SDGs, which were considered guidelines towards achieving a globally sustainable future, and included issues such as gender and social inequality, poverty, climate, environment, peace, and justice [9,10]. Several initiatives have been implemented, envisioning the application of the SDGs concerning a region-based approach. The African Union’s 2063 Agenda [11] is such a case, which aims at fulfilling the SDGs within a strategic framework for the socio-economic transformation of the continent over the next 50 years, to boost growth and sustainable development in Africa. Several initiatives have been developed by the African Union, including: the Lagos Plan of Action; The Abuja Treaty; The Minimum Integration Programme; The Programme for Infrastructural Development in Africa (PIDA); The Comprehensive Africa Agricultural Development Programme (CAADP); The New Partnership for Africa’s Development (NEPAD), among other regional and national plans and programs.
Beyond the African Union, economically, the African continent is organized into eight Regional Economic Communities (RECs), which are the building blocks of the African Economic Community established in the 1991 Abuja Treaty [12], providing the overarching framework for continental economic integration. Among such RECs, the Economic Community of West African States (ECOWAS) dates back to the treaty of Lagos in 1975, where it was meant to foster interstate economic and political cooperation, united with a single currency unit, the CFA franc. ECOWAS includes 15 member states (i.e., Benin, Burkina Faso, Cabo Verde, Côte D’Ivoire, The Gambia, Ghana, Guinea, Guinea-Bissau, Liberia, Mali, Niger, Nigeria, Senegal, Sierra Leone and Togo) [13], being one of the largest and most diversified economic communities in Sub-Saharan Africa (SSA), which includes distinct colonial backgrounds, encompassing the Anglophone, Francophone and Lusophone countries of the sub-region [14]. Since its beginning, ECOWAS has been active in the management of political crises and economic policies that resulted from the formulation of regional policies targeted to agricultural sector development [15,16,17]. In 2013, the West African sub-region represented 18.1% of total gross domestic product (GDP) and 36.4% of agricultural GDP in Africa [18]. Besides its importance in terms of employment and food staple crops availability, the agriculture sector still makes a relatively high contribution to the GDP, corresponding to 35% of regional GDP over the last decade [19]. Thus, understanding regional policies targeted to improve the agriculture sector is of utmost importance, considering that most correspond to a smallholder farming level with high impact on household incomes, food security, and ultimately, on the national revenues of major agriculture commodities. Major agriculture commodities in the West African region have been identified as maize, yams, cassava, and cowpeas, followed by oil crops and vegetables, allied to cash crops such as cashew and cocoa [19,20], where more than 60% of the West African population workforce and income rely on.
Overall, the recognition of the agriculture sector for improving livelihoods, boosting economic growth, ending hunger and poverty, increasing gender equality and fostering sustainable development is unquestionable throughout the different countries that embody Africa, namely through Africa’s policy framework for agriculture transformation—CAADP. This is because of both the important role of agriculture in African economies and livelihoods, and the strong linkages that agriculture forges with other sectors. Thus, the measurement of SDG implementation in each African region rises as a semi-quantitative baseline for assessing the implementation of the AU 2063 agenda, namely those SDGs strongly associated with the agriculture sector. Moreover, the Common Agricultural Policy of ECOWAS (ECOWAP) [15,21] adopted in 2005 was seen as a lever of regional integration and poverty reduction by setting a collective goal of achieving a 6% annual agricultural growth rate, while CAADP defined an investment of at least 10% of the national budgets in the agricultural sector as a minimum threshold for the region. Both ECOWAP and CAADP aimed to raise agricultural productivity and increase public investment in agriculture until 2025.
Many West African countries have strived to implement ECOWAP goals and to invest in the agriculture sector, with the requirement of transforming its agriculture sector to improve human development indexes (HDI), an assessment of the development of a country, and not of economic growth alone [22]. Indeed, by looking to the average HDI in West Africa (0.498,) it is still far below the average value for the rest of the world (0.731). Within ECOWAS, HDI ranges from 0.377 (Niger) to 0.651 (Cabo Verde). These discrepancies in the HDI of West African countries represent, in part, the region’s cultural, linguistic and ecological diversity which create both opportunities and challenges for the development process [23]. The archipelago of Cabo Verde has shown progress towards overall development, which could be partly explained by the country’s political stability [24]. In 1999, Cabo Verde was in the 105th position among 174 countries, thus being placed among the least developed countries, while in 2008, it was included in the medium-development countries [25]. Nevertheless, the agriculture sector in Cabo Verde is limited by a set of natural constraints, namely rainfall shortage with persistent drought periods, scarcity of good quality soil, small territory available as farmland and low technological implementation [26].
Here, we present an integrated framework to assess the implementation of policies towards the development of agriculture and the implementation of sustainable development indicators. Thus, the main objective of this paper was to set up a baseline assessment of the mechanisms implemented towards agriculture development that might have contributed to the progress towards a sustainable development in the most well-performing country in West Africa and within ECOWAS, Cabo Verde. We aim to (i) apply a semi-quantitative analysis to evaluate the progress of Cabo Verde’s development, focusing on the agriculture sector as a baseline for improving livelihoods and boosting economic development; (ii) identify the major policies involved in the transformation of the agriculture sector; and (iii) assess the implementation of the SDGs related to agriculture development in Cabo Verde, in comparison with the remaining ECOWAS countries. Finally, we applied a quantitative analysis through a regression model approach to evaluate the impact of Cabo Verde agriculture expenditure on agriculture production growth within the ECOWAP/CAADP agreement.

2. Material and Methods

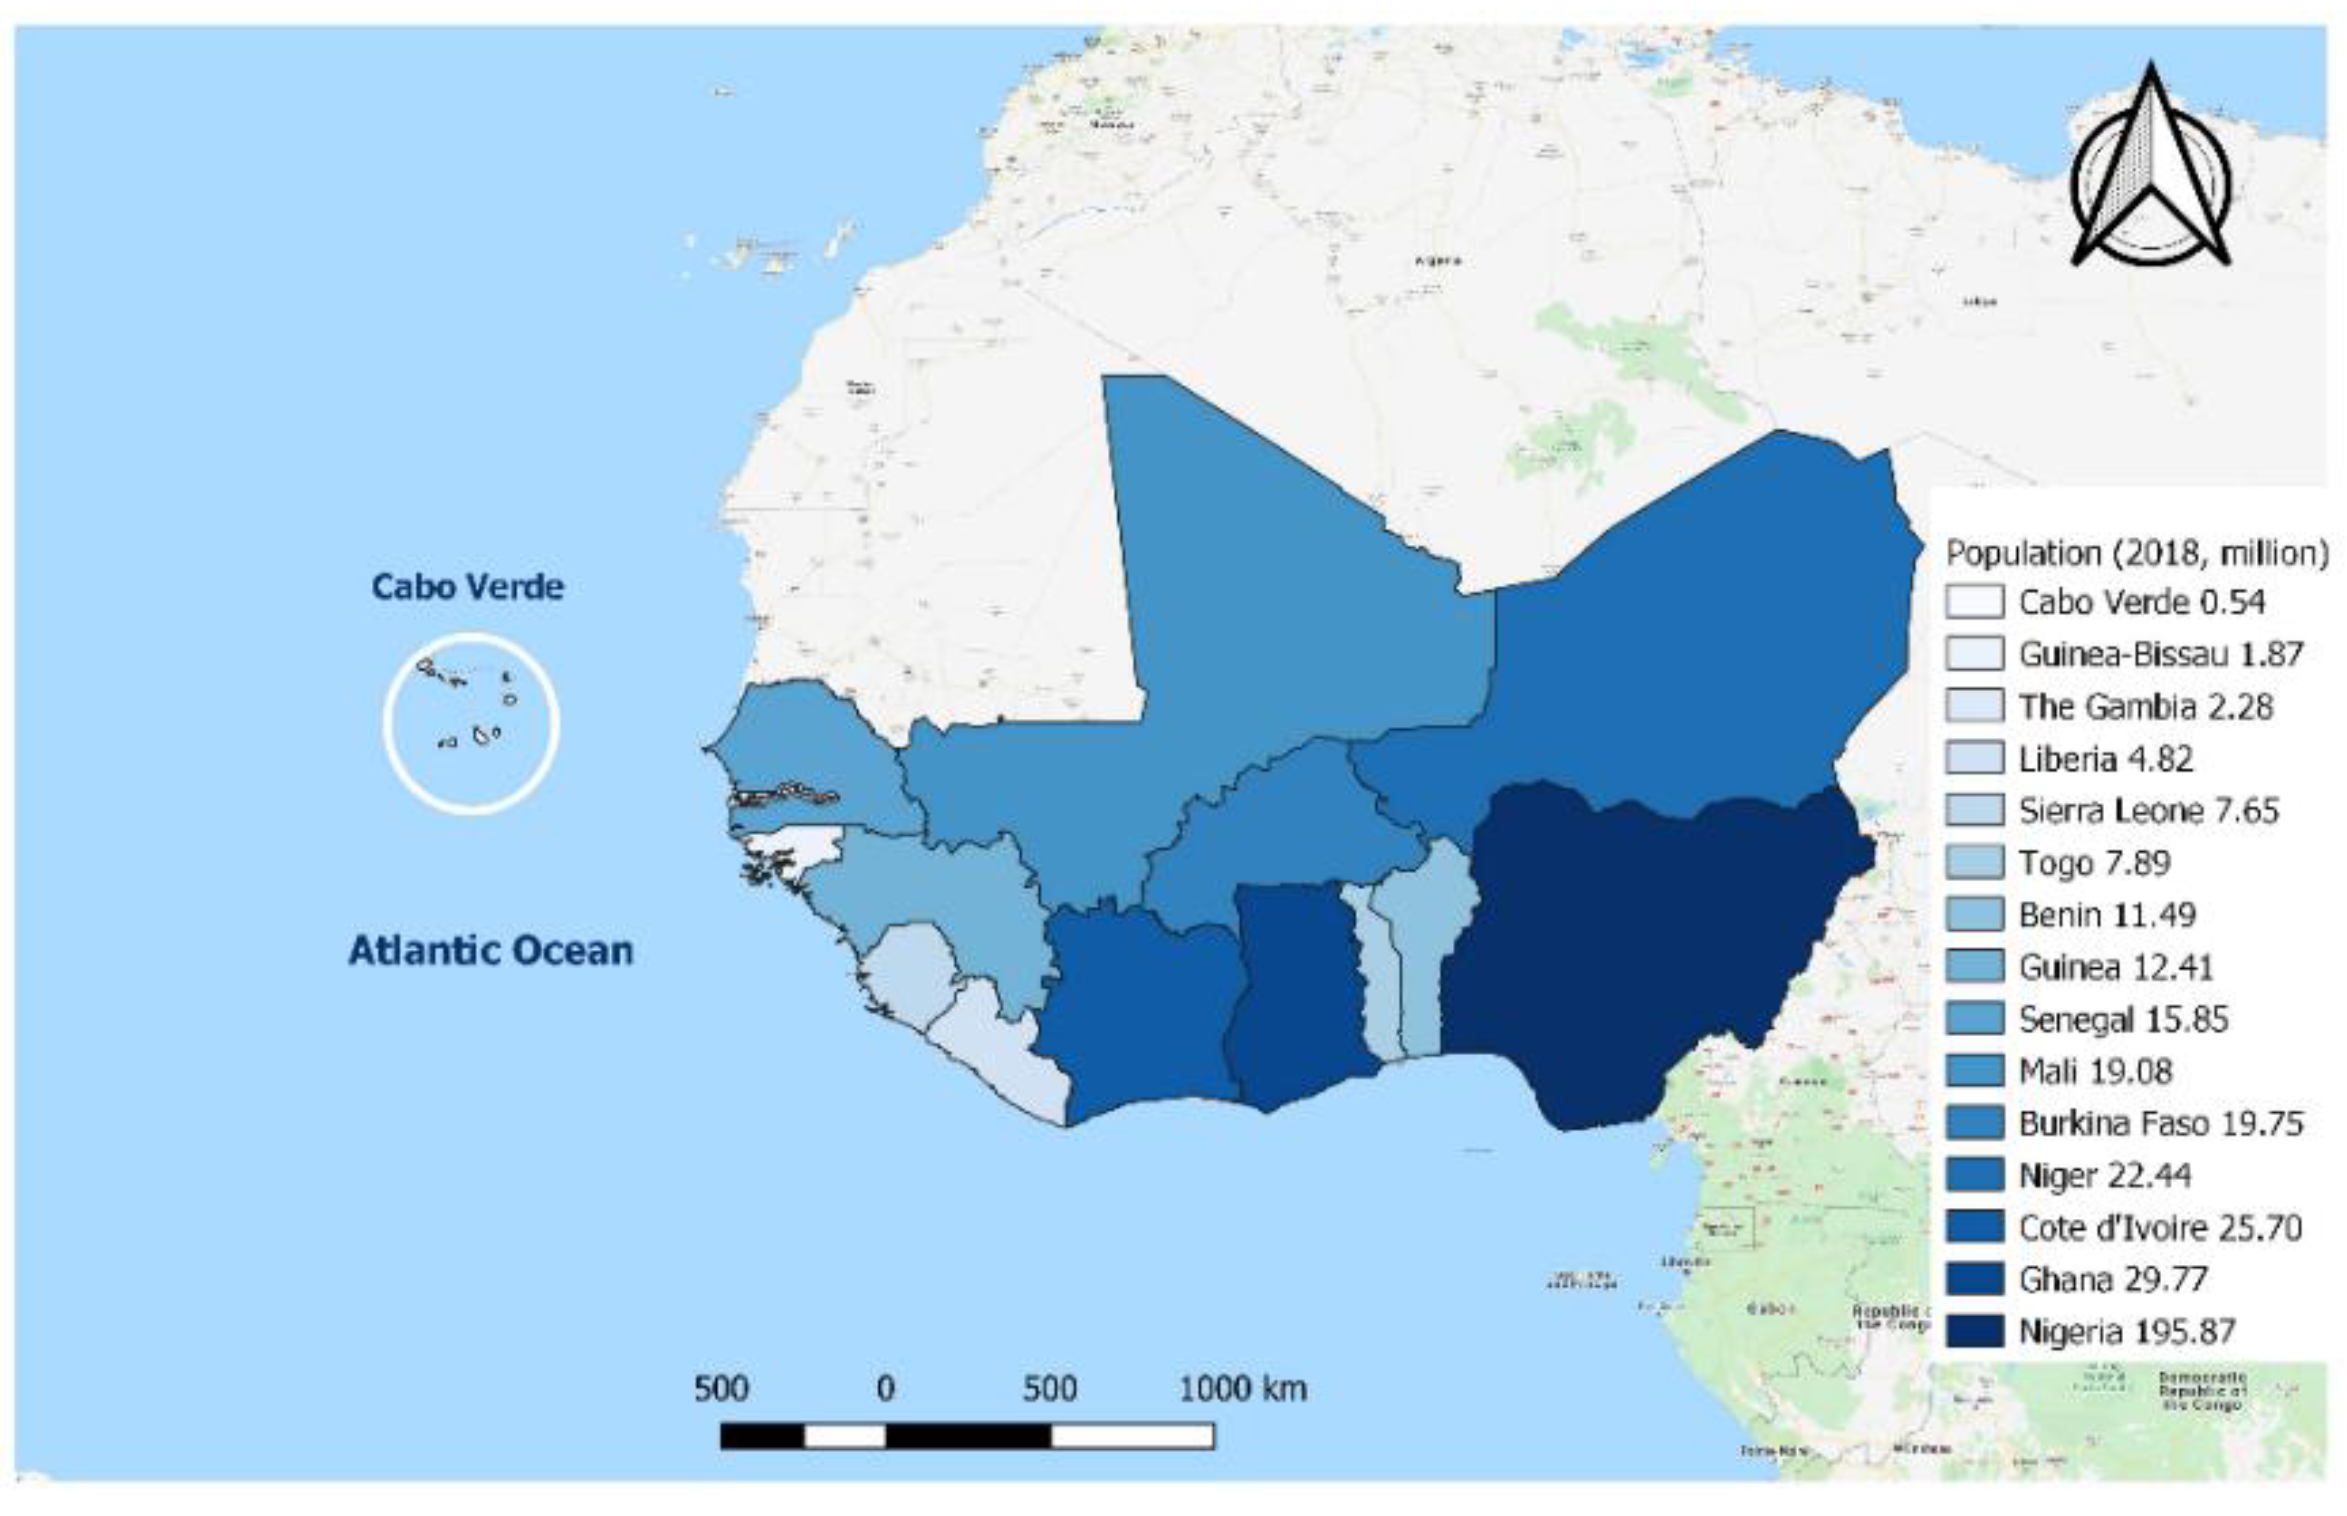
2.1. ECOWAS and Cabo Verde Archipelago: Region and Country Profile

The Economic Community of West African States, known as ECOWAS, is a regional political and economic union of fifteen countries located in West Africa (Figure 1), 12 classified as least developed countries (LDCs), with only four being middle-income countries (MICs), namely Cabo Verde, Côte D’Ivoire, Ghana and Nigeria [27]. ECOWAS as an economic region has strategic aims for economic growth, following regional challenges to strengthen regional integration and engender a structural transformation that enhances growth, creates jobs, and tackles poverty and social problems [28]. From the fifteen ECOWAS member states, Nigeria is the most populous country with about 50% (195 million) of region inhabitants, while Cabo Verde is the smallest country in geographic and demographic terms, with only 0.54 million inhabitants [29,30].
A member of ECOWAS since 1977, the Cabo Verde Islands, officially the Republic of Cabo Verde, are located ca. 570 km West of Senegal (West Africa). This archipelago includes ten islands distributed in three groups: Santo Antão, São Vicente, Santa Luzia, and São Nicolau in the North; Santiago, Fogo, and Brava in the South; and Sal, Boavista, and Maio in the East [30]. Santiago Island, the largest one both in size (area of 991 km2) and population (294,135 inhabitants in 2015), is home to the nation’s capital–Cidade da Praia [26]. It was the first of the islands to be inhabited in the 15th century, when the first settlers arrived from Portugal [31]. The adverse climate and limited productivity of the landscapes were confirmed by the first settlers and sailors visiting the islands [32]. The Cabo Verde climate is tropical dry and elevational gradients and the North-East trade winds are key factors in shaping plant species distribution [33,34]. This archipelago is characterized by scarce hydrological resources due to the low and irregular rainfall totals (average 352 mm/year from 1990 to 2016), well below the African continent average of 653 mm/year for the same period [35]. The small amount of superficial water combined with irregular precipitation explains the strong dependence of the country on subterranean water for both domestic and agricultural uses [36]. Top agriculture commodities in Cabo Verde have been identified as sugarcane, the most marketable crop, followed by tomatoes and then pulses, maize, cassava, and coconuts. The agricultural population represents 34.8% of the population of Cabo Verde (182,396 people). As in most West African agriculture, rainfed farming is the most prominent in Cabo Verde. According to Monteiro et al., [25], the main agriculture production is practiced under a rainfed regime (81.9%) with a small share of the production devoted to irrigated agriculture (16.8%), thus depending heavily on total annual rainfall and on seasonal precipitation patterns [37].

2.2. Quantitative and Semi-Quantitative Analysis on Agriculture Performance in Cabo Verde within ECOWAS

Three complementary approaches were applied to evaluate the evolution of ECOWAP/CAADP implementation and the SDGs associated with agriculture in Cabo Verde (Figure 2). Specifically, we have performed a semi-quantitative analysis by identifying major policies engaged in the transformation of the agriculture sector and assessed the implementation of the agriculture-based SDGs in Cabo Verde, in comparison with the remaining ECOWAS countries. Besides, a quantitative analysis through a regression model approach was done to evaluate the impact of Cabo Verde agriculture expenditure on agriculture production growth within the ECOWAP/CAADP agreement.

2.2.1. Agriculture Performance Indicators and Policies

In order to identify policies and strategies adopted by the Cabo Verde Government in transforming food production and agriculture to achieve the agriculture goals set by the UN and ECOWAP/CAADP, data were compiled on agricultural performance indicators (Table 1).
Cabo Verde’s performance in implementing the ECOWAP/CAADP goals was also evaluated based on data acquired from the Regional Strategic Analysis and Knowledge Support System [see https://www.resakss.org/]. ReSAKSS was established in 2006 as a key support of the CAADP and is now the primary platform for tracking implementation progress made towards CAADP benchmarks.
Results of agriculture policies were obtained from complementary in-country available data sources from the National Institute of Statistics (INE, [39,40,41,42]), Ministry of Rural Development [43], Ministry of Agriculture and Environment [44], and Ministry of Finance [45]. Agriculture expenditure data were retrieved from the World Development Index [30] and from the International Food Policy Research Institute [38]. All the values were converted to USD (e.g., annual food import and export) through an index value applied for each year dividing the constant local price by its 2010 value and then multiplying each year’s index result by the corresponding 2010 current US dollar price value. A linear extrapolation was applied to illustrate general trend results, when only a few data points were available. Food import and export volume data between 1997 and 2017 were obtained from the Food Balance Sheets of FAOSTAT [46] and the United Nations Commodity Trade Database [https://comtrade.un.org/] to assess trends in food shortage and export to link with food produced within the country. To determine if food produced in Cabo Verde is sufficient to meet internal needs, we have also calculated the food self-sufficiency ratio, which is expressed by the potential of food production from domestic agriculture, following the method adopted by FAO [47] through the Equation (1):
S f o o d = T f o o d C f o o d * 100
where S f o o d is the rate of food self-sufficiency, T f o o d is the total domestic food output, and C f o o d is the total household food consumption. Data used for this calculation included 108 varieties of foods in nine categories, such as cereals, oilseed, fruits, vegetables, sugar, meat, eggs, milk, aquatic products [46].

2.2.2. Impacts of Government Agriculture Expenditure on Production Growth through a Model Approach

One of the main assumptions of the CAADP is that signatories must spend at least 10% of their national budget on agriculture in order to achieve the recommended agricultural development goals. To evaluate the impact of Cabo Verde agriculture expenditure on agriculture production growth, we have used a multiple linear regression model (MLR) [48,49], specified by the Equation (2):
L n A p r o = 0 + β 1 ^ L n G O v _ A e t + β 2 ^ L n R a i n t + β 3 ^ C a a d p _ P a c k t + e t
where L n A p r o is the agriculture production (in constant 2010 USD); 0 is the intercept; β 1 ^ , β 2 ^ and β 3 ^ are the parameters of the model, estimated by the ordinary least square methods (OLS). L n G O v _ A e t is the government agriculture expenditure (in constant 2010 USD); L n R a i n t is the annual rainfall (in millimeters); C A A D P _ P a c k t is a dummy variable used to indicate the membership to the Comprehensive Africa Agriculture Development Programme (member = 1; non-member = 0); e t = the residual error.
Multiple regression analysis allows the researchers to control explicitly for many other factors that simultaneously affect the dependent variable, in our case, the agriculture production. It is relevant both for testing of economic theories and for evaluating policy effects when we must rely on nonexperimental data. Likewise, OLS is popularly used for estimating the parameters of the multiple regression model [49]. The method of OLS chooses the estimates to minimize the sum of squared residuals. In other words, given n observations on y, × 1, and × 2, ( x i 1 , x i 2 , y i ) : i = 1 , 2 , , n } , the estimates β 1 ^ , β 2 ^ and β 3 ^ are chosen simultaneously to make i = 1 n y i β 1 ^ x i 1 β 2 ^ x i 2 β 3 ^ x i 3 as small as possible [49]. According to the Gauss–Markov theorem, to obtain accurate and consistent results from the OLS regression analysis, some assumptions must be fulfilled, namely: (a) homoskedasticity, which means that all the variances of the error terms are constant and do not depend on the covariates; (b) linear independence, in other words, the covariates are assumed to be linearly independent ( C o v ( x j , x i ) = 0 ); and c) the exogeneity assumption states that the covariates are noncorrelated with the error term ( E ( e ) = 0 ) [49]. The analyzed data cover a period of 27 years, from 1990 to 2016. A logarithmic transformation in all variables was used, thus lightening variances to avoid issues associated with heteroskedasticity, as previously reported [50].

2.2.3. Agriculture-Based SDG Performance: Data Selection and Index Calculation

The current assessments were engaged for identifying within the 17 SDGs defined by the UN 2030 Agenda, the most important agriculture-related SDGs in the ECOWAS countries. The SDGs and respective indicators selected for this study were compiled from the Africa SDG Index and Dashboards Report 2019 from the Sustainable Development Goals Center for Africa and Sustainable Development Solutions Network (http://unsdsn.org/). The selection of SDGs was based on the relevance to agriculture as described previously [51] (Table 2), namely SDG1 (End poverty), SDG2 (Zero hunger), SDG12 (Responsible consumption and production) and SDG17 (Partnerships for the goals).
Data used for further analysis from 15 West African countries, according to the United Nations Development Programme [23], were set with a minimum threshold of 80% of the indicators available for each country, following the criteria applied by Lafortune et al. [52], and if not met, the indicators were removed (Table 2), such as the indicator “2.6. Fertilizer consumption” from SDG2 with no data availability in four countries, and “12.6. Natural resource value realization score” from SDG12 with no data for six countries. A normalization step was used to remove the effect of extreme values within indicators, according to the Africa SDG Index and Dashboards Report 2019:
x = x min ( x ) max ( x ) min ( x )
x = max ( x ) x max ( x ) min ( x )
where x is the raw data value, max(x) and min(x) are the maximum and minimum values found for the indicator, respectively; and x is the normalized value for that indicator. These equations ensure that all indicators were in ascending order (i.e., higher values denoted better performance), facilitating the interpretation and comparison of the selected indicators: a country that scores 0.50 on an indicator is halfway towards achieving the optimum value; a country with a score of 0.75 has covered three quarters of the distance from worst to best. To achieve this, Equation (3) was used for items coded in a positive sense (i.e., the larger the value the larger the development level) and Equation (4) for items coded in a negative sense (i.e., the larger the value the smaller the development level). Indicators with a positive and negative sense are identified as bold and italic, respectively, in Table 2. To minimize the bias of missing data indicators, zero was determined for normalization. The SDGs indexes calculated correspond to the average of the respective indicators.

3. Results and Discussion

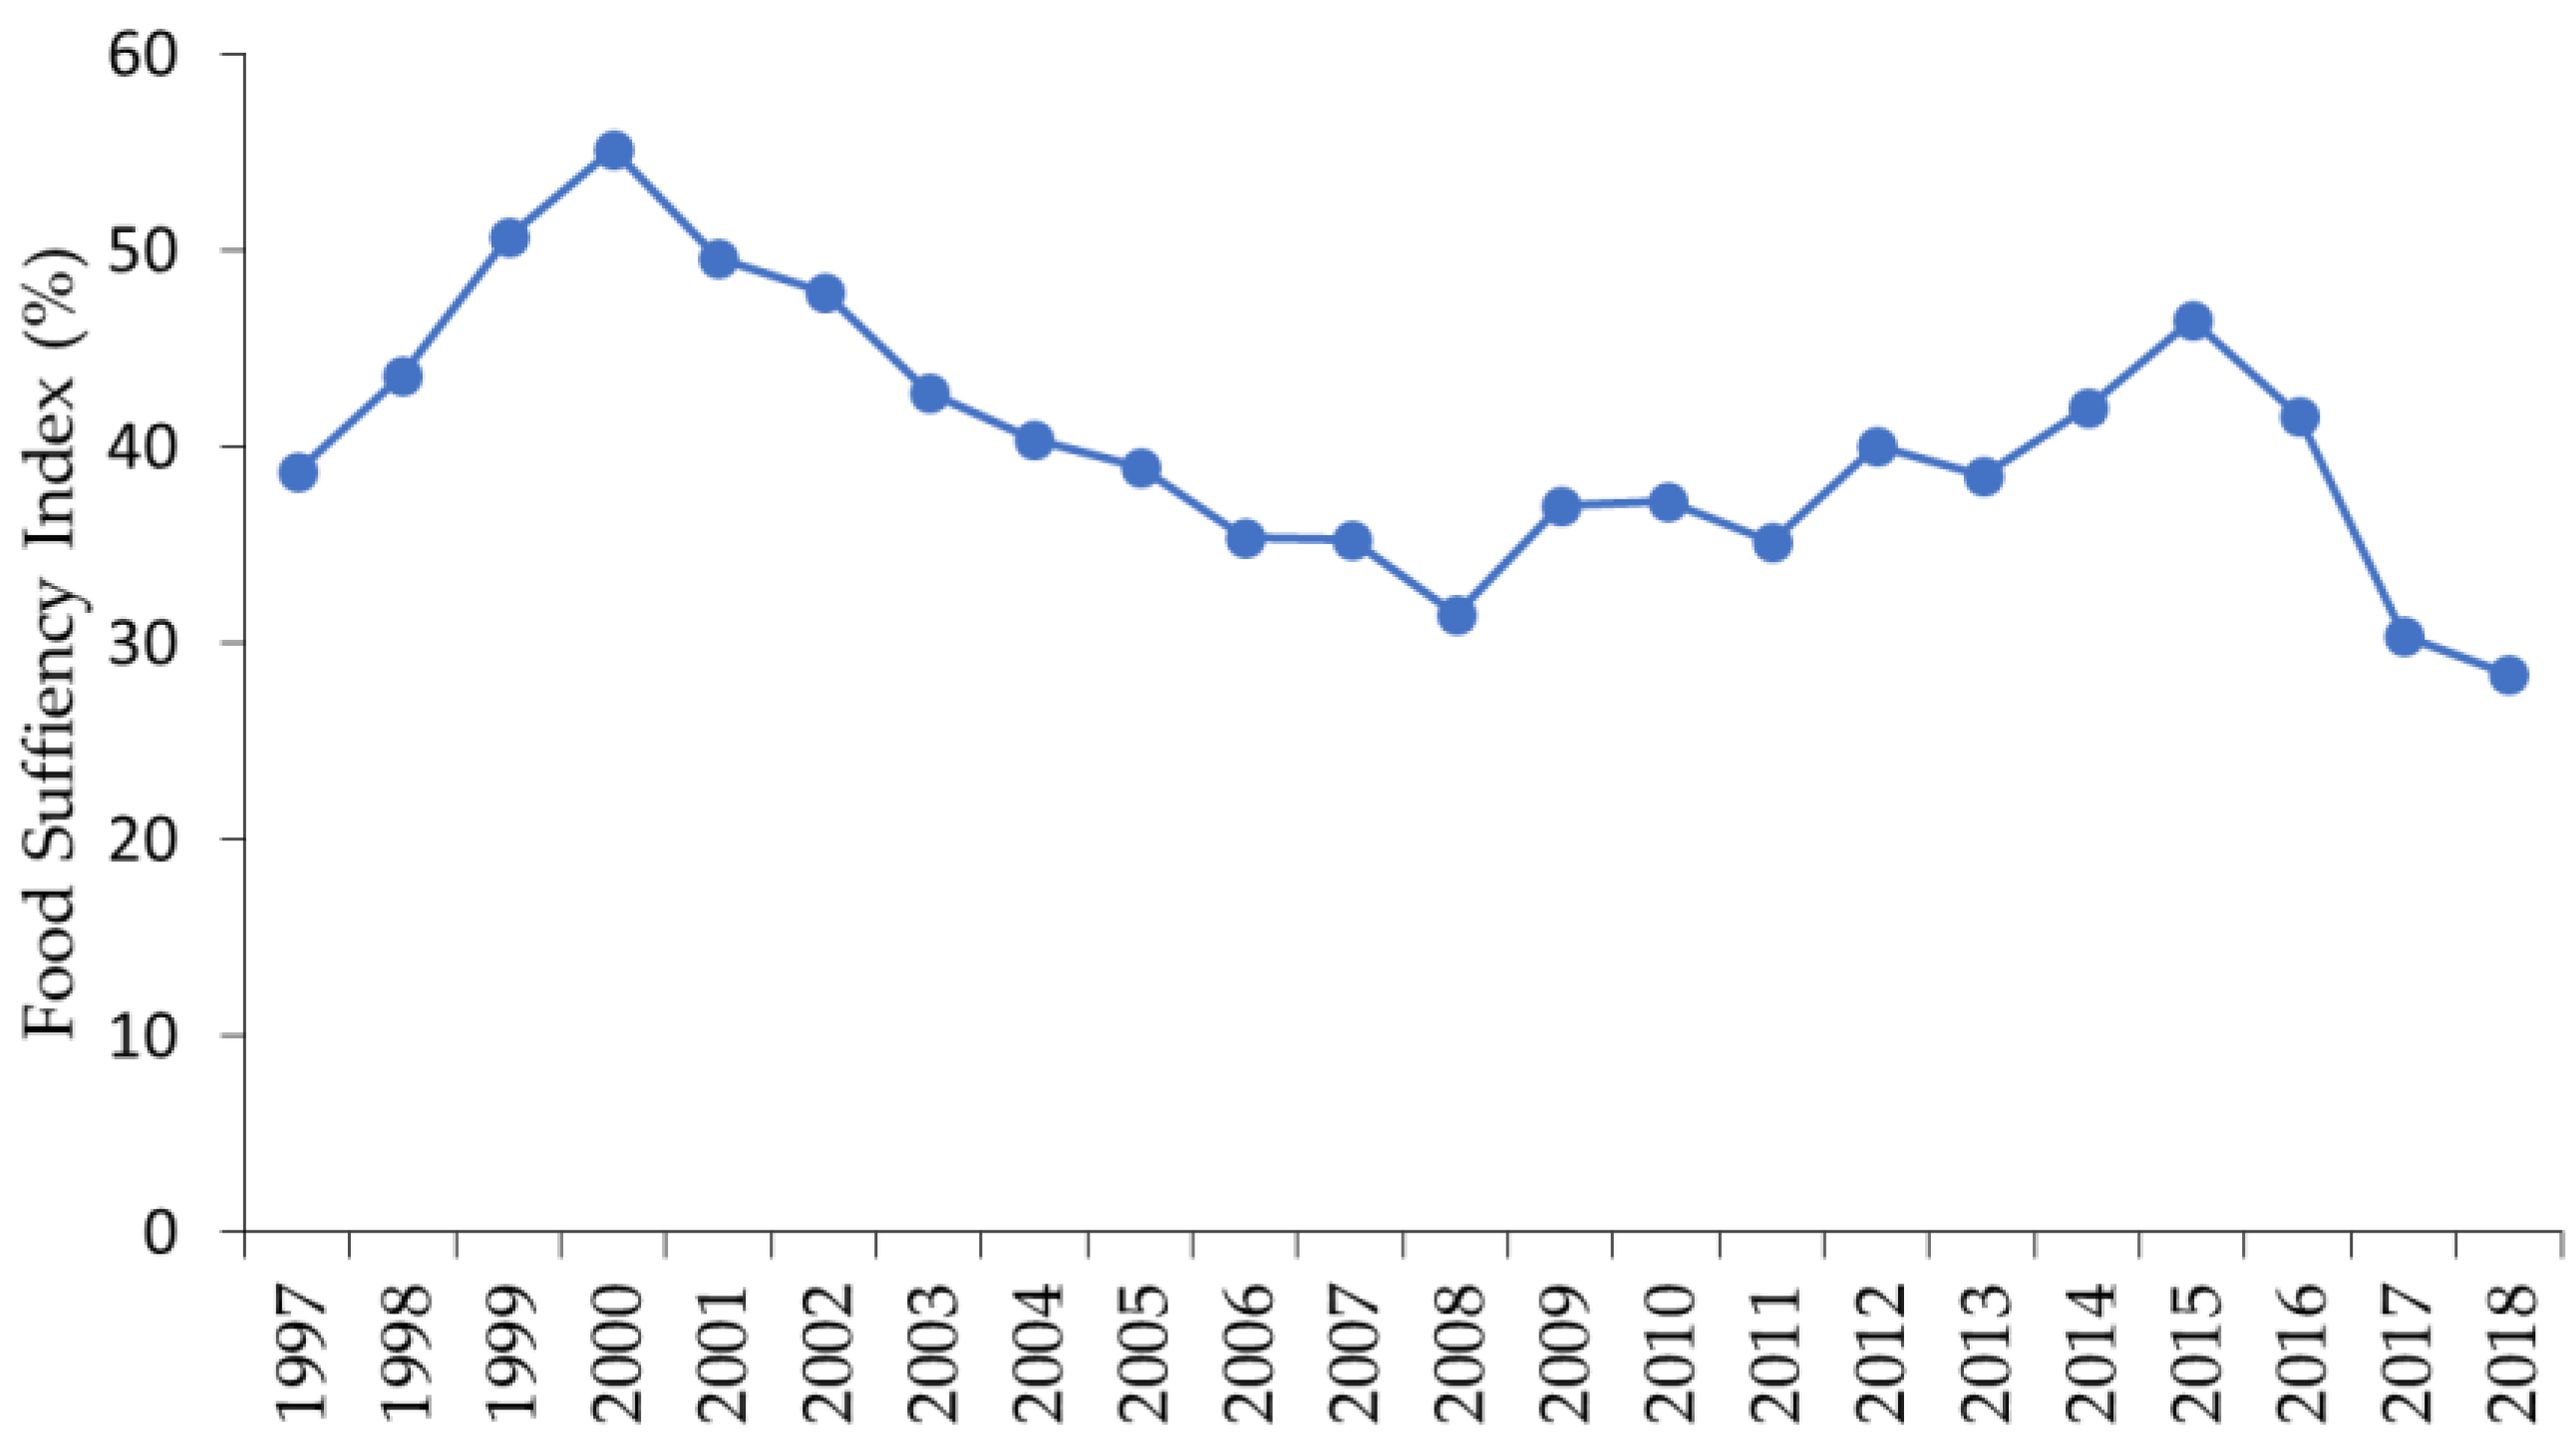
3.1. Agricultural Performance Adopted by Cabo Verde as an ECOWAS Member

From 1980–1990, the agriculture sector contributed, on average, with 15% to Cabo Verde’s GDP, falling to 11.9% per year during 1990–2004, and to 7.9% per year during 2008–2018. However, the value added to GDP (Figure 3) grew three times as much from 1990 (USD 37 million) to 2018 (USD 101 million), which lead to an increase of the agricultural GDP per capita from USD 110 in 1990 to USD 230 in 2017.
During 2007–2015, agriculture contributed, on average, 7.3% to the GDP. Therefore, the primary sector represents 8.7% of the national wealth, against approximately 17% for the industry and 61% for the tertiary sector [43,44]. From 1999 and 2005, the agricultural sector in the ECOWAS countries grew by 5%, while in Africa it grew on average by 3.3%, placing ECOWAS countries well above Africa as a whole. For the same period, the agriculture sector in the European Union grew by 1.23%, and world agriculture recorded an average growth of 1.5% [30]. In 1994, the Cabo Verde government spent 15.89% of its budget on agriculture (Figure 4), which after 1995 has decreased to values consistently below 10% of the national budget (Figure 4) with only a sporadic increase above that value in 2005.
One of the main assumptions of the CAADP is that members devote at least 10% of their national budget to agriculture to achieve the agricultural development goals set by the Malabo Declaration. From 2008–2014, public agricultural spending as a share of total public spending has been low, but it increased, on average, 6.68% per year during 2013–2018. Therefore, ECOWAP/CAADP supports and adds value to the efforts of each member state to ensure that they meet the growth, budgetary, and poverty reduction targets [53,54]. The support includes the mobilization of necessary technical expertise and funding for the preparation of regional and National Agricultural Investment Plans (NAIPs). In 2010, Cabo Verde started implementing the NAIP, committing to prioritize agricultural development and transformation. According to the CAADP Biennial Review Report [55], the country recorded a rate of 71% for the CAADP completion process. Further, 19% of youth engaged in new job opportunities in agriculture value chains. Our analysis showed that from the seven goals set by ECOWAP/CAADP, Cabo Verde is on track to achieve five (Figure 5), namely: (i) Halving Poverty through Agriculture by 2025; (ii) Boosting intra-African Trade in Agriculture Commodities; (iii) Enhancing Resilience to Climate Variability; (iv) Mutual Accountability for Action and Results; and (v) Re-committing to CAADP Process. Cabo Verde scores 4.6/10, which places the country on track to implementing the Malabo Declaration on agriculture transformation in Africa by the end of 2025.
For all seven objectives set by ECOWAP/CAADP a minimum score is established (blue bar in Figure 5) that the country must attain to be able to reach the goals set for 2025; i.e., for Goal 02 (Enhancing Investment Finance in Agriculture), the minimum score that Cabo Verde should have had in 2017 was 6.67, however the country scored only 3.71. Among all seven goals, one of the goals that Cabo Verde will hardly reach is to achieve an average of agricultural investment that corresponds to 10% of the Government expenditure. One of the great pillars of the CAADP is to end hunger through agricultural development; if the necessary investment is not achieved, the goal of ending hunger by 2025 might be compromised [55,56]. Therefore, two key areas that require the country’s attention are: (i) Enhancing Investment Finance in Agriculture and (ii) Ending Hunger by 2025.
Regarding the item “Re-committing to CAADP Process”, Cabo Verde has surpassed the three indicators, namely: (i) Completing National CAADP Process (score 7.14), (ii) Establishing CAADP based Cooperation, Partnership & Alliance (score 7.02), and (iii) Establishing CAADP based Policy & Institutional Review/Setting/Support (3.55). Cabo Verde has been adapting its legislation and adopting a set of public policies to change its agricultural development strategies, notwithstanding the countless bioclimatic difficulties faced by the country [54,57,58].

3.2. Policies and Indicators Adopted by Cabo Verde for Agriculture Sector Growth

Since Cabo Verde’s independence, several studies have reported that the Crop production index (2004–2006 = 100), which represents agricultural production for each year relative to the base period 2004–2006, has fluctuated between 31.23 in 1975 and 108.7 in 2016 [30]. Despite the high increment on Crop production index throughout the years, it is still recognizable that food production does not meet population demands. By calculating the food self-sufficiency ratio in Cabo Verde (Figure 6), it can be easily depicted that despite an increase in crop production, food production still falls short on meeting internal consumers’ needs, which poses a huge threat to food security and a high dependence on external food imports.
Indeed, Cabo Verde has imported 83% of the food consumed in 2017 by only producing 30% of the population food requirements. Therefore, despite crop production in Cabo Verde has been increasing, it is still behind the required by the population needs, which is pressured by the high tourism rate that increases food demand beyond the local population’s basic needs. The food import trend seen in Cabo Verde follows the ECOWAS countries’ market, where during the past 15 years, the ECOWAS region has become increasingly dependent on imports of food from the rest of the world for meeting population needs [59]. This trend in food imports was enhanced by the food crisis of 2007–2008, in which the countries failed to find the resources to mitigate the external shock of rising world food prices and food shortages, spotlighting the need to increase the region’s potential with respect to food staples, namely rice and wheat [59].
Since 2008, a growing trend in the rate of self-sufficient food has been occurring; however, with the recession of the agricultural sector due to severe drought, food availability dropped by 13% in 2017 and 23% in 2018, thus highlighting the high dependence on food imports to meet internal requirements, also fueled by the tourism sector which greatly increases those food demands [59].
To counteract such food demand and scarcity, public policies adopted by Cabo Verde’s government, allowed to duplicate the value added per hectare of agricultural land, from USD 552 to USD 1889 between 1980 and 2016 [38]. Considering the challenging conditions on agriculture production in Cabo Verde, due to harsh conditions with severe drought events compromising crop productivity [25], Cabo Verde, as an ECOWAS state member, engaged several policies towards agriculture development and mitigation of environmental constraints, which ultimately contributed to increasing food availability with a significant impact on poverty alleviation at household income [54]. Since gaining independence in 1975, the central government has adopted several policies, strategies, plans, and programs (Supplementary Materials, Table S1) to fight climate change and the scarcity of water, to enhance rural development, and reduce poverty. Policies engaged by Cabo Verde are mainly associated with adaptation, productivity and mitigation, using several tools for counteracting the negative effects of climate on agriculture productivity.
Among the several programs implemented, the Strategic Plan for Agriculture Development (PEDA), the Program for the Promotion of Rural Socio-Economic Opportunities (POSER) and the National Agricultural Investment Program (PNIA) have been important in promoting rural development alongside agriculture sustainable production due to the huge investment made in the rural areas through those programs [43,44,60,61,62].
The main objective of PEDA was the promotion of rural development based on the integrated valorization of specific natural resources in agro-ecological zones. The agricultural sector was characterized in its various aspects, and attention was paid to the study of agricultural products, animal products, and fisheries. Within the scope of PEDA, the government invested in 2005 around USD 18,884,751.77 (1,734,068,730.00 ECV, Cabo Verdean Escudos) in the modernization of the agrarian sector and rural development, USD 4558.26 (416,303.63 ECV) in the development of irrigated agriculture and USD 10,305.30 (941,177.36 ECV) in the conversion of rainfed agriculture [61]. In the following years, investment in these areas increased gradually, as the irrigation system increased by 22% from 2004 to 2015 [44]. Regarding POSER, it had an allocated budget of around USD 26 million, financed by the Government of Cabo Verde, the International Agricultural Development Fund (IFAD), and the Spanish Government. POSER was implemented in 2014 and replaced the Program to Fight Poverty in Rural Areas. To date, POSER has benefited 11,305 people (5478 men, and 5255 women). With a complementary view, PNIA was designed and adopted to endorse agriculture growth, poverty reduction, and food security. It has set the main strategic intervention axes and the level of investment to be made for the coming years. The first phase of the PNIA, covering the period 2010–2015, was essentially targeted at reducing poverty and achieving sustainable growth. It is a planning tool that attempts to implement the agricultural policies outlined under PEDA [42,61,62]. This program was engaged to address several drought-associated crises that have occurred in Cabo Verde history which led to famine events [26]. The National Adaptation Programme of Action on Climate Change (NAPA) considered climate risks to potable water resources as the most significant constraint to Cabo Verde’s development [61,62]. From 2008–2013, NAPA outlined the negative effects of climate change on the most vulnerable people and on the most fragile ecosystems in Cabo Verde, where urgent action has been identified and put in force on key sectors affecting agriculture development, following three prioritized areas of intervention: (1) integrated water resource management, (2) modernization and diversification of agricultural production for food security, and (3) integrated protection and management of coastal zones due to tourism [57,58].

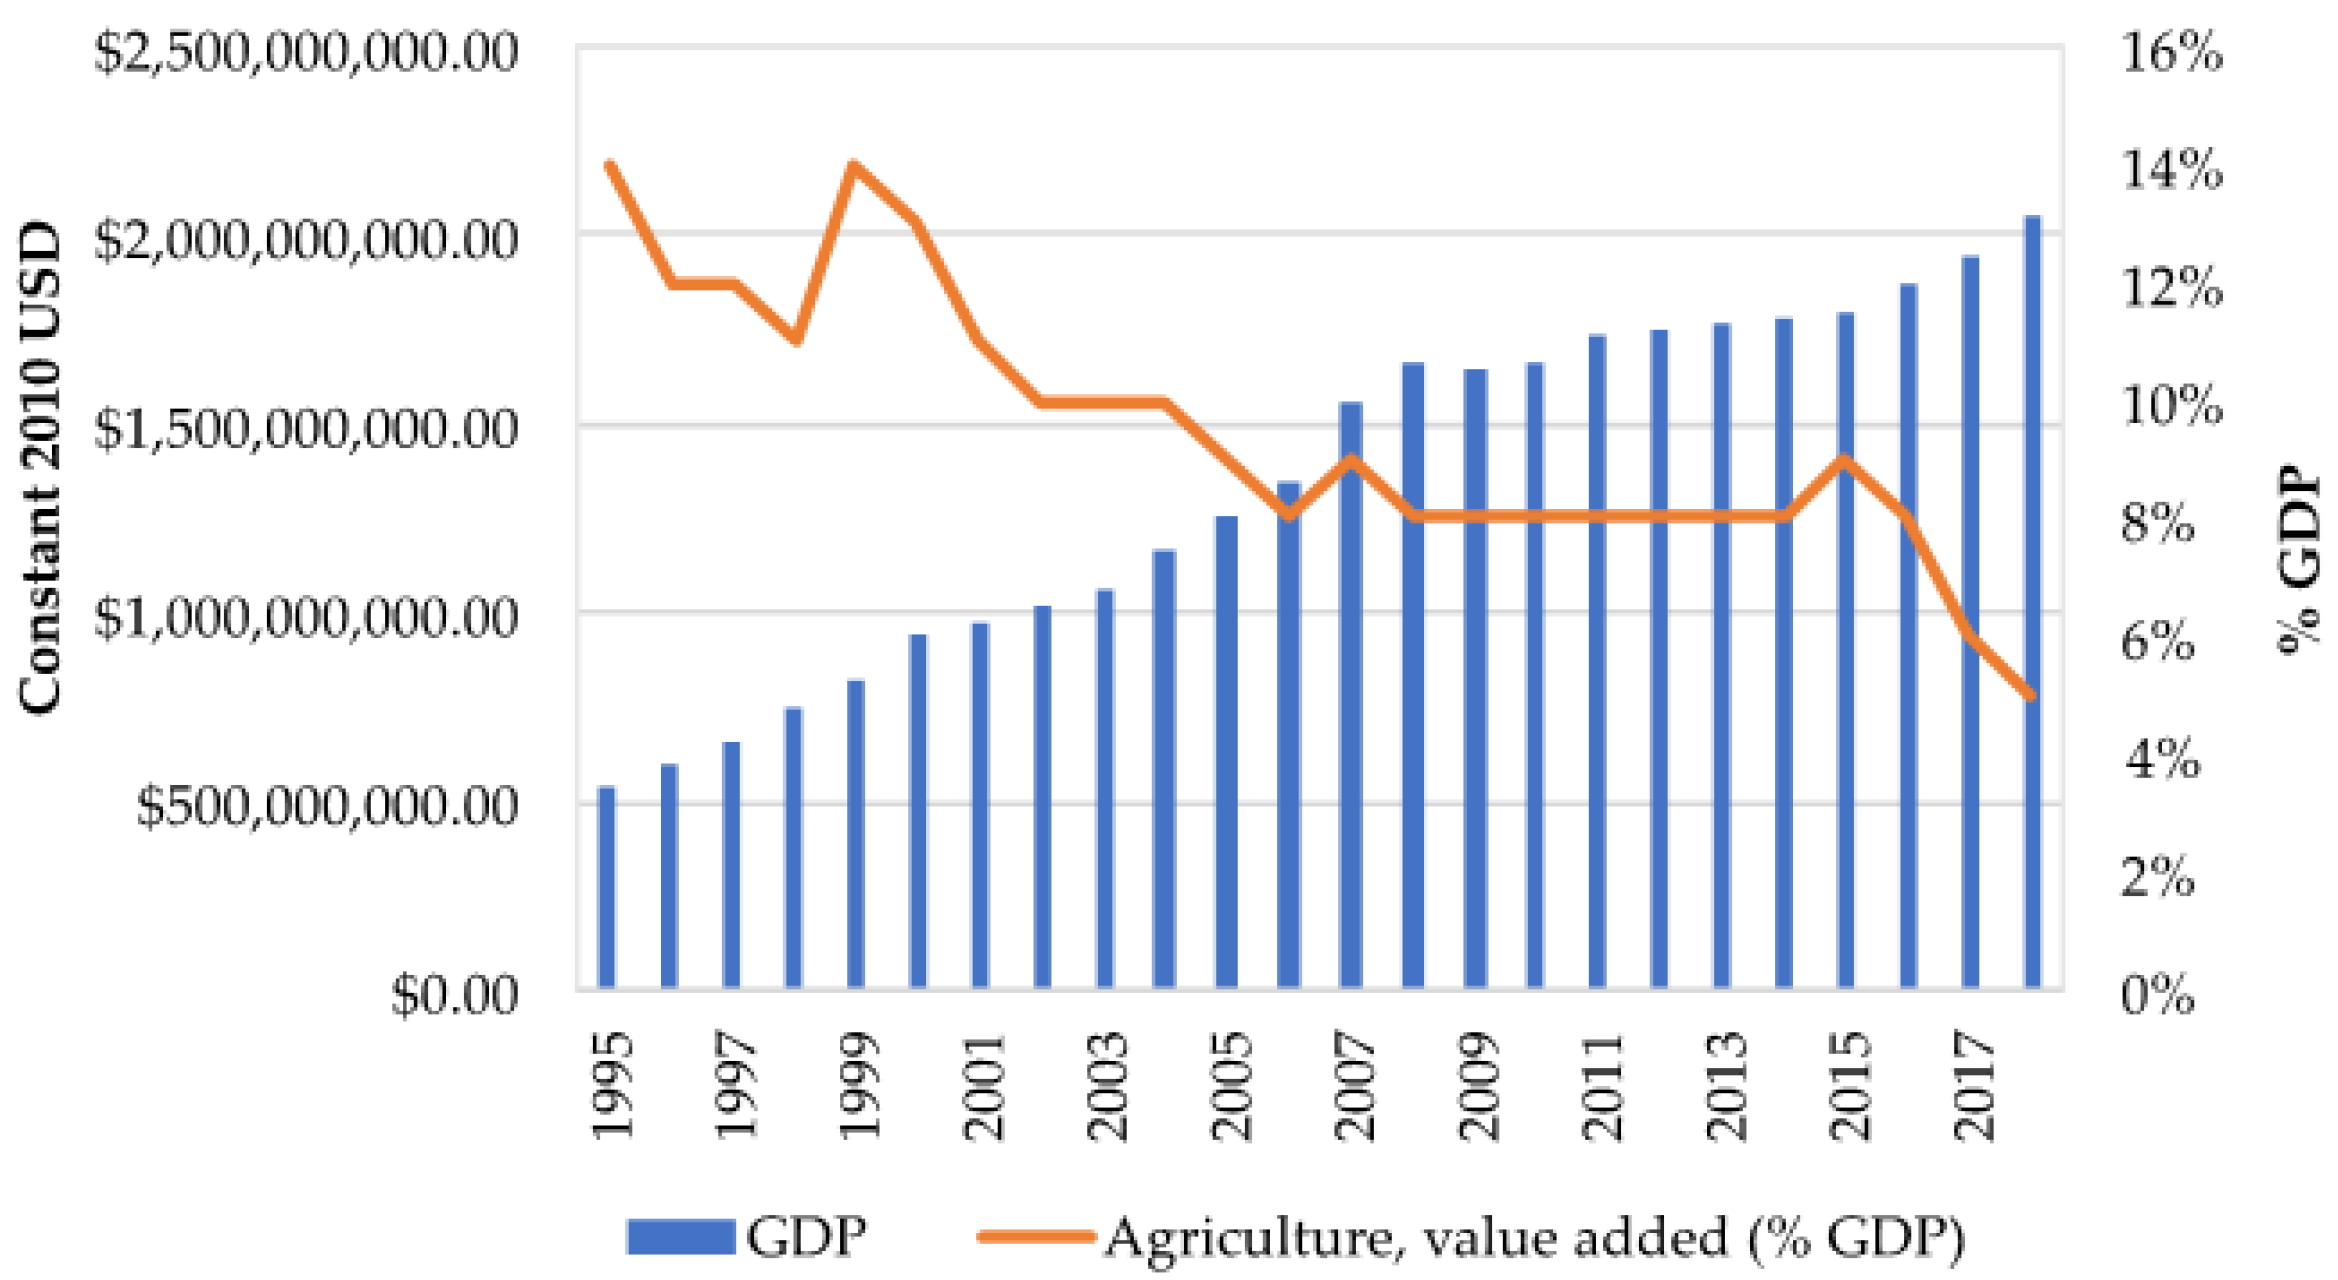
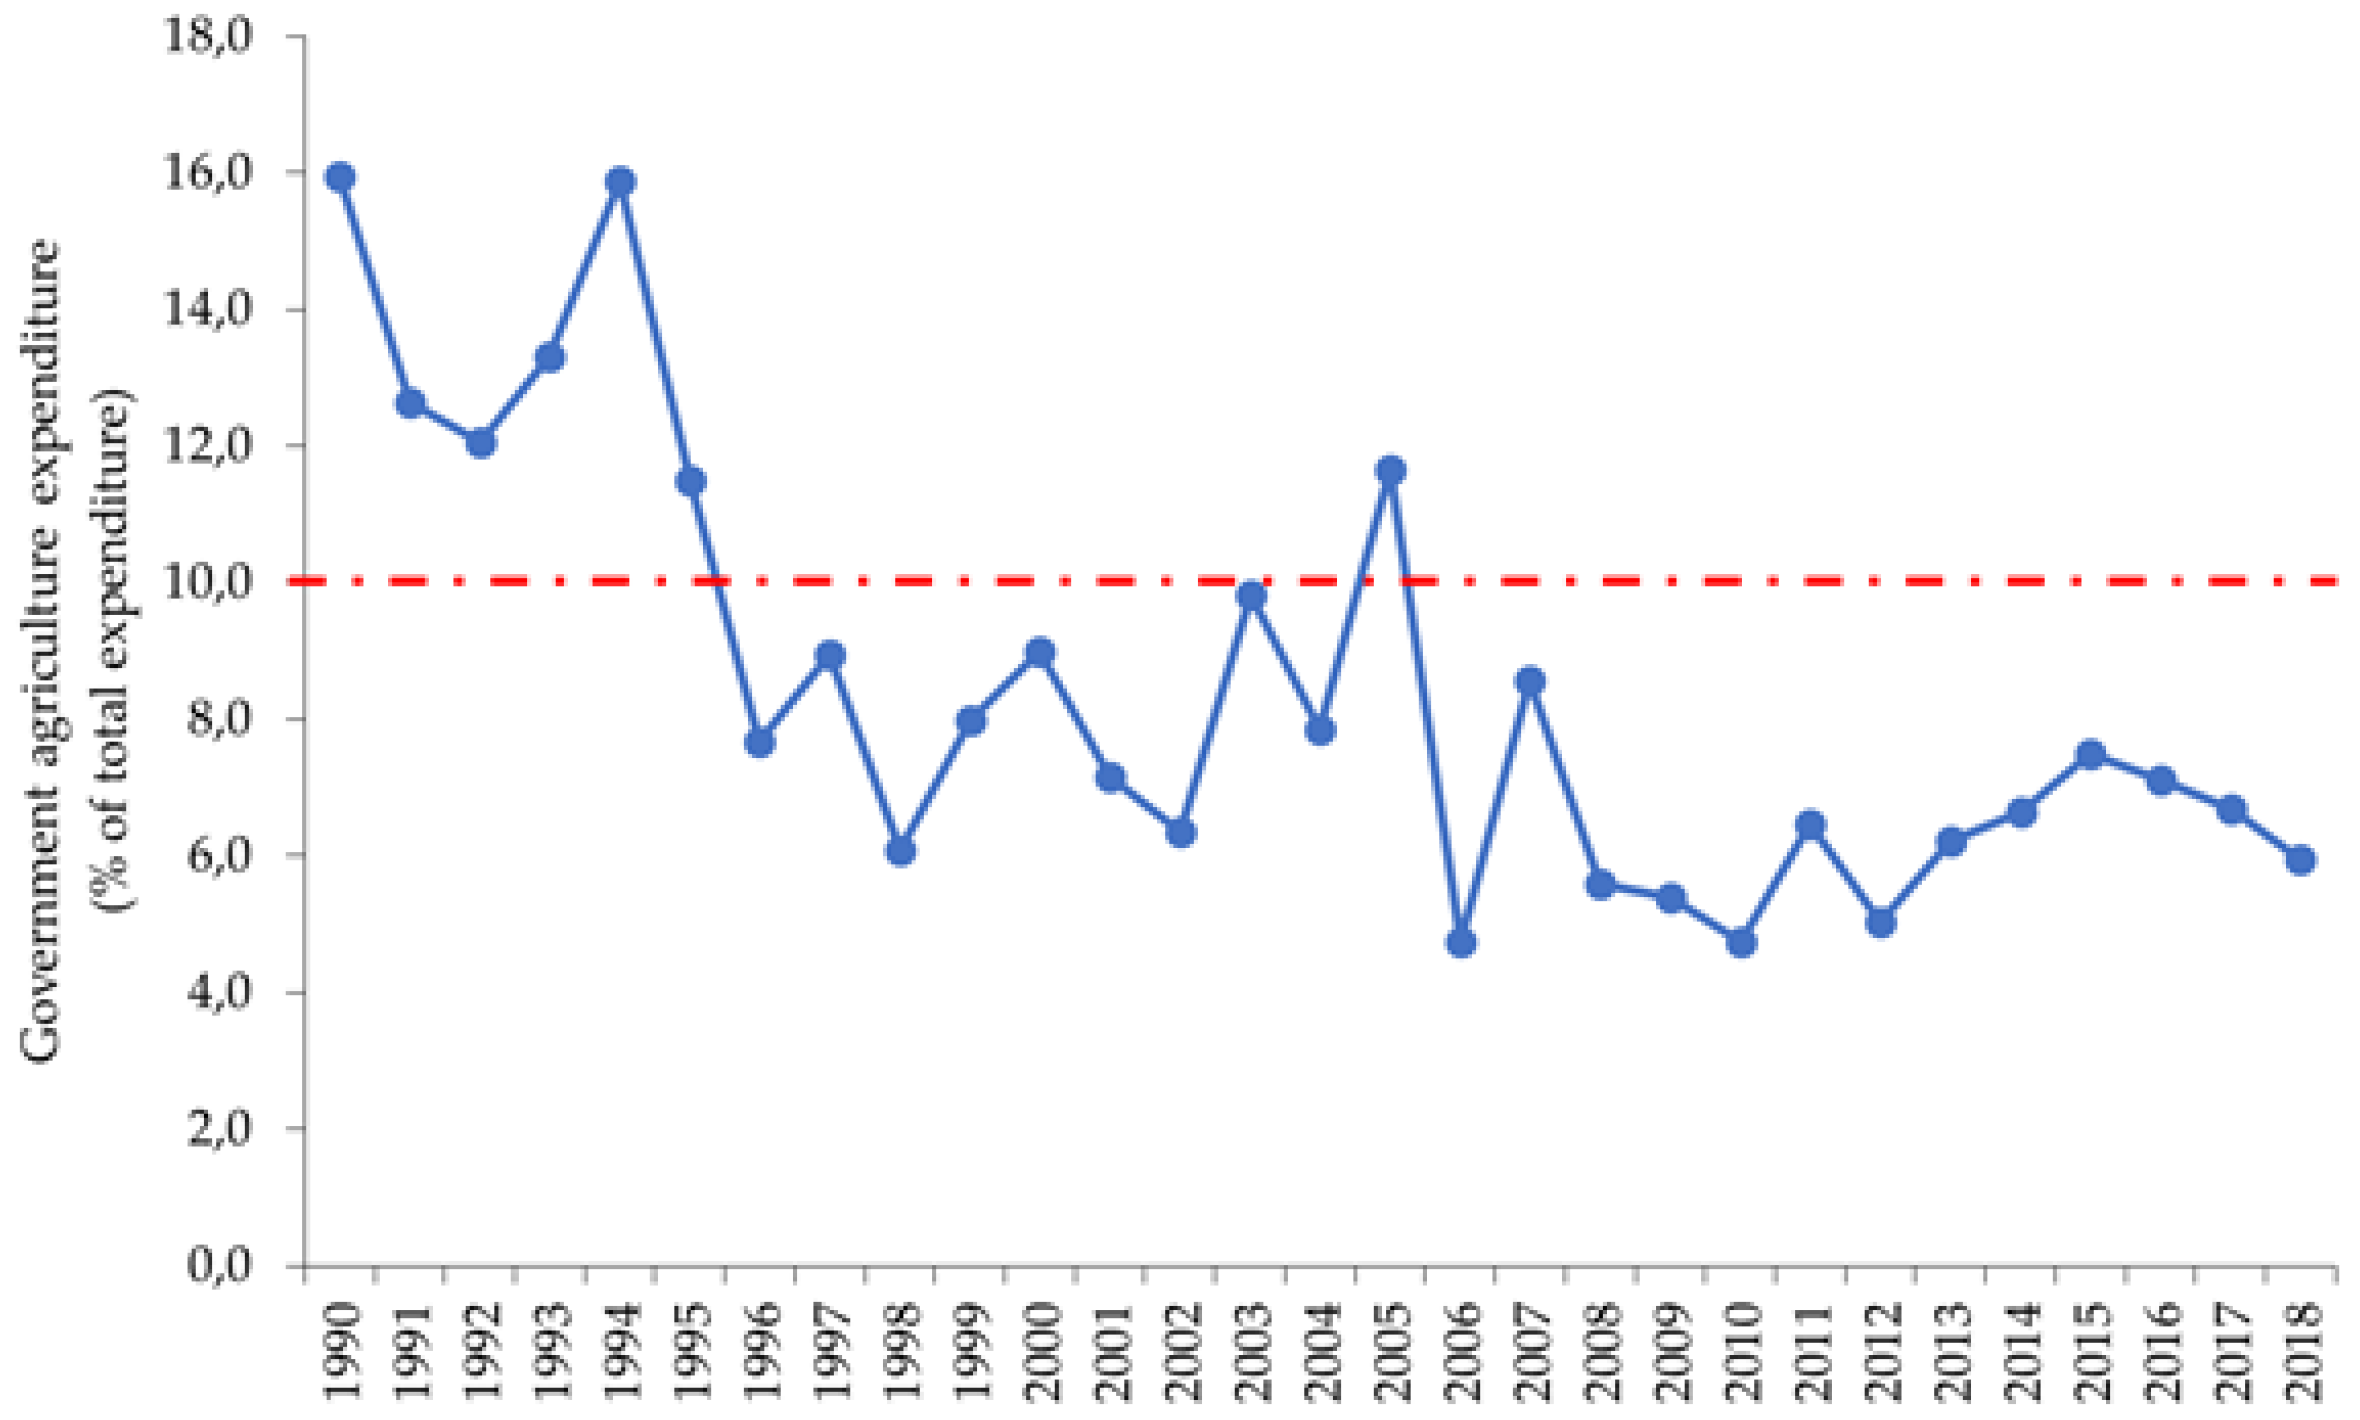
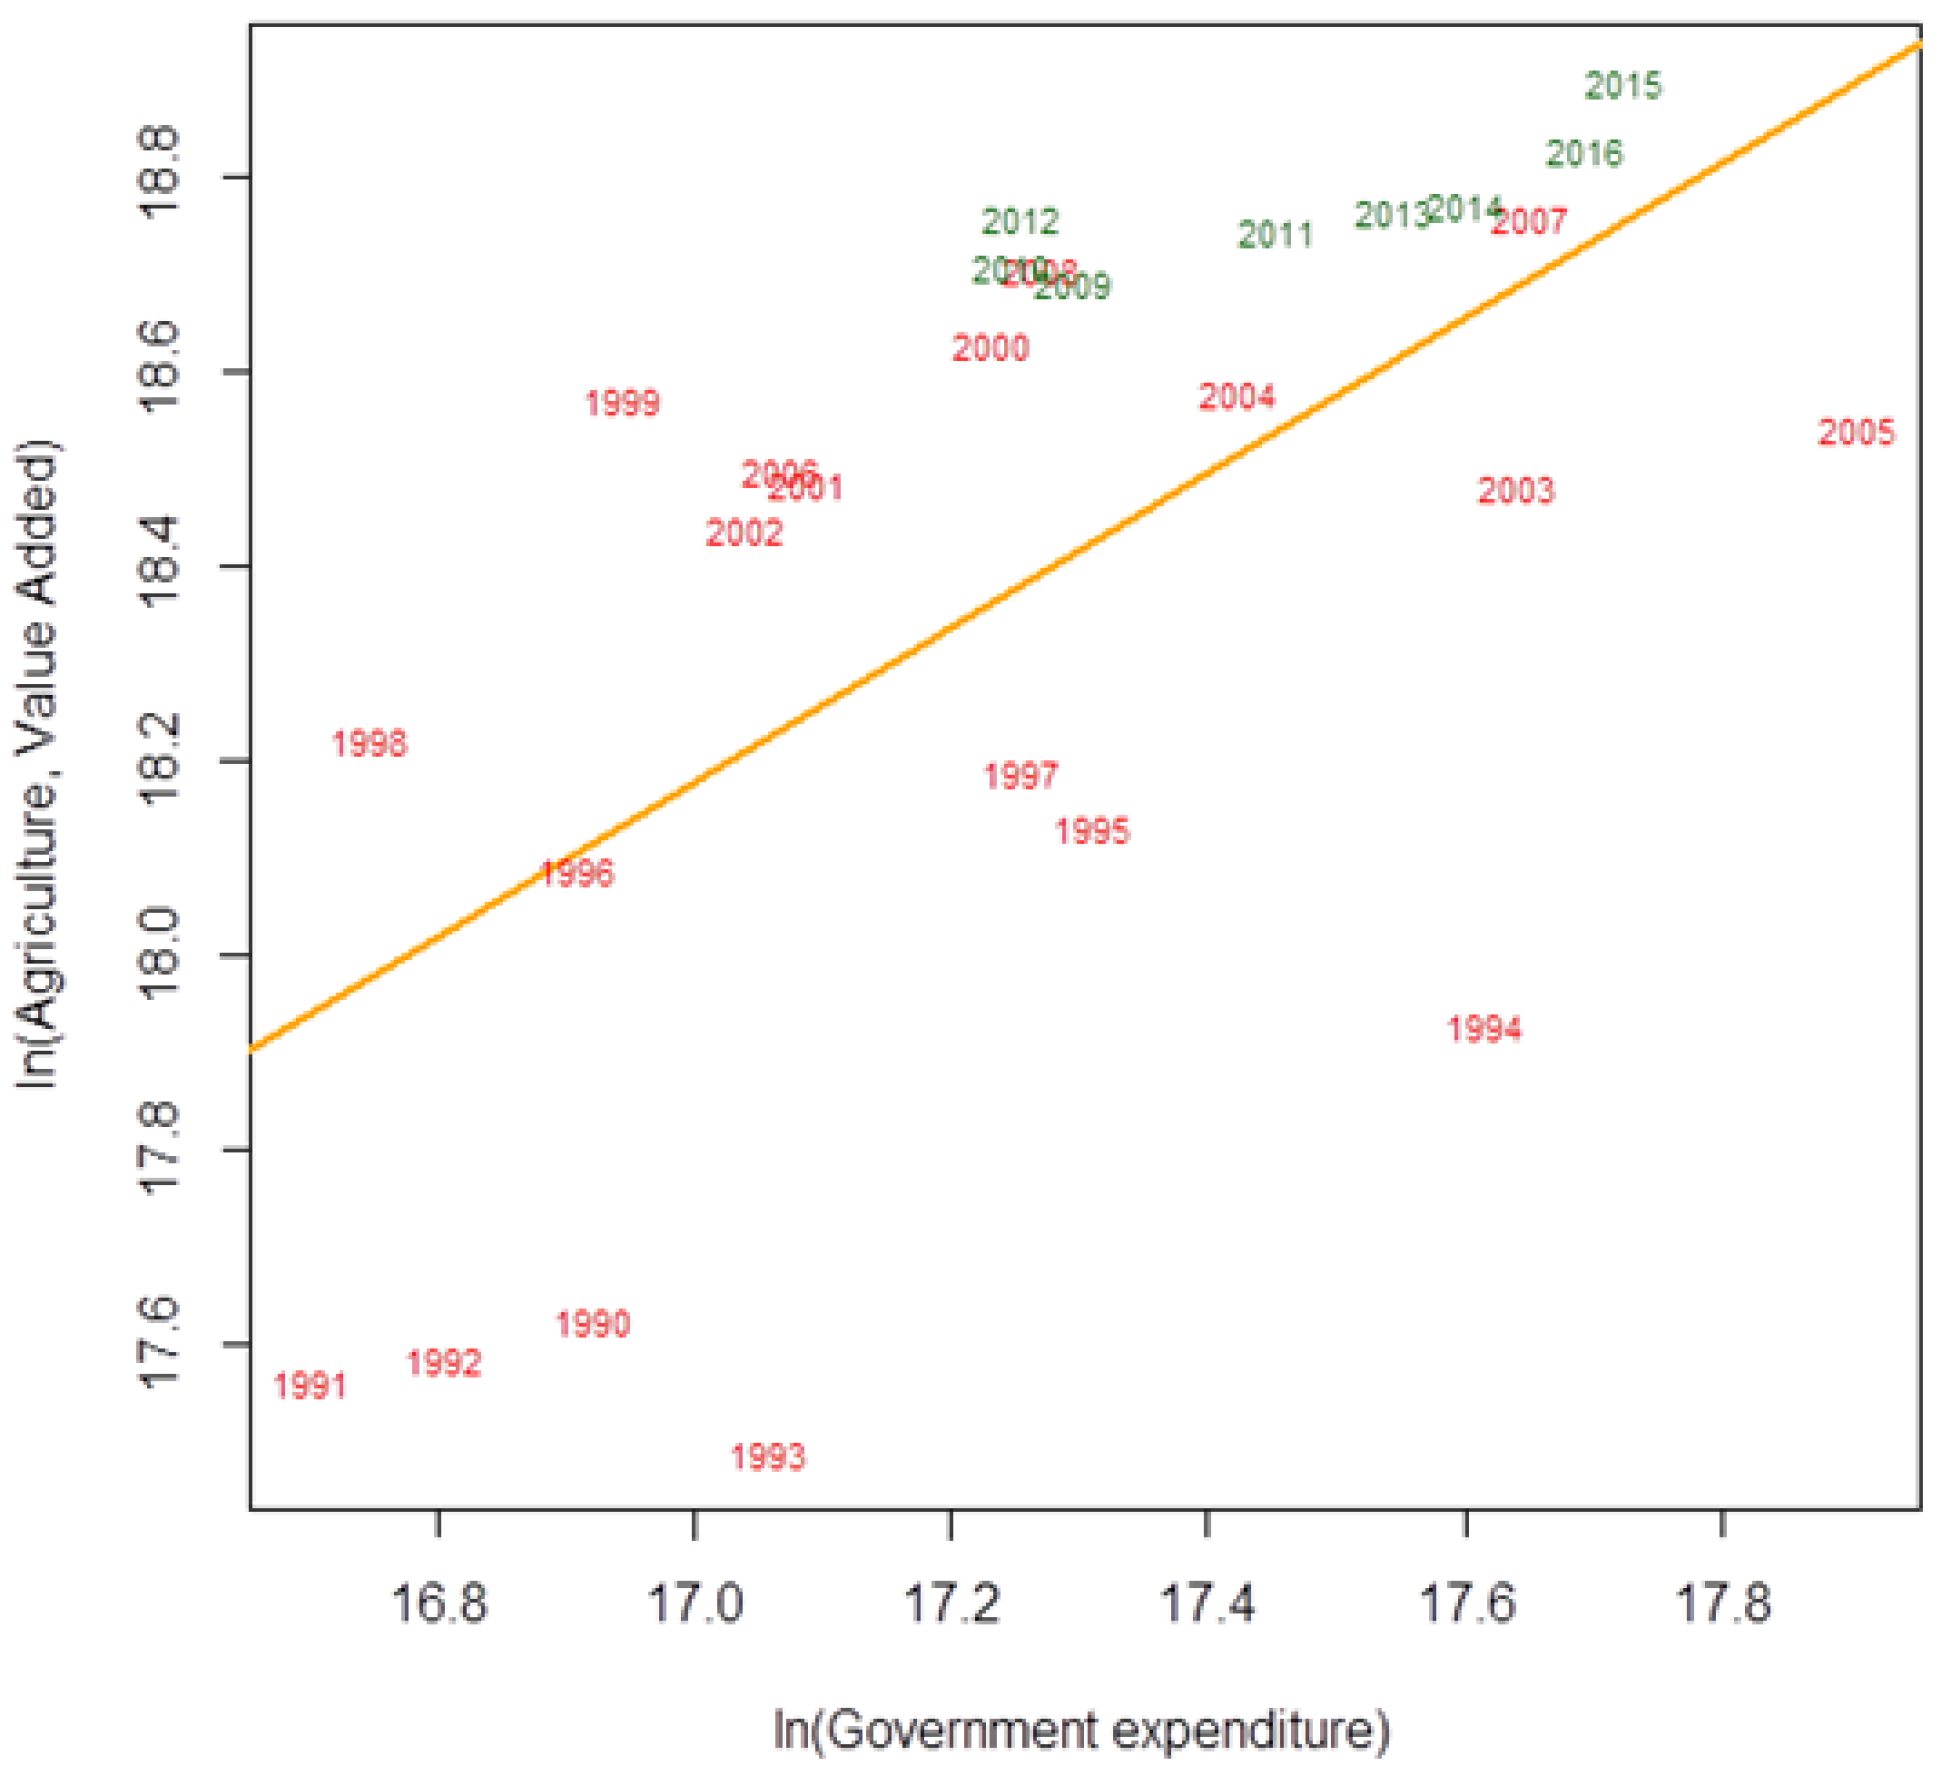
3.3. Impacts of Government Expenditure on Agriculture Production Growth

The variance inflation test performed did not show any multicollinearity problems since all values were below the rule of thumb threshold of 10. A Jarque–Bera normality test ensured compliance with the Gauss–Markov theorem for regression models, while the Breusch–Pagan test for heteroskedasticity showed that variances were not constant. In order to deal with heteroskedasticity, we performed a robust linear regression, as recommended by Wooldrige [49]. The robust linear regression yielded R-squared (coefficient of determination) of 0.50, which means that the estimated regression line explained 50% of the total variation in agriculture production growth (Table 3).
We observed that agriculture production growth is significantly correlated with government agriculture expenditure. Moreover, the coefficient of LnGov_Ae is positive (0.585) and statistically significant at the 1% level. Therefore, it is expected that ceteris paribus, an increase of 10% in government expenditure leads to a rise of 5.73% in agriculture production. One of the main assumptions of the CAADP is that members devote at least 10% of their national budget to agriculture, to achieve the agricultural development goals set by the Malabo Declaration. Government agricultural expenditures from 1990 to 2016 were USD 903.44 million, which corresponds to an average of 8.4% of total government spending. If the government had spent 10%, as stated in the CAADP, it would correspond to a total value of USD 1.31 billion, about USD 410 million more than the investment made. From 2008–2014, public agricultural spending as a share of total public spending was low, but it increased, on average, by 6.68% per year during 2013–2018. A positive relationship between agricultural production, government investment in the sector, and Cabo Verde membership in CAADP policies is depicted in Figure 7.
ECOWAS set those measures as a key strategy toward achieving the Millennium Development Goals of reducing poverty to 50% of its 1990 level by 2015. Therefore, the ECOWAP/CAADP support and add value to the efforts of each member state to ensure that they meet the growth, budgetary, and poverty reduction targets [53,54]. The CAADP dummy variable parameter is also positive (0.363) and statically significant at 1% level (p-value = 0.001). The expected percent increase in agriculture production from not joining CAADP to joining CAADP is about 44%, holding other variables constant, since E X P ( 0.363 ) 1.44 . Regarding the annual precipitation variable, it has been discarded from the model due to non-statistical significance (p-value = 0.228), despite showing a positive coefficient. Several factors may explain the fact that the variable that measures precipitation is not statistically significant, namely the high variability in precipitation between the islands, and also that agricultural activity is concentrated in only three (Santiago, Fogo, and Santo Antão) of the ten islands [26]. The island of Santiago is responsible for 50% of agriculture production and 59.1% of family farms are located there [43]. The precipitation in non-productive island, such as the islands of Sal, Boavista, and São Vicente, have little or zero effect on agriculture production. Bearing in mind that Cabo Verde is one of the most arid countries in the world and rain is poorly distributed over time and space, it is of paramount importance that the government should increase its investment for the mobilization of water to guarantee more consistent agricultural productions in the future. Over the past 27 years, annual rainfall has ranged from 110 mm to 508 mm, with an average of 353 mm/year and a standard deviation of 93 mm. Rainfall variability over the coming decades could be a determining factor for crop diversity and productivity as well as farm practice efficiency, since with rainfall shortage, several current crops may not remain viable if no investments are made into irrigation facilities, while most likely a change to drought-resistant crops could be a more viable scenario [63].

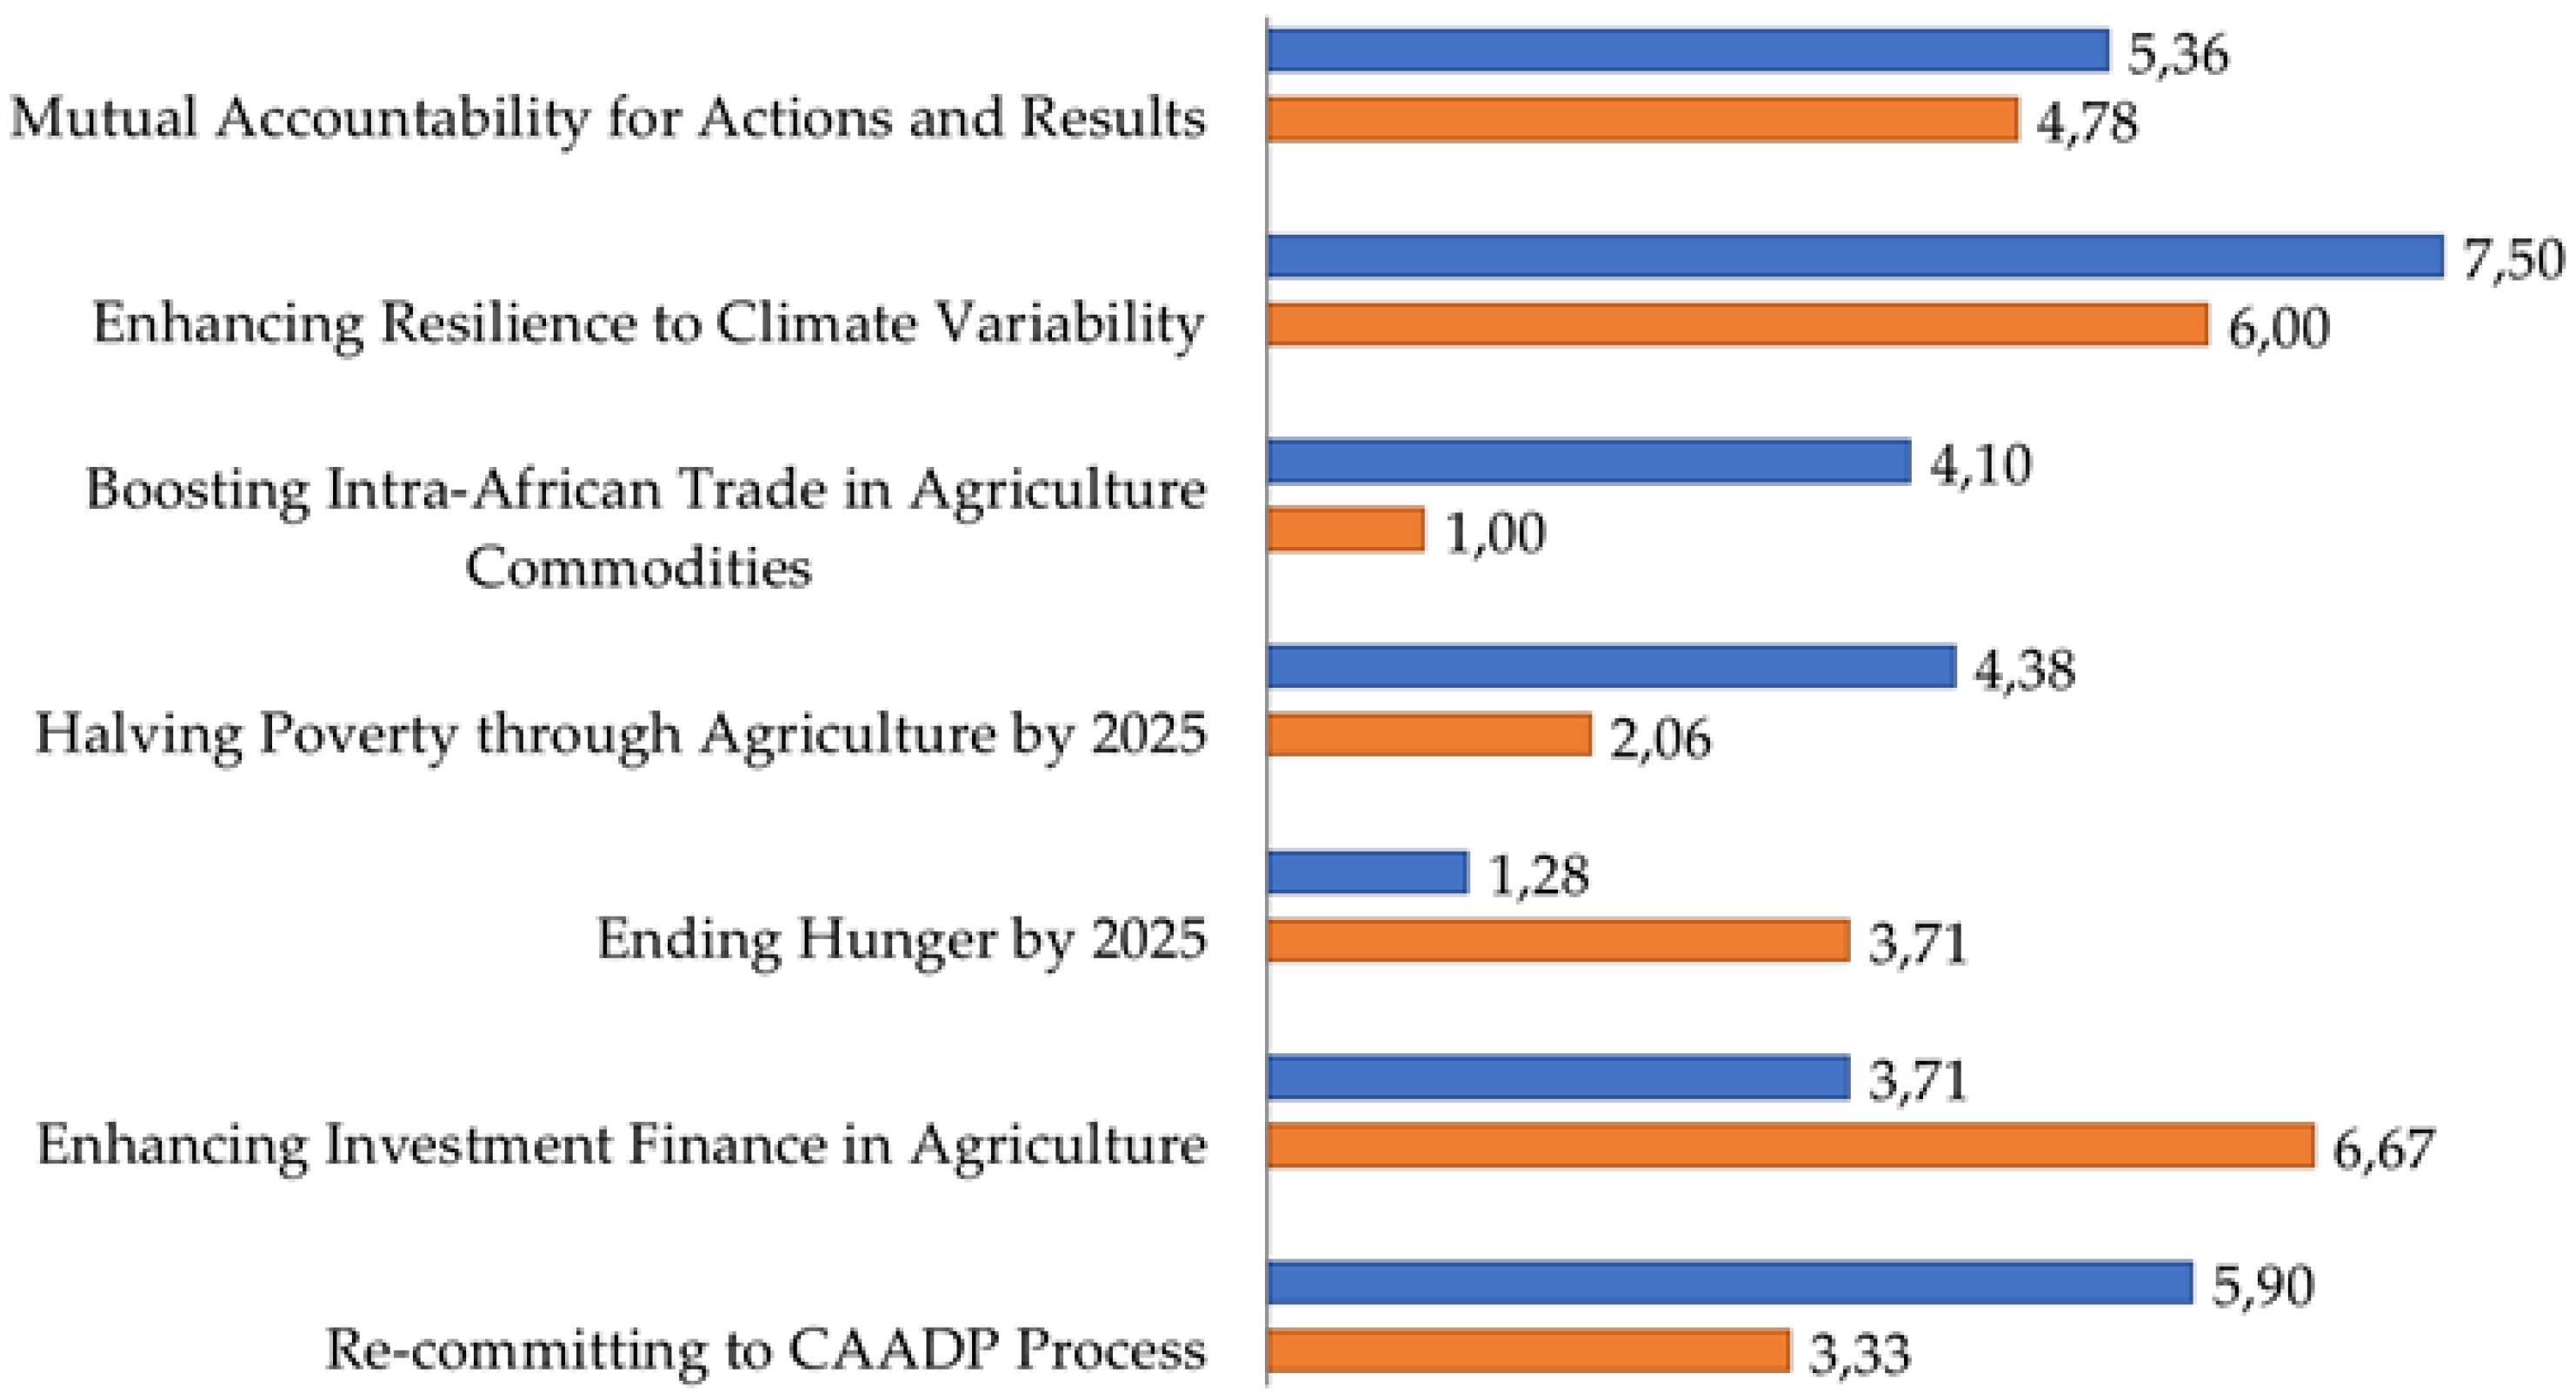
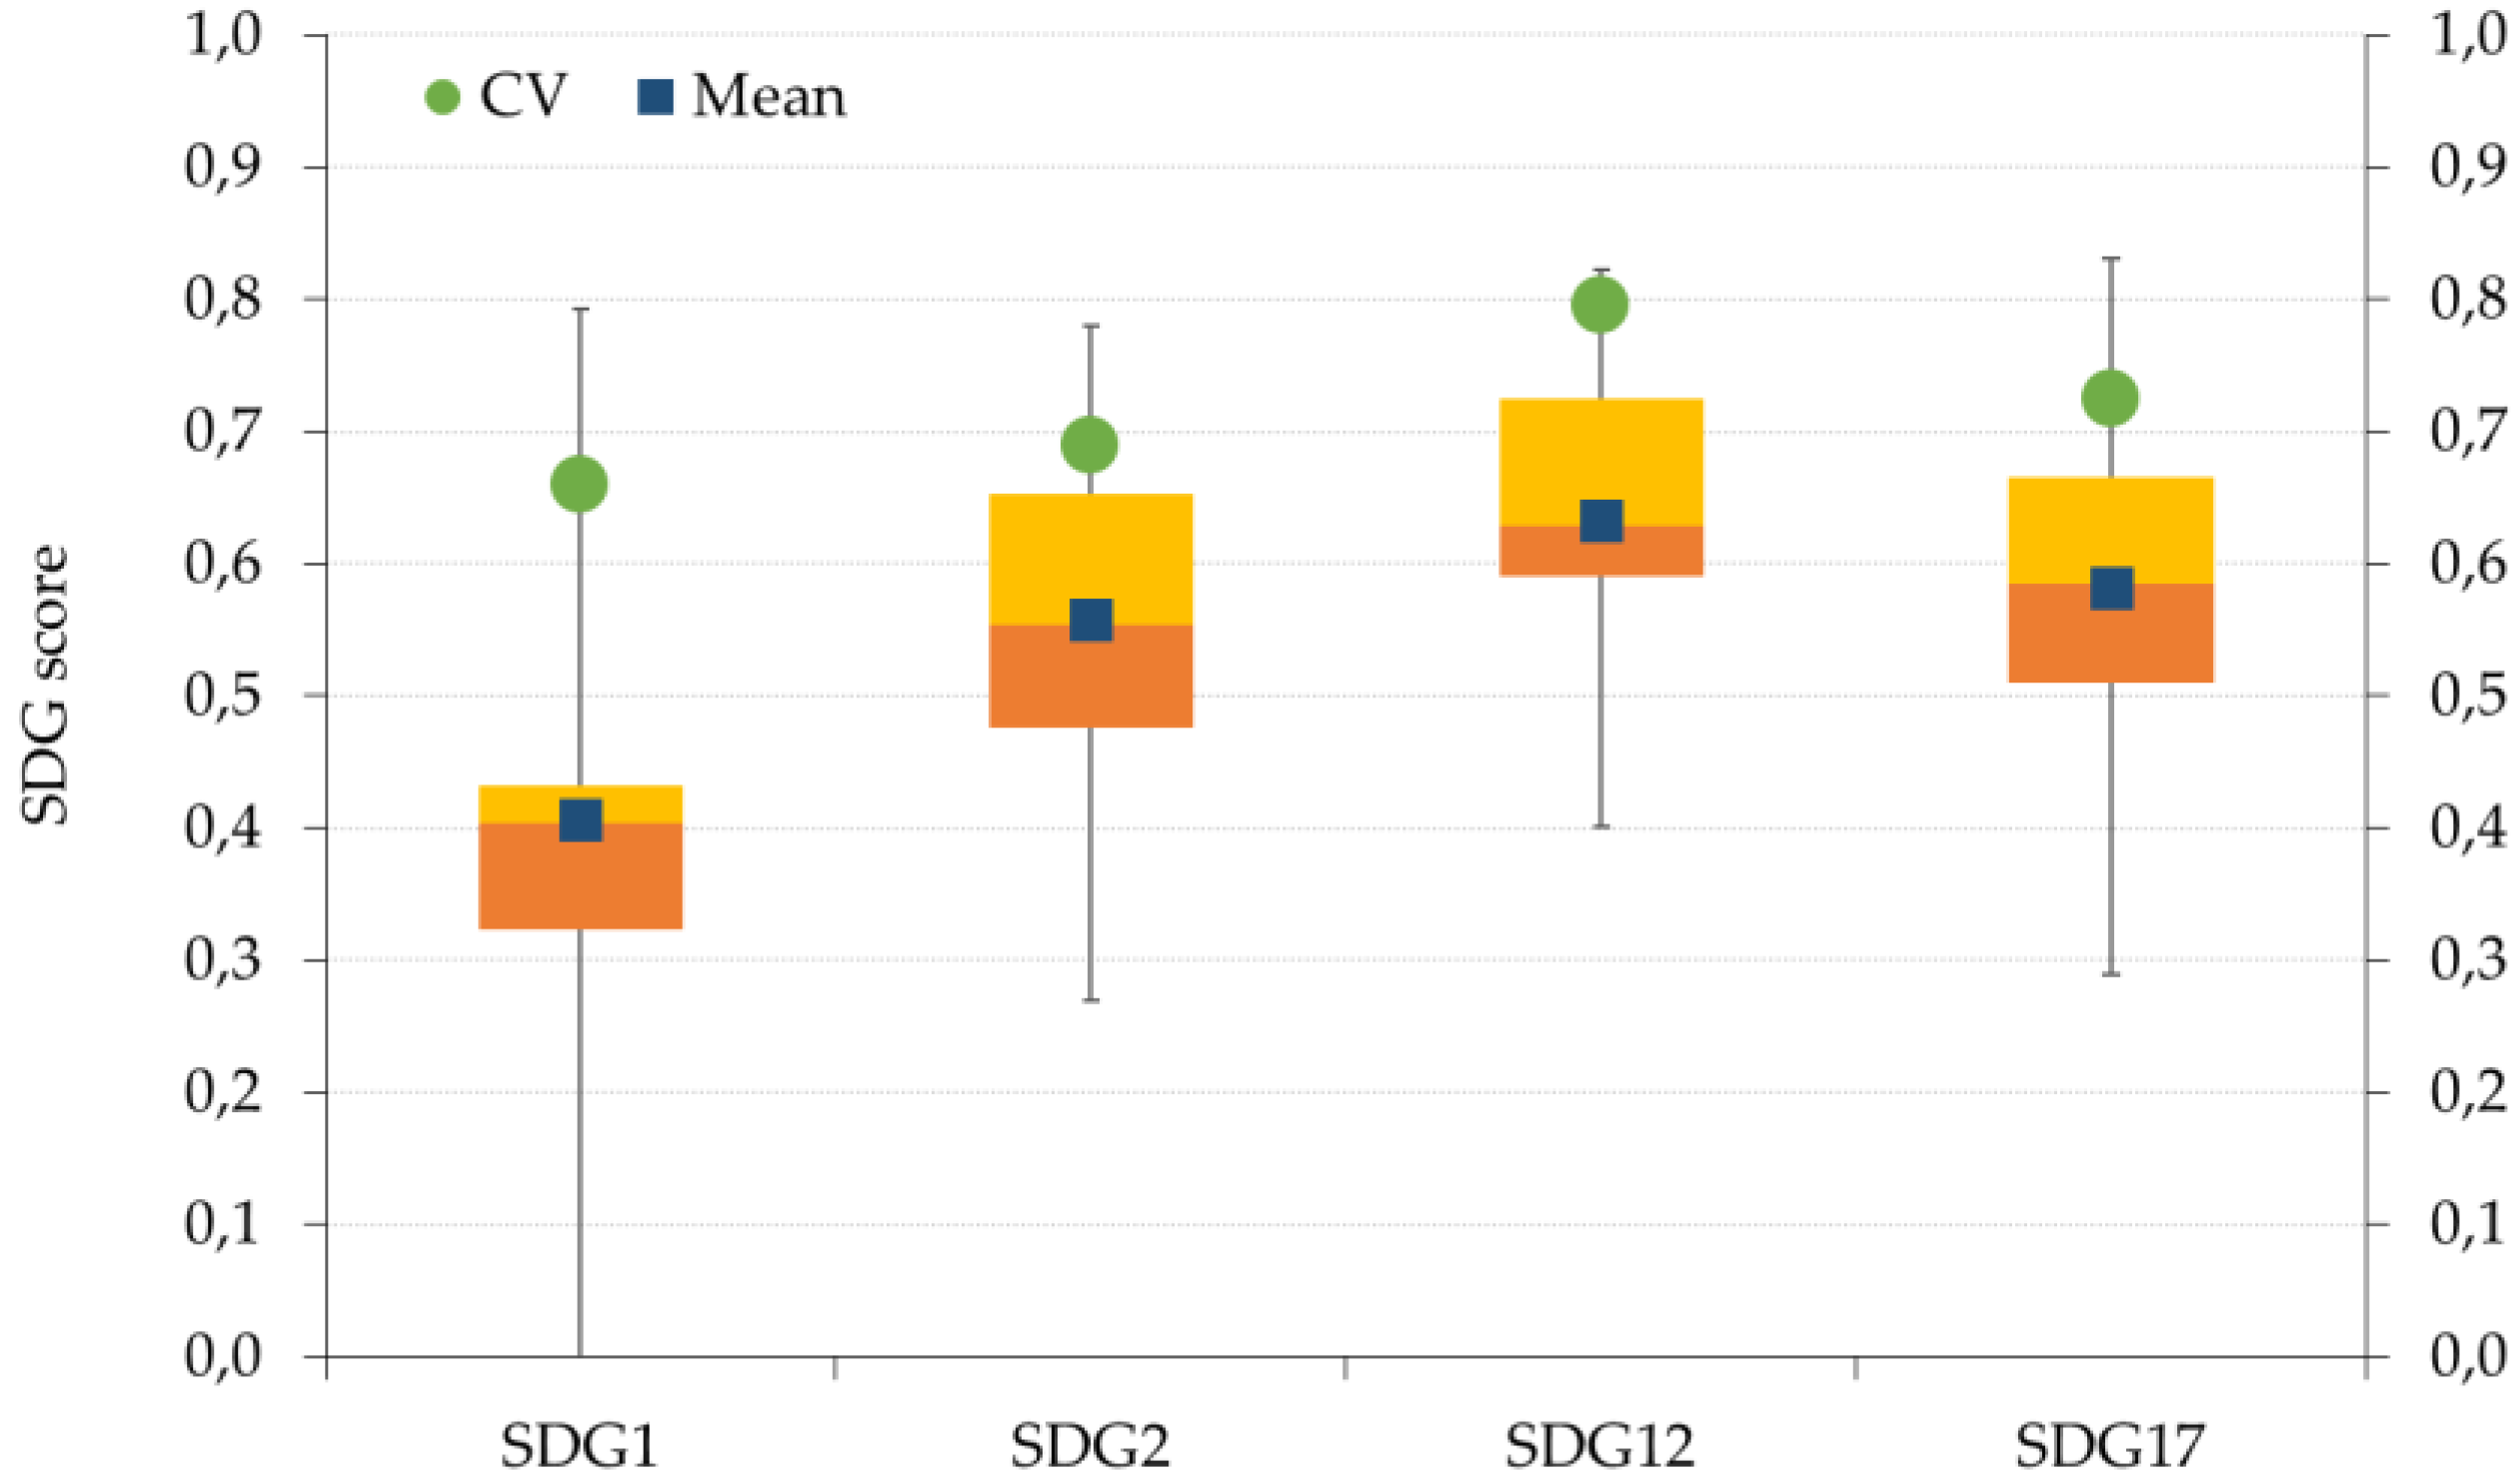
3.4. Agriculture-Based SDGs: Cabo Verde Performance within West Africa

From the 17 SDGs defined by the UN 2030 Agenda, the most important agriculture-related SDGs for Cabo Verde (following [51]) were analyzed (Figure 6). Based on the Africa SDG Index and Dashboards Report 2019 for Africa, a normalization index was calculated for four agriculture-based SDG’s as previously assessed [51] for Cabo Verde and the remaining West African countries, where a mean value has been used.
Overall, Cabo Verde scores regarding the four agriculture-related SDGs are higher than mean values obtained from the remaining West African countries, well above the 25% top West African countries (Figure 8). Such a positive trend highlights that policies adopted to fight poverty (SDG1) and hunger (SDG2) have been progressive in implementing these SDGs. In addition, higher scores for SDG12 and SDG17 in comparison with other West African countries (Figure 8) were assessed. This position is mainly due to Cabo Verde’s economic development, reflected by a high position in tax revenues, the percentage of GDP invested in government health and education, as well as the low level of customs duties in imports, the latter probably in connection with the low import of e-waste.
Cabo Verde’s performance on the 17 SDGs was ranked at 96 in 162 worldwide countries in 2019, data generated by the Sustainable Development Solutions Network (SDSN), which co-produced the 2019 SDG Index and Dashboards report. In our study, by restricting to four agriculture-based SDGs (SDG1, SDG2, SDG12, SDG17), Cabo Verde rises as a top West African country committed towards its implementation to meet 2030 targets. Regarding the selected agriculture-based SDGs, it can be easily depicted that all four SDGs are performing better in comparison to the average of West African countries and with positive prospective trends. These trends may be associated with several governmental actions, which include:
a)
Increasing national policies to improve population livelihoods through securing social protection and household incomes (SDG1);
b)
The National Strategic Plan for the Prevention and Management of Waste, focused on SDG12, which sets an action program for the period from 2015 to 2030, based on the recycling of solid waste;
c)
Several instrumental frameworks enhanced towards the partnerships for incrementing government revenue towards agriculture production growth (SDG 17);
d)
Several agriculture policies to mitigate food shortages and famines (SDG2) in light of historical events and current climate challenges that contribute to fluctuations in agriculture productivity.
On the other hand, SDG2 (Zero Hunger) may be the SDG with a prospective trend that predicts an alarming scenario, due the high dependence on food imports and food self-insufficiency to cope with population and country economic sector needs, namely tourism. Specifically, in the agriculture sector, the rural economy remains at a low, competitive level, mainly due to geographical isolation factors of Cabo Verde archipelago with other continental regions and European markets. Cabo Verde faces a strong challenge considering that food production is not sufficient to cover the population’s requirements, but also due to high remittance of drought events which creates strong fluctuations in agriculture productivity [26]. To counteract these difficulties, Cabo Verde has a wide range of policy guidance instruments aimed at establishing the viable conditions to ensure durable food security, such as the Growth and Poverty Reduction Strategy Paper, a macro-guiding tool for all policies that contribute to the improvement of food security [64]. Other important policies being implemented include the Strategy and the National Program for Food and Nutrition Security, already framed within a broader context at the Community of Portuguese Language Countries (CPLP) level, as well as at the level of the sub-region by joining the Network on the Prevention of Food Crises and the signing of the respective Charter for the Prevention and Management of Food Crises, recently revised and adopted in Conakry.

3.5. Cabo Verde as an Emerging ECOWAS Country: Agriculture and Development

According to the African Development Bank (AfDB), political stability and good governance played a central role in Cabo Verde’s economic success story [65]. The implementation of multi-party democracy with a peaceful transition of power in 1991 and the implementation of a free-market economy have been critical to the development process [65,66]. From 2000 to 2018, Cabo Verde’s HDI value increased from 0.570 to 0.651, an increase of 14.7%, a value above the average of 0.645 for countries in the medium human development group and above the average of 0.537 for countries in SSA. Moreover, in comparison with countries with a similar population size, in 2018, Cabo Verde ranked 126th while São Tomé and Principe and Equatorial Guinea ranked 143th and 141th, respectively [67].
From 2002 to 2017, approximately USD 28 million per year was invested in Cabo Verde agriculture. Major investments relied on the constructions of dams, holes, levees, and other infrastructures targeted to mobilized water for agriculture within the period of 2013–2015, with the management of hydrographic basins in an integrated way in the five river basins providing a total of 315 hectares of agriculture area [57]. Major agriculture policies adopted rely on three different strategic axes: adaptation, mitigation, and productivity (Table S1). Such policies are driven to cope with the major constraints to agriculture development in Cabo Verde, namely, climate changes affecting agriculture productivity. The investments made in the rural areas through the PEDA, POSER and PNIA programs have been important in promoting rural development alongside agriculture sustainable production [43,44,61,62]. According to Badiane et al. [54], the agriculture sector in Cabo Verde has contributed to poverty reduction over time, making the extreme poverty fell by two thirds from 30% in 2001 to 10% in 2015.
Since 2012, POSER has become one of the most extensive agricultural development programs, with a total project financing of about US$ 36,910.506 to be fully invested until 2022. To date, it has had approximately USD 26 million invested in it, namely through the investment in 113 agriculture and 174 livestock projects, to increase agriculture sector resilience. Moreover, through POSER implementation between 2012–2017, a total of 650 farmers have benefited from the funded support, including 419 women and 153 young people [68].
The agriculture sector and its development have contributed to increasing the GDP per capita from USD 110 in 1990 to USD 230 in 2017 [30], and consequently, the value added to GDP grew three-fold from 1990 to 2018. During 2007–2015, agriculture contributed, on average, 7.3% to the GDP. Therefore, the primary sector represents 8.7% of the national wealth, against approximately 17% for the industry and 61% for the tertiary sector. Despite the high number of policies and implementation frameworks to increase agriculture sustainably, Cabo Verde‘s dry and unpredictable climate, the limitation and access to water, and the geomorphology of many of the inhabited islands, are inherent constraints that challenges continuously the development of the agriculture sector. According to the Climate Change Knowledge Portal [63], annual precipitation is one of the most fundamental climatic conditions for rainfed agriculture, which in Cabo Verde accounts for 81.9% of the agriculture practiced involving major subsistence crops [26]. Rainfall variability over the coming decades could be a determining factor for crop diversity and productivity as well as farm practice efficiency, since with rainfall shortage, several current crops may not remain viable if no investments are made into irrigation facilities, while most likely a change to drought-resistant crops could be a more viable scenario [63].
Despite this challenging scenario, policies engaged to mitigate water scarcity (Table S1) conducive to agriculture seem to be on the path to improving and sustaining agriculture development, despite the small amount of land available (about 10% of the total country land area), which includes diversification of agriculture products, improving water resources for agriculture through hydroponics and/or drip irrigation, crop production targeted to irrigated farming and less dependence on rainfed subsistence farming, besides policies focused on preventing food crises due to limited food availability. Through PEDA, the Government invested in 2005 around USD 4,558.26 (416,303.43 ECV) in the development of irrigated agriculture [48,57,62].
Overall, despite Cabo Verde representing a case of success of an insular economy that displayed a positive trend on SDGs supported by the agriculture sector, in comparison with other West African countries, several challenges arise. In order to meet internal food needs, it is necessary to account for the low availability of arable land in conjunction with the predicted decrease in precipitation, which in Cabo Verde is already a prevalent constrain to agriculture productivity. Although the existing policies and frameworks seem to contribute to the Cabo Verde’s current success, other approaches should be considered to aid producers in different future sustainable solutions that could offer the Cabo Verde agricultural sector resilience and competitiveness, such as increasing farmers’ interest in diverse crops, which are drought resistant but with good market value, and/or implementing irrigation techniques at the smallholder level.

4. Final Remarks

In the past decade, the government has adopted policy frameworks to increase domestic agricultural productivity, extend the available arable land for farming, and invest greatly in water resource mobilization, including building dykes and dams, providing microcredits to farmers, and technical support to expand drip irrigation. Between 2008–2014, public agricultural spending as a share of total government expenditure has been low, but it increased, on average, 6.68% per year during 2013–2018. Nevertheless, Cabo Verde’s public expenditure into agriculture under the ECOWAP was generally below the targeted 10% of national budget. We identified several agriculture policies engaged to cope with Cabo Verde’s challenging agriculture sector, but which do not show the desired investment in agriculture—at least 10% of its national budget targeted by ECOWAP. Our results follow the economic literature, showing a positive and statistically significant correlation between government expenditure and agriculture production growth. However, despite its increment it still falls short on internal food needs. We also observed that agriculture-related SDGs in Cabo Verde are higher than the average values obtained from the remaining West African countries, well above the 25% top West African countries. The results show as well that joining the CAADP process lead to an increase in agriculture output by 44%. On the other hand, a strong dependence on food supplies is observed to meet population requirements, due to high food imports and insufficient agriculture productivity to meet internal needs.
Our study highlights a multidisciplinary approach that allowed to track major mechanisms underlying the sustainable development of agriculture in Cabo Verde, and can be seen as a stepping stone towards further research, targeted to identify key variables that may be constraints to its future sustainable development in the long run. New studies should be pursued to determine if the implementation of dam and/or irrigation policies has positively increased crop productivity. There is also a need for further studies to investigate the long-run impact of rainfall, temperature, and irrigation on aggregate agricultural production by agriculture sub-sectors in Cabo Verde through a time series analysis. Besides, crop modeling approaches targeted to current major commodities in Cabo Verde, and to subsistence/local crop varieties, would be valuable to determine the sustainability considering variables such as soil type, productivity, and rainfall. Such approaches should also be targeted to each island where the crop is produced, since dissimilar eco-geographic variables occur.

Supplementary Materials

The following are available online at https://0-www-mdpi-com.brum.beds.ac.uk/2071-1050/12/14/5855/s1, Table S1: Policies for climate and agriculture in Cabo Verde.

Author Contributions

Conceptualization, F.M., M.M.R.; methodology and formal analysis, F.M., D.V., P.V., L.S.; writing—original draft preparation, F.M., D.V., M.M.R.; writing—review and editing, F.M., D.V., P.V., L.S., M.M.R. All authors have approved the submitted version of this manuscript.

Funding

This research was funded by Fundacão para a Ciência e Tecnologia (FCT) and Aga Khan Development Network (AKDN) under the project CVAgrobiodiversity/333111699. Fellowships SFRH/BPD/114664/2016, SFRH/BD/135354/2017 to FM and DV, respectively, were funded by Portuguese National Funds through FCT, Portugal, also to research units: UID/AGR/04129/LEAF (LEAF), UID/BIA/00329/2020 (cE3c).

Acknowledgments

The authors would like to acknowledge the support provided by Fundacão para a Ciência e Tecnologia (FCT) and Aga Khan Development Network (AKDN).

Conflicts of Interest

The authors declare no conflict of interest. The funders had no role in the design of the study; in the collection, analyses, or interpretation of data; in the writing of the manuscript, or in the decision to publish the results.

References

  1. Boliko, M.C. FAO and the situation of food security and nutrition in the world. J. Nutr. Sci. Vitaminol. (Tokyo) 2019, 65, S4–S8. [Google Scholar] [CrossRef]
  2. Dawson, N.; Martin, A.; Sikor, T. Green revolution in Sub-Saharan Africa: Implications of imposed innovation for the wellbeing of rural smallholders. World Dev. 2016, 78, 204–218. [Google Scholar] [CrossRef] [Green Version]
  3. Abbott, K.W.; Bernstein, S. The High-Level political forum on sustainable development: Orchestration by default and design. Glob. Policy 2015, 6, 222–233. [Google Scholar] [CrossRef]
  4. UN. The Millennium Development Goals Report 2015; Way, C., Ed.; United Nations: New York, NY, USA, 2015; ISBN 978-92-1-101320-7. [Google Scholar]
  5. Clemens, M.A.; Kenny, C.J.; Moss, T.J. The trouble with the MDG’s: Confronting expectations of aid and development success. World Dev. 2007, 35, 735–751. [Google Scholar] [CrossRef]
  6. Darrow, M. The millennium development goals: Milestones or millstones? Human rights priorities for the post-2015 development agenda. Yale Hum. Rights Dev. J. 2012, 15, 1–75. Available online: https://digitalcommons.law.yale.edu/yhrdlj/vol15/iss1/3.
  7. Maathai, W. Challenge for Africa. Sustain. Sci. 2011, 6, 1–2. [Google Scholar] [CrossRef]
  8. UN Transforming Our World: The 2030 Agenda for Sustainable Development; A/RES/70/1; United Nations General Assembly: New York, NY, USA, 2015.
  9. Georgeson, L.; Maslin, M. Putting the United Nations sustainable development goals into practice: A review of implementation, monitoring, and finance. Geo. Geogr. Environ. 2018, 5, e00049. [Google Scholar] [CrossRef]
  10. Dodds, F.; Donoghue, A.; Leiva Roesch, J. Negotiating the Sustainable Development Goals; Routledge: London, UK, 2017. [Google Scholar]
  11. DeGhetto, K.; Gray, J.R.; Kiggundu, M.N. The African Union’s agenda 2063: Aspirations, challenges, and opportunities for management research. Africa J. Manag. 2016, 2, 93–116. [Google Scholar] [CrossRef]
  12. Editors Human Rights Law in Africa. Treaty Establishing the African Economic Community. Hum. Rights Law Africa Online 2004, 1, 165–169. [Google Scholar] [CrossRef]
  13. Yansane, A.Y. The economic community of West African States (ECOWAS). Rev. Black Polit. Econ. 1977, 7, 215–237. [Google Scholar] [CrossRef]
  14. Nwangwu, C.; Enyiazu, C.; Nwagwu, E.J.; Ezeibe, C.C. Regionalism in world politics: Interrogating the relevance of the economic community of West African States in global political economy. Cent. Eur. J. Int. Secur. Stud. 2019, 13, 111–132. [Google Scholar]
  15. ECOWAS Commission Regional Agricultural Policy for West Africa: ECOWAP/CAADP. In Proceedings of the International Conference on Financing Regional Agricultural Policy in West Africa (ECOWAP/CAADP), Abuja, Nigeria, 1–12 November 2009; pp. 1–9.
  16. ECOWAS Commission Institutional framework and financial mechanism for the implementation of ECOWAP/CAADP. In Proceedings of the International Conference on Financing Regional Agricultural Policy in West Africa (ECOWAP/CAADP), Abuja, Nigeria, 1–12 November 2009; pp. 10–12.
  17. ECOWAS Commission Draft Regional Partnership Compact for the Implementation of ECOWAP/CAADP. In Proceedings of the International Conference on Financing Regional Agricultural Policy in West Africa (ECOWAP/CAADP), Abuja, Nigeria, 1–12 November 2009; pp. 1–5.
  18. Engen, L.; Prizzon, A. A Guide to Multilateral Development Banks; Overseas Development Institute, Ed.; Overseas Development Institute: London, UK, 2018. [Google Scholar]
  19. Kaberuka, D.; da Silva, J.G.; Ouédraogo, K.D. Agricultural Growth in West Africa-Market and Policy Drivers; Hollinger, F., Staatz, J.M., Eds.; AfDB and FAO: Rome, Italy, 2015; ISBN 978-92-5-108700-8. [Google Scholar]
  20. Monteiro, F.; Catarino, L.; Batista, D.; Indjai, B.; Duarte, M.; Romeiras, M. Cashew as a high agricultural commodity in West Africa: Insights towards sustainable production in Guinea-Bissau. Sustainability 2017, 9, 1666. [Google Scholar] [CrossRef] [Green Version]
  21. ECOWAS-DAEWR. 2025 Strategic Policy Framework; ECOWAS-DAEWR: Abuja, Nigeria, 2017. [Google Scholar]
  22. UNDP. Uganda Human Development Report 2007-Rediscovering Agriculture for Human Development; United Nations Development Programme: Kampala, Uganda, 2007. [Google Scholar]
  23. UNDP. Human Development Report 2019-Beyond Income, Beyond Averages, Beyond Today: Inequalities in Human Development in the 21st Century; United Nations Development Programme: Kampala, Uganda, 2019. [Google Scholar]
  24. Nurudeen, A.; Karim, M.Z.A.; Aziz, M.I. Corruption, political instability and economic development in the Economic Community of West African States (ECOWAS): Is there a causal relationship? Contemp. Econ. 2015, 9, 45–60. [Google Scholar] [CrossRef] [Green Version]
  25. Morris, R.; Cattaneo, O.; Poensgen, K. Transition Finance in Least Developed Countries and Small Island Developing States: Cabo Verde Country Pilot.; DCD/DAC(2019)4; OECD Publishing: Paris, France, 2019. [Google Scholar]
  26. Monteiro, F.; Fortes, A.; Ferreira, V.; Pereira Essoh, A.; Gomes, I.; Correia, A.M.; Romeiras, M.M. Current status and trends in Cabo Verde agriculture. Agronomy 2020, 10, 74. [Google Scholar] [CrossRef] [Green Version]
  27. UNCTAD Least Developed Countries Report 2019. The Present and Future of External Development Finance–Old Dependence, New Challenges; United Nations: New York, NY, USA, 2019; ISBN 978-92-1-112960-1. [Google Scholar]
  28. Rodriguez, R. ECOWAS. The Economic Community of West African States, 1st ed.; Lulu Press: Morrisville, CN, USA, 2011; ISBN 978-1-105-17372. [Google Scholar]
  29. Rhodes, E.R.; Atewamba, C. Climate change impact chain factors in ECOWAS. J. Agric. Environ. Int. Dev. 2018, 112, 35–78. [Google Scholar] [CrossRef]
  30. World Bank DataBank, World Development Indicators. Available online: https://databank.worldbank.org/source/world-development-indicators (accessed on 5 May 2020).
  31. Romeiras, M.M.; Catarino, S.; Gomes, I.; Fernandes, C.; Costa, J.C.; Caujapé-Castells, J.; Duarte, M.C. IUCN red list assessment of the Cape Verde endemic flora: Towards a global strategy for plant conservation in Macaronesia. Bot. J. Linn. Soc. 2016, 180, 413–425. [Google Scholar] [CrossRef] [Green Version]
  32. Romeiras, M.M.; Duarte, M.C.; Santos-Guerra, A.; Carine, M.; Francisco-Ortega, J. Botanical exploration of the Cape Verde Islands: From the pre-Linnaean records and collections to late 18th century floristic accounts and expeditions. Taxon 2014, 63, 625–640. [Google Scholar] [CrossRef]
  33. Neto, C.; Costa, J.C.; Figueiredo, A.; Capelo, J.; Gomes, I.; Vitória, S.; Semedo, J.M.; Lopes, A.; Dinis, H.; Correia, E.; et al. The role of climate and topography in shaping the diversity of plant communities in Cabo Verde Islands. Diversity 2020, 12, 80. [Google Scholar] [CrossRef] [Green Version]
  34. Romeiras, M.M.; Pena, A.R.; Menezes, T.; Vasconcelos, R.; Monteiro, F.; Paulo, O.S.; Moura, M. Shortcomings of phylogenetic studies on recent radiated insular groups: A meta-analysis using Cabo Verde biodiversity. Int. J. Mol. Sci. 2019, 20, 2782. [Google Scholar] [CrossRef] [Green Version]
  35. Varela-Lopes, G.E.; Molion, L.C.B. Precipitation patterns in Cape Verde Islands: Santiago Island case study. Atmos. Clim. Sci. 2014, 04, 854–865. [Google Scholar] [CrossRef] [Green Version]
  36. Carreira, P.M.; Marques, J.M.; Pina, A.; Mota Gomes, A.; Galego Fernandes, P.A.; Monteiro Santos, F. Groundwater Assessment at Santiago Island (Cabo Verde): A multidisciplinary approach to a recurring source of water supply. Water Resour. Manag. 2010, 24, 1139–1159. [Google Scholar] [CrossRef]
  37. Corral, S.; Díaz, A.; Monagas, M.; García, E. Agricultural policies and their impact on poverty reduction in developing countries: Lessons learned from three water basins in Cape Verde. Sustainability 2017, 9, 1841. [Google Scholar] [CrossRef] [Green Version]
  38. IFPRI. International Food Policy Research Institute. Regional Strategic Analysis and Knowledge System (ReSAKSS); International Food Policy Research Institute: Washington, DC, USA, 2018. [Google Scholar]
  39. INE-CV Instituto Nacional de Estatística-Cabo Verde, Praia, Ilha de Santiago. Available online: http://ine.cv/ (accessed on 5 April 2020).
  40. INE-CV. Cabo Verde-Inquérito às Despesas e Receitas Familiares (IDRF). Condições de Vida., DDI-CV-INE-IDRF-2001/02-v01, Praia, Cabo Verde, Ilha de Santiago 2002. Available online: http://www.ine.cv/dircv/index.php/catalog/15/relat (accessed on 10 April 2020).
  41. INE-CV. Questionário Unificado de Indicadores Básicos De Bem-Estar; Praia: Ilha de Santiago, Cabo Verde, 2007. [Google Scholar]
  42. INE-CV. Projecções Demográficas de Cabo Verde 2010-2030; Praia: Ilha de Santiago, Cabo Verde, 2013. [Google Scholar]
  43. Grupo de Trabalho. Sector da Agricultura Relatório de Elaboração, DECRP-III/2012-2016. Available online: http://www.caboverde-info.com/content/download/6423/54938/version/8/file/Agro-Nego%CC%81cios+24+de+Julho+2012+%5BMemorando%5D+%283%29.pdf (accessed on 3 April 2020).
  44. Ministério de Agricultura e Ambiente. V Recenseamento Geral da Agricultura 2015; Instituto Nacional de Estatística Cabo Verde; Praia: Ilha de Santiago, Cabo Verde, 2017. [Google Scholar]
  45. Ministry of Finance (Ministerio das Financas). Ministério das Financas de Cabo Verde Plano Estratégico de PEDS Desenvolvimento Sustentável 2017/2021; Praia: Ilha de Santiago, Cabo Verde, 2017. [Google Scholar]
  46. Trade and Markets Division of FAO. Crop Prospects and Food Situation-Quarterly Global Report; GIEWS, Ed.; Global Information and Early Warning System on Food and Agriculture (GIEWS): Rome, Italy, 2018; ISBN 978-92-5-130599-7. [Google Scholar]
  47. FAO. Implications of Economic Policy for Food Security: A Training Manual. Available online: http://www.fao.org/docrep/004/x3936e/x3936e03.htm (accessed on 7 April 2020).
  48. Johansson, E.; Tretow, E. Modeling Economic Output and Economic Growth with respect to Economic Freedom: A comparative study of developing and developed countries; Applied Mathematics and Industrial Economics-SCI School of Engineering Sciences: Stockolm, Sweden, 2015. [Google Scholar]
  49. Wooldridge, J.M. Introductory Econometrics: A Modern Approach, 5th ed.; Joyner, E., Sabatino, J., Worls, M., Warwick, J., Beiting-Lipps, L., Eds.; Mason, South-Western Cengage Learning: Boston, MD, USA, 2013; ISBN 9781111531041. [Google Scholar]
  50. Lütkepohl, H.; Xu, F. The role of the log transformation in forecasting economic variables. Empir. Econ. 2012, 42, 619–638. [Google Scholar] [CrossRef] [Green Version]
  51. Nhemachena, C.; Matchaya, G.; Nhemachena, C.; Karuaihe, S.; Muchara, B.; Nhlengethwa, S. Measuring baseline agriculture-related sustainable development goals. Index for Southern Africa. Sustainability 2018, 10, 849. [Google Scholar] [CrossRef] [Green Version]
  52. Lafortune, G.; Fuller, G.; Moreno, J.; Schmidt-Traub, G.; Kroll, C. Detailed Methodological paper;—SDG Index and Dashboards. Available online: https://github.com/sdsna/2018GlobalIndex/raw/master/2018GlobalIndexMethodology.pdf (accessed on 30 January 2020).
  53. ECOWAS Agriculture and Food in West. Africa: Trends, Performances and Agricultural Policies; ECOWAS Commission: Abuja, Nigeria, 2015. [Google Scholar]
  54. Badiane, O.; Odjo, S.P.; Wouterse, F. Macro-economic models: Comparative Analysis of Strategies and Long Term Outlook for Growth and Poverty Reduction Among ECOWAS Member Countries. In Development Policies and Policy Processes in Africa. Advances in African Economic, Social and Political Development; Henning, C., Badiane, O., Krampe, E., Eds.; Springer: Heidelberg, Germany, 2018; pp. 21–47. [Google Scholar]
  55. Benin, S.; Ulimwengu, J.M.; Tefera, W. The CAADP Inaugural Biennial Review and Africa Agricultural Transformation Scorecard: Results and Areas for Improvement; Discussion Paper 01754; International Food Policy Research Institute (IFPRI): Washington, DC, USA, 2018. [Google Scholar]
  56. African Union Development Agency Cape Verde. Available online: https://www.nepad.org/caadp/countries/cape-verde (accessed on 10 April 2020).
  57. The Government of Cabo Verde. Governo de Cabo Verde SDG Cabo Verde-Voluntary National Report on the Implementation of the 2030 Agenda for Sustainable Development; Publication 10/2016; Prime Minister’s Office Publication: Helsinki, Finland, 2018. [Google Scholar]
  58. FAO. ICRISAT Climate-Smart Agriculture in Cabo Verde. In CSA Country Profiles for Africa Series; International Center for Tropical Agriculture (CIAT), International Crops Research Institute for the Semi-Arid Tropics (ICRISAT), Food and Agriculture Organization of the United Nations (FAO), Eds.; Food and Agriculture Organization of the United Nations (FAO): Rome, Italy, 2019; p. 22. [Google Scholar]
  59. Maur, J.-C.; Shepherd, B. Connecting Food Staples and Input Markets in West. Africa: A Regional Trade Agenda for ECOWAS Countries; Report No. 97279-AFR.; The International Bank for Reconstruction and Development/The World Bank: Washington, DC, USA, 2015. [Google Scholar]
  60. Ministério das Finanças de Cabo Verde. Proposta do Orçamento de Estado 2020; Governo de Cabo Verde: Praia, Cabo Verde, 2020. [Google Scholar]
  61. Governo de Cabo Verde. Strategic Plan. for Agriculture Development-Cabo Verde; Plano Estratégico de Desenvolvimento Sustentável; Governo de Cabo Verde: Praia, Cabo Verde, 2018. [Google Scholar]
  62. IFAD. Republic of Cabo Verde Country Strategic Opportunities Programme (2019–2024). 2018. EB 2018/125/R.31. Available online: https://webapps.ifad.org/members/eb/125/docs/EB-2018-125-R-31.pdf?attach=1 (accessed on 5 May 2020).
  63. World Bank Climate Change Knowledge Portal (CCKP). Available online: https://climateknowledgeportal.worldbank.org/ (accessed on 23 April 2020).
  64. International Monetary Fund. Cape Verde: Poverty Reduction Strategy Paper; Poverty Reduction Strategy Papers (PRSPs); International Monetary Fund: Washington, DC, USA, 2004. [Google Scholar]
  65. African Development Bank. AfDB. Cape Verde: A success Story; Praia, Cabo Verde, Ilha de Santiago, November 2012, pp. 1–62. Available online: https://www.afdb.org/sites/default/files/documents/projects-and-operations/cape_verde_-_a_success_story.pdf (accessed on 20 March 2020).
  66. Graham, S.; Graham, V. The quality of elections in african small island developing states there. Cell 2008, 151, 1–46. [Google Scholar] [CrossRef] [Green Version]
  67. UNDP. Human Development Indices and Indicators 2019: Statistical Update; United Nations: New York, NY, USA, 2018; ISBN 9789210474313. [Google Scholar]
  68. IFAD. Cabo Verde Rural Socio-economic Opportunities Programme Supervision Report. Available online: https://www.ifad.org/documents/38711644/40046455/Cabo%20Verde%201100001604:%20POSER%20Supervision%20Report%20March%202019/911f2d3e-e496-ee8d-3ff0-55df04dbbacf (accessed on 23 April 2020).
Figure 1. ECOWAS map. The member countries represented on a color scale from light blue (smallest number of inhabitants) to dark blue (largest number of inhabitants). Source: [30].
Sustainability 12 05855 g001
Figure 2. Schematic representation of the workflow analysis conducted.
Sustainability 12 05855 g002
Figure 3. Agriculture value added to Cabo Verde’s GDP (%). Source [29].
Sustainability 12 05855 g003
Figure 4. Percentage values of the total agriculture expenditure by the Cabo Verde government across the period 1990–2018. The red dashed line identifies the minimum budget (10%) that should be devoted to agriculture as established by ECOWAS.
Sustainability 12 05855 g004
Figure 5. Cabo Verde´s performance under ECOWAP/CAADP in 2017. The orange bars are the score achieved by the country, and the blue bars are the minimum threshold set in the CAADP process [54].
Sustainability 12 05855 g005
Figure 6. Food self-sufficiency index calculated for Cabo Verde within the period 1997–2018.
Sustainability 12 05855 g006
Figure 7. Representation of the regression between agricultural production and government expenditure in the sector, according to the model described in Table 3. The years in green color represent Cabo Verde’s years committed to implementing the CAADP.
Sustainability 12 05855 g007
Figure 8. Box plot showing the performance of West African countries on four agriculture-related Sustainable Development Goals (SDG). The blue squares represent the average values for West Africa while the green circles represent the values for Cabo Verde (CV).
Sustainability 12 05855 g008
Table 1. Main agriculture indicators retrieved from Cabo Verde.
IndicatorsDescriptionSource
Agricultural value added (% GDP)The net output of the agriculture sector after adding up all outputs and subtracting intermediate inputs.[30]
Government agriculture expenditure (constant 2010 US$, billion)The government investment in tangible and intangible assets related to agriculture.[38]
Investment in resilience buildingInvestment in fighting climate change effects and promoting sustainable agriculture.[38]
Crop production index (2004–2006 = 100)Crop production index shows agricultural production for each year relative to the base period 2004–2006. It includes all crops except fodder crops.[30]
Table 2. Selected Sustainable Development Goals and indicators included and excluded in the analysis. In bold font, indicators with positive sense and in italic, those with negative sense.
SDGIndicator INCLUDEDIndicator EXCLUDED
1. End poverty1.1. Poverty headcount ratio at $1.90/day (% population)
1.2. Proportion of population living below the poverty line (% population)
1.3. Population covered by social protection (% population)
2. Zero hunger2.1. Prevalence of undernourishment (% population)2.6. Fertilizer consumption (kilograms per hectare of arable land)
2.2. Prevalence of stunting (low height-for-age) in children under 5 years of age (%)
2.3. Prevalence of wasting in children under 5 years of age (%)
2.4. Prevalence of obesity, BMI ≥ 30 (% adult population)
2.5. Cereal yield (t/ha)
12. Responsible consumption and production12.1. Municipal Solid Waste (kg/year/capita)12.6. Natural Value Realization score
12.3. Percentage of anthropogenic wastewater that receives treatment (%)
12.2. E-waste generated (kg/capita)
12.4. Production-based SO2 emissions (kg/capita)
12.5. Net imported SO2 emissions (kg/capita)
17. Partnerships for the goals17.1. Tax revenue (% GDP)
17.2. Government health and education spending (% GDP)
17.3. Level of customs duties on imports (%)
17.4. Visa requirement (weighted score)
Table 3. Linear relationship between government expenditure and agriculture output. * p < 0.05, ** p < 0.01, *** p < 0.001.
Dependent variable = Ln_APro
VariablesCoefficientsStd. Err.p-value95% conf. Interval
I n t e r c e p t 8.1813.5270.029 *0.901–15.460
LnGov_Ae0.5850.2030.008 **0.164–1.006
CAADP_Pack0.3630.0940.001 **0.168–0.558
F-Statistic = 19.16 Prob > F = 0.000
Nº of obs.27
R-squareR2 = 0.501

