Article

Assessing the Economic Viability of an Animal Byproduct Rendering Plant: Case Study of a Slaughterhouse in Greece

by
Dimitris Zagklis
1,
Eva Konstantinidou
2,
Constantina Zafiri
1,2 and
Michael Kornaros
3,*
1
Green Technologies Ltd., 5 Ellinos Stratiotou Str., 26223 Patras, Greece
2
School of Science and Technology, Hellenic Open University, 18 Parodos Aristotelous, 26335 Patras, Greece
3
Laboratory of Biochemical Engineering & Environmental Technology (LBEET), Department of Chemical Engineering, University of Patras, 1 Karatheodori Street, 26504 Patras, Greece
*
Author to whom correspondence should be addressed.
Sustainability 2020, 12(14), 5870; https://0-doi-org.brum.beds.ac.uk/10.3390/su12145870
Submission received: 19 June 2020 / Revised: 20 July 2020 / Accepted: 20 July 2020 / Published: 21 July 2020

Abstract

:
Continuous human population growth has led to increased livestock production and hence large quantities of animal byproducts. One of the oldest and most efficient animal byproducts processing techniques is rendering, which facilitates the recovery of resources in the form of fat and protein flour. The purpose of this study is to provide data for the feasibility of rendering as a treatment method. The case of a Greek slaughterhouse is presented, regarding its animal byproduct treatment process through rendering and incineration. Three different waste management scenarios are compared, with rendering proving to have a lower operational cost (€51.80/ton) compared to incineration (€74.10/ton), and rendering followed by incineration (€72.13/ton). The rendering process is then compared with other established animal byproduct treatment methods like composting and anaerobic digestion through the analytic hierarchy process, in terms of environmental, economic, and technological efficiency, with rendering (having a final score of 72%) proving once again superior compared to composting (with a score of 54%), and anaerobic digestion (with a score of 55%).

Graphical Abstract

1. Introduction

The continuous deterioration of the environment and resource scarcity caused by human activities has become prominent during the last decades. This fact has shifted the scientific focus to the development of more sustainable practices through the redesigning of manufacturing techniques, the development of novel waste treatment methods, and the recovery of resources from expired or used products [1,2]. The European Union, through Regulation 2008/98/EC, has set a hierarchy for waste management, with the most preferable solution being prevention of waste production, followed by reuse of products, recycling of materials, recovery of resources, and, as a last choice, disposal [3].
In order to meet the food demands of the increasing human population, higher amounts of animal byproducts (ABPs) and wastes are produced each year [4,5]. Animal wastes or animal byproducts are a subcategory of agricultural wastes and are considered hazardous as they pose a threat to the public health, the animal health, and the environment. For this reason, a set of rules that rigorously define all phases of management procedures has been established [6,7]. The primary methods of ABP management are their disposal in controlled sites (landfills), incineration, processing, composting, and anaerobic digestion for biogas production.
Livestock production has a significant impact to the total greenhouse gas emissions from human activities [8,9]. These emissions originate from all stages of the process, including production of animal feed, housing facilities, transport, refrigeration, processing etc., and are estimated to make up 14.5% of the total human induced emissions [10]. Climate change and resource scarcity makes the recovery of resources from livestock production industry imperative.
According to point 1 of Article 3 of Regulation 1069/2009/EC [6], ABPs are defined as whole carcasses or parts of animal carcasses, products of animal origin, or other products obtained from animals not intended for human consumption, including oocytes, embryos, and semen. The same Regulation states that the “products of animal origin…not intended for consumption by man” include products not suitable for consumption in accordance with applicable national and EU legislation as well as the EU raw materials and/or products that can be consumed by humans in accordance to the law, but with an irrevocable decision of the producer that they are destined for others purposes, either for commercial reasons or due to a failure in packaging or failure to achieve the desired quality of intermediate and finished products. ABPs are divided into three categories, based on the level of risk they pose to the public and animal health, and the environment—Category 1, with a higher risk; Category 2, medium risk; and Category 3, with a lower risk. Articles 8, 9, and 10 of Regulation 1069/2009/EC describes the ABPs of Categories 1, 2, and 3 in detail which are illustrated in Table 1. Specified risk materials are the animal tissues defined in Annex V of Regulation 999/2001/EC [11].
One of the oldest methods of ABPs processing is rendering, a thermal inactivation method, under specific temperature and pressure conditions. A wide range of ABPs processed by rendering is utilized by important industry sectors to produce animal feed (for livestock and pet animals), fertilizers, leather, and pharmaceuticals [12,13]. In the European Union, until 1986, there was no legal framework for the distribution of animal feed produced through rendering that considered the natural food chain, resulting in the appearance of bovine spongiform encephalopathy outbreaks (mad-cow disease), with human casualties and devastating effects on the economy [14]. Today, with the imposed legislation, processed ABPs cannot be used as animal feed for animals of the same species. Rendering is still attractive as an ABPs processing method [15], making great use of simple procedures and by-products that would otherwise end-up in landfills.
Rendering is defined as any thermal processing of ABPs that is intended for the production of materials free from pathogenic microorganisms (Salmonella, Clostridium, enterobacteria) and water [16] that are either discarded directly into landfills or into incineration and co-incineration plants or are used for the production of commercially exploitable products. During rendering, the particle size of the ABP is initially reduced, followed by its heat treatment, and finally its separation into a solid (protein) and a liquid fraction (fat) (Figure 1). The protein-rich solids produced can be used as animal feed for pets and, under certain conditions, for farm animals as well as to produce fertilizers and soil improvers [17]. The produced fat, depending on its quality, can be used to produce biofuels (biodiesel and biogas) [18] and energy [19]. The application of rendering to edible animal products, such as fresh animal fat, leads to the production of edible products such as lard, gelatin, cooking and confectionery fat, etc. [20].
ABP processing through rendering was first widely used in the United States of America and then spread to the rest of the world [21,22]. According to the European Fat Processors and Renderers Association (EFPRA), 328 million pigs, sheep, goats, and cattle and 6 billion poultry are slaughtered in Europe every year. Of these carcasses, about 42% of the bovine animal weight, 34% of pig animal weight, and 25% of poultry animal weight are not suitable for human consumption. At the same time, on average, 2.45 million tons of fallen stock occur in livestock farms. From all the above, according to EFPRA, 5 million tons of Category 1 ABPs and 12 million tons of Categories 2 and 3 ABPs and edible animal fat are finally produced. The utilization of Category 1 ABPs leads to the production of one million tons of solid fuel each year for the operation of power plants and cement production. Correspondingly, the utilization of Categories 2 and 3 ABPs and the edible animal fat, according to EFPRA, produces the following every year: 186 thousand tons of edible fats for use in confectionery and cooking, 1.67 million tons of processed animal protein replacing soybeans in the preparation of pet food, 1.52 million tons of processed animal fat derived from ABP Category 3 that replaces palm oil in the chemical and animal feed industry, 99 thousand tons of processed animal protein replacing fish feed produced from caught fish, a quantity of phosphorus enough for the fertilizer needs of 3 million football fields, and a quantity of nitrogen enough for the fertilizer needs of 500 thousand football fields. Also, the utilization of ABPs produces enough biodiesel for 650 thousand cars every year.
As can be understood from the data presented thus far, the exploitation of ABPs can have a major contribution to the circular economy model through the recovery of resources. This can be carried out though composting for the production of soil improvers and fertilizers [15,23,24], anaerobic digestion for the production of biogas and liquid fertilizers [15,25,26,27,28], and rendering for the production of fat and protein flour [15]. Pyrolysis can be used as a processing method for the production of bio-oil, syngas, and biochar from food wastes [29,30]. Gelatin, collagen, and other valuable substances can also be extracted from ABPs, as well as hide/skin from fallen or slaughtered animals [31]. The recovery of resources from food wastes can have a major contribution to the circular economy model, especially through the recovery of nutrients for the production of animal feed [32,33].
Several studies have examined the economics of ABP valorization through rendering, but usually examine the economics of processes through their mass balance and larger scales [34,35,36]. The purpose of this study is to examine the economic feasibility of ABP rendering based on data obtained from a slaughterhouse operating in Greece, providing information for smaller scales and taking into account data from existing equipment capacity, maintenance cost, and local ABP production. This will allow the implementation of a decision-making methodology, like the analytic hierarchy process (AHP), for the comparison of the benefits of using rendering compared to composting and anaerobic digestion. The methodology used in this study can be implemented by other small enterprises to quickly assess the feasibility of their waste disposal schemes and promote more environmentally friendly behavior.

2. Materials and Methods

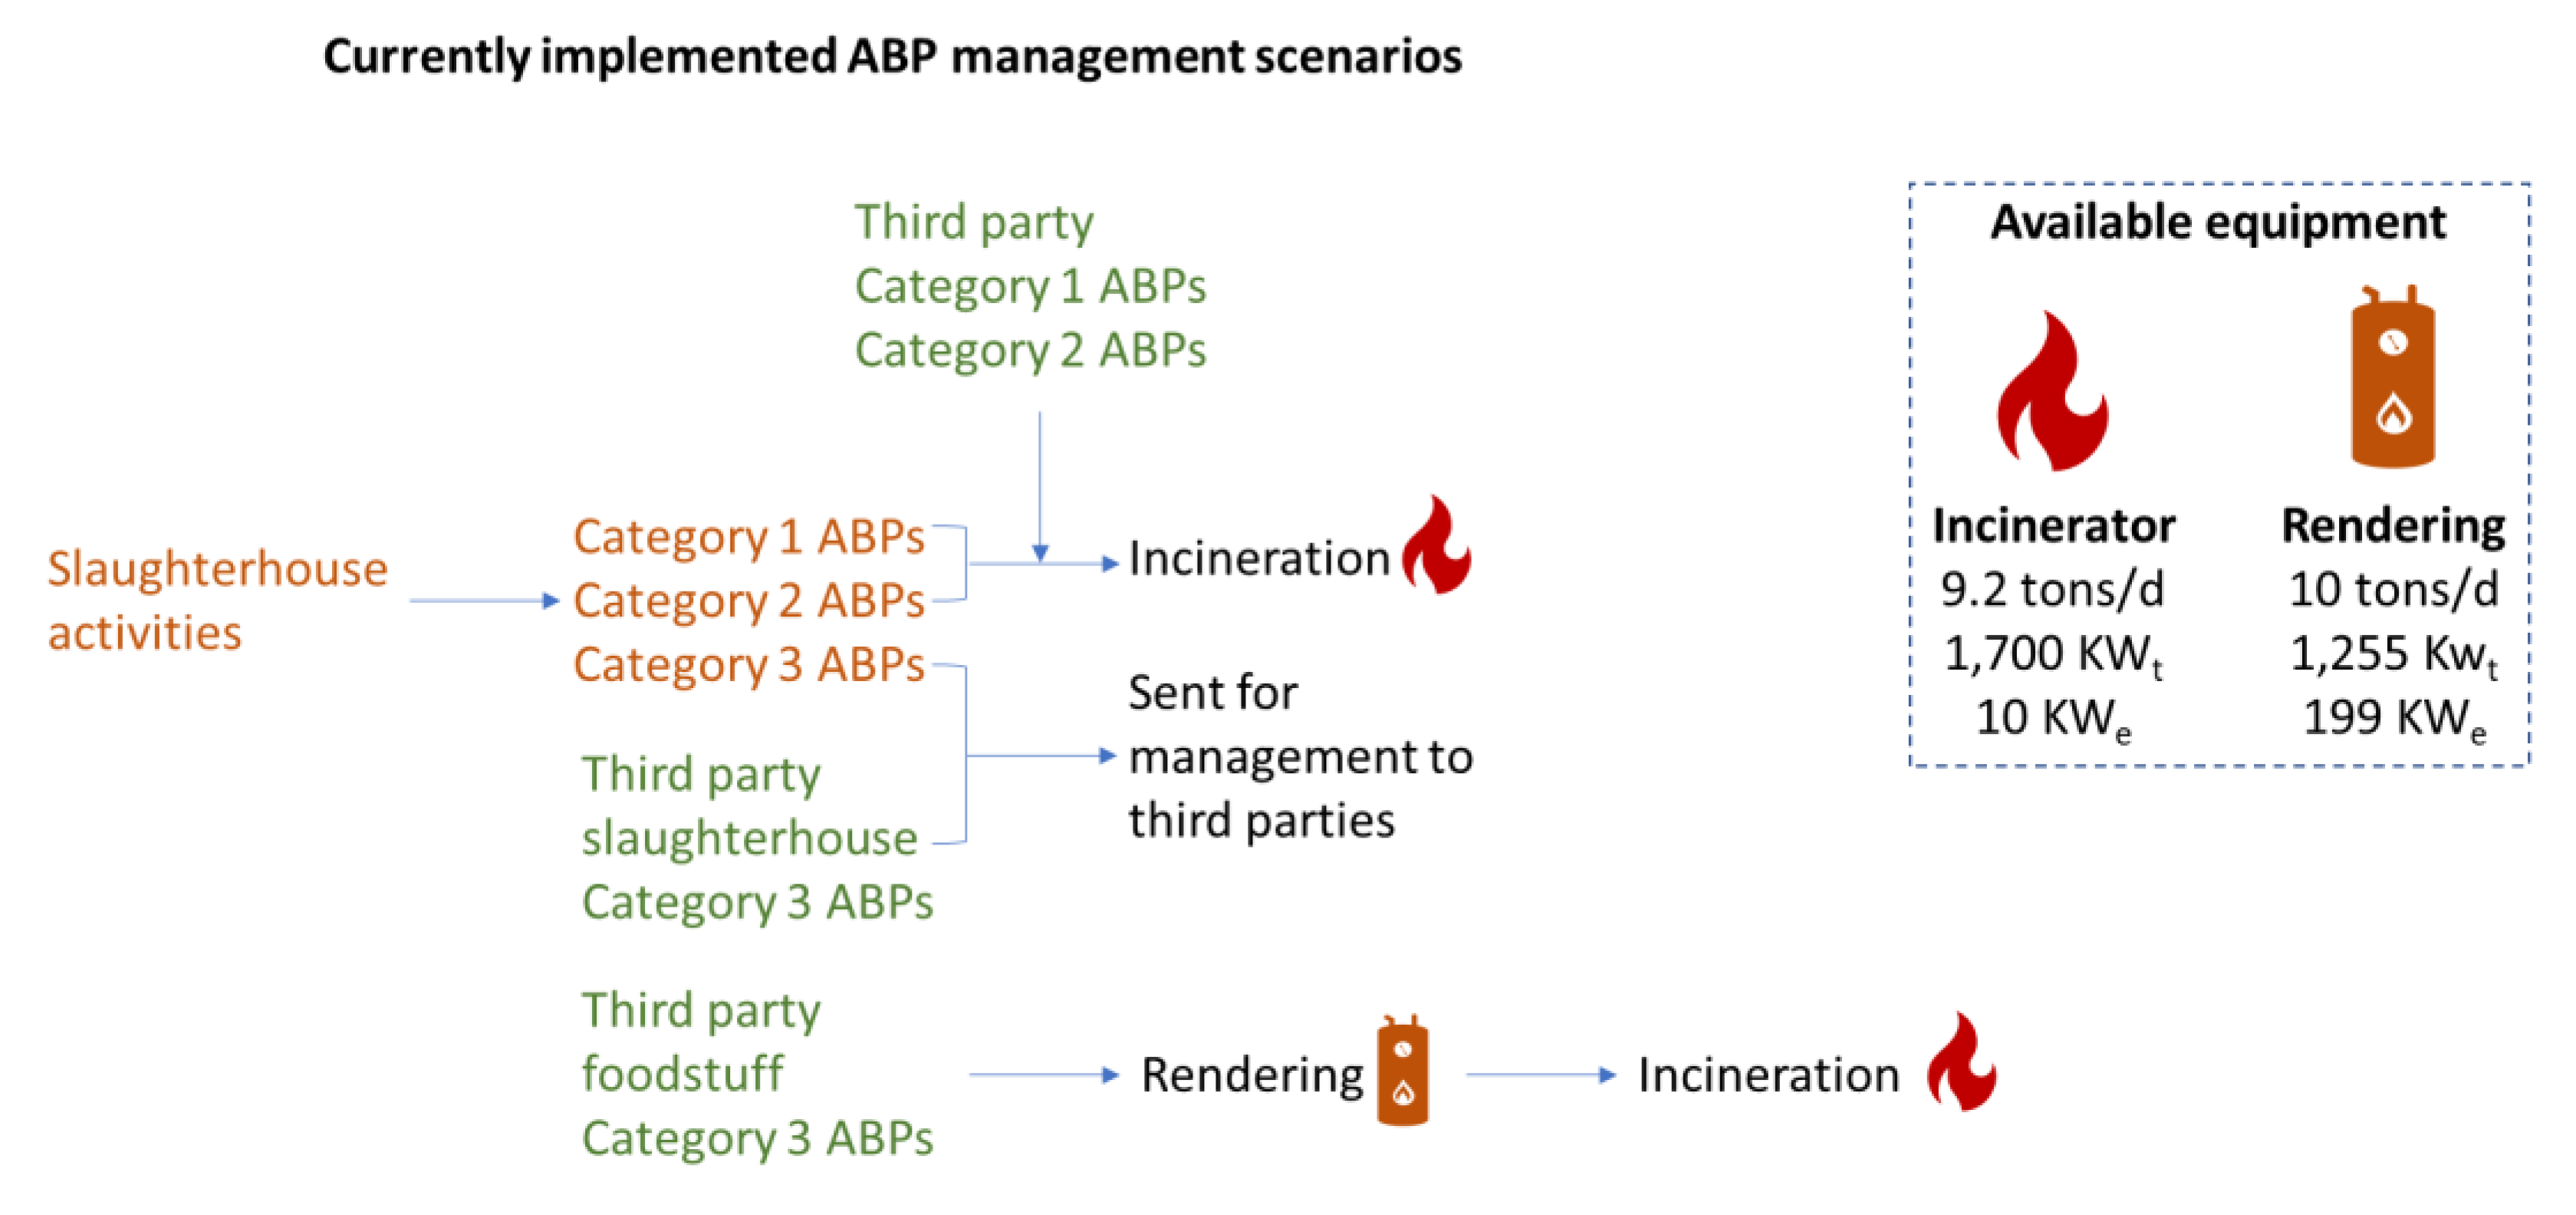
2.1. Description of Current Operation

The slaughterhouse examined in this study started its operation as an industrial slaughterhouse in 2002. The company’s headquarters and facilities are located in the industrial park of the Municipality of Prossotsani, Drama, Northern Greece, occupying a total area of 43,000 m2. The facilities are divided in five parts—an industrial slaughterhouse, a rendering unit, an incineration unit, a wastewater treatment unit, and the animal housing facilities.
The incineration unit uses a pyrolytic furnace high potential incinerator. Natural gas is used as fuel for its operation, and its combustion temperature is 850 °C for two seconds, creating conditions for the efficient incineration of incoming waste. The rotating furnace (PyroRot, model 540 by ASTE Ltd.), is designed to incinerate ABP Categories 1, 2, and 3, and waste with a large proportion of liquid. It consists of (a) the main pyrolysis/gasification/ incineration chamber, which rotates periodically; (b) the post-incineration chamber; and (c) three burners (one in the main chamber and two in the post-incineration chamber, one of which is in standby, according to Regulation 1069/2009/EC).
The ABP rendering unit implements the rendering process 1—batch sterilization (dry inactivation) according to Annex IV, Chapter III of Regulation 142/2011/EU. It consists of a boiler room and the main facility room. The boiler room contains the natural gas boiler that produces steam (6 bar) at a temperature of 150~160 °C. The main facility contains the ABP loading funnel, the ABP crusher, the sterilizer (cooker), the drainage fat settling funnel, the fat removal press, the hammermill used for the produced protein flours, the centrifugal fat separator, the fat reservoir, the fat pumps, and the screw conveyors of processed materials.
Since the fat content in fish is much lower than in foodstuff, the company choses to treat the fish in a different lot. From rendering of 1 ton of fish ABPs, 270 kg “dry” fish meal (27%), and a minimum amount of fat (about 0.5 kg) are produced on average. From rendering of 1 ton of foodstuff ABPs (mainly dairy products and sausages), 175 kg of fat and 175 kg of solid fraction are produced on average.
The slaughterhouse currently manages ABPs of all three categories, which either originate from its own operation (slaughterhouse and meat processing department) or are received from third parties. Figure 2 illustrates the currently implemented ABP management scenarios and the specifications of the incineration and rendering units.
Burning ABPs has a high cost due to their increased moisture content. ABPs are considered to be the most difficult materials to be incinerated. For this reason, the company chooses to first process the Category 3 ABPs received from third parties (except those originating from slaughterhouses) through rendering, and subsequently incinerate the products of the rendering process.
Figure 3 illustrates the amounts of Category 1 and 2 ABPs managed by the company in 2017 and the first four months of 2018 and their origins. From October 2017 and until April 2018, the company received significant quantities of Category 1 and 2 ABPs from third parties because of the Christmas and Easter periods, which are connected with increased food consumption and as a result increased animal population before these holidays. Figure 4 illustrates the quantities of Category 3 ABPs managed by the company during 2017 and the first four months of 2018 and their origins.
From Figure 4, the inactivation of fish has begun since May 2017, while the bulk of inactivated materials comes from foodstuff ABPs. The quantities of Category 3 ABPs deriving from slaughterhouse operation are small except for the periods before Easter and Christmas (April and December).
The transport of ABPs to be inactivated is carried out either with the company’s licensed vehicle or with the corresponding vehicles of its customers. The ABPs are transported in special, closed, reusable containers, which are disinfected after every use. The wheels of the transport vehicles are disinfected before entering and after leaving the facility. The company follows a HACP protocol that ensures the appropriate conditions during rendering are achieved for the microbial inactivation of the wastes. Continuous monitoring of the rendering products is carried out, in terms of pathogens concentrations, and the 1069/2009/EC regulation is followed for every step of the process.
The slaughterhouse originally constructed the rendering unit in order to process the Category 2 and 3 ABPs produced by its operation and from local slaughterhouses. As it can be observed in Figure 3 and Figure 4, the amount of these materials was not enough for the economically feasible operation of the rendering unit. The company then started collecting Category 3 ABPs from other fish and foodstuff processing companies and using the rendering unit up to the stage of thermal inactivation without using the equipment for the refining of the rendering products (fat removal press, hammermill for the production of protein flours, and centrifugal fat separator), incinerating them instead.

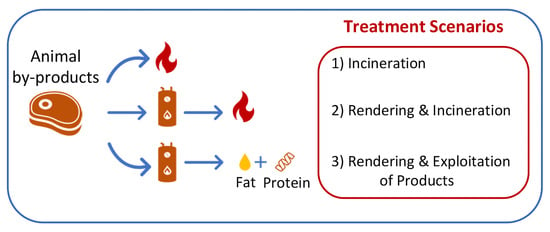
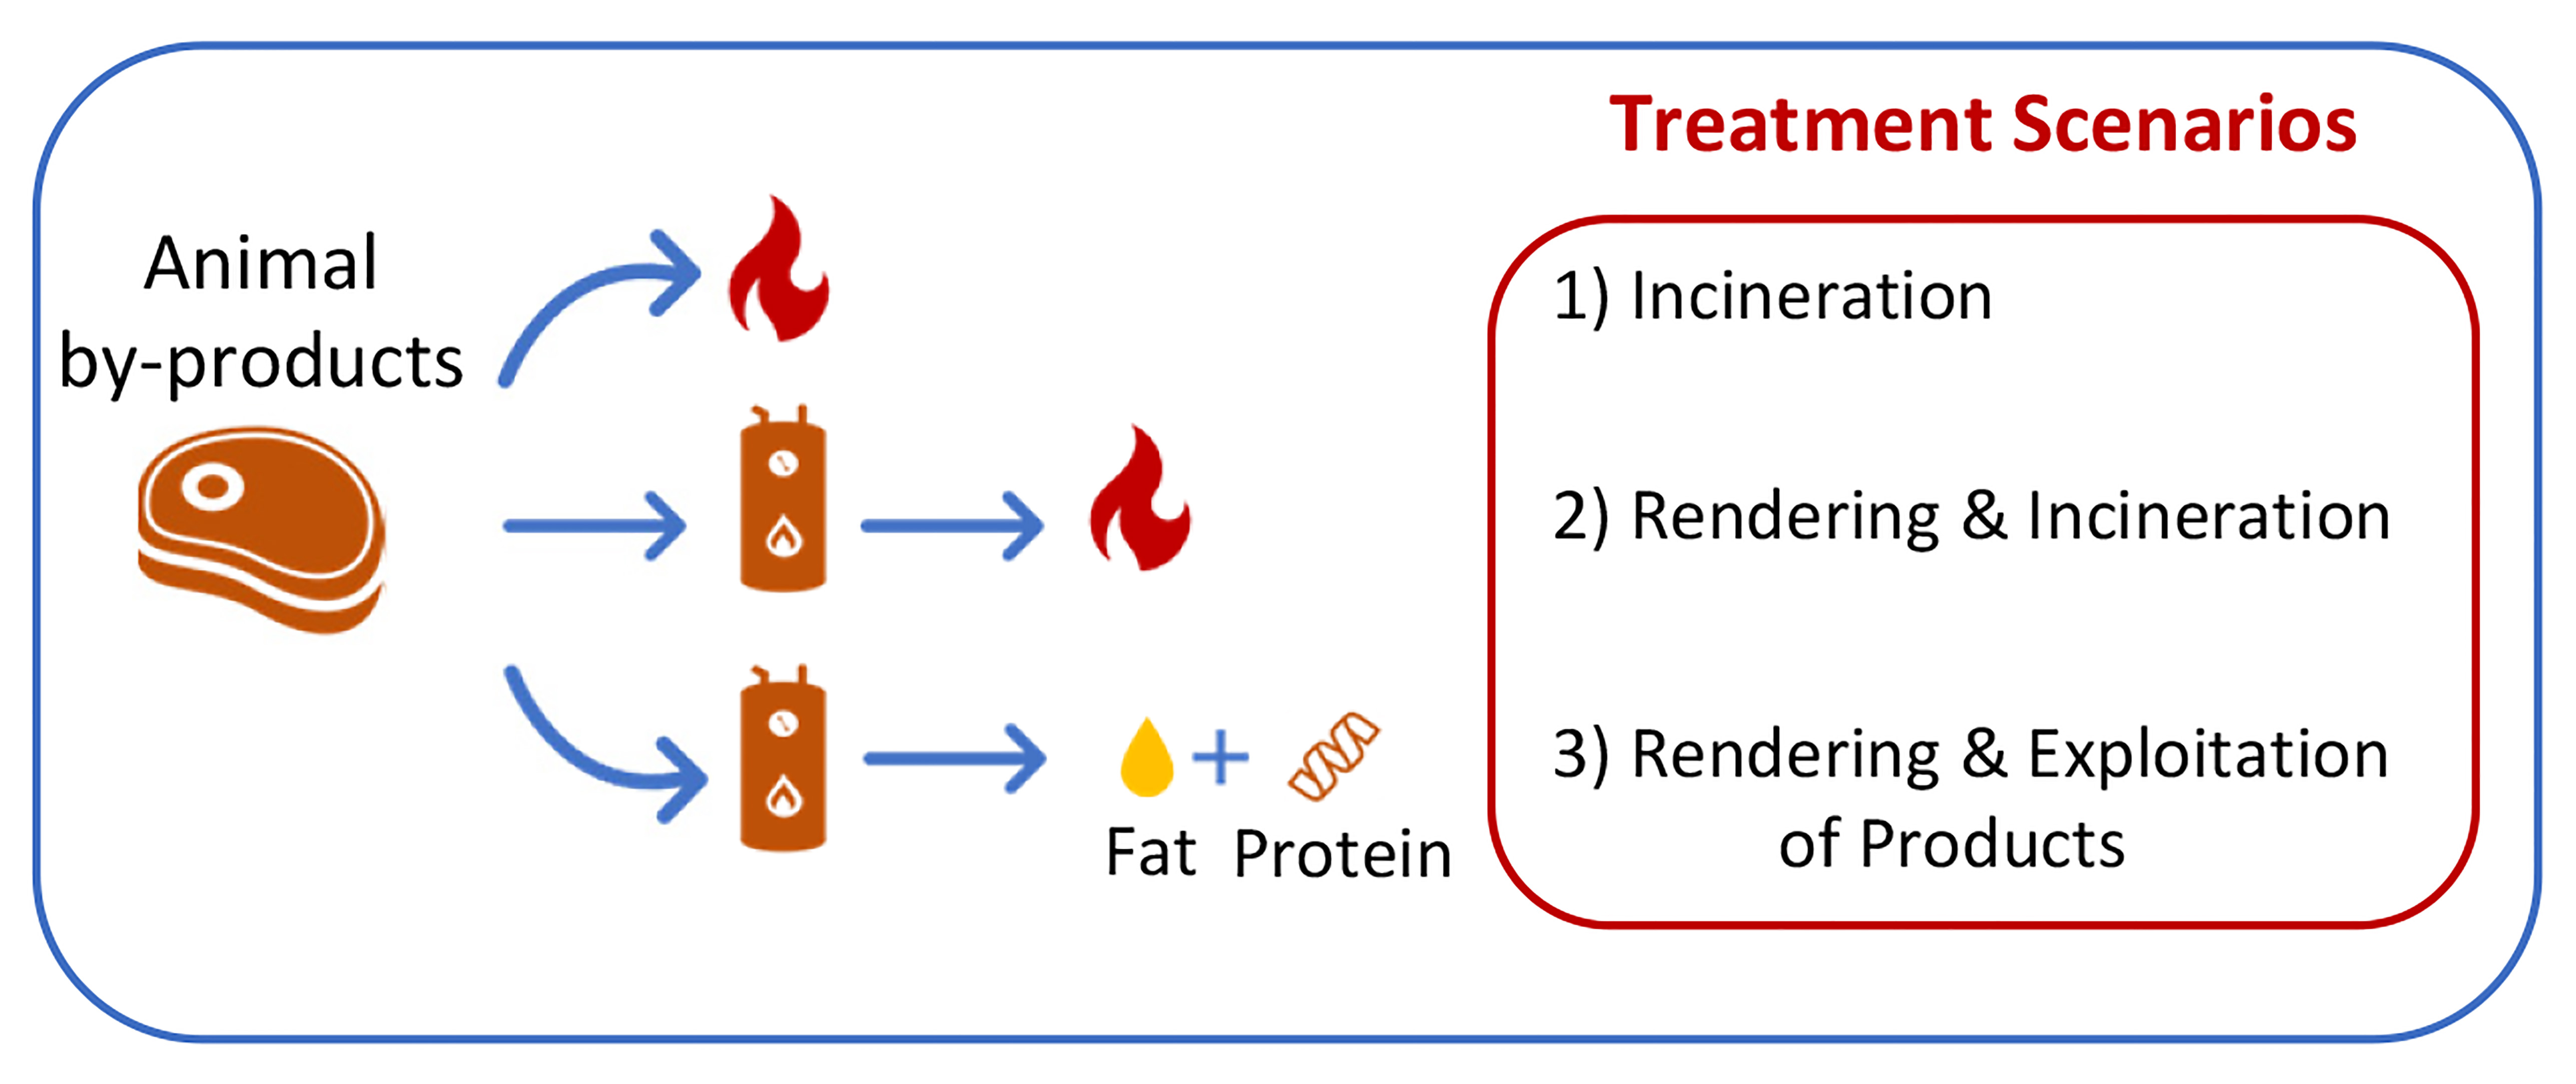
2.2. Assessment of Operating Scenarios

The decisions taken by an enterprise for its operation and potential retrofitting are mainly based on economic criteria. A useful tool for obtaining a financially sound solution is the construction of a dynamic mathematical model that enables the calculation of operational cost and expected profit by taking into account information related to the characteristics of the machinery, the resources consumed, equipment purchase and maintenance costs, labor costs, the quantities of the materials processed and produced, the cost of services provided and received, etc.
In order to build such a model, it is first necessary to identify the main sources of costs and revenues and then to express them by the mentioned elements. The construction of such a model is a dynamic process that requires continuous control and improvement. A first attempt was carried out to build mathematical models from which the expected profit for the company for each of the following scenarios of management and exploitation of the Category 3 ABPs from fish and foodstuff is calculated.
In Scenario 1, all the ABPs are incinerated without any previous processing, and the ash produced is disposed in a landfill. In Scenario 2, all the ABPs are inactivated through rendering with the produced materials directed to incineration and the ash produced to a landfill (current operation). Finally, in Scenario 3 all the ABPs are inactivated through rendering, and products of rendering are available for further exploitation.
For the developed mathematical model, the cost of removing the packaging of ABPs to be managed and the operational cost of the wastewater treatment plant were not taken into account because the process of unpacking is included in all three scenarios, and the wastewater burden of all three scenarios is small compared to the other activities of the company (slaughterhouse, animal housing facilities, etc.). The main cost categories that were identified were the thermal energy needs (cost coefficient A), the electrical energy needs (cost coefficient B), the maintenance needs of the rendering equipment (cost coefficient C), the maintenance needs of the incineration equipment (cost coefficient D), the disposal of the ash produced during incineration (cost coefficient E), labor (cost coefficient F), and a possible penalty in the form of a tax for the use of incinerator (cost coefficient G). Each cost coefficient must be multiplied with the corresponding price or cost (natural gas price (NGP), electricity price (EP), rendering maintenance cost (MCr), incinerator maintenance cost (MCi), ash disposal cost (ADC), hourly wage (HW) and environmental tax (Tax)). The calculation of the total operational cost in € per kg of ABP for each scenario is summarized in the following formula:
A   [ K W h k g   A B P ] ×   N G P   [ K W h ] + B   [ K W h k g   A B P ] ×   E P [ K W h ] + ( C   [ k g   A B P y ] ) 1 ×    M C r   [ y ] + ( D   [ k g   A B P y ] ) 1 ×   M C i   [ y ] +   E   [ k g   A s h k g   A B P ] ×   A D C   [ k g   A s h ] + F   [ h k g   A B P ] ×   H W   [ h ] + G   [ h k g   A B P ] ×   T a x   [ h ]
After the cost coefficients for each scenario are calculated, the net profit of each rendering scenario can be identified. Finally, a decision tool can be used to examine the scenarios, alongside other established treatment methods for this type of by-products. The analytic hierarchy process (AHP) was used, as described by Bottero et al. [37]. AHP is an established methodology for the comparison of different options that has been proposed in the literature as a decision tool for waste management [38,39]. Three criteria were examined—Environmental, Technological and Economic—represented by the total energy consumption, the total retention time, and the net profit, respectively, for each process. The weights proposed by Bottero et al. [37] were also used (0.43 for environmental, 0.47 for economic and 0.1 for technological criteria) with a consistency ratio of (CR)<0.1. Because the total energy consumption and total retention time have a negative impact on the evaluation of the process, the vales used for AHP scoring were the comparison between the methods and the worst results in each criterion. For example, composting had the longest retention time amongst the process examined (50 d), while anaerobic digestion had a retention time of 40 d. The value used for scoring the retention time of anaerobic digestion was 50 − 40 = 10 d, which was then normalized by dividing with the highest value among the process. In this way, the worst performing method had a score of zero before weighing, and the best performing method had a score of one after normalization and before weighing. In the case of net profit, a similar approach was used for the methods that had negative net profit (net cost), leading to the method with the most negative net profit being scored with zero, and the method with the highest net profit having a score of one. The AHP score occurs by multiplying the normalized scores of the processes with the weights and then summing the results per process.

3. Results

3.1. Scenario 1—Incineration of ABPs

According to the company’s data, a complete cycle of ABPs incineration takes an average of six hours, of which 4 h correspond to the combustion process, and the remaining 2 h correspond to the time required for loading, cooling the furnace and removing the ash. The incinerator installed at the premises of the company has a capacity of 1150 kg of ABPs/h of operation or 4600 kg of ABPs per full incineration cycle or 9200 kg of ABPs per day, total electrical power of 10 kW, and total thermal power of 1700 kW (main incinerator 800 kW and two afterburners, 450 kW each). During incineration, the main incinerator and one afterburning incinerator continuously operate, while the second afterburning incinerator operates for 0.5 h per incineration cycle.

3.1.1. Calculation of Total Cost of Scenario 1

The operational cost of the incinerator consists of the sum of natural gas cost, electricity cost, and maintenance cost. Natural gas is used to power the main incinerator and one afterburning incinerator for 4 h and the other afterburning incinerator for 0.5 h.
The energy consumed by the three incinerators per one operating cycle is
( 800   k W + 450   k W ) × 4   h + 450   k W × 0.5   h / c y c l e = 5225   k W h / c y c l e
If the natural gas price (NGP) is expressed in €/kWh, the cost of natural gas would be
( 5225   kWh / cycle   ×   NGP   / kWh ) / ( 4600   kg   ABP / cycle ) = 1.136 ×   NGP   [ / kg   ABP ]
For the calculation of the electricity cost, it is assumed that for each the operating hours of the incinerator the electrical demand factor of the machinery is 0.7. The electricity consumed during the four hours of burning of a complete cycle of incineration is equal to
0.7 × 10   kW   × 4   h / cycle = 28   kWh / cycle  
If the electricity price (EP) is expressed as €/kWh, the cost of electricity is calculated as follows:
( 28   kWh / cycle   ×   EP   / kWh ) / ( 4600   kg   ABP / cycle ) = 6.087 × 10 3 ×   EP   [ / kg   ABP ]  
The company implements a preventive maintenance program once a year for the incinerator according to the manufacturer’s instructions. If the maintenance cost of the incinerator (MCi) is expressed as €/y, for a 250 days/y operation, the total maintenance cost can be calculated as follows:
( M C i   / y ) / ( 250   d / y   × 9200    k g   A B P / d ) = 4.35 × 10 7   × M C i   [ / k g   A B P ]
Through the sum of Equations (3), (5) and (6), the total operational cost of the incinerator is calculated as
( 1.136 × N G P + 6.087 × 10 3 × E P + 4.35   ×   10 7 × M C i )   [ / k g   A B P ]
According to the manufacturer of the incinerator, the amount of ash produced corresponds to 3% of the quantity incinerated. If the disposal of ash costs ADC €/kg, then, the total ash disposal cost can be calculated as
0.03   kg   ash / kg   ABP   ×   ADC   / kg = 0.03 ×   ADC   [ / kg   ABP ]
The operation of the incinerator requires the employment of one (1) worker for its supervision, so the working cost per hour of operation is equal to the hourly wage (HW) in €/h.
HW   / h / 1150   kg   ABP / h = 0.87 × 10 3 ×   HW   [ / kg   ABP ]
Since incineration is the least acceptable waste management Scenario, after direct land application, it is likely that a tax will be imposed in the future for the hourly use of an incinerator. Therefore, the environmental cost per hour of operation is given by the following equation:
Tax   / h / 1150   kg   ABP / h = 0.87 × 10 3 ×   Tax   [ / kg   ABP ]
In summary, the total cost of Scenario 1, whereby all ABPs are incinerated in the furnace without any prior processing and the ash produced is sent to a landfill, is given by the following equation:
1.136 × N G P + 6.087 × 10 3 × E P + 4.35 × 10 7 × M C i + 0.03 × A D C + 0.87 × 10 3 × H W + 0.87 × 10 3 × T a x   [ / k g   A B P ]

3.1.2. Calculation of Net Profit of Scenario 1

If the company receives an income of PR in €/kg ABP for the provided management services of Category 3 ABPs of foodstuff or fish origin, then the Net Profit of Scenario 1 is given by the following equation:
P R ( 1.136 × N G P + 6.087 × 10 3 × E P + 4.35 × 10 7 × M C i + 0.03 × A D C + 0.87 × 10 3 × H W + 0.87 × 10 3 × T a x )   [ / k g   A B P ]

3.2. Scenario 2—Rendering of ABPs and Incineration of the Resulting Materials

According to the company’s data, a complete cycle of rendering of ABPs and collection of the materials produced in order to be driven for incineration lasts for an average of 3.5 h, of which 3 h correspond to the rendering process and the remaining half hour corresponds to the time required for the cutting of ABPs and the loading of the materials produced from the drainage funnel. The steam boiler has a thermal power of 1209 kW and an electric power of 5 kW. The sterilizer (cooker) has a capacity of 1665 kg ABP/h, or ~5000 kg ABP per full rendering cycle and 37 kW power. The total electric power including the equipment up to the screw conveyor after the drainage funnel equals to 106.7 kW.

3.2.1. Calculation of Total Cost of Scenario 2

The Scenario 2 rendering cost is divided to natural gas cost, electricity cost, maintenance cost and labor cost. The energy consumed by the steam boiler during the 3 h of sterilization in a rendering cycle equals to
1209   k W × 3   h / c y c l e = 3627   k W h / c y c l e
With the price of natural gas (NGP) expressed in €/kWh, the cost of natural gas can be calculated as
( 3627   k W h / c y c l e × N G P   / k W h ) / 5000   k g   A B P / c y c l e = 0.7254 × N G P   [ / k g   A B P ]
For the calculation of electricity cost, it is assumed that the equipment powered by electricity in the rendering unit (except for the cooker) operates for 0.25 h per rendering cycle. The electrical energy needed can be calculated as follows:
( 37   k W + 5   k W ) × 3   h / c y c l e + ( 106.7   k W 37   k W 5   k W ) × 0.25   h / c y c l e = 142.175   k W h / c y c l e
If the electricity price (EP) is expressed in €/kWh, the cost of electricity can be calculated as follows:
( 142.175   k W h / c y c l e × E P   / k W h ) / ( 5000   k g   A B P / c y c l e ) = 28.435 × 10 3 × E P   [ / k g   A B P ]
The company implements yearly maintenance of the rendering unit. The cost of maintenance (MCr) expressed in €/y can be used for the calculation of the maintenance cost per kg of ABP for 250 days of operation per year:
( M C r   / y ) / ( 250   d / y × 10 4    k g   A B P / d ) = 4 × 10 7 × M C r   [ / ( k g   A B P ) ]
Two (2) employees are required for the operation of the rendering unit. With the hourly wage [HW] expressed in €/h, total labor cost can be calculated as follows:
2 × H W   / h / 1665   k g   A B P / h = 1.2 × 10 3 × H W   [ / k g   A B P ]
The total rendering cost can be calculated by the sum of Equations (14) and (16)–(18) as
0.7254 × N G P + 28.435 × 10 3 × E P + 4 × 10 7 × M C r + 1.2 × 10 3 × H W   [ / k g   A B P ]
The total incineration cost can be calculated as described for Scenario 1. For the year 2017 and the first four months of the year 2018, fish form 10% of Category 3 ABPs inactivated by the company while foodstuff are the remaining 90%. From the rendering of 1 ton of fish, 270 kg of material is produced for incineration. From the rendering of 1 ton of foodstuff, 350 kg of materials is produced for incineration. Therefore, the rendering of 1 kg of “mixed” ABPs produces on average an amount of material driven for incineration equal to
( 0.1 × 0.27 ) + ( 0.9 × 0.35 ) = 0.342   k g
with incineration cost equal to (based on previous calculations for the incinerator) as
0.342   k g × ( 1.136 × N G P + 6.087 × 10 3 × E P + 4.35 × 10 7 × M C i + 0.03 × A D C + 0.87 × 10 3 × H W + 0.87 × 10 3 × T a x )   [ / k g ]  
In summary, the total cost of Scenario 2, whereby all ABPs are inactivated in rendering unit and the products obtained from the drainage funnel are driven for incineration and the ash produced is led to licensed landfill, is given by the following equation:
1.1144 × N G P + 30.517 × 10 3 × E P + 4 × 10 7 × M C r + 1.49 × 10 7 × M C i + 1.026 × 10 2 × A D C + 1.498 × 10 3 × H W + 0.298 × 10 3 × T a x   [ / k g   A B P ]

3.2.2. Calculation of Net Profit of Scenario 2

If the company receives an income of PR in €/kg of ABP to be processed in its facilities, then the Net Profit of Scenario 2 is given by the following equation:
P R ( 1.1144 × N G P + 30.517 × 10 3 × E P + 4 × 10 7 × M C r + 1.49 × 10 7 × M C i + 1.026 × 10 2 × A D C + 1.498 × 10 3 × H W + 0.298 × 10 3 × T a x )   [ / k g   A B P ]   

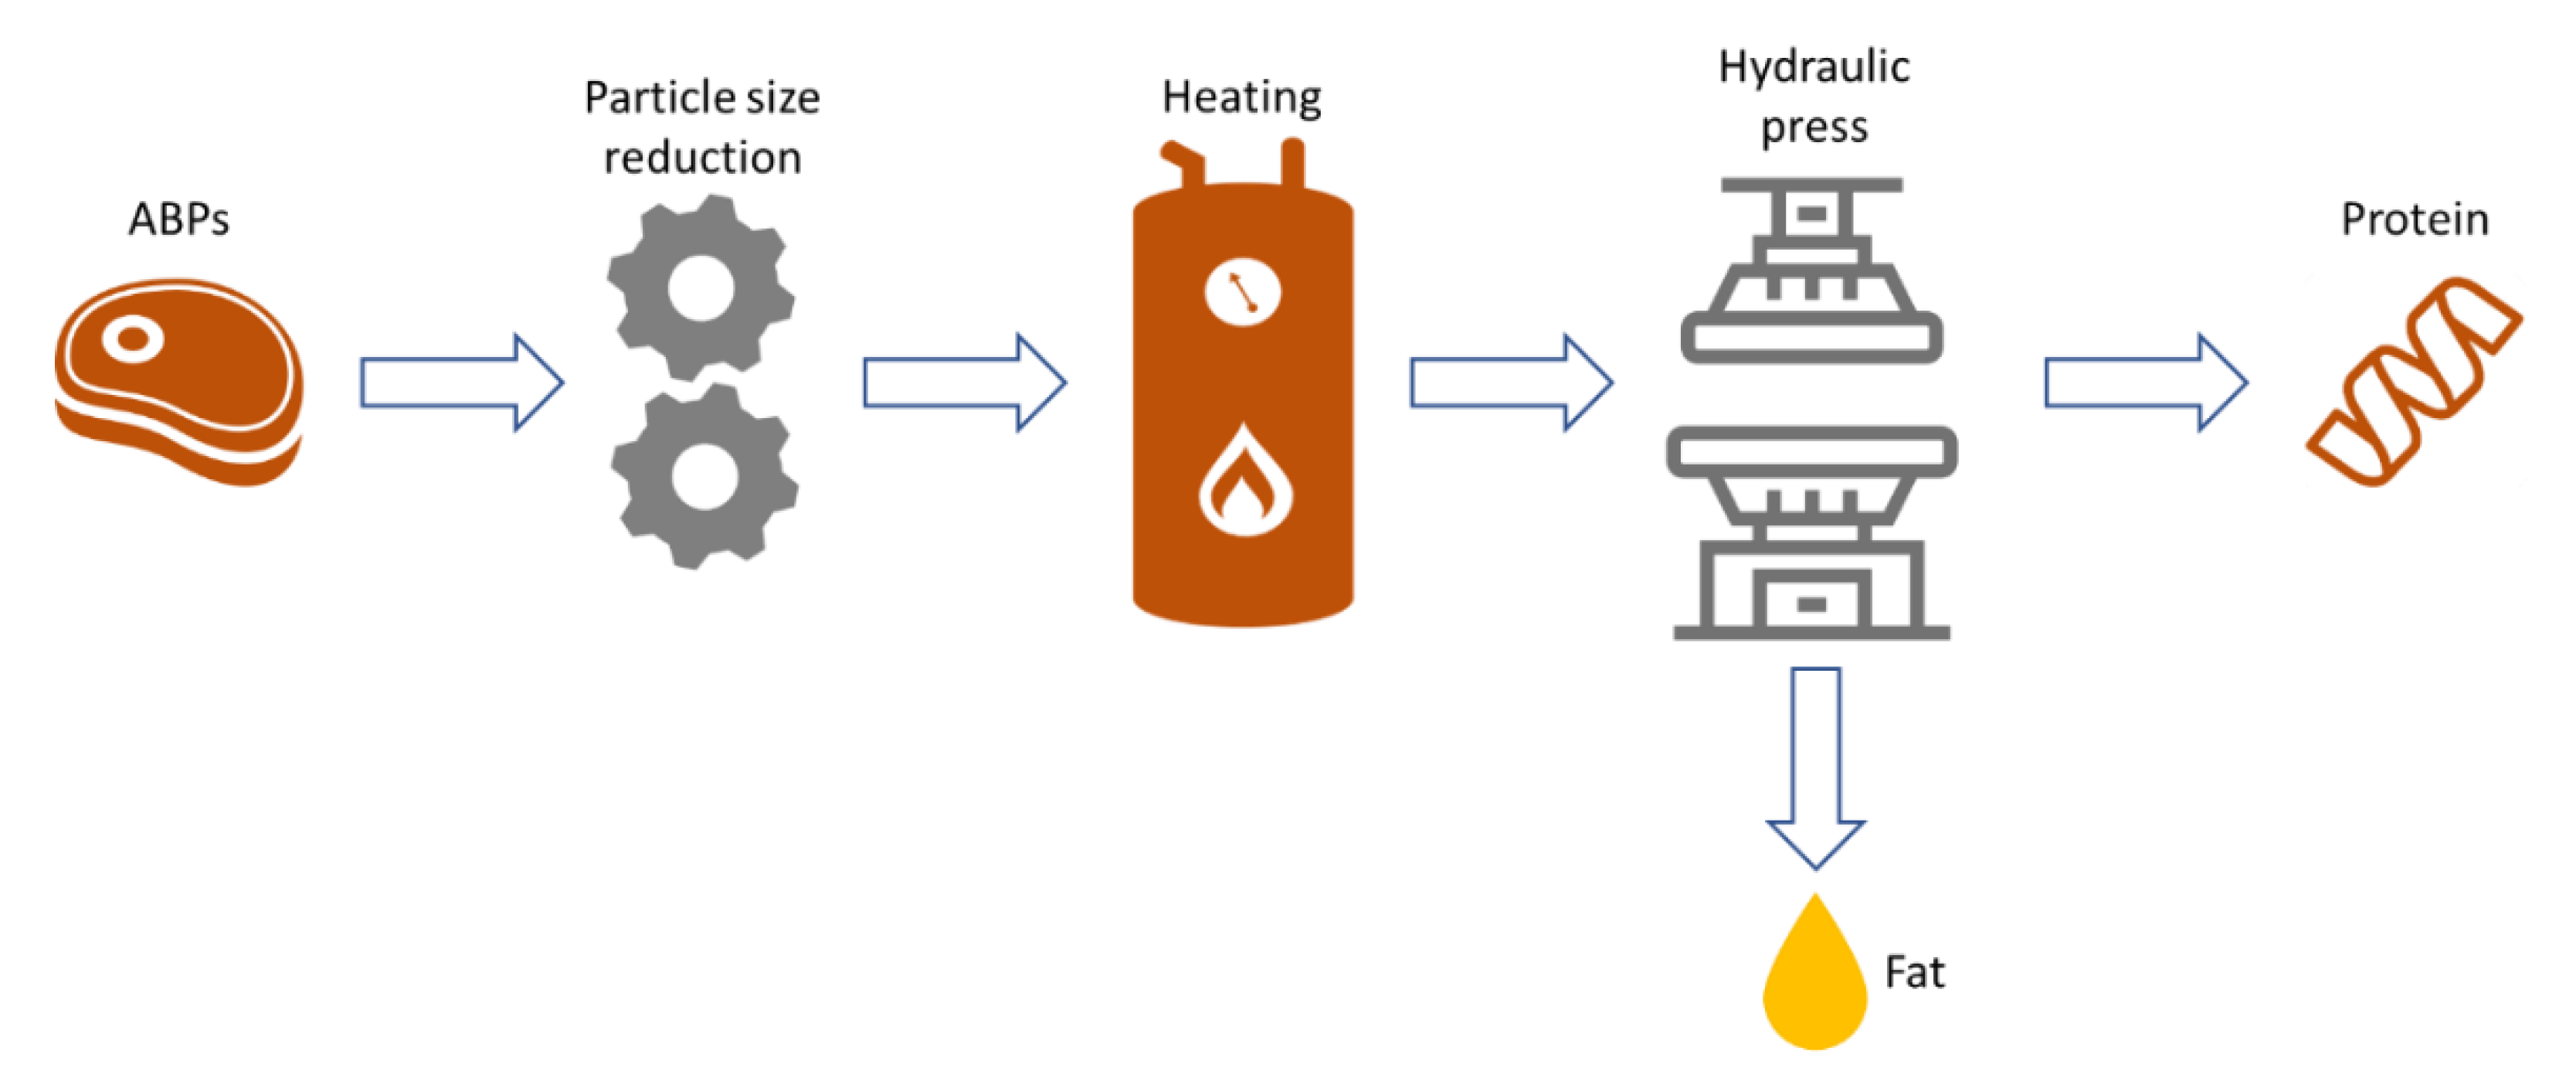
3.3. Scenario 3—Rendering of ABPs and Exploitation of Products

It is estimated that a complete ABP rendering cycle, in order to obtain the resulting proteinaceous flour and fat with increased purity for further use, takes on average of 4 h, of which 3 h correspond to the rendering process, and the remaining one hour corresponds to the times required for the remaining operations (ABP cutting, passing through the press and the hammer mill, packaging of proteinaceous flour, fat centrifugation, fat collection). The steam boiler has a thermal power of 1209 kW and an electric power of 5 kW. The sterilizer (cooker) has a capacity of 1665 kg ABP/h of operation or ~5000 kg ABPs per full rendering cycle and power of 37 kW. The total electric power including the rendering unit equipment equals to 235.68 kW.

3.3.1. Calculation of Total Cost of Scenario 3

The total cost of Scenario 3 is equal to the rendering cost that is distinguished in: natural gas cost, electricity cost, maintenance costs and labor cost.
The cost of natural gas is calculated as in Scenario 2:
0.7254 × N G P   [ / k g   A B P ]   
The cost of electricity required for 4 h of operation is calculated as follows:
[ ( 37   k W + 5   k W ) × 3   h / c y c l e ] + [ ( 235.68   k W 37   k W 5   k W ) × 0.25   h / c y c l e ] = 174.42   k W h
( 174.42   k W h × E P   / k W h ) / ( 5000   k g   A B P / c y c l e ) = 34.884 × 10 3 × E P   [ / k g   A B P ]
For the maintenance of the rendering unit, it can be assumed that the cost for Scenario 3 will be higher than the one for Scenario 2 (MCr2>MCr).
( M C r 2   / y ) / ( 2.5 × 10 6   k g   A B P / y ) = 4 × 10 7 × M C r 2   [ / k g   A B P ]  
Three employees will be needed for the operation described in Scenario 3:
3 × H W   / h / 1665   k g   A B P / h = 1.8 × 10 3 × H W   [ / k g   A B P ]
Summing up Equations (24) and (26)–(28), the total cost of Scenario 3 can be calculated as
0.7254 × N G C + 34.884 × 10 3 × E P + 4 × 10 7 × M C r 2 + 1.8 × 10 3 × H W   [ / k g   A B P ]

3.3.2. Calculation of Net Profit of Scenario 3

In Scenario 3, the profit can be divided in the income for the provided services of 1 kg of Category 3 ABP (PR) and the profit from selling the rendering products (PR2). Both prices are expressed in €/kg ABP.
The Net Profit of Scenario 3 is thus calculated as follows:
P R + P R 2 ( 0.7254 × N G P ) + ( 34.884 × 10 3 × E P ) + ( 4 × 10 7 × M C r 2 ) + ( 1.8 × 10 3 × H W ) ]   [ / k g   A B P ]  

3.4. Comparing the Three Scenarios

Table 2 summarizes the cost coefficients that were identified through the analysis presented thus far, for each cost category and scenario as included in Equations (12), (23), and (30).
Table 2 shows that the amount of natural gas consumed in Scenario 3 is significantly less than in the other two scenarios; the amount of electricity consumed in Scenario 1 is significantly less than in the other two scenarios, whereas Scenario 3 exhibits the highest electricity consumption. Moreover, Scenario 3 is the most labor intensive among the others due to the greater number of tasks being performed. Ash management costs are greater in Scenario 1, while they are completely absent in Scenario 3. Furthermore, in Scenario 3, there is no environmental cost because the incineration process is not included. Even though environmental cost in the form of a tax does not exist today, it has been considered because it is very likely to be imposed in the future to prevent the use of incineration as a waste management method.
To estimate the maintenance costs of each scenario the annual maintenance cost of the equipment of the incinerator and the rendering unit should be calculated (MCi, MCr, MCr2). Because the equipment is new and covered by the agreed warranty period when purchased, there are no data for the calculation of maintenance prices.
According to the company’s data, the current gas purchase price is equal to €0.05/kWh and the price for electricity is €0.20/kWh. The minimum permissible hourly wage is equal to €4/h. Also, according to a contract signed by the company for the disposal of ash, the cost is €0.42/kg of ash. By incorporating the values mentioned above in Table 2, Table 3 is created.
From Table 3, it can be clearly noticed that the highest management cost of ABPs is through incineration (Scenario 1), while the most economically advantageous one is via rendering accompanied by utilization of products for further exploitation (Scenario 3).

4. Discussion

The ABPs management currently applied by the company (Scenario 2) is 3% more cost-effective than incineration and 28% more costly than Scenario 3. The cost of natural gas purchasing is the most important cost category for all three scenarios—namely, 76.7%, 77.2%, and 72.6% for Scenarios 1, 2, and 3, respectively, while the cost of purchasing electricity is not as significant (1.6%, 8.5%, and 13.5% for Scenarios 1, 2, and 3, respectively). For Scenarios 2 and 3, labor costs and electricity costs are the same.
In the work of Shahzad et al. [36], an operational cost of €39.5/ton ABP using slaughtering wastes was calculated. This cost is comparable with the €51.8/ton ABP calculated in this work, but the difference in the size of the facilities used in the calculations should be taken into account, with the capacity of the rendering unit examined in this study being 1.7 tons/h, while the one examined in the work of Shahzad et al. had a capacity of a 12.5 tons/h. Higher capacity facilities are expected to have lower operational costs per ton of material treated.
In order to put the results of this study into perspective, a comparison with other established treatment methods for this type of byproducts should be carried out. These methods are composting and anaerobic digestion. The comparison was carried out in terms of environmental, economic, and technological terms in the form of an AHP analysis. The data used and the results of the analysis are presented in Table 4. Data in Table 4 that are not accompanied by a reference are based on the results of this work, while the net profit was calculated by subtracting the profit from cost data presented in the Table.
By the final scores from the AHP analysis presented in Table 4, it is apparent that the rendering process examined in Scenario 3 is the most preferred method according to the criteria used, followed by anaerobic digestion, and then composting. The incineration of ABPs (Scenario 1) and the currently implemented management scenario by the slaughterhouse (Scenario 2) are the least preferable management methods. The main advantage of the rendering process is the production of high-value materials in low retention times when compared to the other techniques.
Currently, in Greece, more than half of the slaughterhouses use rendering for the treatment of their ABPs, but in many cases, they use it as a pretreatment for incineration or landfilling [40]. The data presented in this work can motivate enterprises that own rendering equipment to modify their processes, to recover more resources from ABPs and minimize the environmental footprint of livestock production.

5. Conclusions

The process of rendering as an ABP management method is characterized as effective, efficient, and safe. Its application has the effect of inactivating large volumes of ABPs and leads to the production of pathogen-free materials, which can be further utilized to produce animal feed, fertilizers and biofuels [18]. In the present study, the case of a slaughterhouse located at the Prossotsani Drama’s Industrial Park (Greece) was presented. The company currently manages, through rendering, Category 3 ABPs derived from fish and foodstuff with the generated products burned in a privately owned incinerator. The present study proposes the exploitation of processed ABPs by changing the rendering process presently followed in order to produce fishmeal or proteinaceous flour and fat of increased purity as final products. This proposal is the outcome of assessing three alternative ABP management scenarios using a mathematical model developed based on economic criteria and proving that further exploitation of the rendering process products is economically advantageous. Furthermore, through the AHP analysis it was indicated that the currently implemented waste management scenario is the least desirable one, while rendering with exploitation of its products had better score than composting and anaerobic digestion.

Author Contributions

Data curation, Writing—original draft preparation, D.Z.; Conceptualization E.K.; Resources, Writing—original draft preparation. C.Z.; Methodology, Formal analysis, Project administration, Writing—review and editing, supervision, M.K. All authors have read and agreed to the published version of the manuscript.

Funding

This research received no external funding.

Conflicts of Interest

The authors declare no conflict of interest.

References

  1. Aguado, S.; Alvarez, R.; Domingo, R. Model of efficient and sustainable improvements in a lean production system through processes of environmental innovation. J. Clean. Prod. 2013, 47, 141–148. [Google Scholar] [CrossRef]
  2. Musmarra, D.; Zafeirakou, A.; Manakou, V.; Emmanouil, C. Efficient and sustainable environmental management as a means of addressing current pollution issues. Environ. Sci. Pollut. Res. 2019, 26, 14703–14705. [Google Scholar] [CrossRef] [PubMed] [Green Version]
  3. European Union Directive 2008/98/EC of the European Parliament and of the Council of 19 November 2008 on waste and repealing certain Directives”. Off. J. Eur. Union 2008, 51, 3–30.
  4. Girotto, F.; Cossu, C.A. Animal waste and waste animal by-products generated along the livestock breeding and meat food chain. Waste Manag. 2017, 70, 1. [Google Scholar] [CrossRef]
  5. Marti, D.L.; Johnson, R.J.; Mathews, K.H. Where’s the (Not) meat? Byproducts from beef and pork production. In There’s The Beef: Select Research on Global Beef Production and Trade; Nova Science Publishers, Inc.: Washington, DC, USA, 2012; pp. 55–81. ISBN 9781619429437. [Google Scholar]
  6. European Commission Commission decision of 21 October 2009 laying down health rules as regards animal by-products and derived products not intended for human consumption and repealing Regulation No. 1774/2002 (Animal by-products Regulation), 1069/2009/EC. Off. J. 2009, 50, 1–33.
  7. Jędrejek, D.; Levic, J.; Wallace, J.; Oleszek, W. characteristics, European regulatory framework, and potential impacts on human and animal health and the environment. J. Anim. Feed Sci. 2016, 25, 189–202. [Google Scholar] [CrossRef]
  8. Bellarby, J.; Tirado, R.; Leip, A.; Weiss, F.; Lesschen, J.P.; Smith, P. Livestock greenhouse gas emissions and mitigation potential in Europe. Glob. Chang. Biol. 2013, 19, 3–18. [Google Scholar] [CrossRef]
  9. Sakadevan, K.; Nguyen, M.-L. Livestock production and its impact on nutrient pollution and greenhouse gas emissions. Adv. Agron. 2017, 141, 147–184. [Google Scholar] [CrossRef]
  10. Gerber, P.J.; Steinfeld, H.; Henderson, B.; Mottet, A.; Opio, C.; Dijkman, J.; Falcucci, A.; Tempio, G. Tackling Climate Change through Livestock: A Global Assessment of Emissions and Mitigation Opportunities; Food and Agriculture Organization of the United Nations (FAO): Rome, Italy, 2013; ISBN 925107920X. [Google Scholar]
  11. European Commission Commission regulation 999/2001/EC of 22 May 2001 laying down rules for the prevention, control and eradication of certain transmissible spongiform encephalopathies. Off. J. Eur. Commun. 2001, 147, 1–40.
  12. Alao, B.; Falowo, A.; Chulayo, A.; Muchenje, V. The potential of animal by-products in food systems: Production, prospects and challenges. Sustainability 2017, 9, 1089. [Google Scholar] [CrossRef] [Green Version]
  13. Toldrá, F.; Mora, L.; Reig, M. New insights into meat by-product utilization. Meat Sci. 2016, 120, 54–59. [Google Scholar] [CrossRef] [PubMed] [Green Version]
  14. Becker, G. Animal rendering: Economics and policy. In Proceedings of the Congressional Research Service report for Library of Congress; Congressional Research Service: Washington, DC, USA, 2004. [Google Scholar]
  15. Gooding, C.H.; Meeker, D.L. Comparison of 3 alternatives for large-scale processing of animal carcasses and meat by-products. Prof. Anim. Sci. 2016, 32, 259–270. [Google Scholar] [CrossRef] [Green Version]
  16. Woodgate, S.; Van Der Veen, J. The role of fat processing and rendering in the European Union animal production industry. Biotechnol. Agron. Société Environ. 2004, 8, 283–294. [Google Scholar]
  17. European Commission Commission Regulation (EU) No 142/2011 of 25 February 2011 implementing Regulation (EC) No 1069/2009 of the European Parliament and of the Council laying down health rules as regards animal by-products and derived products not intended for human consumpti. Off. J. Eur. Commun. 2011, 50, 1–254.
  18. Baladincz, P.; Hancsók, J. Fuel from waste animal fats. Chem. Eng. J. 2015, 282, 152–160. [Google Scholar] [CrossRef]
  19. European Parliament and Council Directive 2009/28/EC of the European Parliament and of the Council of 23 April 2009 on the promotion of the use of energy from renewable sources and amending and subsequently repealing Directives 2001/77/EC and 2003/30/EC. Off. J. Eur. Union 2009, 140, 16–62.
  20. Meeker, D.L. Essential Rendering; National Renderers Association: Arlington, TX, USA, 2006; ISBN 0965466035. [Google Scholar]
  21. Anderson, D. Rendering Operations. In Essential Rendering All about the Animal By-Products Industry; Meeker, D.L., Ed.; National Renderers Association: Arlington, TX, USA, 2006; pp. 31–52. ISBN 0-9654660-3-5. [Google Scholar]
  22. Bisplinghoff, F.D. A History of North American Rendering. In Essential Rendering: All about the Animal By-Products Industry; Meeker, D.L., Ed.; National Renderers Association: Arlington, TX, USA, 2006; p. 302. ISBN 9780965466035. [Google Scholar]
  23. Barrena, R.; Artola, A.; Vázquez, F.; Sánchez, A. The use of composting for the treatment of animal by-products: Experiments at lab scale. J. Hazard. Mater. 2009, 161, 380–386. [Google Scholar] [CrossRef] [Green Version]
  24. Zhang, H.; Matsuto, T. Comparison of mass balance, energy consumption and cost of composting facilities for different types of organic waste. Waste Manag. 2011, 31, 416–422. [Google Scholar] [CrossRef]
  25. Moukazis, I.; Pellera, F.-M.; Gidarakos, E. Slaughterhouse by-products treatment using anaerobic digestion. Waste Manag. 2018, 71, 652–662. [Google Scholar] [CrossRef]
  26. Salehiyoun, A.R.; Francesco Di, M.; Sharifi, M.; Noroozi, O.; Zilouei, H.; Aghbashlo, M. Anaerobic Co-Digestion of Sewage Sludge and Animal by-Product BT—Recent Trends in Waste Water Treatment and Water Resource Management; Ghosh, S.K., Saha, P.D., Francesco Di, M., Eds.; Springer: Singapore, 2020; pp. 1–10. ISBN 978-981-15-0706-9. [Google Scholar]
  27. Morales-Polo, C.; Del Mar Cledera-Castro, M.; Hueso-Kortekaas, K.; Revuelta-Aramburu, M. Anaerobic digestion in wastewater reactors of separated organic fractions from wholesale markets waste. Compositional and batch characterization. Energy and environmental feasibility. Sci. Total Environ. 2020, 726, 138567. [Google Scholar] [CrossRef]
  28. Vasco-Correa, J.; Khanal, S.; Manandhar, A.; Shah, A. Anaerobic digestion for bioenergy production: Global status, environmental and techno-economic implications, and government policies. Bioresour. Technol. 2018, 247, 1015–1026. [Google Scholar] [CrossRef] [PubMed]
  29. Kim, S.; Lee, Y.; Andrew Lin, K.-Y.; Hong, E.; Kwon, E.E.; Lee, J. The valorization of food waste via pyrolysis. J. Clean. Prod. 2020, 259, 120816. [Google Scholar] [CrossRef]
  30. Leon, M.; Garcia, A.N.; Marcilla, A.; Martinez-Castellanos, I.; Navarro, R.; Catala, L. Thermochemical conversion of animal by-products and rendering products. Waste Manag. 2018, 73, 447–463. [Google Scholar] [CrossRef] [PubMed]
  31. Irshad, A.; Sharma, B.D. Abattoir by-product utilization for sustainable meat industry: A review. J. Anim. Prod. Adv. 2015, 5, 681–696. [Google Scholar] [CrossRef] [Green Version]
  32. Jurgilevich, A.; Birge, T.; Kentala-Lehtonen, J.; Korhonen-Kurki, K.; Pietikäinen, J.; Saikku, L.; Schösler, H. Transition towards circular economy in the food system. Sustainability 2016, 8, 69. [Google Scholar] [CrossRef] [Green Version]
  33. Ajila, C.M.; Brar, S.K.; Verma, M.; Tyagi, R.D.; Godbout, S.; Valéro, J.R. Bio-processing of agro-byproducts to animal feed. Crit. Rev. Biotechnol. 2012, 32, 382–400. [Google Scholar] [CrossRef]
  34. Nelson, R.G.; Schrock, M.D. Energetic and economic feasibility associated with the production, processing, and conversion of beef tallow to a substitute diesel fuel. Biomass Bioenergy 2006, 30, 584–591. [Google Scholar] [CrossRef]
  35. Banković-Ilić, I.B.; Stojković, I.J.; Stamenković, O.S.; Veljkovic, V.B.; Hung, Y.-T. Waste animal fats as feedstocks for biodiesel production. Renew. Sustain. Energy Rev. 2014, 32, 238–254. [Google Scholar] [CrossRef] [Green Version]
  36. Shahzad, K.; Narodoslawsky, M.; Sagir, M.; Ali, N.; Ali, S.; Rashid, M.I.; Ismail, I.M.I.; Koller, M. Techno-economic feasibility of waste biorefinery: Using slaughtering waste streams as starting material for biopolyester production. Waste Manag. 2017, 67, 73–85. [Google Scholar] [CrossRef]
  37. Bottero, M.; Comino, E.; Riggio, V. Application of the Analytic Hierarchy Process and the Analytic Network Process for the assessment of different wastewater treatment systems. Environ. Model. Softw. 2011, 26, 1211–1224. [Google Scholar] [CrossRef]
  38. Samah, M.A.A.; Manaf, L.A.; Zuki, N.I.M. Application of AHP model for evaluation of solid waste treatment technology. Int. J. Eng. Techsci 2010, 1, 35–40. [Google Scholar]
  39. Chen, T.; Jin, Y.; Qiu, X.; Chen, X. A hybrid fuzzy evaluation method for safety assessment of food-waste feed based on entropy and the analytic hierarchy process methods. Expert Syst. Appl. 2014, 41, 7328–7337. [Google Scholar] [CrossRef]
  40. Valta, K.; Damala, P.; Orli, E.; Papadaskalopoulou, C.; Moustakas, K.; Malamis, D.; Loizidou, M. Valorisation opportunities related to wastewater and animal by-products exploitation by the greek slaughtering industry: Current status and future potentials. Waste Biomass Valorization 2015, 6, 927–945. [Google Scholar] [CrossRef]
Figure 1. Simplified rendering process of ABPs.
Sustainability 12 05870 g001
Figure 2. Currently implemented ABP management scenarios and specifications of the incineration and rendering unit.
Sustainability 12 05870 g002
Figure 3. Category 1 and 2 ABPs managed by the company during 2017 and the first four months of 2018.
Sustainability 12 05870 g003
Figure 4. Category 3 ABPs managed by the company during 2017 and the first four months of 2018.
Sustainability 12 05870 g004
Table 1. Categorization of animal byproducts (ABPs) according to the risk they pose to human and animal health and the environment.
CategoryRiskMaterial
1High risk
  • Animals and materials suspected or confirmed to be infected by transmissible spongiform encephalopathies (TSEs);
  • Animals that have been experimented on;
  • Zoo and pet animal carcasses;
  • Wild animals suspected of having an infectious disease;
  • Catering waste from international transport, i.e., aircraft and ships;
  • Specified risk material (SRM);
  • Animal tissue collected when treating wastewater from Category 1 processing plants.
2Medium risk
  • Animals that are slaughtered to prevent the spread of disease;
  • Manure and digestive tract content;
  • Animals and parts of animals which die by means other than slaughtering, e.g., fallen stock;
  • Animal tissue collected when treating wastewater from Category 2 processing plants.
3Low risk
  • Meat and fish from food manufacturers and retailers;
  • Former foodstuffs of animal origin, or containing products of animal origin;
  • Catering waste, other than catering waste from international transport;
  • Eggs and other by-products that do not show signs of infectious disease;
  • Milk;
  • Fish and other sea animals;
  • Shells;
  • Hooves, horns, and feathers.
Table 2. Cost coefficients per cost category for the three proposed Category 3 ABPs management scenarios.
Cost Category Cost Coefficients
UnitsScenario 1 Scenario 2 Scenario 3
Natural gas (A)KWh/ton ABP11361114725
Electricity (B)KWh/ton ABP6.08730.51734.884
Incinerator maintenance (1/C)y/ton ABP4.35 × 10−41.49 × 10⁻⁴-
Rendering maintenance (1/D)y/ton ABP-4 × 10−44 × 10−4
Ash disposal (E)kg Ash/ton ABP3010.26-
Labor (F)h/ton ABP0.871.4981.8
Environmental (G)h/ton ABP0.870.298-
Table 3. Operational cost of the three proposed scenarios calculated with current economic data.
Scenario 1Scenario 2Scenario 3
Cost
(€/ton ABP)
(%)Cost
(€/ton ABP)
(%)Cost
(€/ton ABP)
(%)
Natural gas56.8076.755.7277.237.6272.6
Electricity1.221.66.108.56.9813.5
Ash disposal12.60174.316--
Labor3.484.76.008.37.2013.9
Total74.1010072.1310051.80100
Table 4. Comparison of the results of this study with alternative treatment methods through AHP.
CompostingAnaerobic DigestionScenario 1
Incineration
Scenario 2
Rendering and Incineration
Scenario 3
Rendering
Energy consumption (MJ/ton ABP)250 [15]600 [15]411141182736
Cost (€/ton ABP)30 [24]63 [28]74.172.1351.8
Profit (€/ton ABP)30 [15]68 [15]00270 [15]
Net profit (€/ton ABP)05−74.1−72.13218.2
Retention time (d)50 [37]40 [37]<1<1<1
Normalized
Environmental score1.000.910.000.000.36
Economic score0.250.270.000.011.00
Technological score0.000.201.001.001.00
AHP score (%)53.954.910.110.372.4

