Development of Key Processes along the Supply Chain by Implementing the ISO 22000 Standard


1
Department of Management Systems and Logistics, Rzeszow University of Technology, 35-959 Rzeszow, Poland
2
Department of Management, Catholic University in Ruzomberok, Nabrezie Jana Pavla II. c. 15, 058 01 Poprad, Slovakia
3
ALGORITMI Research Centre, Department of Production and Systems, University of Minho, 4710-057 Braga, Portugal
*
Author to whom correspondence should be addressed.
Sustainability 2020, 12(15), 6176; https://0-doi-org.brum.beds.ac.uk/10.3390/su12156176
Submission received: 30 June 2020
/
Revised: 28 July 2020
/
Accepted: 28 July 2020
/
Published: 31 July 2020
(This article belongs to the Special Issue Supply Chain Management for Sustainable Development)
Abstract
:The aim of the article is to answer the question of whether the implementation of the requirements of the ISO 22000 standard in the food supply chain can support the implementation of key processes occurring in them, and thus increase the level of food quality and minimize its waste. The research was conducted out among several European countries, and an attempt was carried out to compare how the standard is perceived by entrepreneurs operating in Poland, Slovakia (Central and Eastern Europe), and Portugal (Western Europe). Covering the Polish, Slovak, and Portuguese organizations with the research process resulted from the fact that in recent years in these countries, an increase in the diversity of food demand and fragmentation of the food market has been observed. This forced food supply chains to be strictly focused on increasing the efficiency and effectiveness of production and distribution systems, as well as taking into account customer requirements and the implementation of sustainable solutions. Based on the results of the research, it can be concluded that the implementation of the requirements of the ISO 22000 standard along food supply chains can positively affect the implementation of key processes and thus contribute to reducing food waste at each stage of the supply chain.
1. Introduction
Sustainable food management and reduction of its waste is now becoming a very important challenge faced by both science and business representatives [1,2]. Moreover, food waste has received growing interest from local, national, and European policymakers, international organizations and NGOs. Increasing concerns about food safety and environmental impacts, such as resource depletion and greenhouse gas emissions attributed to food waste, have intensified attention on this topic [3]. As Principato et al. [4] rightly note, food loss and waste is one of the most serious social, economic, and environmental issues undermining our planet’s sustainability. A growing global population leads to an increasing demand for food production and the processing industry associated with it, and consequently the emergence of large amounts of food waste [5].
The unprecedented scale of food waste in global food supply chains is attracting increasing attention due to its environmental, social, and economic impacts. Conscious, rational, and systemic management of the food supply chain can have a significant impact on reducing food losses [6,7,8,9]. Raak et al. [10] stress that the effective implementation of logistics processes in the supply chain is one of the most important factors that may reduce food waste. Papargyropoulou et al. [11] suggest that the first step towards a more sustainable resolution of the food waste issue is the adoption of sustainable production and consumption patterns and tackle food surplus and waste throughout the global food supply chain. Kaipia et al. [12] point out, in a similar tone, that recognizing that streamlining supply chains in areas such as information management, supply, and distribution processes, can impact positively on reducing food waste. Cicatiello et al. [13] suggest that actions taken at the first stages of supply chain management and in trade and consumption are particularly important. The staff managing food supply chains should therefore reach for solutions that, in a comprehensive and systemic manner, can support the implementation of key processes and will be acceptable and implemented by all links that encompass a given supply chain [14,15]
Considering the above considerations, the aim of this article is to answer the question of whether the implementation of the requirements of the ISO 22000 standard in the food supply chain can support the implementation of key processes occurring in them, and thus increase the level of food quality and minimize its waste. The research covered the ISO 22000 standard due to the fact that it can be implemented by all organizations that comprise the food supply chain, no matter which role they play in it (producers, suppliers of semi-finished products, machinery, packaging, transport companies, etc.). The implementation of its requirements in food supply chains will therefore integrate the activities of individual links and subordinate their activities to the implementation of the main strategy adopted in the supply chain. The considerations undertaken in this article will fill the gap in the literature because they will be one of the first in which the impact of the implementation of the ISO 22000 standard on supply chain management in the context of minimizing food losses from the perspective of several European countries was examined.
2. Review of the Literature
2.1. ISO 22000 and Food Waste in the Supply Chain
The ISO 22000 standard combines the requirements of good practices, principles, and stages of implementing the HACCP system and elements of the management system modeled on the requirements presented in the ISO 9001 standard. ISO 22000 sets out requirements for the development of an effective food safety management system for organizations that contribute to the supply chain and feel the need to demonstrate their ability to control the threats, hazards, and risks that affect food safety [16]. The ISO 22000 standard requires enterprises to organize tasks and responsibilities by specifying requirements covering the provision of a product safe for the consumer and demonstrating compliance with applicable law and food safety requirements. The mainstream literature on this subject converges that the implementation of the requirements of ISO 22000 can improve business management processes and the supply chain through [17,18,19]:
- Organizing effective communication within the food supply chain,
- systematizing activities related to the production of safe food,
- optimization of resource use,
- more effective process control and food safety hazards,
- ensuring full identification and traceability of products, and
- increasing the quality and safety of manufactured products while ensuring repeatability.
Improving these processes can significantly affect supply chain efficiency and reduce food waste [20]. The concept of efficiency is based on optimizing the activities of all links along the supply chain in the area of physical flow of tangible assets, rational structure of activities and logistics costs, and ensuring optimal standards of customer service quality throughout the entire supply chain [21]. Improving the signaled areas contributes to the optimization of resources, minimization of errors and delays in the implementation of logistics processes, streamlining production processes, and delivering more effective customer service [22,23,24]. All these processes undoubtedly have an impact on reducing food waste along the supply chain [25]. In addition, it should be emphasized that food products are particularly vulnerable to damage in logistics and transport processes, and goods that do not comply with certain parameters cannot hit store shelves [26,27]. The management of supply chains must therefore meet logistical challenges, including inventory management: Forecasting demand and proper storage, meeting expectations regarding product quality, or coordination between sectors [28]. In the supply, distribution, or storage processes, mechanical damage and deterioration of goods may occur, which is caused by the expiry of the validity period or inappropriate storage conditions [29]. This is particularly important due to the fact that unused, overestimated, or damaged goods contribute to an increase in the amount of wasted food [30]. It is worth noting that food waste is not the domain of the main links coordinating supply chain management, but the initial links in the supply chain (producers and farms), and the last ones, whose role is to sell and create the social attitudes of potential consumers, also play a special role in this area [31,32,33]. As emphasized previously at the outset, the ISO 22000 standard is addressed to each organization encompassing the food supply chain. Thus, its implementation and improvement can contribute to the improvement of processes related to the proper storage and distribution of food at each stage of the supply chain [34]. It therefore seems that this system can indeed repair critical areas along the supply chain and thus minimize loss of food.
2.2. ISO 22000 and Food Supply Chain Management
The food supply chain connects three important sectors of the economy, i.e., agriculture, food processing, and distribution, which have a significant impact on the level of economic welfare, and the social and environmental situation of citizens. Increased consumer expectations and their concern about quality and food safety; requirement of diversified food chains; and profit-oriented food enterprises development has forced the manufactures to improve quality and food safety standards of their products by implementing management systems. Increased demand for safe food act is forcing development of new, improved standards, along with regulations to achieve safer food [16]. Due to the specificity of food supply chains and significant quality requirements, it becomes important that individual links that co-create food supply chains are constantly improving and looking for solutions, leading to an increase in the efficiency of processes and coordination of activities within the supply chain [35]. It is worth emphasizing that the food supply chain is characterized by a large variety of entities included in it. It includes manufacturers, suppliers, shipping companies, warehouses, wholesalers and retailers, service organizations, and consumers. They constitute a network of organizations involved, through relationships with suppliers and customers, in various processes and activities that create value in the form of products and services delivered to end consumers [36]. These entities support key subsystems in supply chains such as purchasing, production, and distribution. Their proper implementation is fundamentally important for effective customer service and minimizing food losses [37]. It is worth noting that each of the logistics subsystems has a significant impact on reducing food waste in the supply chain. The supply subsystem in the food supply chain is designed to provide the appropriate raw materials and materials for production. It should be emphasized that the selection, evaluation, and control of suppliers are important, but only fragmentary elements of the overall cooperation with suppliers. A production company should go beyond the rigid framework and strive to develop long-term partnerships and mutually beneficial relationships with suppliers. A key role in the development of the optimal level of product quality is played by production companies, which are responsible for the process of designing and manufacturing products that satisfy the customer and meet the requirements of applicable legal regulations. These companies shape the quality of goods at the stage of: Design work and purchase of necessary components, production processes, as well as distribution and after-sales service, i.e., it covers all phases of material flow within the supply chain [38]. Production processes should be carried out under supervised conditions, with the use of appropriate equipment, procedures, and control of the required properties of the product [39]. In addition, during production, one should strive for full traceability of the product, and its components identify the product status and keep appropriate documentation. Jevšnik et al. [40] emphasize that production processes in the food supply chain should be subject to special control because it is during their implementation that the greatest losses of food occur. Trienekens and Zuurbier [41] indicate that quality assurance will dominate the process of production and distribution. The primary processes will be standardized to reduce risks, moving to zero-defect solutions. Specifically, the larger retailing companies will put pressure on their suppliers to comply with all standards, public and private. Streamlining distribution processes is also of interest to standardized management systems. In their decisions, they require the implementation of procedures ensuring a safe way of delivering the finished product to the customer. Particular emphasis is placed on securing and appropriate packaging and labeling of the product to improve its flow in the distribution channel and protect it against losing its original properties [42].
2.3. Justification of the Hypotheses Adopted
It is very important that the ISO 22000 standard can be implemented by the cells operating at every stage of the supply chain, so the impact of the ISO 22000 standard on the basic processes in the supply chain should be visible [43]. As rightly noted by Manzini and Accorsi [44] the current level of development of knowledge about management systems and standards and the challenges of practice motivate to implement solutions for improving the basic processes of managing food supply chains. Fernandez-Segovia et al. [45] recognize that the ISO 22000 standard not only positively affects food safety in logistics processes, but also increases the competitiveness of the supply chain. Chen et al. [46] consider that ISO 22000 offers a variety of potential benefits to verification organizations, including: The optimal allocation of resources within food chain organizations; the effective communication of relevant legal requirements between suppliers, customers, supervisory authorities, and other relevant institutions; a focus on prerequisite programs (PRPs), conditions, and health measures, and the planning of preventive measures to eliminate any possible failures; better documentation; and creating and building trust. In turn, Politis et al. [47] note that carrying out monitoring and control in the supply chain is a complicated issue and even the implementation of the ISO 22000 standard cannot guarantee that every organization will perform these activities correctly. There are also opinions that the ISO 22000 standard does not fully take into account the complexity of food supply chains and its implementation may not necessarily have positive effects [16]. Moreover, many authors indicate that supply chain management is an extremely complex process and requires close cooperation of cells performing various functions, moreover, the impact of standardized management systems on logistics subsystems in supply chains is different [48,49].
Bearing in mind the above considerations. The article attempts to verify the following hypotheses:
Hypothesis 1.
The implementation of the requirements of the ISO 22000 standard supports the functioning of the main logistic subsystems in the supply chain (such as: Purchasing, production, and distribution), however, the degree of their impact on them may vary.
Hypothesis 2.
The implementation of the ISO 22000 standard leads to the improvement of planning and control processes and the minimization of potential errors in food supply chains.
The verification of the adopted hypotheses seems to be very important because the literature on the subject lacks studies that cover the issue of the impact of the ISO 22000 standard on the implementation of key logistics subsystems in the supply chain. As stated above, the impact of this standard on individual subsystems may be different, and subsystems may also affect potential food losses in a different way. The acquired knowledge will therefore help to optimize the management of the food supply chain at its individual stages and implement appropriate improvement solutions, which should contribute to reducing food losses.
As rightly noticed by many researchers, important factors that may affect the assessment of the ISO standard in the analyzed context are variables such as the size of the examined enterprise, system maturity, or external conditions [48,49]. Companies operating in different countries may also differently assess the impact of management systems on the operation of the supply chain [50]. Trienekens and Zuurbier [41] highlight that currently, there is a proliferation of standards worldwide. One effect is that, in particular, companies from developing countries and emerging economies have problems to comply with these standards. There can be many reasons for this. They include, among others, different organization of logistic processes, different levels of technological development, access to resources, or professionalism of consulting units [50,51]. With this in mind, the following hypothesis was also verified:
Hypothesis 3.
The assessment of the impact of the ISO 22000 standard on the functioning of food supply chains differs due to the conditions of the analyzed organization and the supply chain.
When reviewing the literature on the subject, it can be concluded that there is a great deal of research on the impacts of the ISO 22000 standard on the functioning of individual enterprises. However, there is still a lack of research on the impacts of the ISO 22000 standard on the implementation of key processes in food supply chains, notably from the point of view of various European countries. The authors’ intention is therefore to conduct research covering the entire supply chain in various European countries, and to analyze the results obtained in the context of the impact of the implementation of the ISO 22000 standard on reducing food waste throughout the supply chain.
3. Methodology
Empirical research was carried out by the authors in the first half of 2017 and covered the substantive and organizational activities. The questionnaire encompassing both open and closed questions was adopted as a research tool. The questionnaire was developed in the English version and then translated into Polish, Slovak, and Portuguese. The 3-part questionnaire consisted of several target-oriented variables. The first part encompassed several questions aiming to capture the characteristics of the organization (country; ISO 22000 implementation; QMS certification, nr. of employees; years of ISO 22000 implementation). In the second part, the questionnaire focused on capturing opinions on the effects and the need for this international standard (positive impact; ISO 22000 effects on improvements in the field of: Distribution process, production process, development process, control process, purchase process; necessity of QMS implementation). The third part of the questionnaire was focused on obtaining opinions on ISO 22000 impacts (impact on integration of individual partners along the supply chain; impact on the easiness of identification of potential errors). The data structure was thus represented by a total of 14 variables whose detailed characteristics are shown in Table 1.
Considering the short shelf life of food raw materials determined by the physiological and microbiological processes occurring in them and the diversity of agricultural products in terms of difficult to control quality parameters that are affected by seasonality, variety diversity, and their spatial distribution, the key to their safety and reduction of waste is the effective implementation of basic processes in the supply chain. Therefore, the research process covered aspects of supply chain management, the correct implementation of which can speed up logistics processes and reduce errors and delays that may result in the products being unfit for consumption. Considering the above, the research process was covered by:
- ISO 22000 effect on purchase process improvements: Mistakes made in the supply process destabilize the correct implementation of other logistics processes and may cause stagnation of production processes, delays in deliveries, problems with storage, etc., which may cause an increase in food losses in key processes implemented in supply chains.
- ISO 22000 effect on distribution process improvements: Distribution processes affect the quality, date, and place of delivery, and create appropriate hygiene conditions to ensure delivery of an optimal quality product. Improving these aspects minimizes food losses in transport processes.
- ISO 22000 effect on production process improvements: Improvement of these processes allows for a flexible organization of production, synchronizing the production process of the procurement, storage, and optimization of processes, and waste minimization.
- ISO 22000 effect on development process improvements: The lack of matching products to the needs of consumers, whose requirements are constantly increasing, reduces sales, which is particularly acute in the case of food products (often with a short shelf life),
- ISO 22000 effect on control process improvements: Throughout the entire supply chain, there is a need to extend the shelf life of food products by controlling their external and internal characteristics. These features require the creation of effective forms of control in food supply chains.
- ISO 22000 impact on the easiness of identification of potential errors: Reducing errors and mistakes, especially in food supply chains, allows you to avoid food losses and quickly implement improvement actions.
- ISO 22000 impact on the integration of individual partners along the supply chain: Ensuring product quality requires close coordination between partners in the supply chain. Lack of information flow and coordination of activities may result in many irregularities in logistics processes. In turn, long-term partnerships and integration of attempts to optimize processes, whose beneficiaries are both suppliers and customers.
Considering contemporary consumer trends, who require safety, freshness, reliability, availability, and convenience, the proper functioning of the above processes is a priority issue, and negligence in this area undoubtedly affects the amount of food losses generated in the supply chain and households.
Procedurally, the reliability of the results was tested through Cronbach’s Alpha. For an overall picture of the nature of the results, procedures of descriptive statistics were used, which captured the characteristics of variables across several aspects: Through position measures, variability measures and asymmetry measures. Inferential statistics methods were used to investigate the interrelationships between variables, which made it possible to identify statistically significant relationships. Specifically, bivariate correlation analysis and analysis of variance (ANOVA) was adopted. The results were processed in the statistical software IBM SPSS Statistics v. 24 and Minitab. The results are presented with respect to the defined research problem.
The subjective scope of the empirical research was those organizations that have a certified quality management system according to ISO 22000. In order to determine information about the organizations certified to ISO 22000 sources of information such as national registers of certificates and certification bodies were used. In Portugal, the information concerning the amount of companies that are certified according to a peculiar standard is publicly available online at the IPAC database (http://www.ipac.pt/pesquisa/pesq_empcertif.asp). In addition, a list of the companies (and contacts) certified according to the ISO 22000 standard was made available by a Portuguese periodical journal that regularly monitors the evolution of certified companies in Portugal.
The assumption of the authors was that the research should cover a similar number of organizations operating in Central, Eastern, and Western Europe. Bearing in mind the fact that in Portugal the ISO standard has been implemented by 301 organizations, whereas in Poland and Slovakia by 658 companies. The research process covered all Portuguese organizations that have implemented the requirements of ISO 22000, and 300 randomly selected organizations operating in Poland and Slovakia. A stratified proportional sampling was used, in which the stratification criterion was a country and the proportional criterion was the population of the country. The aim of this sampling method was to ensure the proportionality respondents and to avoid the risks associated with response bias.
The selection of Polish, Slovak, and Portuguese organizations for research resulted, among others, from the following premises:
- Poland and Portugal have very similar GDP per capita, taking into account the real purchasing power of national currencies,
- agriculture and food production play an important role in all countries studied,
- enterprises operating in the surveyed countries are looking for solutions supporting sustainable supply chain management, and
- consumers’ awareness of sustainable development is increasing in the analyzed countries.
Covering the Polish, Slovak, and Portuguese organizations with the research process also resulted from the fact that in recent years in Poland and Slovakia experienced an increase in the diversity of food demand, and fragmentation of the food market has been observed. This forced food supply chains to be strictly focused on increasing the efficiency and effectiveness of production and distribution systems, as well as taking into account customer requirements and the implementation of sustainable solutions. Parallel to these positive, pro-ecological changes in consumption patterns, food waste is still a significant problem in Portugal, Poland, and Slovakia. It should be stressed that in Portugal, several voluntary projects from NGOs, such as Refood (https://www.re-food.org/en), have emerged recently, aiming at forwarding food in excess from restaurants and patisseries to people in need, which expresses the awareness of this issue among the society.
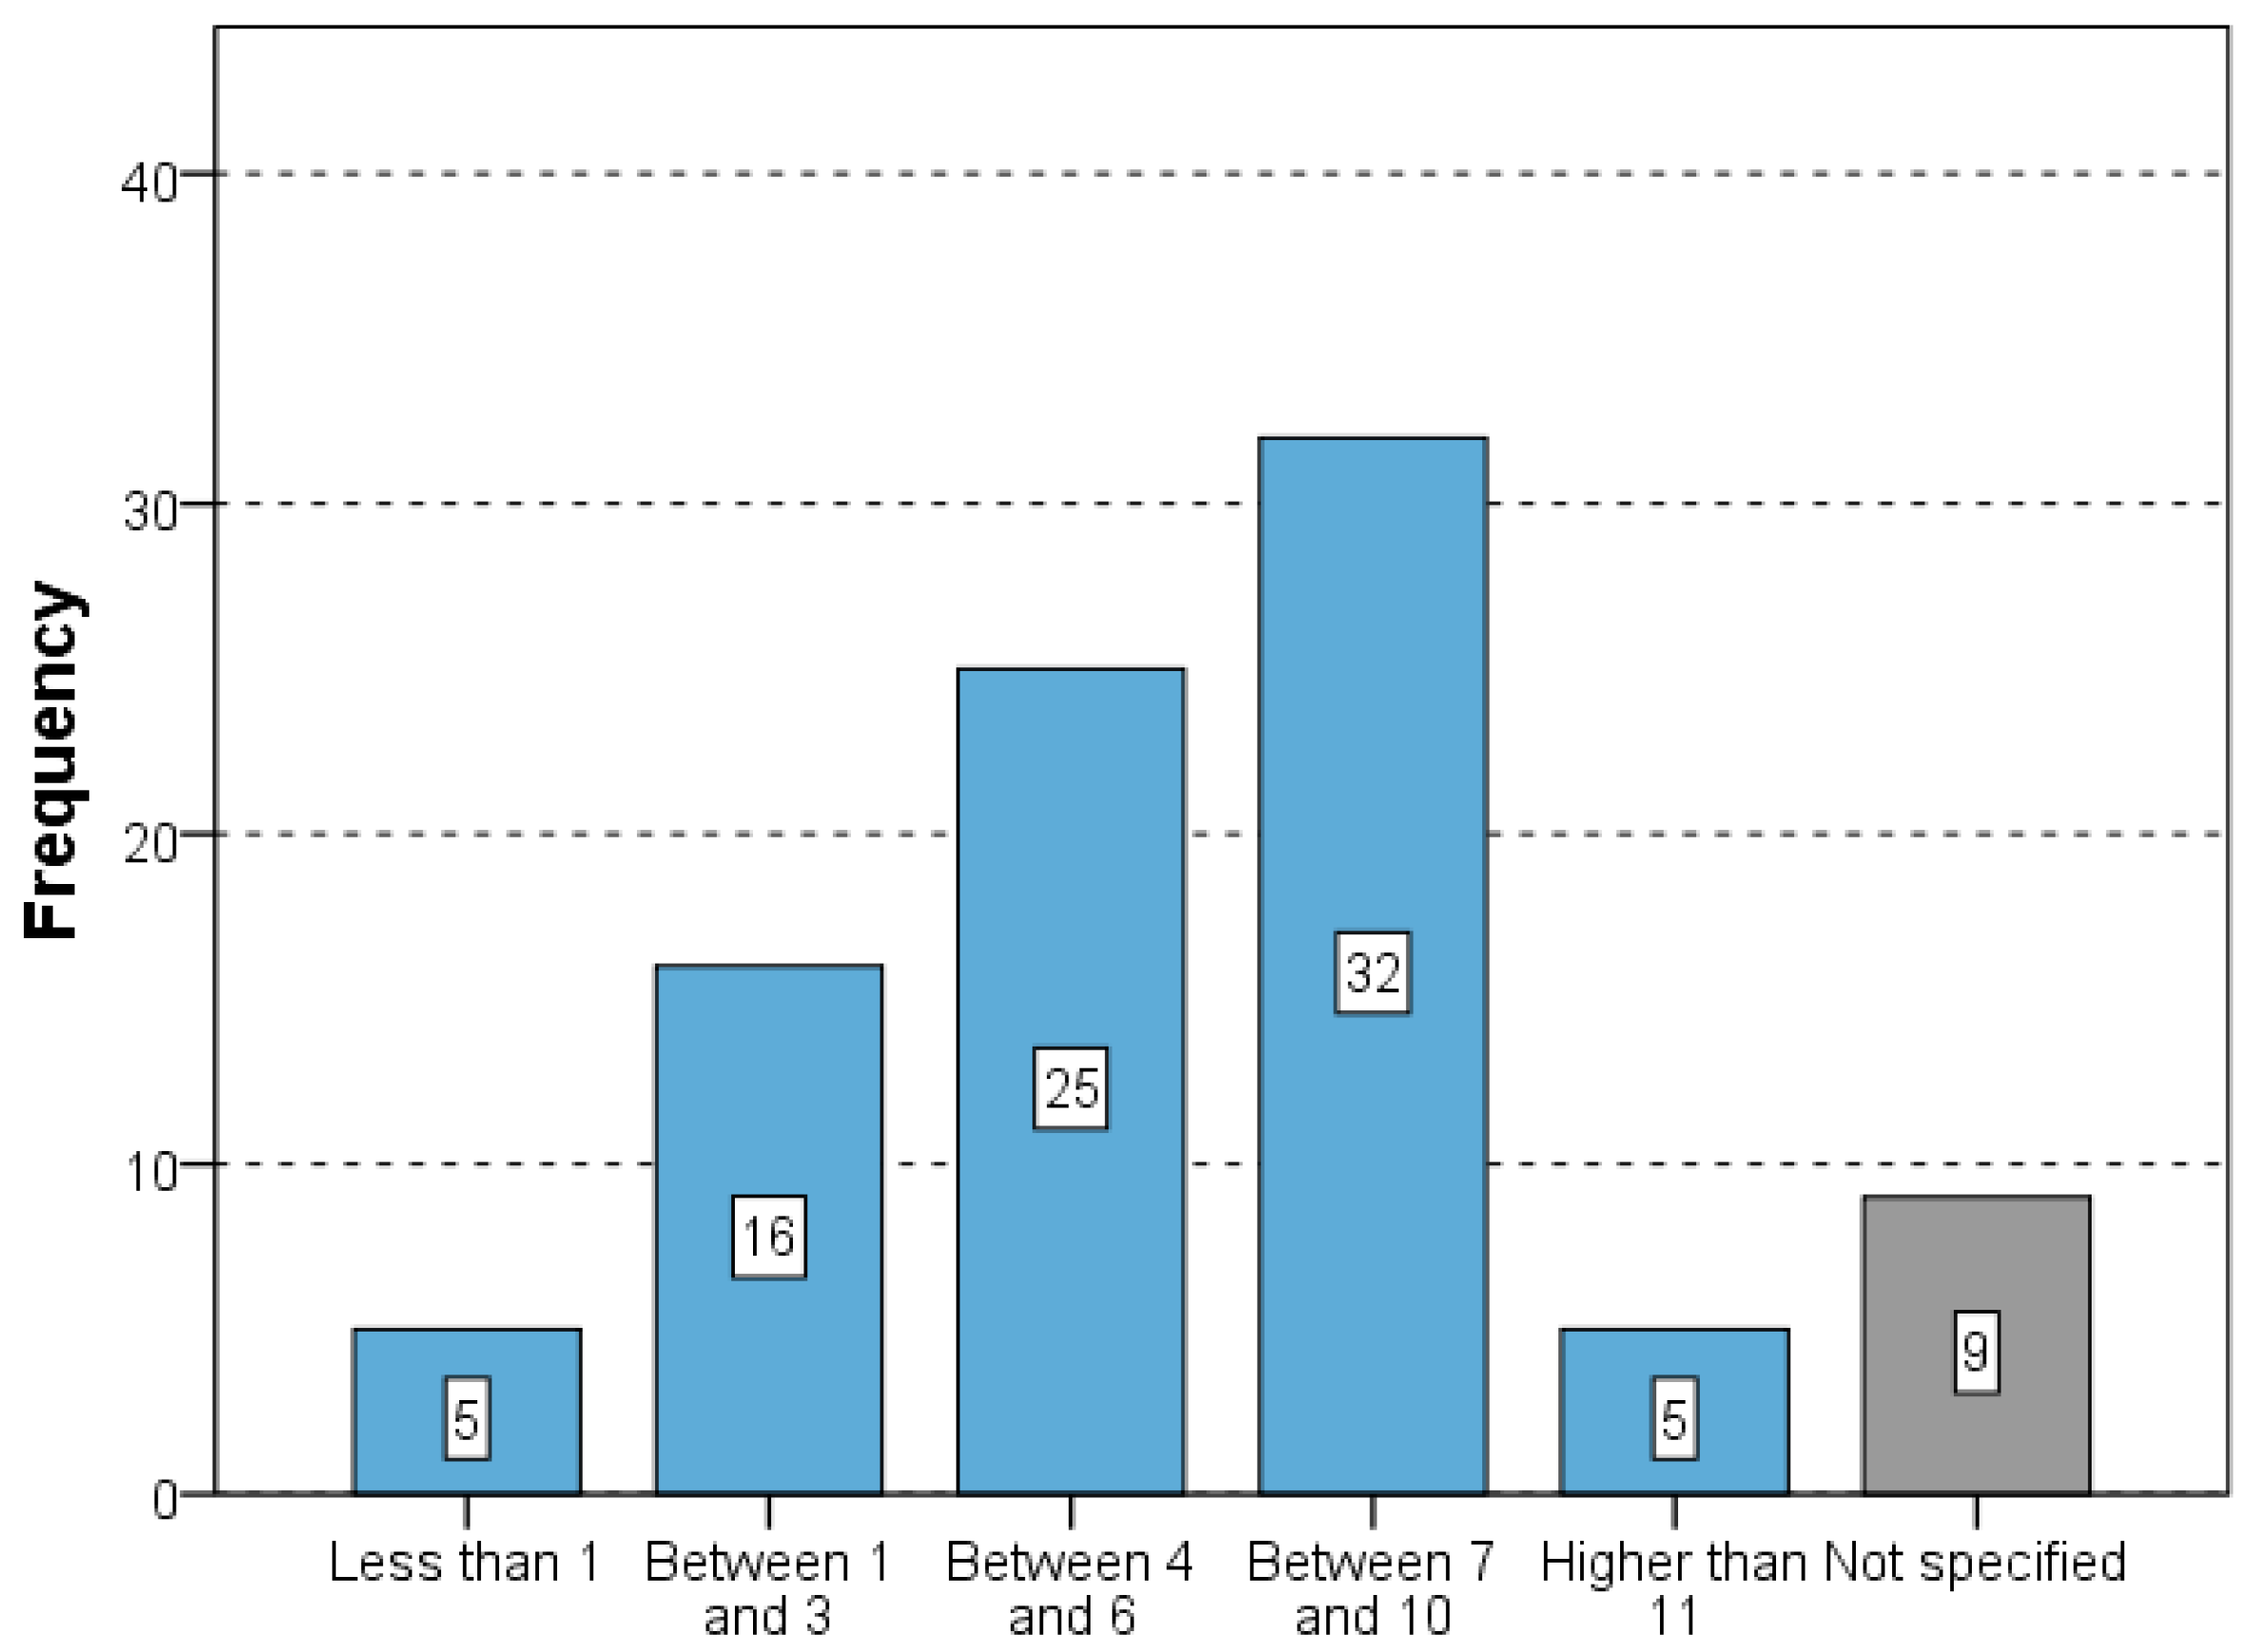
The research was carried out using an online survey emailed to the representatives of the top management of the surveyed organizations. A total of 92 valid questionnaires were processed. The average return was at the level of 14%. Overall, 27 organizations from Poland, 49 organizations from Portugal, and 16 organizations from Slovakia were involved in this survey. From those organizations, 7 (7.60%) had not implemented the ISO 22000 standard, 74 (80.40%) had implemented the ISO 22000 standard, and 11 (12.00%) did not answer this question. Six organizations (6.52%) stated they had no management system certified, 66 organizations (71.74%) stated they had one or more management systems certified, and 20 organizations (21.74%) did not comment on this issue. Nearly 40% (37) of the organizations had 1 to 50 employees, 33.70% (31) had 51 to 250 employees, 8.70% (8) had more than 250 employees, and 17.40% (16) organizations did not comment on this issue. The fourth identification variable was aimed at identifying organizations’ experience with the ISO 22000 based management system. The results are shown in Figure 1.
While analyzing the results presented in Figure 1, it can be seen that the vast majority of the surveyed organizations hold the ISO 22000 standard certificate for at least 4 years. This is relevant information because this system can be considered as well-established, mature, and integrated within the enterprise, which will allow the results to be considered more reliable.
4. Analysis of Test Results
A preliminary analysis of the results suggests that the implementation of the requirements of the ISO 22000 standard has a significant impact on the functioning of the examined aspects (Table 2).
In the five-point scale, an average rating of 4.1 was achieved by Polish and Slovak companies, whereas an average rating of 4.3 was achieved by Portuguese companies (the average score for all the sampled organizations was 4.2). On this basis, it can be provisionally concluded that the food supply chains that have implemented the requirements of ISO 22000 are functioning effectively, notably in areas such as production and control.
4.1. Testing of Reliability
As pointed out previously, a great deal of variables were assessed through the adoption of a Likert 5-point scale. The reliability of this scale was tested and its sufficient resolution using the reliability test. A set of five scale variables was tested, yielding a Cronbach’s Alpha of 0.705, which represents sufficient scale reliability. Consequently, situations with fewer variables were tested. The results are shown in Table 3.
The results did not identify a significant difference in reliability in case of variable removal. In solely one case (Devel_process), a slightly increased Cronbach’s Alpha value (0.754) was observed compared to the total value (0.730). However, this is a relatively small increase—the loss of information associated with removing a variable would be higher than the benefits of a higher reliability of the scale. Therefore, we have retained all the above scale variables in the analysis. Other set of variables (output variables) was also tested, yielding a Cronbach’s Alpha of 0.946, which represents very good scale reliability. Table 4 presents the results of the reliability testing.
As part of the reliability tests, an analysis of the existence of undesirable effect associated with multicollinearity was also performed. Linear regression was used for testing, in which the level of variable inflation score (VIF) was assessed. The threshold for VIF varies among several studies—some papers present that VIF < 10 means that multicollinearity effect is not strong [52], others argued that VIF < 5 or tolerance more than 0.2 declares low multicollinearity effect [53]. The results of the multicollinearity testing are shown in Table 5. The VIF values were relatively low and did not exceed any of the recommended thresholds. Thus, a multicollinearity that could affect the reliability of the results was not identified.
The last reliability test performed was the testing of the common method bias (CMB). CMB describes the measurement error that is compounded by the sociability of respondents who want to provide positive answers [54]. CMB can be tested through a factor analysis procedure. Table 6 shows the results of CMB testing using principal component analysis, with the number of factors determined at value 1 and no rotation technique being used. All variables entered the procedure (five input and two output variables). Since the values of the explained variability were lower than 50%, it can be stated that the correlation structure between the variables does not show a high degree of measurement error, which could significantly skew the results.
4.2. Levels of ISO 22000 Effects
Descriptive statistics procedures were adopted to assess the level at which ISO 22000 affects organizational performance. In addition to traditional position measures (e.g., Mean), variability measures (e.g., Standard deviation), and asymmetry measures (e.g., Skewness) were also recorded. The results are presented in Table 7.
Several conclusions can be drawn from the results. First of all, it should be pointed out that all monitored variables have reached a negative skewness value. This means that organizations have tended to overestimate the effects of ISO 22000 on individual issues—giving higher values than lower ones. This may be due to a natural positivist approach, or it may have a practical explanation. This can be influenced by some pressure from opinion leaders who promote the view of the effectiveness and efficiency of standardized management systems.
The second major finding is that for two output variables—ISO 22000 impact on the integration of individual partners along the supply chain, and ISO 22000 impact on the easiness of identification of potential errors—their values were significantly lower (3.53 and 3.79) than the value of other variables (average of 4.17). Such a situation sometimes also occurs when measuring customer satisfaction [55,56]. Even when measuring customer satisfaction, it sometimes happens that, for example, overall customer satisfaction with a product is lower than the average satisfaction with product attributes. This may be due to the respondents’ perceived different importance of these attributes. Whether this is the same case and whether it is a statistically significant difference has been verified in our case by bivariate correlation analysis (Table 8).
Although bivariate analysis has shown statistically significant relationships, it is not possible to point out a strong dependence. In most cases, the correlation coefficients were below 0.500, which can be considered a relatively weak correlation. Two resulting variables (Imp_integration and Imp_errors) showed relatively weak relations compared to other variables. Based on these results, it can be concluded that ISO 22000 impact on the integration of individual partners along the supply chain and ISO 22000 impact on the easiness of identification of potential errors is relatively independent of improvements in observed process areas, suggesting that additional factors/variables should be considered in addition to the processes improvement.
4.3. Factors Affecting the Level of ISO 22000 Effects
In addition to the variables analyzed above, other aspects were taken into account in the survey. These then formed the basis for stratified analysis of effects. It was examined whether the individual effects in five types of processes (distribution, production, development, control, purchase) and two output effects (ISO 22000 impact on individual partners along the supply chain and ISO 22000 impact on the easiness of identification of potential errors) vary by country, organization size, years of ISO 22000 implementation, and necessity of MS implementation. The statistical analysis of impacts was used for analysis of variance (ANOVA) resp. Student’s t-test depending on the nature of the stratification variable.
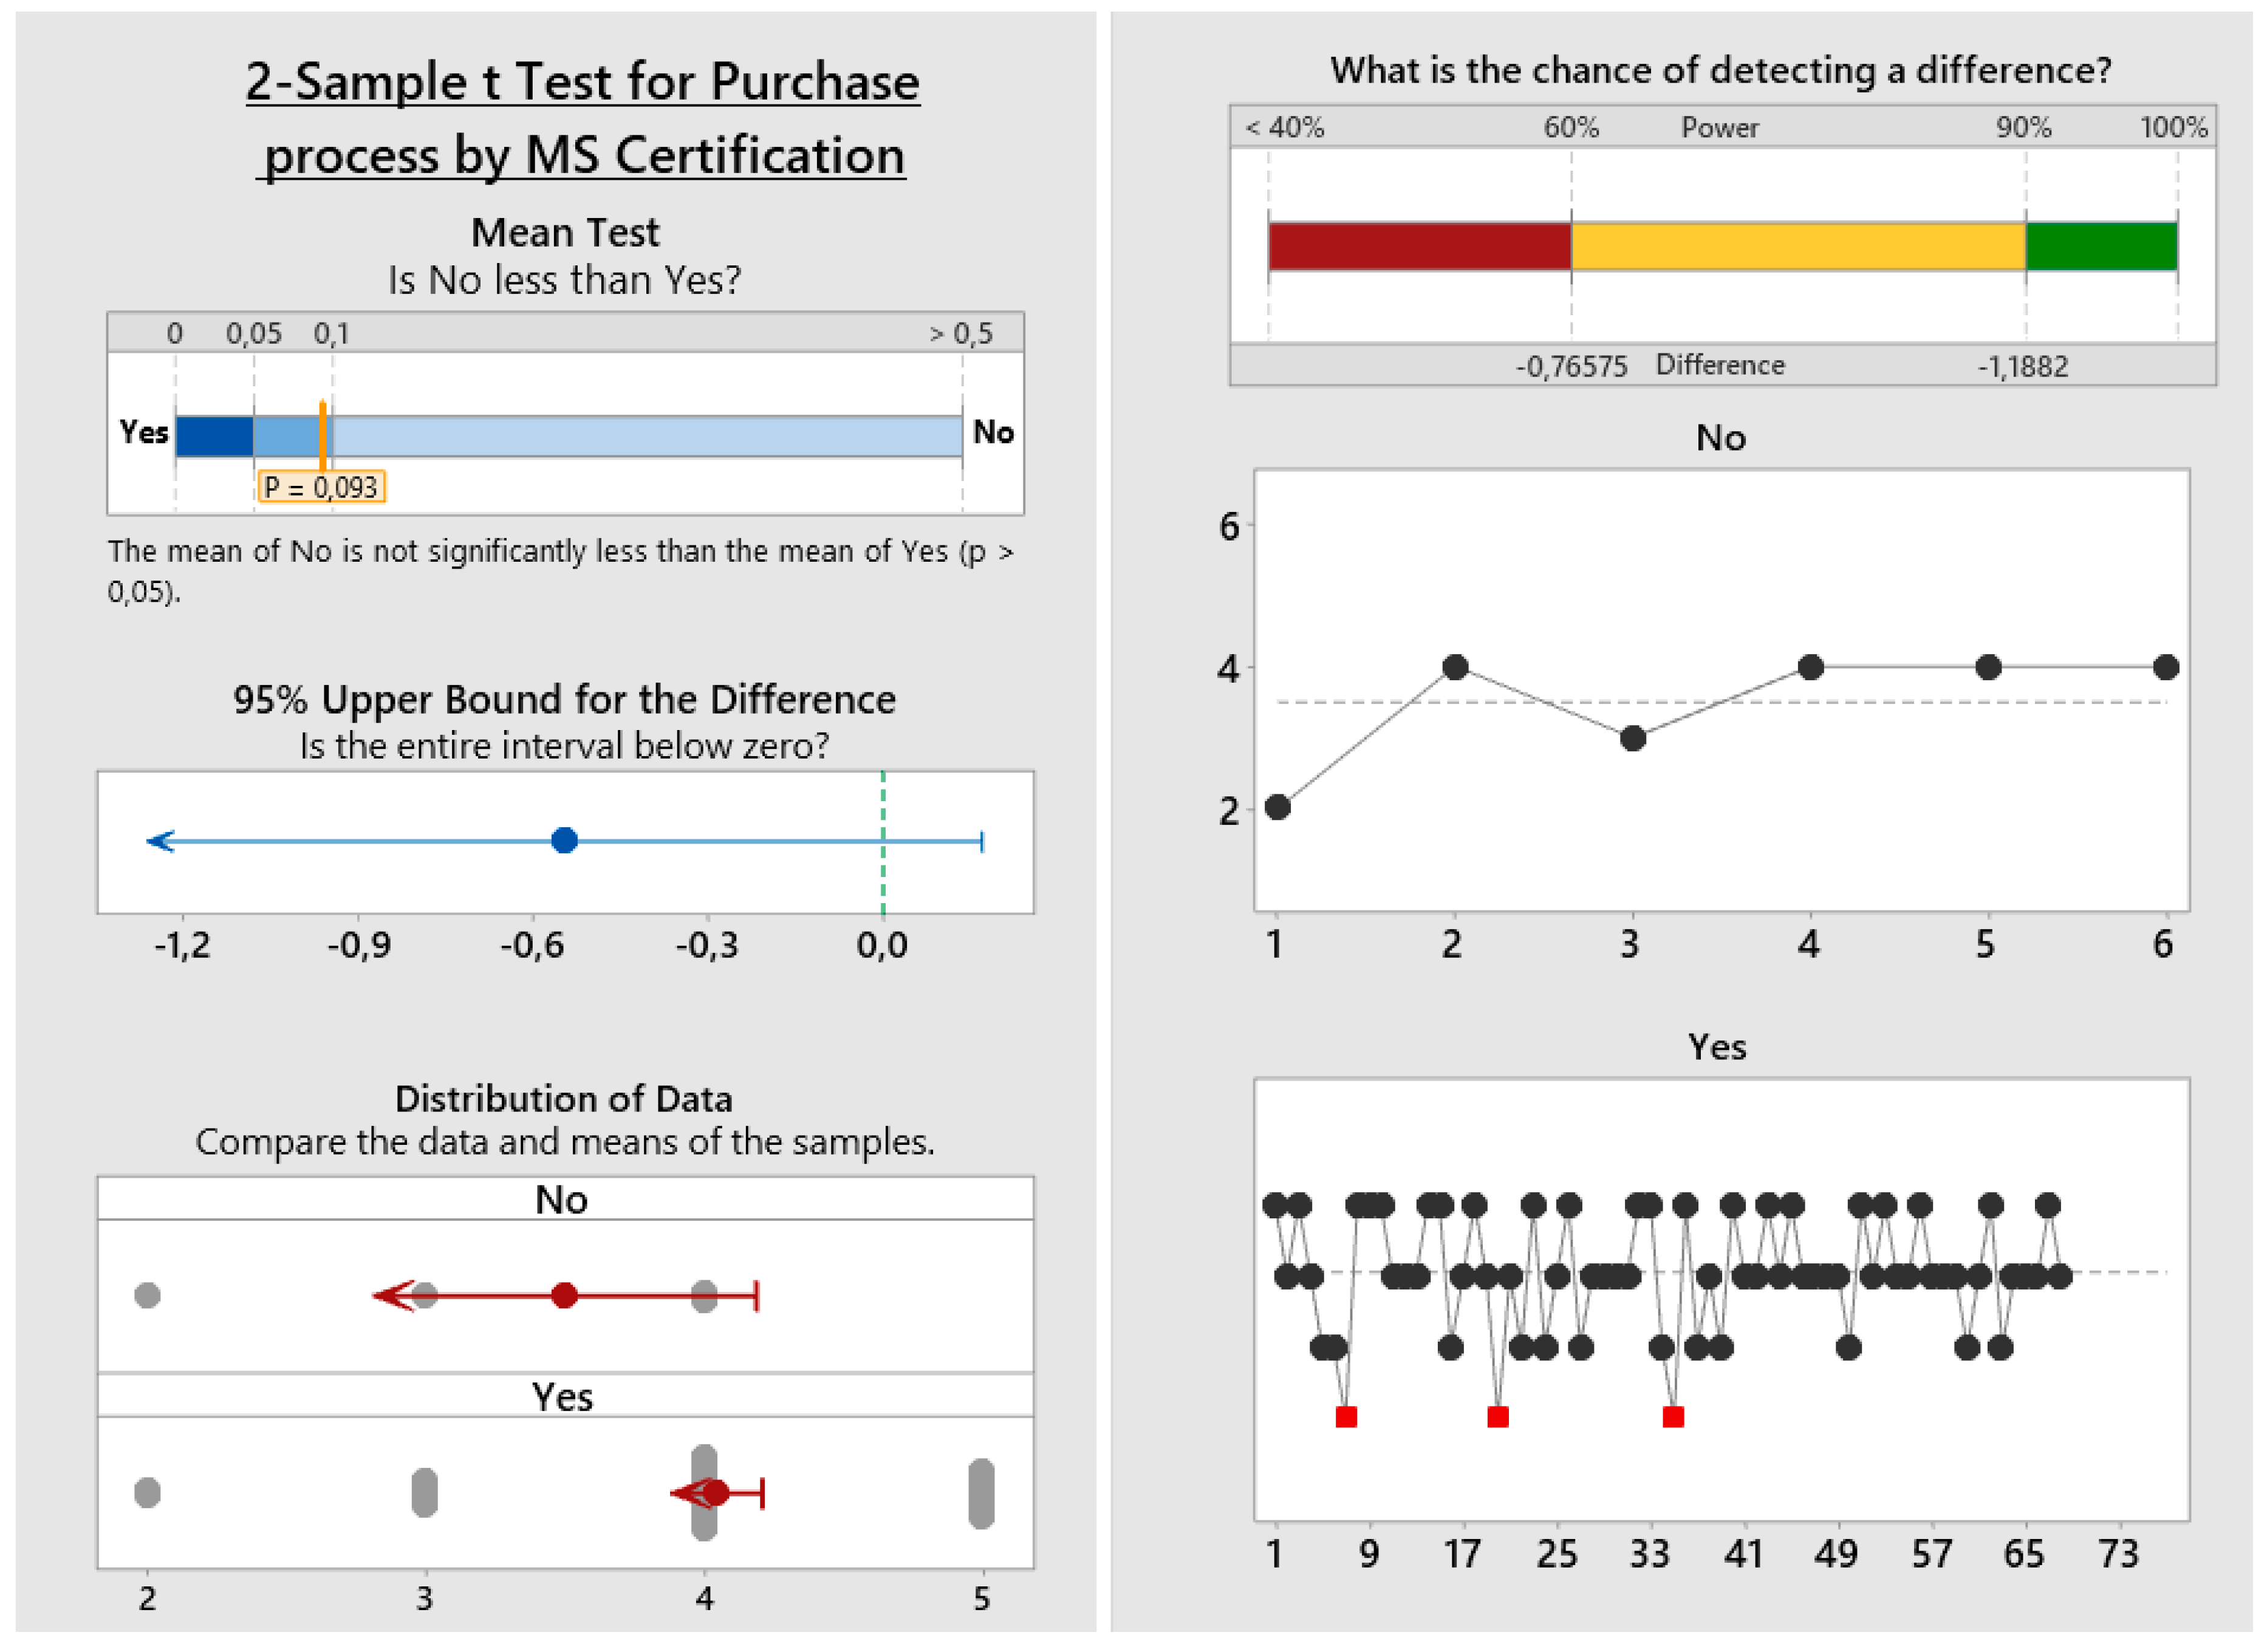
The results were processed in the Minitab statistical software. The aim was to identify statistically significant factors affecting the performance of the organization in the monitored areas. Figure 2 shows a sample of one analytical output that did not show a statistically significant dependence—the figure shows the results of the 2-Sample t-Test for two variables: Purchase process and MS certification. This test did not identify significant differences in purchase process between two groups (first with MS certification, second without MS Certification). This result is also highlighted by showing distribution of data in the bottom left part of Figure 2. Outlier values investigation between groups (which can help to detect particular differences) is located in right part of the Figure 2. In this particular case, all results lead to a conclusion, that relationship between purchase process and MS Certification is not statistically significant.
In total, such testing was performed 35 times—5 Input variables: Distr_process; Prod_process; Devel_process; Contr_process; Purch_process; 2 Output variables: Imp_integration; Imp_errors; and 5 factors variables: Country; ISO22000_Imp; MS_Certification; Size; Necessity. The results are presented in the following tables, complemented with a brief interpretation.
Results of ANOVA by stratification variable “Country” are shown in Table 9.
Analysis of variance has revealed two significant relationships. The first is the effect of ISO 22000 on the distribution process. The analysis showed that there is a statistically significant difference between the perceptions of improvements in the distribution process with respect to the country, which can be related to the peculiarities of the distribution channels within each country. In Poland and Slovakia, the perception of the improvement of the distribution process under the influence of ISO 22000 was approximately the same (the analysis did not show a statistically significant difference). However, the results in Portugal differed significantly from those obtained in Poland and Slovakia. Organizations from Portugal declared a higher rate of improvement in the distribution process (average 4.579) than organizations from Poland (average 3.646) and Slovakia (average 3.469). Concerning the development process Portuguese companies rate lower (with statistical significance) the perceptions of improvement under the influence of ISO 22000 standard. This may suggest that eastern European companies are being more proactive addressing current and forthcoming needs and expectations from the customers.
Next testing of significance was based on ISO 22000 variable implementation—results are shown in Table 10.
Results of differentiation effects testing according to ISO 22000 implementation revealed no statistically significant differences. It can be stated that organizations that implemented the ISO 22000 management system achieved similar results to those that did not implement it. However, it should be noted that the result may be partially affected by a smaller number of organizations that did not supplement ISO 22000—there were only seven in our sample. In addition, the perception of the added value of the implementation of a meta-standard is dependent on a great deal of factors such as (among others) the maturity of the management system, the relative position of the company on the supply chain, the lack of information regarding benchmarks, and the complexity degree of the product/service to be delivered. It should also be pointed out that the perception from certified companies was supported on quantitative data (according to the standard those processes should be monitored through SMART objectives) which is not a requirement for non-certified companies (the perception may be solely based on one respondent and, thus, biased).
The next testing of significance was based on MS_Certification variable—results are shown in Table 11.
According to these results, it seems that the management system certification does not have a significant impact on the performance of the organization in the monitored areas. Since the probability value (p-value) was in no case less than 0.050, no effects that were statistically significant were identified. As stated previously, the low number of respondent companies holding an ISO 22000 certificate precludes any other comments. Nevertheless, it should be pointed out that a great deal of the benefits pointed out by companies after a meta-standard implementation are intangible and difficult to quantify.
The next testing of significance was based on variable Nr. of employees (Size)—results are shown at Table 12.
ANOVA revealed one statistically significant relationship. This relationship is the improvement in the distribution process with regard to the number of employees. The analysis showed that large organizations with more than 250 employees perceive a higher rate of improvement in distribution processes than smaller organizations. This result is in line with other studies, suggesting that smaller companies encompassing the supply chain are required by larger companies (usually those in a direct relationship with the final customer) to proceed with the implementation and certification of a meta-standard. Usually this aims at developing a common language (based on the PDCA cycle) along all the supply chain encompassing smaller, medium, and larger companies.
Necessity of QMS Implementation—results are shown in Table 13.
The analysis revealed three statistically significant relationships: Production, development, and control processes. The results suggest that those respondents who highly rate the improvements in these processes feel the need of a QMS implementation. This fact suggests that a systemic approach, such as that embedded in the ISO meta-standards standard, drives to a perception of a great deal of improvements by the respondents when compared with the perception of those respondents who did not advice for a QMS implementation.
Based on the results obtained, it can be concluded that, according to respondents, the implementation of the ISO 22000 standard is particularly recommended for improving aspects such as production, development, and control processes. According to the authors, the impact of these processes on reducing food losses in the supply chain can be significant because:
- The process of product planning and implementation, by balancing orders and production capacities, scheduling production tasks translates into timely deliveries, optimization of inventory levels, reduction of production costs, and risk minimization.
- Supervising the product design process facilitates the adjustment of their parameters to the requirements of consumers and minimizes the risk of production of products not finding potential customers.
- The correct implementation of control processes and the need for increased supervision over monitoring equipment enables quick response and minimizes the risk of potential losses. In addition, an undetected defect in such equipment may result in the unconscious production of defective products.
All of the indicated activities contribute to reducing errors, optimizing operations, and reducing the risk of producing substandard products that would be subject to disposal processes.
5. Discussion
Food waste is still a recent, incipient, growing, and very complex subject that requires thorough and systemic understanding to be addressed. Different agents in supply chains may be involved in order to implement the practices following a systemic view [57]. Göbel et al. [58] emphasize that the only way to reduce food losses is through comprehensive management of the entire supply chain. The same authors emphasize that there is no single solution that can significantly reduce food losses in the supply chain, but the cooperation of individual links, the division of responsibilities, and the implementation of quality and safety standards can limit this problem. Standardized management systems focus on cooperation under specific procedures that minimize errors and reduce risk, and focus on improving food quality and safety, i.e., key criteria for managing the food supply chain [59]. Supply chains seeking to adapt to dynamic economic conditions and achieve competitive advantage must implement non-standard processes that meet customer requirements and also support the achievement of business goals [60]. Consequently, modern supply chains implement management concepts, methods, and systems aimed at increasing the efficiency, effectiveness, and efficiency of doing business.
5.1. How Do Respondents Assess the Impact Implementation of the Requirements of ISO 22000 for the Realization of Key Processes in the Food Supply Chain?
The research results delivered by this study allow to state that implementation of the requirements of the ISO 22000 standard significantly supports the proper functioning of key processes in food supply chains. This standard supports both supply, production, and distribution processes. In addition, it requires significant commitment from both employees and top management. This is a very important aspect because, according to Martin-Rios et al. [61], the involvement of management and employees, as well as an increase in their awareness, can have a significant impact on the implementation and compliance with solutions that limit food loss. The average assessment of the impact of the implementation of the requirements of the ISO 22000 standard on improving the examined aspects was 4.2 on a five-point scale, which suggests a significant impact of the standard on the improvement of key processes in food supply chains. Portuguese, Polish, and Slovak organizations most appreciate the impact of implementing the ISO standard requirements on production and control processes, this is understandable because this standard requires a strict definition of the food safety management system that covers products and production processes in the food supply chain [16]. In addition, organizations that form supply chains should regularly evaluate and update their food safety management system. Portuguese organizations also highly value the impact of the ISO 22000 standard on improving supply processes, which are extremely important in the context of ensuring the continuity of production and distribution processes. Additionally, their correct implementation and focusing on sustainable solutions in the supply chain helps to avoid food losses [62].
Worthy of note is that respondents, despite the fact of highly assessing the impact of the implementation of the ISO 22000 standard for the improvement of key processes in the food chain, seem not so enthusiastic when assessing the impact on the minimization of potential errors and strengthening relationships in the supply chain. This may be due to the fact that supply chains are co-created by many organizations, and their permanent integration is a relevant and consuming challenge. Errors in the supply chain often occur at the interface between processes that are implemented by several companies [63,64,65,66]. Therefore, it seems reasonable to implement concepts streamlining integration processes along the supply chain. Implementing the requirements of the ISO 9001 standard, which aids on building partner relationships among suppliers, reduces risk, and supports the development of effective forms of communication can be the proper solution [66,67].
Based on the previous results (Table 2; Table 7) and the following research implication, it can be stated that Hypothesis 1 is confirmed.
Based on the research results obtained, it can be concluded that the ISO 22000 standard greatly supports the production subsystem in the food supply chain. Its implementation is therefore especially recommended for supply chains that want to improve processes in this area. A significant impact is also noticed on the improvement of the supply subsystem. The ISO 22000 standard has little influence on the improvement of distribution processes. It should be noted that distribution of food products to retailers or drop-off points plays a significant role in the environmental performance of food supply chains. Efficient logistics and technologies are critical success factors for distribution systems in most supply chain networks, including food [68]. Traditionally, the critical success factors for an effective distribution system included meeting the requirement of the demand side of the supply chain through delivery of good quality products in appropriate quantities to the right place using the optimal path at the right time with optimal costs [69]. Therefore, it is suggested that this subsystem should also be supported by other solutions in the area of logistics, management, and sustainable development. Improvement of the signaled processes undoubtedly has an impact on the safety of products in logistics processes and an increase in the efficiency of operations, which may contribute to reducing food losses. It is worth noting that food is destroyed already during work on the land. Its packaging, transport, storage, processing, and preparation for sale generates further losses. With this in mind, all activities aimed at increasing the efficiency of processes occurring in the supply chains will to some extent limit food losses. Based on the obtained research results, it can be assumed that the ISO 22000 standard has a relatively significant impact on the improvement of the supply chain, which affects the faster and more thought-out course of the main logistics processes. This is an important issue because the 17 Sustainable Development Goals (SDGs) by 2030 [65] call for the reduction of the global amount of wasted food per capita in retail sales and consumption by half, and the reduction of food losses in the production and distribution process.
5.2. Can the ISO 22000 Standard, by Improving Processes in Supply Chains, Reduce Potential Errors?
The positive impact of improving individual logistics subsystems on the sustainable management of food supply chains and reducing food waste is emphasized in the work of many authors [1,6,7,68,69]. As already mentioned, the implementation of the ISO 22000 standard significantly affects the improvement of basic logistics subsystems in the supply chain. These subsystems complement each other, and their correct implementation affects the production and delivery of safe products to customers that meet their requirements. Improvement of supply processes and forms of control translates into obtaining raw materials that meet accepted standards as well as timely and planned production processes. In addition, it facilitates adapting the supply chain to anticipated demand. The ISO 22000 standard improves production processes, especially in areas such as quality control, design, and production of safe products and improvement of a food safety management system [70,71]. The ISO 22000 standard also requires that each organization informs the parties cooperating in the food chain when threats are detected [72]. Such actions are aimed at improving the level of safety within the food chain and positively translate into building trust in its individual links.
All of the above activities have an impact on the efficiency of processes taking place in the food supply chain. In turn, the increase in the effectiveness of implemented activities and their exact adaptation to customer requirements will affect the minimization of food losses, especially in such areas as: Supply, transport, storage, or distribution. As they rightly emphasize, García-Flores et al. [73] show that food logistics has evolved from applying general supply chain management methodologies to addressing specific problems of the food industry, such as sustainability, safety, and perishability, to considering the impact of food supply systems on the triple bottom line of economic, environmental, and social indicators. Food supply chains should therefore implement systems and concepts to improve management processes [74,75]. The implementation of the ISO 22000 standard in food supply chains allows for the development of a well-thought-out and constantly improved management system that contributes to the quick and effective identification of potential risks and threats [46,76]. In addition, it facilitates the development of effective forms of communication in the supply chain, which allows you to reduce errors whose occurrence contributes to food losses [77]. As rightly noted by Manikas and Manos [39], ISO 22000 gives the basic requirements for a food safety management system to ensure safe food supply chains.
5.3. Will the Results be Different Due to the Geographical Area of Business?
When comparing the results obtained in individual countries, it can be stated that the respondents representing Portugal rated the impact of the implementation of the ISO 22000 standard on the improvement of the examined aspects significantly higher. Particularly higher marks were given to distribution and control processes. Entrepreneurs from Poland and Slovakia rated higher only on the impact of the ISO 22000 standard on development process improvements. The analysis also allowed to conclude that “Country” is a statistically significant factor for ISO 22000 effect of improvements in distribution processes and development processes.
Based on the conducted research, however, it can be stated that all the surveyed organizations, regardless of the country in which they operate, positively assess the impact of the ISO 22000 standard on the functioning of basic processes in the food supply chains. Some differences in assessments are noticeable, however, in most cases these differences are not significant. Comparing the average rating of all aspects examined, it can be seen that the difference in the five-point scale is only 0.2 (average rating of 4.1 was achieved by Polish and Slovak companies, whereas an average rating of 4.3 was achieved by Portuguese companies). It turned out that the stratification variable Country in most cases will not cause statistically significant differences in results (except for the two effects mentioned—development and distribution process). The links between the effects were not very intense, we identified only relatively weak correlations (Table 8). This can be interpreted as meaning that the five analyzed processes (distribution, production, development, control, purchase) and two impact types (integration, errors identification) were correctly defined, acted sufficiently independently (so that they could be observed separately), and there was no undesirable mutual influencing. Thus, the geographical area was not the stratification feature that distinguished the degree of effects of ISO 22000.
Therefore, based on the statistical results (Table 9) and the implications below, it can be concluded that Hypothesis 3 is refuted.
This result indicates that the ISO 22000 standard is relatively universal, and by implementing it, organizations will increase efficiency in key SCM processes, regardless of the country in which they operate. Our finding essentially supports the basic purpose of this standard and declares its effects in an empirical way. In practical terms, this means that after implementing ISO 22000, organizations can expect improvements in the distribution, production, development, control, and purchase process in the long run. Our results also declare another two long-term impacts of ISO 22000: Impact on the integration of individual partners along the supply chain, and impact on the easiness of identification of potential errors.
5.4. Implications and Limitations
The considerations presented in the article should be helpful for enterprises and supply chains, whose representatives are looking for solutions not only to improve internal processes, but also aimed at increasing security and minimizing losses of manufactured and distributed products. It is worth noting that the renowned literature on the subject lacks research and studies on the impact of the implementation of the ISO 22000 standard on the functioning of enterprises and supply chains in Central and Eastern Europe. These research results will therefore contribute to the development of the theory as they provide answers to new research questions and should prove useful for both practitioners and theorists. The authors hope that the considerations undertaken in the article will at least partly fill the gap that emerges in the area of research on the impact of the implementation of ISO 22000 requirements on the optimization of food supply chains and food waste.
The main limitations of the conducted research are narrowing the discussion to three countries. Therefore, there is a need to conduct further research in this area on a larger research group and in a wider geographical range. It seems reasonable to conduct a wider research in Western and Central Europe and on other continents, and to compare the results with those presented in this publication. Despite this, the research can be considered as an important contribution to fill the gap that undoubtedly exists in the area of research on the impact of the implementation of the ISO 22000 standard on the functioning of reducing food losses.
A questionnaire was used to empirically examine the topic. There are several potential risks that could affect the results. The questionnaire itself is a tool for capturing subjective opinions. Therefore, it is not possible to speak of exact calculations, but rather of estimates and approximate values. Although the authors implemented the best practices available to avoid the risks of misinterpretation of the results by statistical procedures, the risk cannot be totally excluded. Sample size may also be included as limiting factors. A total of 92 questionnaires from three countries were processed. The research resources made available to the authors involved did not allow the collection and processing of a higher sample. However, all statistical procedures reflect sample size. Smaller sample size affects confidence intervals range, hypothesis testing, or bivariate correlation analysis results. It should be noted, that from a statistical point of view is population determined by number of organizations—in our case there were only 991 organizations (Portugal + Poland + Slovakia) in total which implemented ISO 22000. Sample size was 92 organizations and it represents 9.2% of all population. These parameters lead to the conclusion that margin of error is in general 9.74%. In common, 5% margin of error is considered as sufficient in surveying. The generalizations from our research should consider this limitation. A 5-point Likert’s agreement scale was adopted to evaluate the rate of improvement in the monitored process types. This is a relatively often used type of scale, as it offers sufficient resolution and easy understanding by respondents. At the same time, however, it could be said that the choice of this scale could have had an impact on the results obtained. Although the scale was tested by a relatively robust apparatus (reliability tests), its impact on the results cannot be totally excluded.
6. Conclusions
The problem of food loss and waste has become more important in recent years, not solely for political reasons, but primarily due to the increasingly apparent contradiction between the current model of food production development in highly developed countries and the challenges facing the world caused by population growth (primarily in developing countries), in conditions of increasing limitations of natural resources. Guaranteeing broadly understood access to food in a situation of long-signaled energy and water shortages, compounded by adverse climate changes, is a growing challenge both on a global scale and in relation to individual countries (local scale). This fact in addition to the fact that modern supply chains are becoming more and more complex and dynamic structures, which are influenced by a number of trends, such as: Globalization, the pursuit of security, relationship management, wider consideration of the needs of the natural environment, and sustainable development, forces people responsible for developing supply chain management strategies for system management and the ability to adapt to changes and predict future market trends. Based on the results from this research, it can be concluded that the implementation of the requirements of the ISO 22000 standard in food supply chains can positively affect the implementation of key processes and thus contribute to reducing food waste at each stage of the supply chain. The considerations made in the article also allow the following conclusions:
- The implementation of the requirements of the ISO 22000 standard has a significant impact on the improvement of control and production processes, while the smallest (but still noticeable) on distribution processes,
- according to respondents, the ISO 22000 standard does not significantly reduce the number of errors and mistakes, therefore there is a need to implement solutions to improve cooperation in the supply chain,
- “organizations size” is a statistically significant factor for ISO 22000 effect of improvements in distribution process,
- “necessity of QMS implementation” is a statistically significant factor for ISO 22000 effect of improvements in production, development, and control processes.
- Other factors—ISO 22000 implementation and MS certification—have no effect on organization performance in observed areas.
Suggestions for future research focus on the evolutionary rather than the revolutionary nature of ISO standard implementation within firms and their supply chains. To this end, there is a need for a qualitative and further quantitative assessment of relationships identified from this study. Researchers should expand supply chain constructs to include a supplier’s operational, tactical, and strategic orientation. It is also worth conducting research on the impact of such standards as ISO 9001 or ISO 14001 on food supply chain and on minimizing food losses.
Author Contributions
Conceptualization, D.Z.; methodology, D.Z., P.M., and P.D.; formal analysis, D.Z.; data curation, D.Z. and P.D.; writing—original draft preparation, D.Z.; writing—review and editing, D.Z.; visualization, D.Z.; supervision, D.Z.; project administration, D.Z.; funding acquisition, D.Z. All authors have read and agreed to the published version of the manuscript.
Funding
This research was supported by grant VEGA 0663/18 Requirements non-linearity and its integration into quality management process.
Conflicts of Interest
The authors declare no conflict of interest.
References
- Kummu, M.; De Moel, H.; Porkka, M.; Siebert, S.; Varis, O.; Ward, P.J. Lost food, wasted resources: Global food supply chain losses and their impacts on freshwater, cropland. and fertiliser use. Sci. Total Envir. 2012, 438, 477–489. [Google Scholar] [CrossRef]
- Schmidhuber, J.; Tubiello, F.N. Global food security under climate change. Proc. Nat. Acad. Sci. USA 2007, 104, 19703–19708. [Google Scholar] [CrossRef] [Green Version]
- Schanes, K.; Dobernig, K.; Gözet, B. Food waste matters—A systematic review of household food waste practices and their policy implications. J. Clean. Prod. 2018, 182, 978–991. [Google Scholar] [CrossRef]
- Principato, L.; Ruini, L.; Guidi, M.; Secondi, L. Adopting the circular economy approach on food loss and waste: The case of Italian pasta production. Res. Conserv. Recycl. 2019, 144, 82–89. [Google Scholar] [CrossRef]
- Ravindran, R.; Jaiswal, A.K. Exploitation of food industry waste for high-value products. Trends Biotechnol. 2016, 34, 58–69. [Google Scholar] [CrossRef] [Green Version]
- Devin, B.; Richards, C. Food waste, power, and corporate social responsibility in the Australian food supply chain. J. Bus. Eth. 2018, 150, 199–210. [Google Scholar] [CrossRef]
- Zimon, D.; Tyan, J.; Sroufe, R. Implementing Sustainable Supply Chain Management: Reactive, Cooperative, and Dynamic Models. Sustainability 2019, 11, 7227. [Google Scholar] [CrossRef] [Green Version]
- Zimon, D.; Domingues, J.P.T. Proposal of a concept for improving the sustainable management of supply chains in the textile industry. Fibres Text. East. Eur. 2018, 26, 8–12. [Google Scholar] [CrossRef]
- Aschemann-Witzel, J.; De Hooge, I.E.; Rohm, H.; Normann, A.; Bossle, M.B.; Grønhøj, A.; Oostindjer, M. Key characteristics and success factors of supply chain initiatives tackling consumer-related food waste—A multiple case study. J. Clean. Prod. 2017, 155, 33–45. [Google Scholar] [CrossRef]
- Raak, N.; Symmank, C.; Zahn, S.; Aschemann-Witzel, J.; Rohm, H. Processing-and product-related causes for food waste and implications for the food supply chain. Waste Manag. 2017, 61, 461–472. [Google Scholar] [CrossRef] [PubMed]
- Papargyropoulou, E.; Lozano, R.; Steinberger, J.K.; Wright, N.; bin Ujang, Z. The food waste hierarchy as a framework for the management of food surplus and food waste. J. Clean. Prod. 2014, 76, 106–115. [Google Scholar] [CrossRef]
- Kaipia, R.; Dukovska-Popovska, I.; Loikkanen, L. Creating sustainable fresh food supply chains through waste reduction. Int. J. Phys. Distrib. Logist. Manag. 2013, 43, 262–276. [Google Scholar] [CrossRef] [Green Version]
- Cicatiello, C.; Franco, S.; Pancino, B.; Blasi, E. The value of food waste: An exploratory study on retailing. J. Retail. Consum. Serv. 2016, 30, 96–104. [Google Scholar] [CrossRef]
- Teixeira, S.; Sampaio, P. Food safety management system implementation and certification: Survey results. Total Qual. Manag. Bus. Excell. 2013, 24, 275–293. [Google Scholar] [CrossRef] [Green Version]
- Lamboni, M.; Azouma, O.Y. Integration of food safety management systems in the design of small and medium food businesses in Togo. Environ. Risques Santé 2013, 12, 521–529. [Google Scholar]
- Panghal, A.; Chhikara, N.; Sindhu, N.; Jaglan, S. Role of food safety management systems in safe food production: A review. J. Food Saf. 2018, 38, e12464. [Google Scholar] [CrossRef]
- Păunescu, C.; Argatu, R.; Lungu, M. Implementation of ISO 22000 in Romanian companies: Motivations, difficulties and key benefits. Amfiteatru Econ. 2018, 20, 30–45. [Google Scholar] [CrossRef]
- Silva, M.M.; Fonseca, L.M.; Sousa, S.D. The impact of ISO 9001: 2015 on ISO 22000 and food safety management systems (FSMS). Qual. Access Success 2016, 17, 81–85. [Google Scholar]
- Escanciano, C.; Santos-Vijande, M.L. Implementation of ISO-22000 in Spain: Obstacles and key benefits. Br. Food J. 2014, 40, 50–57. [Google Scholar] [CrossRef]
- Bilska, B.; Wrzosek, M.; Kołożyn-Krajewska, D.; Krajewski, K. Risk of food losses and potential of food recovery for social purposes. Waste Manag. 2016, 52, 269–277. [Google Scholar] [CrossRef]
- Hong, J.; Zhou, Z.; Li, X.; Lau, K.H. Supply chain quality management and firm performance in China’s food industry—the moderating role of social co-regulation. Int. J. Logist. Manag. 2020. [Google Scholar] [CrossRef]
- Blass, V.; Corbett, C.J. Same supply chain, different models: Integrating perspectives from life cycle assessment and supply chain management. J. Ind. Ecol. 2018, 22, 18–30. [Google Scholar] [CrossRef] [Green Version]
- Kiss, K.; Ruszkai, C.; Takács-György, K. Examination of Short Supply Chains Based on Circular Economy and Sustainability Aspects. Resources 2019, 8, 161. [Google Scholar] [CrossRef] [Green Version]
- Santos, L.L.; Akutsu, R.D.C.C.D.; Botelho, R.B.A.; Zandonadi, R.P. Food service compliance with ISO 14001 and ISO 22000. Revista Nutricao 2012, 25, 373–380. [Google Scholar] [CrossRef] [Green Version]
- Aschemann-Witzel, J.; de Hooge, I.; Normann, A. Consumer-related food waste: Role of food marketing and retailers and potential for action. J. Inter. Food Agribus. Mark. 2016, 28, 271–285. [Google Scholar] [CrossRef]
- Otles, S.; Despoudi, S.; Bucatariu, C.; Kartal, C. Food waste management, valorization, and sustainability in the food industry. Food Waste Recovery 2015, 3–23. [Google Scholar] [CrossRef]
- Bloemhof, J.M.; van der Vorst, J.G.; Bastl, M.; Allaoui, H. Sustainability assessment of food chain logistics. Int. J. Logist. Res. Appl. 2015, 18, 101–117. [Google Scholar] [CrossRef]
- Ju, M.; Osako, M.; Harashina, S. Food loss rate in food supply chain using material flow analysis. Waste Manag. 2016, 61, 443–454. [Google Scholar] [CrossRef]
- Read, Q.D.; Brown, S.; Cuéllar, A.D.; Finn, S.M.; Gephart, J.A.; Marston, L.T.; Muth, M.K. Assessing the environmental impacts of halving food loss and waste along the food supply chain. Sci. Total Environ. 2020, 712, 136255. [Google Scholar] [CrossRef]
- Gokarn, S.; Kuthambalayan, T.S. Analysis of challenges inhibiting the reduction of waste in food supply chain. J. Clean. Prod. 2017, 168, 595–604. [Google Scholar] [CrossRef]
- Parfitt, J.; Barthel, M.; Macnaughton, S. Food waste within food supply chains: Quantification and potential for change to 2050. Philos. Trans. R. Soc. B Biol. Sci. 2010, 365, 3065–3081. [Google Scholar] [CrossRef] [PubMed] [Green Version]
- Paloviita, A. Consumers’ sustainability perceptions of the supply chain of locally produced food. Sustainability 2010, 2, 1492–1509. [Google Scholar] [CrossRef] [Green Version]
- Grandhi, B.; Appaiah Singh, J. What a waste! A study of food wastage behavior in Singapore. J. Food Prod. Mark. 2016, 22, 471–485. [Google Scholar] [CrossRef]
- Asioli, D.; Boecker, A.; Canavari, M. Perceived traceability costs and benefits in the Italian fisheries supply chain. Intern. J. Food Syst. Dyn. 2011, 2, 340–356. [Google Scholar]
- Bozarth, C.C.; Warsing, D.P.; Flynn, B.B.; Flynn, E.J. The impact of supply chain complexity on manufacturing plant performance. J. Oper. Manag. 2008, 27, 78–93. [Google Scholar] [CrossRef]
- Reuter, C.; Foerstl, K.; Hartmann, E.; Blome, C. Sustainable global supplier management: The role of dynamic capabilities in achiving competitive advantage. J. Supply Chain Manag. 2010, 46, 45–63. [Google Scholar] [CrossRef]
- Govindan, K. Sustainable consumption and production in the food supply chain: A conceptual framework. Int. J. Prod. Econ. 2018, 195, 419–431. [Google Scholar] [CrossRef]
- Manders, J.H.; Caniëls, M.C.; Paul, W.T. Exploring supply chain flexibility in a FMCG food supply chain. J. Purch. Supply Manag. 2016, 22, 181–195. [Google Scholar] [CrossRef]
- Manikas, I.; Manos, B. Design of an integrated supply chain model for supporting traceability of dairy products. Int. J. Dairy Technol. 2009, 62, 126–138. [Google Scholar] [CrossRef]
- Jevšnik, M.; Hlebec, V.; Raspor, P. Food safety knowledge and practices among food handlers in Slovenia. Food Control 2008, 19, 1107–1118. [Google Scholar] [CrossRef]
- Trienekens, J.; Zuurbier, P. Quality and safety standards in the food industry, developments and challenges. Int. J. Prod. Econ. 2008, 113, 107–122. [Google Scholar] [CrossRef]
- Mishra, O.P.; Kumar, V.; Garg, D. Multi-attributes based comparison of JIT distribution process of supply chain. Int. J. Logist. Syst. Manag. 2015, 22, 500. [Google Scholar] [CrossRef]
- Varzakas, T.H.; Arvanitoyannis, I.S. Application of ISO 22000 and comparison to HACCP for processing of ready to eat vegetables: Part I. Int. J. Food Sci. Technol. 2008, 43, 1729–1741. [Google Scholar] [CrossRef]
- Manzini, R.; Accorsi, R. The new conceptual framework for food supply chain assessment. J. Food Eng. 2013, 115, 251–263. [Google Scholar] [CrossRef]
- Fernandez-Segovia, I.; Perez-Llacer, A.; Peidro, B.; Fuentes, A. Implementation of a Food Safety Management System according to ISO 22000 in the food supplement industry: A case study. Food Control 2014, 43, 28–34. [Google Scholar] [CrossRef]
- Chen, H.; Liu, S.; Chen, Y.; Chen, C.; Yang, H.; Chen, Y. Food safety management systems based on ISO 22000:2018 methodology of hazard analysis compared to ISO 22000: 2005. Accredit. Qual. Assur. 2020, 25, 23–37. [Google Scholar] [CrossRef]
- Politis, Y.; Krokos, F.D.; Papadakis, I. Categorization of control measures in food safety management systems. Br. Food J. 2017, 119, 2653–2683. [Google Scholar] [CrossRef]
- Zimon, D.; Madzik, P.; Sroufe, R. Management systems and improving supply chain processes: Perspectives of focal companies and logistics service providers. Int. J. Retail Distrib. Manag. 2020. [Google Scholar] [CrossRef]
- Dellana, S.; Kros, J. ISO 9001 and supply chain quality in the USA. Int. J. Prod. Perform. Manag. 2019, 67, 297–317. [Google Scholar] [CrossRef]
- Fonseca, L.; Domingues, J.P.; Baylina, P.; Harder, D. ISO 9001: 2015 adoption: A multi-country empirical research. J. Ind. Eng. Manag. 2019, 12, 27–50. [Google Scholar]
- To, W.M.; Lee, P.K.C. Diffusion of ISO 14001 environmental management system: Global, regional and country-level analyses. J. Clean. Prod. 2014, 66, 489–498. [Google Scholar] [CrossRef]
- O’brien, R.M. A Caution Regarding Rules of Thumb for Variance Inflation Factors. Qual. Quant. 2007, 41, 673–690. [Google Scholar] [CrossRef]
- Hair, J.; Black, W.; Babin, B.; Anderson, R. Multivariate Data Analysis; Prentice Hall: Upper Saddle River, NJ, USA, 2010. [Google Scholar]
- Chang, S.-J.; van Witteloostuijn, A.; Eden, L. From the Editors: Common method variance in international business research. J. Int. Bus. Stud. 2010, 41, 178–184. [Google Scholar] [CrossRef]
- Zimon, D.; Tyan, J.; Sroufe, R. Drivers of sustainable supply chain management: Practices to alignementwith un sustainable development goals. Int. J. Qual. Res. 2020, 14, 219–236. [Google Scholar] [CrossRef]
- Busacca, B.; Padula, G. Understanding the relationship between attribute performance and overall satisfaction’. Mark. Intell. Plan. 2005, 23, 543–561. [Google Scholar] [CrossRef]
- de Moraes, C.C.; de Oliveira Costa, F.H.; Pereira, C.R.; da Silva, A.L.; Delai, I. Retail food waste: Mapping causes and reduction practices. J. Clean. Prod. 2020, 256, 120124. [Google Scholar] [CrossRef]
- Göbel, C.; Langen, N.; Blumenthal, A.; Teitscheid, P.; Ritter, G. Cutting food waste through cooperation along the food supply chain. Sustainability 2015, 7, 1429–1445. [Google Scholar] [CrossRef] [Green Version]
- Li, D.; Wang, X.; Chan, H.K.; Manzini, R. Sustainable food supply chain management. Int. J. Prod. Econ. 2014, 152, 1–8. [Google Scholar] [CrossRef]
- Mensah, L.D.; Julien, D. Implementation of food safety management systems in the UK. Food Control 2011, 22, 1216–1225. [Google Scholar] [CrossRef] [Green Version]
- Martin-Rios, C.; Demen-Meier, C.; Gössling, S.; Cornuz, C. Food waste management innovations in the foodservice industry. Waste Manag. 2018, 79, 196–206. [Google Scholar] [CrossRef] [Green Version]
- Brohm, K.A.; Klein, S. The concept of climate smart agriculture–a classification in sustainable theories. Int. J. Qual. Res. 2020, 14, 291–302. [Google Scholar] [CrossRef]
- Gunasekaran, A.; Ngai, E.W. Information systems in supply chain integration and management. Eur. J. Oper. Res. 2004, 159, 269–295. [Google Scholar] [CrossRef]
- Woźniak, J. Identification of Mass Event Customers and Factors Exerting Influence upon their Satisfaction with Participation in an Event. Qual. Access Success 2019, 20, 22–26. [Google Scholar]
- Fonseca, L.M.; Domingues, J.P.; Dima, A.M. Mapping the Sustainable Development Goals Relationships. Sustainability 2020, 12, 3359. [Google Scholar] [CrossRef] [Green Version]
- Zimon, D.; Madzík, P. Standardized management systems and risk management in the supply chain. Int. J. Qual. Reliab. Manag. 2020, 37, 305–327. [Google Scholar] [CrossRef]
- Zimon, D.; Dellana, S. A longitudinal exploratory study of ISO 9001 certification abandonment in small-and medium-sized enterprises. Int. J. Qual. Reliab. Manag. 2020, 37, 53–67. [Google Scholar] [CrossRef]
- Tarantilis, C.D.; Ioannou, G.; Prastacos, G. Advanced vehicle routing algorithms for complex operations management problems. J. Food Eng. 2005, 70, 455–471. [Google Scholar] [CrossRef]
- Validi, S.; Bhattacharya, A.; Byrne, P.J. A case analysis of a sustainable food supply chain distribution system—A multi-objective approach. Int. J. Prod. Econ. 2014, 152, 71–87. [Google Scholar] [CrossRef] [Green Version]
- Sazvar, Z.; Rahmani, M.; Govindan, K. A sustainable supply chain for organic, conventional agro-food products: The role of demand substitution, climate change and public health. J. Clean. Prod. 2018, 194, 564–583. [Google Scholar] [CrossRef]
- Purwanto, A.; Asbari, M.; Santoso, P.B. Effect of Integrated Management System of ISO 9001: 2015 and ISO 22000: 2018 Implementation to Packaging Industries Quality Performance at Banten Indonesia. J. Ilm. MEA 2020, 4, 17–29. [Google Scholar]
- Mahajan, R.; Garg, S.; Sharma, P.B. Pure Curd Supply Chain: An Indian Case on Modern Food Safety Management. In Innovative Solutions for Implementing Global Supply Chains in Emerging Markets; IGI Global: Hershey, PA, USA, 2016; pp. 97–110. [Google Scholar]
- García-Flores, R.; de Souza Filho, O.V.; Martins, R.S.; Martins, C.V.B.; Juliano, P. Using logistic models to optimize the food supply chain. In Modeling Food Processing Operations; Woodhead Publishing: Sawston, UK, 2015; pp. 307–330. [Google Scholar]
- Kros, J.F.; Falasca, M.; Dellana, S.; Rowe, W.J. Mitigating counterfeit risk in the supply chain: An empirical study. TQM J. 2020. [Google Scholar] [CrossRef]
- Beske, P.; Land, A.; Seuring, S. Sustainable supply chain management practices and dynamic capabilities in the food industry: A critical analysis of the literature. Int. J. Prod. Econ. 2014, 152, 131–143. [Google Scholar] [CrossRef]
- Enes, M.; Silva, A. Service quality improvement on warehouse-store transportation in a retail food company. Int. J. Qual. Res. 2020, 14, 623–634. [Google Scholar] [CrossRef]
- Rábade, L.A.; Alfaro, J.A. Buyer–supplier relationship’s influence on traceability implementation in the vegetable industry. J. Purch. Supply Manag. 2006, 12, 39–50. [Google Scholar] [CrossRef] [Green Version]
Figure 1.
Distribution of experience with ISO 22000 (experience was measured in years).

Figure 2.
Example of results of testing relationship significance of selected variables.


Table 1.
Variables characteristics.
| Question (Variable) | Variable Descriptor | Type of Variable | Options |
|---|---|---|---|
| Country | Country | Nominal | Poland, Slovakia, Portugal |
| ISO 22000 implementation | ISO22000_Imp | Nominal (dichotomous) | Yes/No |
| QMS certification | MS_Certification | Nominal (dichotomous) | Yes/No |
| Nr. of employees | Size | Ordinal | 1–50; 51–250; 250+ |
| Years of ISO 22000 implementation | ISO22000_years | Ordinal | 0+; 1–3; 4–6, 7–10, 11+ |
| Positive impact of ISO 22000 on food security | Imp_food_sec | Nominal | Yes/No/I do not know |
| ISO 22000 effect on distribution process improvements | Dist_process | Scale | 1 to 5 pt. |
| ISO 22000 effect on production process improvements | Prod_process | Scale | 1 to 5 pt. |
| ISO 22000 effect on development process improvements | Devel_process | Scale | 1 to 5 pt. |
| ISO 22000 effect on control process improvements | Contr_process | Scale | 1 to 5 pt. |
| ISO 22000 effect on purchase process improvements | Purch_process | Scale | 1 to 5 pt. |
| Necessity of QMS implementation | Necessity | Nominal | Yes/No/I do not know |
| ISO 22000 impact on the integration of individual partners along the supply chain | Imp_integration | Scale | 1 to 5 pt. |
| ISO 22000 impact on the easiness of identification of potential errors | Imp_errors | Scale | 1 to 5 pt. |
Table 2.
Assessment of examined aspects on a five-point scale.
| Variable | Poland & Slovakia | Portugal | Globally |
|---|---|---|---|
| Dist_process | 3.4 | 4.0 | 3.7 |
| Prod_process | 4.5 | 4.6 | 4.55 |
| Devel_process | 4.2 | 3.8 | 4.0 |
| Contr_process | 4.4 | 4.7 | 4.55 |
| Purch_process | 3.9 | 4.2 | 4.0 |
Table 3.
Testing reliability if variable deleted.
| Variable | Scale Mean if Variable Deleted | Scale Variance if Variable Deleted | Corrected Variable-Total Correlation | Cronbach’s Alpha if Variable Deleted |
|---|---|---|---|---|
| Dist_process | 16.852 | 4.428 | 0.448 | 0.718 |
| Prod_process | 16.247 | 5.188 | 0.613 | 0.650 |
| Devel_process | 16.852 | 5.678 | 0.293 | 0.754 |
| Contr_process | 16.543 | 5.026 | 0.661 | 0.632 |
| Purch_process | 16.864 | 4.744 | 0.554 | 0.657 |
Table 4.
Testing reliability if output variable deleted.
| Variable | Scale Mean if Variable Deleted | Scale Variance if Variable Deleted | Corrected Variable-Total Correlation | Cronbach’s Alpha if Variable Deleted |
|---|---|---|---|---|
| Imp_integration | 3.772 | 2.068 | 0.898 | N/A |
| Imp_errors | 3.489 | 1.835 | 0.898 | N/A |
Table 5.
Testing of multicollinearity. VIF: Variable inflation score.
| Variable/Statistics | Output Variable | ||||
|---|---|---|---|---|---|
| Imp_inf | Imp_errors | ||||
| Tolerance | VIF | Tolerance | VIF | ||
| Input variable | Dist_process | 0.59 | 1.70 | 0.59 | 1.70 |
| Prod_process | 0.67 | 1.49 | 0.67 | 1.50 | |
| Devel_process | 0.76 | 1.31 | 0.77 | 1.31 | |
| Contr_process | 0.48 | 2.10 | 0.48 | 2.10 | |
| Purch_process | 0,56 | 1.78 | 0.55 | 1.83 | |
| Imp_int | - | - | 0.87 | 1.15 | |
| Imp_errors | 0.90 | 1.12 | - | - | |
Table 6.
Testing of Common Method Bias.
| Component | Initial Eigenvalues | Extraction Sums of Squared Loadings | ||||
|---|---|---|---|---|---|---|
| Total | % of Variance | Cumulative % | Total | % of Variance | Cumulative % | |
| 1 | 2.83 | 40.48 | 40.48 | 2.83 | 40.48 | 40.48 |
| 2 | 1.72 | 24.53 | 65.01 | |||
| 3 | 0.95 | 13.54 | 78.55 | |||
| 4 | 0.63 | 8.92 | 87.48 | |||
| 5 | 0.46 | 6.51 | 93.98 | |||
| 6 | 0.31 | 4.46 | 98.44 | |||
| 7 | 0.11 | 1.56 | 100.00 | |||
Table 7.
Statistics of ISO 22000 effects.
| Variable | Mean | 95% CIMLB | 95% CIMUB | 5%TM | Me | SD | Skew | Kurt | |
|---|---|---|---|---|---|---|---|---|---|
| Input | Dist_process | 3.99 | 3.77 | 4.21 | 4.07 | 4.00 | 1.01 | −1.03 | 0.74 |
| Prod_process | 4.59 | 4.45 | 4.73 | 4.66 | 5.00 | 0.63 | −1.29 | 0.58 | |
| Devel_process | 3.99 | 3.82 | 4.16 | 4.01 | 4.00 | 0.77 | −0.32 | −0.37 | |
| Contr_process | 4.30 | 4.15 | 4.44 | 4.34 | 4.00 | 0.64 | −0.65 | 0.86 | |
| Purch_process | 3.98 | 3.80 | 4.15 | 4.03 | 4.00 | 0.81 | −0.54 | 0.00 | |
| Output | Imp_integration | 3.53 | 3.24 | 3.82 | 3.65 | 4.00 | 1.31 | −1.71 | 2.30 |
| Imp_errors | 3.79 | 3.48 | 4.10 | 3.93 | 4.00 | 1.38 | −1.81 | 2.66 |
Legend: 95% CIMLB = 95% Confidence Interval for Mean–Lower Bound; 95% CIMUB = 95% Confidence Interval for Mean–Uower Bound; 5%TM = 5% Trimmed Mean; Me = Median; SD = Standard Deviation; Skew = Skewness; Kurt = Kurtosis.
Table 8.
Results of bivariate correlation analysis.
| Variables | Distr_Process | Prod_Process | Devel_Process | Cont_Process | Purch_Process | Imp_Integration | ||
|---|---|---|---|---|---|---|---|---|
| Input Variables | Prod_process | r | 0.506 | |||||
| p | 0.000 | |||||||
| Devel_process | r | 0.081 | 0.301 | |||||
| p | 0.473 | 0.006 | ||||||
| Contr_process | r | 0.335 | 0.521 | 0.440 | ||||
| p | 0.002 | 0.000 | 0.000 | |||||
| Purch_process | r | 0.431 | 0.400 | 0.182 | 0.595 | |||
| p | 0.000 | 0.000 | 0.105 | 0.000 | ||||
| Output | Imp_integration | r | 0.268 | 0.270 | 0.190 | 0.301 | 0.368 | |
| p | 0.021 | 0.020 | 0.105 | 0.009 | 0.001 | |||
| Imp_errors | r | 0.377 | 0.353 | 0.228 | 0.339 | 0.322 | 0.610 | |
| p | 0.001 | 0.002 | 0.051 | 0.003 | 0.005 | 0.000 | ||
Legend: r = Pearson’s correlation coefficient; p = p-value.
Table 9.
Results of ANOVA by stratification variable “Country”.
| Variable | Mean_PL | Mean_PT | Mean_SK | p-Value | PV90% | Sig. | |
|---|---|---|---|---|---|---|---|
| Input | Dist_process | 3.464 | 4.579 | 3.467 | 0.001 | 1.272 | Yes |
| Prod_process | 4.464 | 4.737 | 4.367 | 0.147 | 0.941 | No | |
| Devel_process | 4.286 | 3.763 | 4.000 | 0.022 | 0.953 | Yes | |
| Contr_process | 4.357 | 4.211 | 4.400 | 0.513 | 0.896 | No | |
| Purch_process | 4.000 | 4.026 | 3.800 | 0.727 | 1.181 | No | |
| Output | Imp_integration | 3.929 | 3.850 | 3.800 | 0.859 | 1.145 | No |
| Imp_errors | 4.071 | 4.350 | 3.933 | 0.135 | 1.204 | No |
Legend: Mean_PL = Mean value for Poland; Mean_PT = Mean value for Portugal; Mean_SK = Mean value for Slovakia; p-value = probability value for hypothesis test; PV90% = Value of 90–100% Power of detection the difference; Sig. = Significance (results of analysis).
Table 10.
Results of 2-Sample t-Test by stratification variable “ISO22000_Imp”.
| Variable | Diff. | 95%UB | p-Value | PV90% | Sig. | |
|---|---|---|---|---|---|---|
| Input | Dist_process | 0.639 | 1.064 | 0.989 | −0.734 | No |
| Prod_process | 0.290 | 0.585 | 0.947 | −0.509 | No | |
| Devel_process | −0.299 | 0.267 | 0.175 | −0.973 | No | |
| Contr_process | −0.168 | 0.129 | 0.164 | −0.511 | No | |
| Purch_process | −0.286 | 0.096 | 0.101 | −0.657 | No | |
| Output | Imp_integration | N/A | N/A | N/A | N/A | N/A |
| Imp_errors | N/A | N/A | N/A | N/A | N/A |
Legend: Diff. = Difference; 95%UB = 95% Upper Bound; p-value = probability value for hypothesis test; PV90% = Value of 90% Power of detection the difference; Sig. = Significance (results of analysis); N/A = Not available (data are not sufficient for hypothesis testing).
Table 11.
Results of 2-Sample t-Test by stratification variable “MS_Certification”.
| Variable | Diff. | 95%UB | p-Value | PV90% | Sig. | |
|---|---|---|---|---|---|---|
| Input | Dist_process | −0.108 | 0.709 | 0.403 | −1.399 | No |
| Prod_process | −0.074 | 0.387 | 0,384 | −0.784 | No | |
| Devel_process | −0.196 | 0,161 | 0,169 | −0.612 | No | |
| Contr_process | N/A | N/A | N/A | N/A | N/A | |
| Purch_process | −0.544 | 0.172 | 0.093 | −1.188 | No | |
| Output | Imp_integration | −0.396 | 0.313 | 0.156 | −1.183 | No |
| Imp_errors | N/A | N/A | N/A | N/A | N/A |
Legend: Diff. = Difference; 95%UB = 95% Upper Bound; p-value = probability value for hypothesis test; PV90% = Value of 90% Power of detection the difference; Sig. = Significance (results of analysis); N/A = Not available (data are not sufficient for hypothesis testing).
Table 12.
Results of ANOVA by stratification variable “Size”.
| Variable | Mean_1-50 | Mean_51-250 | Mean_250+ | p-Value | PV90% | Sig. | |
|---|---|---|---|---|---|---|---|
| Input | Dist_process | 3.889 | 3.833 | 4.500 | 0.032 | 1.004 | Yes |
| Prod_process | 4.556 | 4.533 | 4.750 | 0.545 | 0.759 | No | |
| Devel_process | 4.028 | 3.900 | 4.375 | 0.309 | 1.366 | No | |
| Contr_process | 4.333 | 4.200 | 4.625 | 0.155 | 0.844 | No | |
| Purch_process | 4.056 | 3.900 | 4.125 | 0.662 | 1.040 | No | |
| Output | Imp_integration | 3.757 | 3.903 | 4.250 | 0.079 | 0.815 | No |
| Imp_errors | 4.135 | 4.129 | 4.375 | 0.695 | 1.140 | No |
Legend: Mean_1-50 = Mean value for organization size from 1 to 50 employees; Mean_51-250 = Mean value for organization size from 51 to 250 employees; Mean_250+ = Mean value for organization size above 250 employees; p-value = probability value for hypothesis test; PV90% = Value of 90–100% Power of detection the difference; Sig. = Significance (results of analysis).
Table 13.
Results of 2-sample t-Test by stratification variable “Necessity”.
| Variable | Diff. | 95%UB | p-Value | PV90% | Sig. | |
|---|---|---|---|---|---|---|
| Input | Dist_process | −1.108 | 0.260 | 0.080 | −2.278 | No |
| Prod_process | −0.831 | −0.019 | 0.048 | −1.349 | Yes | |
| Devel_process | −0.646 | −0.117 | 0.029 | −0.892 | Yes | |
| Contr_process | −0.984 | −0.117 | 0.036 | −1.441 | Yes | |
| Purch_process | −0.661 | 0.218 | 0.092 | −1.444 | No | |
| Output | Imp_integration | −0.705 | 0.550 | 0.149 | −2.100 | No |
| Imp_errors | −1.057 | 0.198 | 0.073 | −2.100 | No |
Legend: Diff. = Difference; 95%UB = 95% Upper Bound; p-value = probability value for hypothesis test; PV90% = Value of 90% Power of detection the difference; Sig. = Significance (results of analysis); N/A = Not available (data are not sufficient for hypothesis testing).
© 2020 by the authors. Licensee MDPI, Basel, Switzerland. This article is an open access article distributed under the terms and conditions of the Creative Commons Attribution (CC BY) license (http://creativecommons.org/licenses/by/4.0/).
Share and Cite
MDPI and ACS Style
Zimon, D.; Madzik, P.; Domingues, P. Development of Key Processes along the Supply Chain by Implementing the ISO 22000 Standard. Sustainability 2020, 12, 6176. https://0-doi-org.brum.beds.ac.uk/10.3390/su12156176
AMA Style
Zimon D, Madzik P, Domingues P. Development of Key Processes along the Supply Chain by Implementing the ISO 22000 Standard. Sustainability. 2020; 12(15):6176. https://0-doi-org.brum.beds.ac.uk/10.3390/su12156176
Chicago/Turabian StyleZimon, Dominik, Peter Madzik, and Pedro Domingues. 2020. "Development of Key Processes along the Supply Chain by Implementing the ISO 22000 Standard" Sustainability 12, no. 15: 6176. https://0-doi-org.brum.beds.ac.uk/10.3390/su12156176
Note that from the first issue of 2016, this journal uses article numbers instead of page numbers. See further details here.