Article

GIS-Based Assessment of the Technical and Economic Feasibility of Utility-Scale Solar PV Plants: Case Study in West Kalimantan Province

1
Department of Mechanical Engineering, Politeknik Negeri Pontianak, Pontianak-78124, Indonesia
2
Aerospace and Computational Engineering Group & Space Park Leicester, School of Engineering, University of Leicester, University Road, Leicester LE1 7RH, UK
*
Authors to whom correspondence should be addressed.
Sustainability 2020, 12(15), 6283; https://0-doi-org.brum.beds.ac.uk/10.3390/su12156283
Submission received: 29 June 2020 / Revised: 31 July 2020 / Accepted: 1 August 2020 / Published: 4 August 2020
(This article belongs to the Special Issue Advances in Renewable Energy Technologies for Sustainability)

Abstract

:
This paper presents a technical and economic feasibility assessment of utility-scale solar photovoltaic (PV) plants in the West Kalimantan Province of Borneo, which is essential for boosting the development of solar PV plants in Indonesia. The assessment was performed based on a previously developed geographical information systems (GIS) package that integrates satellite-derived data of solar irradiation with locally obtained data such as land usage, topography, road lines, and an electrical network. For the evaluation of the technical and economic feasibility, annual energy production and electrical cost were calculated using an analysis tool that was integrated into a GIS package. The results show that more than 93% of the exploitable land that covers the area of 49,859 km2 is available for the development of solar PV plants, with an annual energy production higher than 180 GWh/km2 and an electricity cost lower than 0.05 USD/kWh, indicating the attractiveness of utility-scale solar PV plant development in West Kalimantan Province. A further detailed assessment of optimal sites shows that the selected sites are technically and economically feasible for the development of utility-scale solar PV plants. The approaches and results of this research should be valuable for energy planners, developers, and policy makers to set the strategies for promoting the development of utility-scale solar PV plants in pro of the sustainable development of Indonesia.

1. Introduction

Ensuring access to affordable, reliable, sustainable and modern energy for all is one of the sustainable development goals set by the United Nations (UN), with the specific goal to substantially increase the share of renewable energy in the global energy mix by 2030 [1]. In this context, massive development of solar photovoltaic (PV) plants near equatorial countries should play an important role in achieving this goal, where these plants are expected to be within the top renewable energy sources in the future, as the development of PV farms has shown a consistently increasing trend worldwide [2,3,4].
The development of large-scale PV plants usually consists of the following stages: (1) concept development and site identification, (2) pre-feasibility study, (3) feasibility study, (4) permitting, financing and contracts, (5) and engineering, construction and commercial operation [5]. The main goals of activities in stages (1)–(3) are to design a solar PV plant that is optimally balanced in terms of cost and performance for a specific site and to minimize the barriers in the development of the solar PV plant. To achieve these goals, several aspects should be considered, comprehensively, including energy resource and yield estimates, site-specific requirements and constraints, site topography, environmental constraints, and social considerations, which involve a complex and challenging process to collect and analyze a large amount of data. Therefore, the use of geographical information systems (GIS) to aid the development of the solar energy sector has attracted increasing attention as the GIS can be used to perform inexpensive site suitability analysis [6], required for the determination of the best location for a PV farm installation via common analytic hierarchy process (AHP) algorithms [7,8], and multi-decision-criteria analysis (MDCA) techniques [9,10], considering largely diverse climatological, topographic, and societal conditioning factors, as seen in the arid and semi-arid regions of Iran [11] and Saudi Arabia [12], or the area of Cartagena-Murcia in the southwest region of Spain [13], or the city of Oujda at the Eastern region of Morocco [14], the city of Rethimno at the north coast of the Greek island of Crete [15], and the Karapinar region of Konya in Turkey [16]. Likewise, these techniques have been shown to be highly successful in the integration of economic factors for suitability studies of the large-scale development and utilization of solar energy resources, where optimal locations can also be found by using GIS, AHP, and MDCA techniques adapted to the specific conditions (criteria) of countries such as China [17,18,19], where it has been recently found that the province of Xinjiang is the most optimal site for large-scale photovoltaic station construction according to their calculated Levelized Cost of Energy (LCOE) [20], or the positive LCOE trends found at the sovereign state of Bahrain in the Persian Gulf, which indicates that large-scale photovoltaics in this region is a viable alternative for meeting their future electricity demand [21]. A similar trend can be found in the 2014 study for the technical and economic potential of solar energy at Indonesia, which, at the time, predicted a payback period of 11 to 17 years [22], similar to what was predicted for the province of Elazig in Turkey [23]. Nevertheless, the case of Indonesia is a very particular one, as their location and topography implies administrative boundaries and environmental constraints set by the large number of islands (>2000) that compose the country, as well as the vast amount of protected areas and policy frameworks that can alter these assessments at individual provinces. In this sense, regions such as Borneo Island are considered ideal for performing technical and economic viability assessments for the deployment of large-scale solar energy projects, as, due to its large extension, local results can be easily emulated on the other island in Indonesia.
Thus, the GIS is valuable in accelerating the solar farm development process, as it integrates satellite-retrieved data of solar energy resources with other essential information such as land usage, topography, demography, and public facilities, providing tools for further analyses of data. Furthermore, the inclusion of the land usage map in the GIS helps on promoting the sustainable development of utility-scale PV plants without compromising protected areas such as, protected forests and biodiversity conservation areas, which aligns with the UN sustainable development goal to protect, restore, and promote sustainable use of terrestrial ecosystems, sustainably manage forests, combat desertification, and halt and reverse land degradation and halt biodiversity loss [1].
The investment cost for the development of utility-scale PV plants is relatively high, although its cost can fluctuate depending on comparative technical specifications of different installation and grid connectivity components such as solar modules, inverters, transformers, trackers and energy storage systems [24,25], as well as by procurement and construction costs, including predevelopment costs for administration, consultancy, project management, site preparation, taxation, and approvals by local authorities which ensure the compliance of policy frameworks when issuing sitting permits and environmental approvals [26,27,28]. Therefore, comprehensive pre-feasibility and feasibility studies are essential in setting up a development plan that minimizes the development risks and ensures the balance of cost and performance of the PV plant. In this paper, we perform a GIS-based technical and economic feasibility assessment of utility-scale PV farm in the West Kalimantan Province of Indonesia, as an effort to promote the development of utility-scale solar plants in the province, extending the results and scope of the GIS-AHP-MDCA model introduced in [29,30], which is important, not only for the sustainable development of the province but also for the sustainable development of the entire country. This is because, currently, the energy supply of Indonesia is dominated by fossil fuels such as oil, gas, and coal, and with the decrease in oil reserves, Indonesia heavily depends on imported oil at the point that in 2017, it was reported that Indonesia has spent 150 trillion Indonesian Rupiah (IDR) per year for importing 200-million-barrel oil [27], therefore imposing a significant burden to the national budget and threatening its national energy security. To overcome this problem, the Indonesian government is promoting the use of renewables, releasing a General Plan of National Energy (Rencana Umum Energi Nasional (RUEN)) where it has been set a target of renewable energy contribution in the energy mix of 23% in 2025 and 31% in 2050 across the country [28].
In the RUEN, the power capacity of solar PV plants is projected to reach 6.5 GW in 2025 and 14.2 GW in 2030, which will be achieved by developing the plants in all provinces in Indonesia. For the Kalimantan region, the target in 2025 is 1.081 GW with a specific target of 366.4 MW for West Kalimantan, 232.1 MW for East Kalimantan, 221.0 MW for Central Kalimantan, 160.0 MW for South Kalimantan, and 101.7 MW for North Kalimantan. It should be noted that the West Kalimantan Province is located at the equatorial region and thence it has a relatively higher and nearly constant solar irradiation throughout the year compared with the other Indonesian provinces [29,30,31,32], and, consequently, its abundant solar energy resource is considered as essential for achieving the Indonesian’s energy target. Unfortunately, the current development of PV plants in the province is nearly stagnant, and thus more efforts are required to accelerate the incursion of solar energy farms to realize the Indonesian target, where one of the barriers found is the lack of bankable projects due to low-quality feasibility studies [33]. Therefore, this paper provides a detailed feasibility study capable of reducing some of the largest technical and economic barriers in the practical development of utility-scale PV plants.

2. Feasibility and Assessment Framework

Previously [31,32], we have developed a WebGIS package that integrates satellite-derived data of solar energy resources with locally obtained data such as land usage, topography, road lines, and an electrical network. We used the satellite-retrieved data of solar energy resources provided by the World Bank Group and Solargis [29,30], in which the solar energy resources are presented in terms of Global Horizontal Irradiation (GHI). Data on land usage, topography, and road lines are collected from the governmental offices, while the data of electrical networks were obtained from the National Electric Company PLN. Here, we used the GIS package to assess the technical and economic feasibility of utility-scale solar PV plants in the West Kalimantan Province of Indonesia. The province is the second largest and most populated province in Kalimantan Island, also known as Borneo Island, which is the third-largest island in the world. The island is considered one of the richest landmasses for the development of solar PV plants, and thus adequate routes for the planning and development of solar PV plants on this island are attractive for government and investors.
As noted previously, the West Kalimantan Province is planned to have the largest solar PV capacity as compared to the other provinces in Kalimantan island. Thus, with a total area of 146,807 km2, the province has an abundant resource of solar energy indicated by the relatively high values of GHI for almost all areas, as shown in Figure 1. However, in the development of utility-scale solar PV plants, we have to take care of land usage, as there are several types of land that cannot be exploited, such as protected forests, rice field, peatland, cultural or community forest, water bodies, wildlife or endangered habitat, settlement areas, road plans, and the power grid network area. In the GIS package, we included those areas as constrained layers and, used the sub-layers as subtraction areas to obtain the exploitable area. Therefore, although some environmental and social factors are inherently included within our technical and feasibility study, we would like to emphasize that this paper does not aim to provide an impact study on how the recommendations below provided could change the levels of pollutant emissions caused by other on-grid energy sources, and likewise on how this could impact the variability on energy prices by the development of new policies or regulations in the energy sector, being these matters of future studies. Instead, the general assessment of technical and economic feasibility is applied to the calculated exploitable areas, and more specific analysis is performed on selected sites, based on the assessment factors presented in the following subsections.

2.1. Technical Assessment Factors

To evaluate the technical feasibility of utility-scale solar PV plants, we developed a tool for the calculation of annual energy production that was integrated into the ArcMap-GIS software (v10.6.1) and the WebGIS platform created in [29,30]. Following the well-established methods used in [8] and [34], we calculated the annual energy production Epv in kWh as follows:
E p v = S R × C A × D y × η × η d × P R
where SR represents the annual averaged daily GHI in kWh/m2/day (see Figure 1), CA represents the available or suitable land area for the deployment of solar farms in m2, i.e., all regions outside of the constrained areas reported in Figure 2, and D y is the number of days in a year. These are multiplied by solar efficiency parameters such as: η, which represents the efficiency of the PV modules to be installed, which into our calculations has been assumed to be 16% being this the average efficiency of commercial silicon PV modules [10]; ηd, which represents the factor for direct current (DC) to alternating current (AC) conversion assumed to be 0.77 according to what has been reported into the literature [34]; and the annual average solar plant performance ratio PR, which is a measure for the performance of a PV system across a year, taking into account climatology factors such as temperature, irradiation, cloudiness, and other climate changes, which has been calculated to be 76.2% from the data of the World Bank Group and Solargis for the city of Pontianak, capital of the West Kalimantan Province [31,32].
By applying the calculation to each pixel that represents an area of 1 km2, we generated the overall map of annual energy production across the entire WKP, excluding any environmental conservation and protected areas (see Figure 2a), with which a further detailed assessment of the technical and economic feasibility of selected sites was performed by incorporating detailed information about site topography, proximity to important facilities, and the type of land into the levelized cost analysis that is summarized below.

2.2. Economic Assessment Factors

The economic feasibly of utility-scale solar PV plants was estimated by calculating the potential cost of energy production. The production cost per kWh was calculated using the levelized cost analysis, which was adapted from Pillai and Naser [21]. Here, the cost of electricity per kilowatt, CkWh, is calculated from total annual cost, TAC, and annual energy production Epv as follows:
C k W h = T A C E p v
where the total annual cost is calculated from the following formula:
T A C = ( C I + C G C + C R C ) × C R F + C O & M  
Here, CI is the cost for investment and installation for PV farms, which is obtained from the financial authority of Indonesia [35], while CGC is the cost for grid connection to the main grid, CRC is the cost for road connection to the major road, and CO&M is the operation and maintenance cost. The cost of investment and installation is estimated to be 1050 USD/kW, while the operation and maintenance costs are estimated to be 25 USD/kW/year [26]. The connection cost is calculated based on the proximity to the major road and grid, which is around USD 208,000 per km for grid connection [36] and USD 196,000 per km for road connection [37]. CRF is the Capital Recovery Factor, which converts the current total investment cost to the equal annual cost during the period of a lifetime [18], which can be estimated as follows:
C R F = i × ( 1 + i ) n ( ( 1 + i ) n 1 )
where i is the annual real interest rate, and n is the lifetime duration.
Then, if i′ is the nominal interest rate and f is the annual inflation rate, the annual real interest rate i can be calculated as follows [21]:
i = i f 1 + f
Thus, the economic feasibility of utility-scale solar PV plants is assessed using a map of levelized electricity cost, which is generated by applying the above calculations on each pixel of a specific area using the GIS package.

3. Results and Discussion

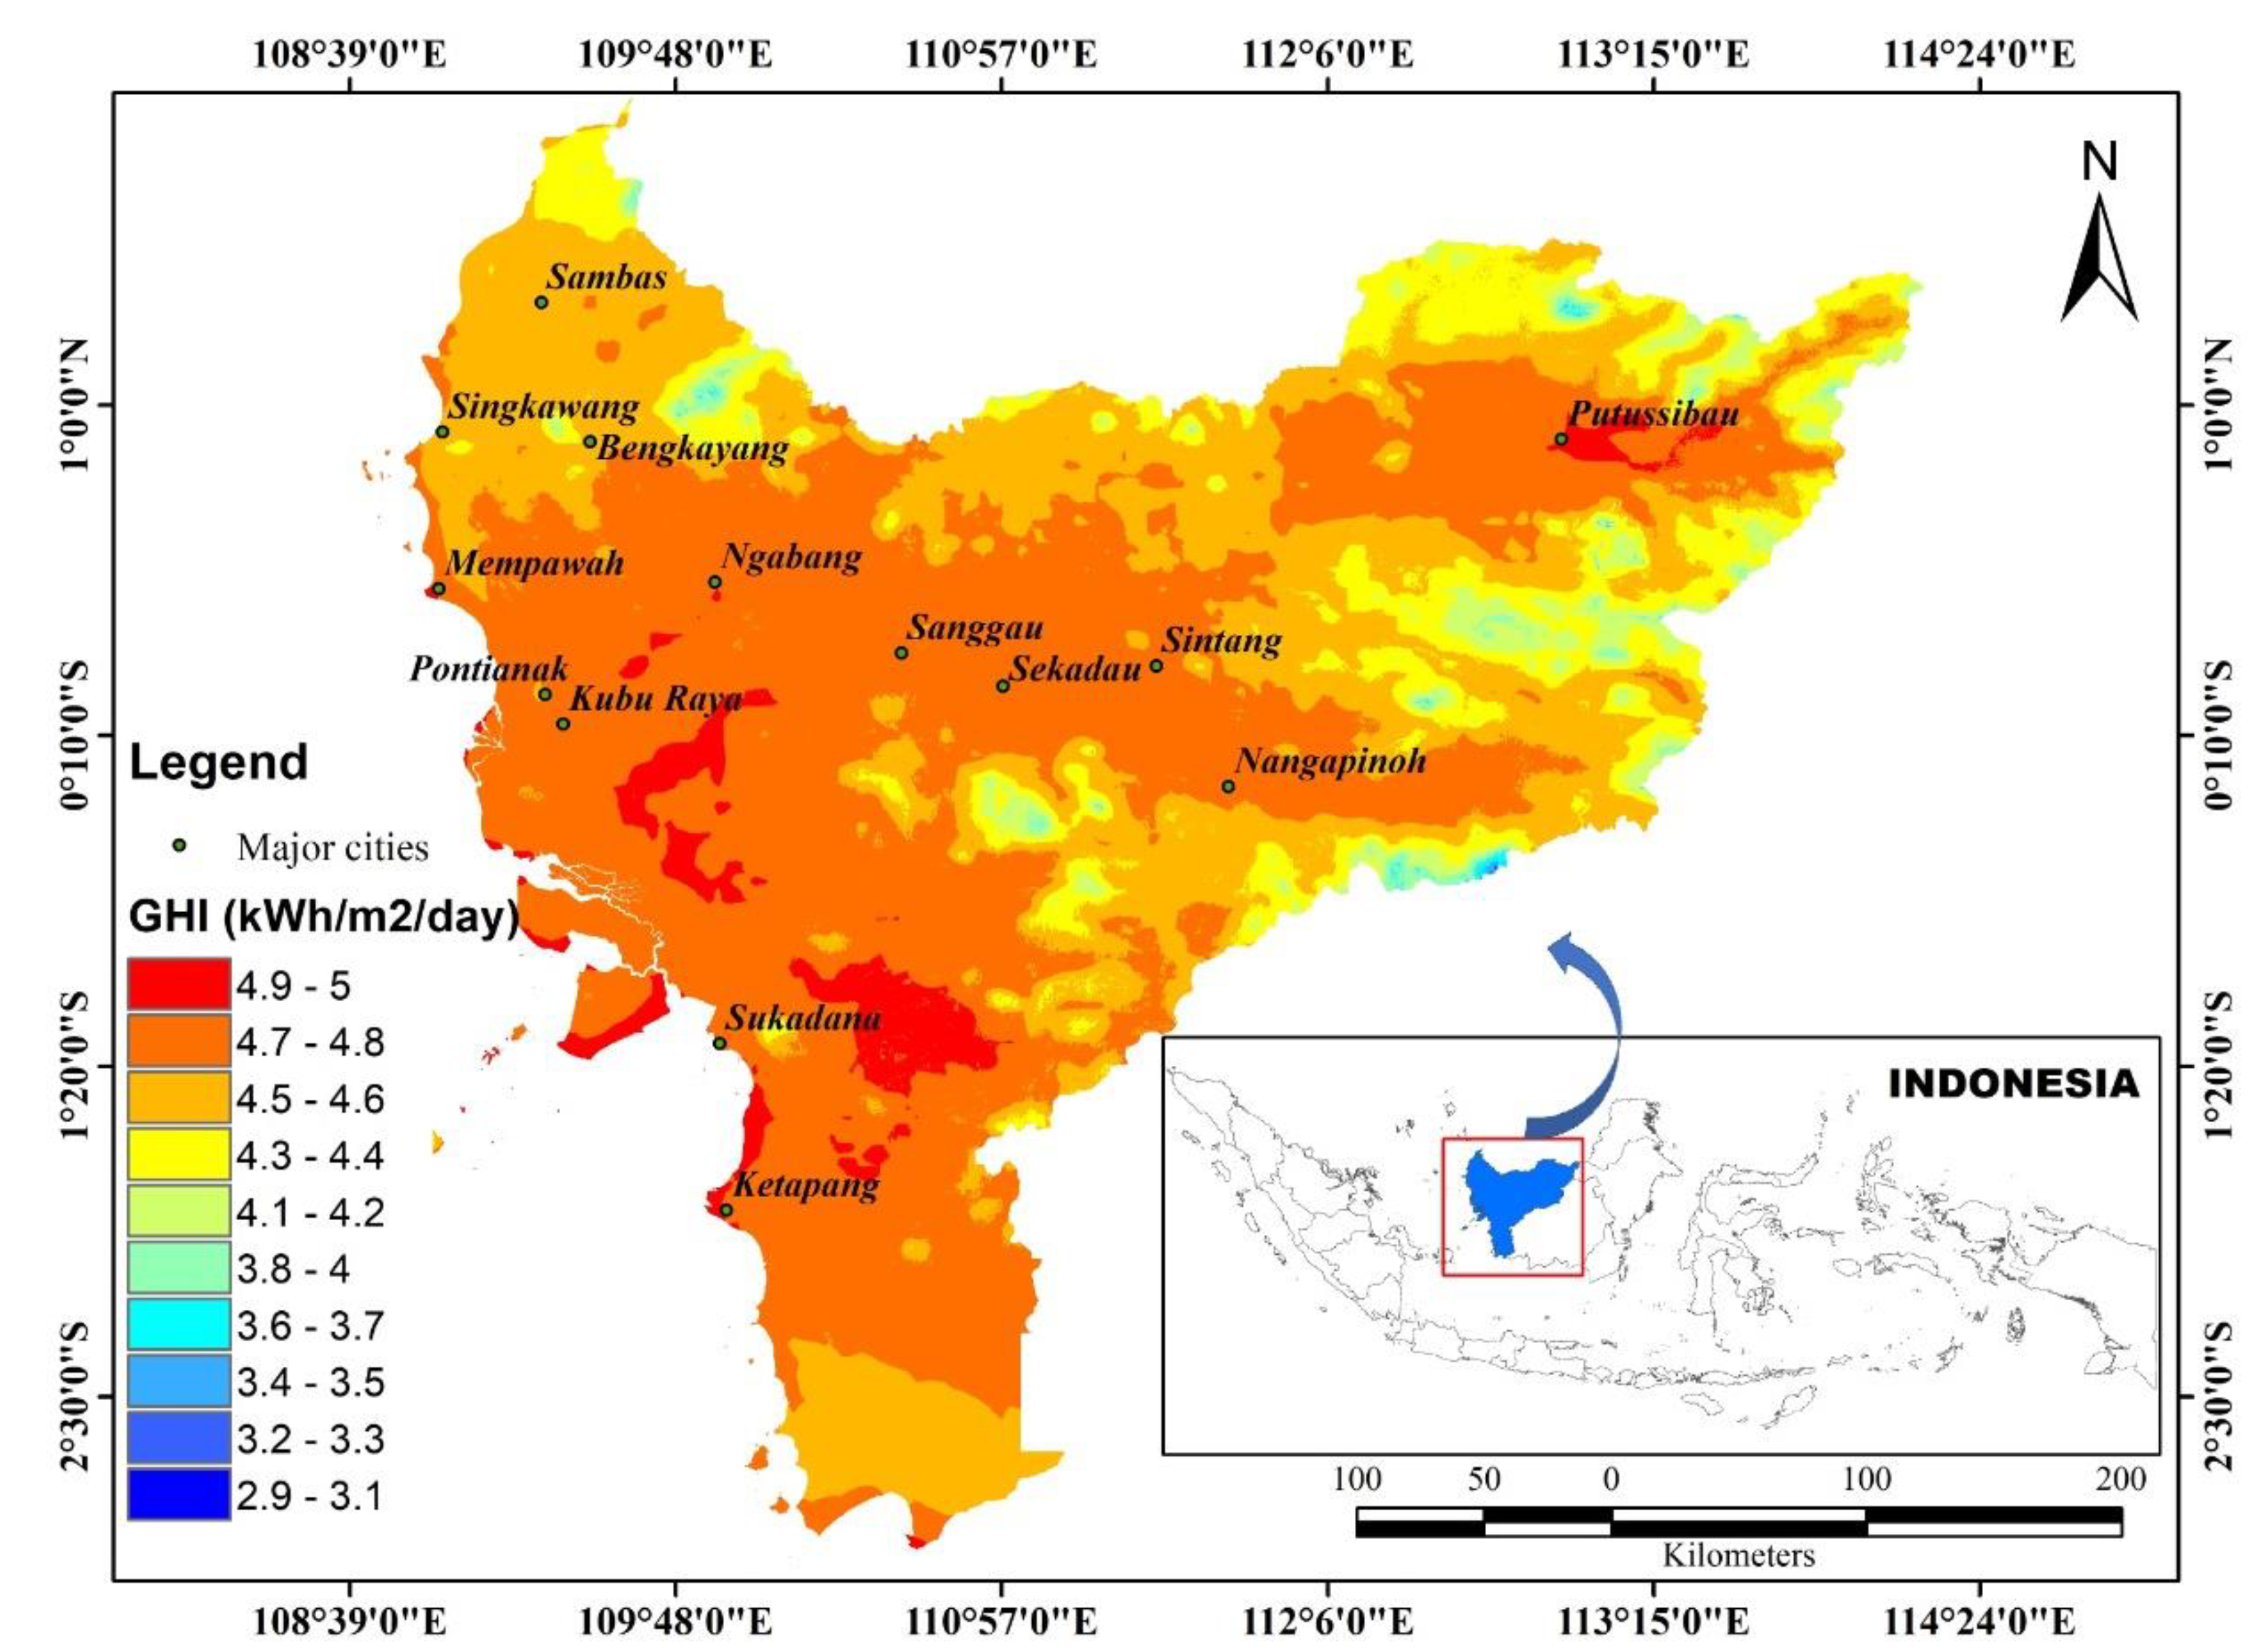
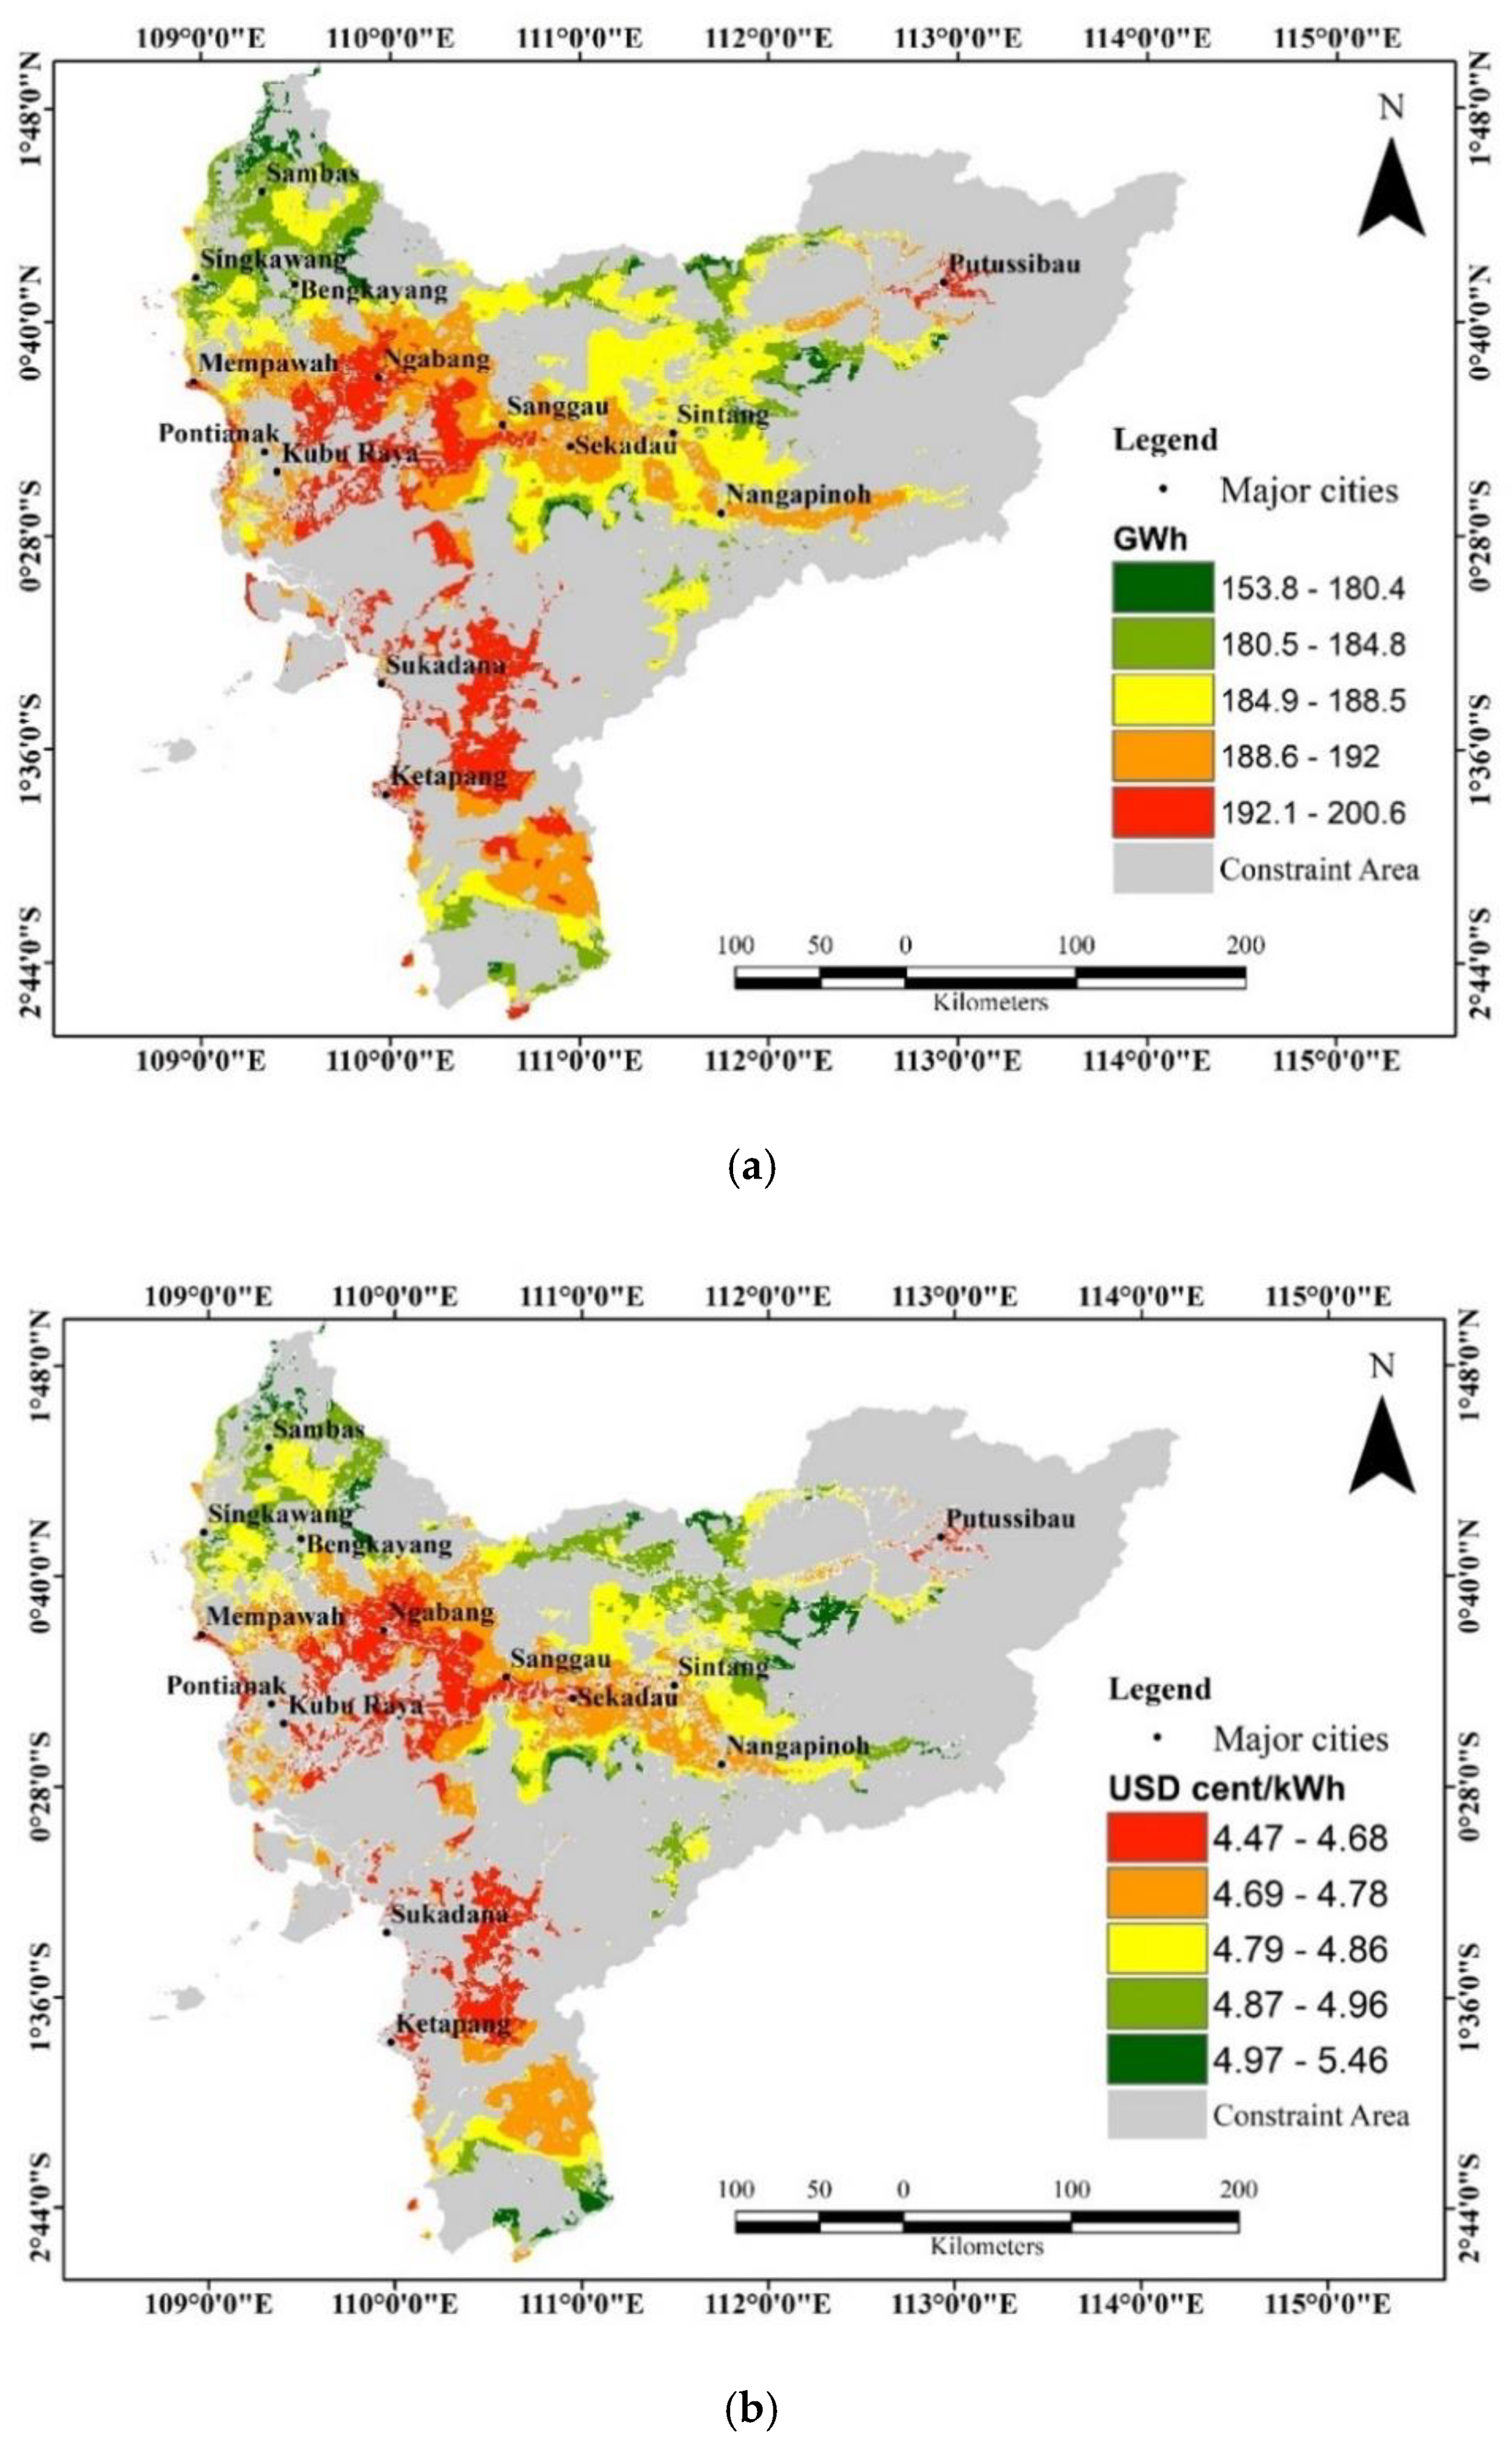
3.1. Feasibility of PV Plants at West Kalimantan Province

For the general assessment of technical and economic feasibility, the maps of annual energy production and the cost of electricity for West Kalimantan Province are shown in Figure 2, in which the colors represent the level of annual energy production or the electricity cost. As previously noted, the annual energy production and cost of electricity are only calculated on the exploitable area, and thus the unexploitable areas due to the constraints such as conservation and protected areas are shown in gray. The visualization of data into the color map is aimed to help us to identify suitable sites for the development of solar PV plants (red color in Figure 2), which correspond to the areas with high annual energy production and low electricity cost. It can be observed in Figure 2 that suitable areas for the development of solar power plants are relatively large and spreading around the major cities. This is an advantage for the development of utility-scale solar PV plants, as it provides an opportunity to develop power plants that are close to the required infrastructure and facilities such as major roads and power substations, such that the technical barriers and the cost of installation and grid connection can be reduced.
For further analysis, the areas for each level of annual energy production and electricity cost are presented in Table 1 and Table 2. It can be observed in Table 1 that the exploitable area for solar PV plants is 49,859 km2 (34% of the area of West Kalimantan Province), which corresponds to the total annual energy production of 9,384,400 GWh. Most of the exploitable area (96.3%) has an annual energy production higher than 180 GWh/km2. This indicates the large potential for the development of utility-scale solar PV plants in the West Kalimantan Province.
The data in Table 2 show that most of the exploitable area (93%) can be utilized for the development of solar PV plants with an average electricity cost of 4.85 ¢USD/kWH, which refines the levelized cost of energy predicted by IESR [26], with an average cost of 8.06 ¢USD/kWH and a minimum cost of 5.84 ¢USD/kWH, where a constant value for power generation/capacity factor of the prospective PV plant has been assumed, instead of the overall map of GHI across the region, as was the case in this study (see Figure 2). This average cost for utility-scale solar energy in West Kalimantan is generally smaller than the average cost of electricity generated by geothermal (6.63 ¢USD/kWH), biomass (8.04 ¢USD/kWH), onshore wind turbines (11.75 ¢USD/kWH), coal-fired power stations (6.86 ¢USD/kWH), open cycle gas turbines or OCGT plants (11.745 ¢USD/kWH), combined cycle gas turbines or CCGT plants (7.81 ¢USD/kWH), and diesel power plants (10.4 ¢USD/kWH), although it is known that fossil fuel plants have a significant percentage of variable and fuel cost in their cost structure, which can range from 37% to 53% for coal-based plants, 48% to 76% for OCGT and CCGT plants, and even more than 80% for diesel power plants according to [33]. Nevertheless, the impact of fossil fuel based generated power in the cost of CO2 emission is substantially larger than in the case of renewables, and, although a significant drop in the price of coal and diesel has been recently observed due to the COVID-19 pandemic, in the long term and thanks to the financial benefits commonly offered to the investments in renewables, the development of a solar PV plant is considered the most promising alternative for electric generation, as its electricity cost and infrastructure costs, such as civil and planning costs, are significantly lower than the ones for other alternatives and generally remain lower than the cost associated with the operation of diesel engine-generated power, which is the dominant source of electricity supply at WKP.

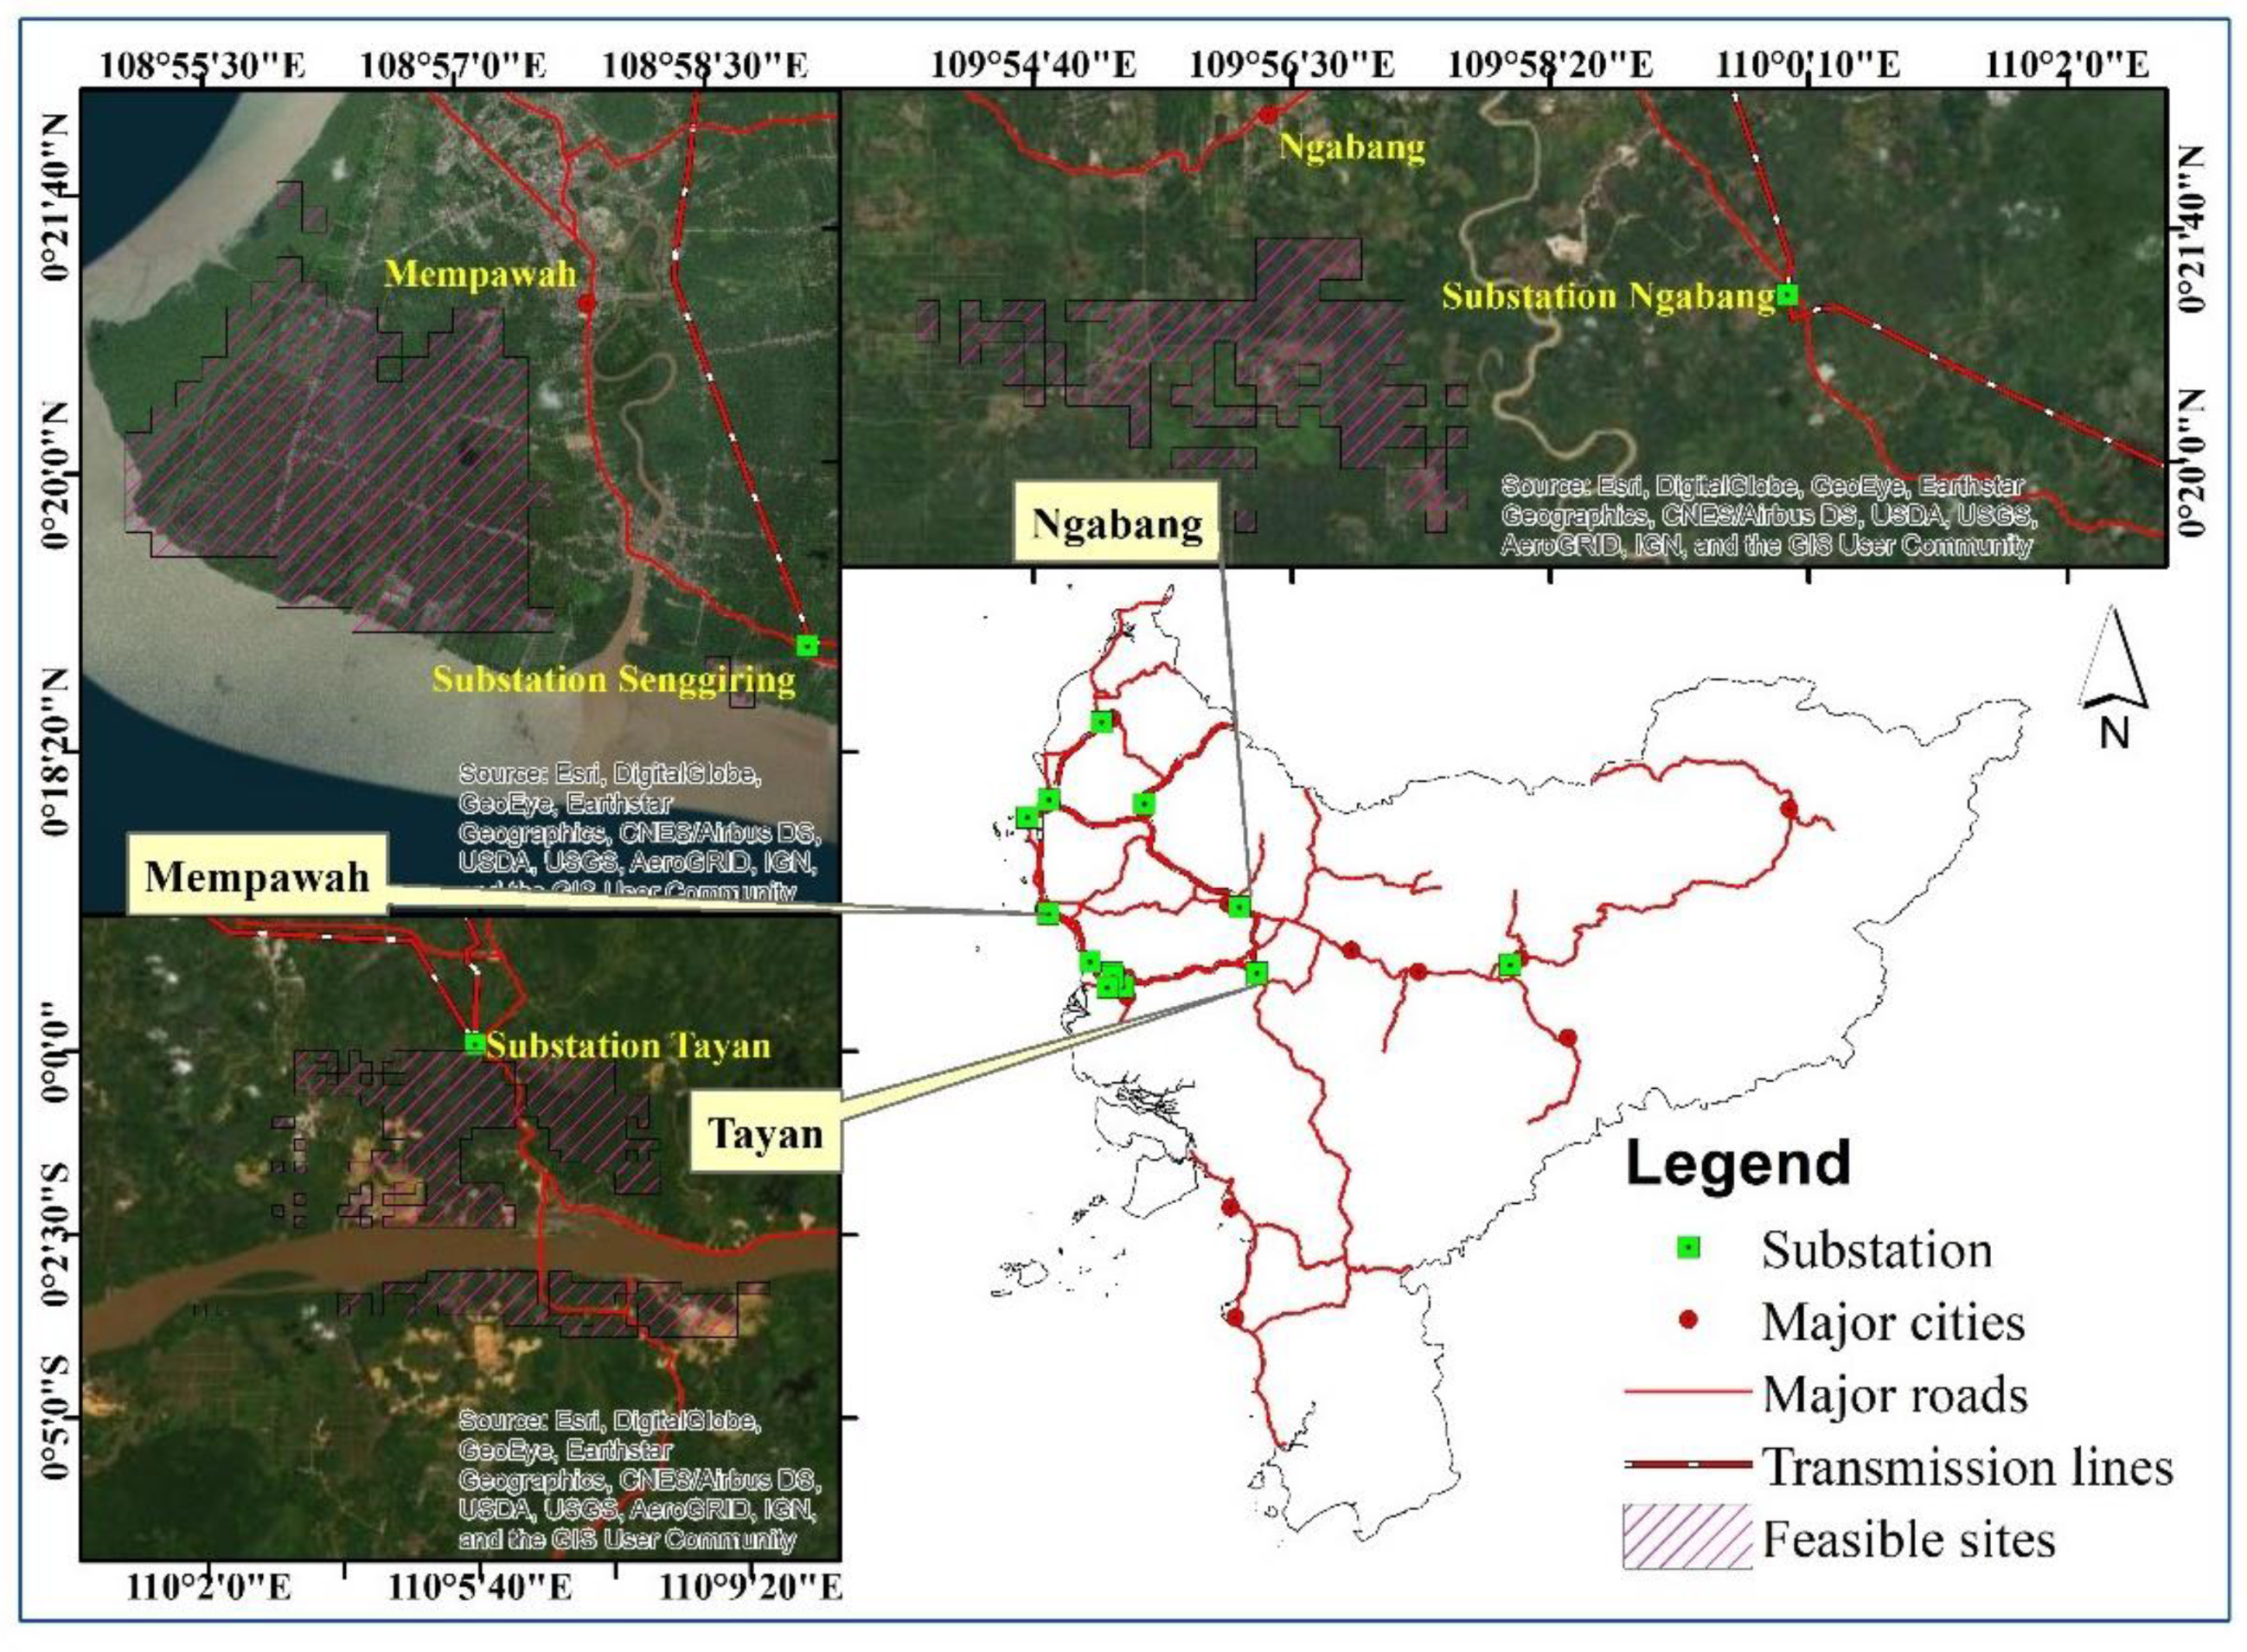
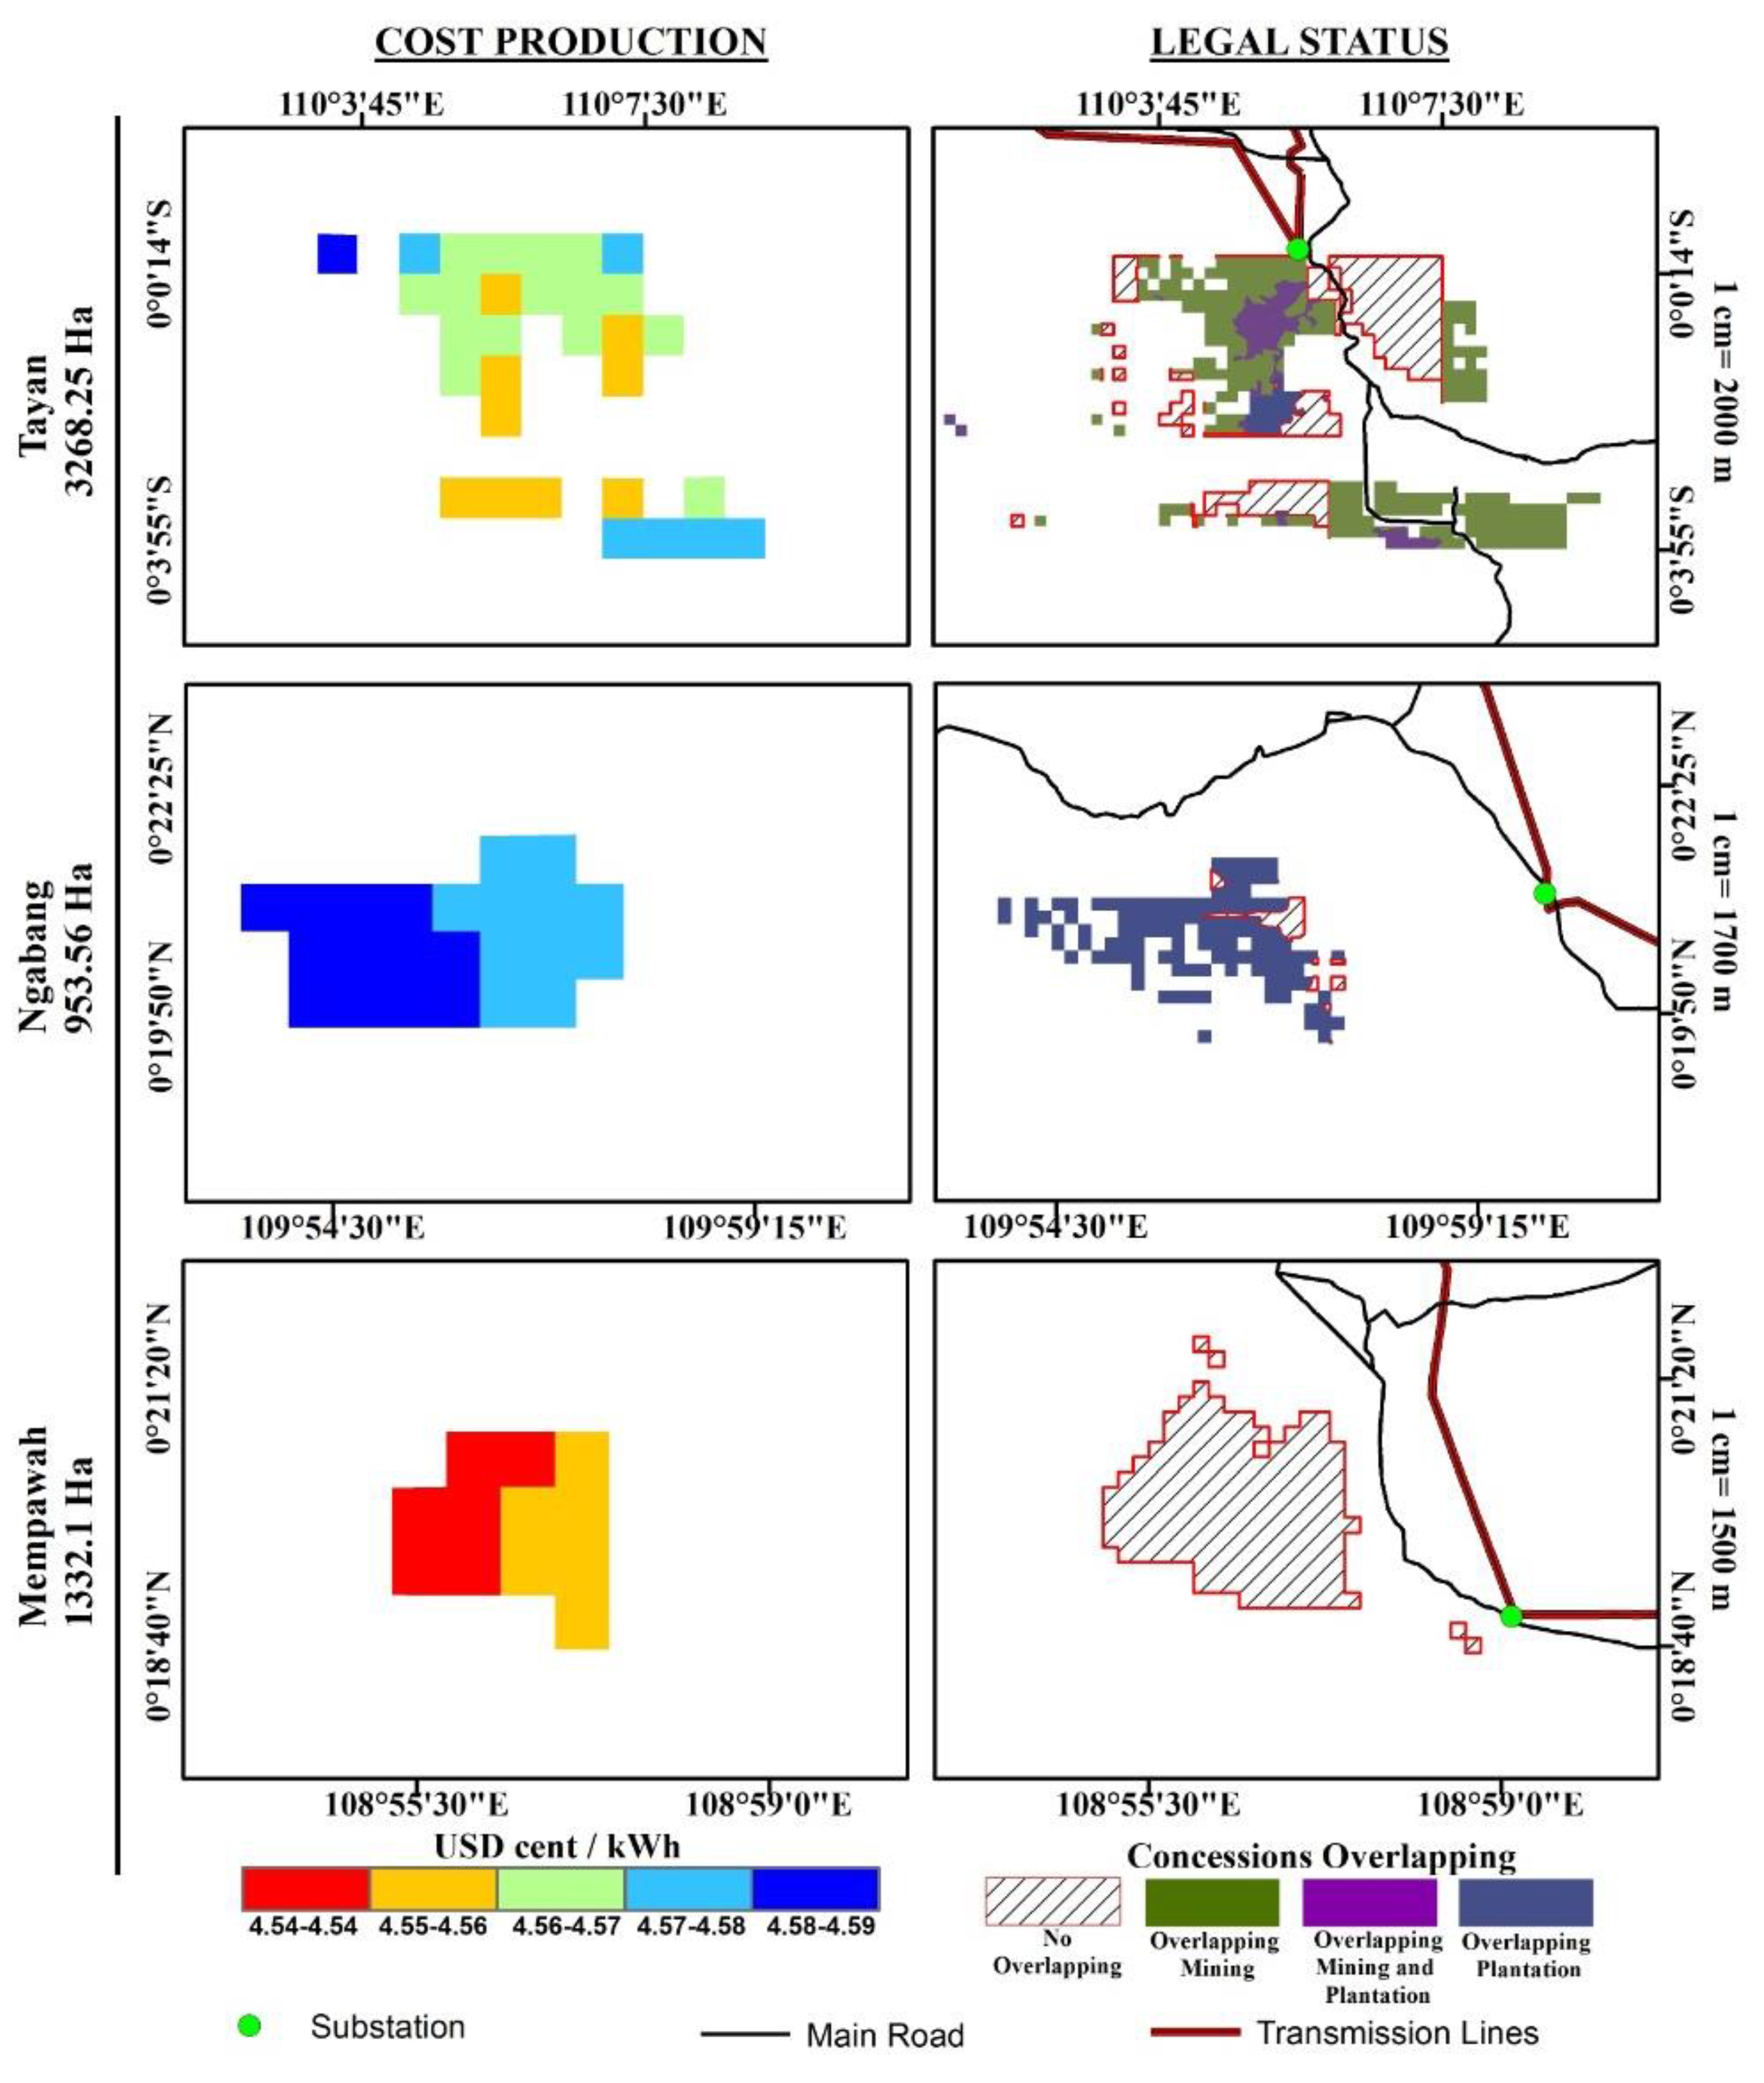
3.2. Feasibility of PV Plants at Selected Sites

To further assess the technical and economic feasibility of solar PV plants, three potential sites were selected, as shown in Figure 3. The sites are in the vicinity of Mempawah City, Ngabang City, and Tayan City, which are the major cities in Mempawah Regency, Landak Regency, and Sanggau Regency, respectively. The selection of the sites was based on an Analytical Hierarchy Process (AHP), which accounts for primary factors such as the annual energy production based on satellite retrieved GHI data (Figure 2), the proximity to existing power substations and main roads [29,30], as well as topology factors such as the terrain slope and elevation (Table 3), while the detailed map of electricity cost and legal status of the land is shown in Figure 4.
As shown in Table 3, all sites have GHI values higher than 4.8 kWh/m2/day, which correspond to an annual energy production higher than 195 GWh/km2. Taking into account the available area, the total annual energy production for each site is estimated to be 235,500 GWh for the site at Mempawah, 449,075 GWh for the site at Ngabang, and 606,050 GWh for the site at Tayan, with a corresponding total power capacity of 26.88, 51.26, and 69.18 GW, respectively. Therefore, the development of utility-scale solar PV plants at one of the sites should be sufficient for achieving the government target to develop solar PV plants of 0.366 GW for West Kalimantan, and even sufficient for achieving the national target of 6.5 GW in 2025.
In addition to the solar energy resource, the topography of the sites should be considered carefully, as it is one of the factors that affect the installation of grid-connected PV systems, and thus is closely related to the overall cost of electricity production. Thus, as shown in Table 3, the slopes at the sites are less than 5%, and, therefore, the installation cost of solar PV plants on the sites is expected to be low, or with little influence on further decision-making processes. Likewise, the distances of the sites to the substations are less than 5 km, and the distances to the main road are less than 2 km. Therefore, the transmission and distribution connection costs, as well as road developments and civil work costs are also expected to be substantially lowered.
Figure 4 shows the map of electricity cost and land usage for the selected sites. It can be observed that the cost of electricity for the selected sites are comparable in the range of 4.54–4.59 ¢USD/kWh. As the electricity cost is slightly high, the site at Ngabang is less favorable as compared to the other sites at Mempawah and Tayan. However, compared to diesel engine-generated electricity, which is the main power supply in the West Kalimantan Province, the estimated electricity costs for solar PV plants at all selected sites are lower, and, therefore, the development of utility-scale solar PV plants at all these sites is considered an attractive alternative for the sustainability of the region. However, it is worth mentioning that, when land usage is considered, the site at Mempawah has resulted as the best location, as at this site there is no overlapping with the potentially conflicting land usage such as mining and plantation.

4. Conclusions

A GIS-based assessment of the technical and economic feasibility of utility-scale solar PV plants in the West Kalimantan Province has been performed. Annual energy production and electricity cost were estimated using calculation tools integrated into a predeveloped GIS package [29,30], and the resulting values have been plotted over the exploitable land obtained by excluding constrained areas reserved for the protection and sustainable conservation of land. In this sense, the presented assessment tool has given uttermost importance to the protection of environmental and social factors covered by the possible use and conservation of forests and peatlands with cultural or community interests, the sustainability of wildlife habitats where endangered species such as the Orang-Utan live, as well as fundamental productivity sectors such as rice fields and settlement areas, with existing infrastructural assets for the deployment of energy plants such as major roads and the power grid network.
On the one hand, it has been found that the exploitable land for the development of solar PV plants covers an area of 49,859 km2, with an estimated annual energy production higher than 180 GWh/km2 and an electricity cost lower than 5 ¢USD/kWh. The high values of annual energy production and much lower electricity cost as compared to the electricity cost of diesel engine-generated electricity, indicate that the development of onshore utility-scale solar PV plants in West Kalimantan Province is the most attractive option to meet the Global Energy targets committed by Indonesia. Further research in terms of the viability and cost level analysis for offshore PV farms installation in Indonesia is necessary, although the electricity cost will not be expected to be lower than 5 ¢USD/kWh as the cost for offshore grid connection to the main grid (the CGC factor at Equation (3)), and the system operation and maintenance cost (the CO&M factor), both can increase well over the cost for road connections for onshore approaches, and it might imply an additional cost consideration for the expansion or development of fluvial platforms. Likewise, we would like to emphasize that, to achieve a comparable estimation of the levelized costs of electricity production with other renewables, it is necessary to perform a similar study to the one presented here, where land use, social risks, policy barriers and financial frameworks for mitigating the costs of deployment and exploration risks in geothermal, hydropower, and even wind energy are considered.
On the other hand, a further detailed assessment of sites in the vicinity of the main cities in WKP has been performed, showing a set of three derived sites that are technically and economically feasible for the development of utility-scale solar PV plants, and for which not only legal constraints due to the existence of protected or conservation areas have been overcome, but which result in optimal locations for the deployment of utility-scale solar power plants due to their proximity to major settlements, existing roads, and power network infrastructure. Therefore, the approaches and results of this research are expected to influence power energy investors, government, and territorial stakeholders to set accurate policy frameworks and regulation instruments for WKP, Borneo Island, and ultimately the entire Indonesian territory; this is due to the largely homogeneous GHI distribution encountered. This will ultimately feed the tariff range indexation within the solar PV sector across the country and will introduce strategies for boosting the deployment of utility-scale solar PV plants, which are expected to support the 2030 Energy Sustainability targets of Indonesia. Furthermore, studies on the economic impact of technical requirements for grid connectivity and tax-indexation factors relevant to the investment on solar energy are needed, as, depending on the size of the solar farm envisaged, the capital recovery factor and payback period could suffer substantial variations.

Author Contributions

A.S. and H.S.R. have contributed in the conceptualization, formal analysis, funding acquisition, project administration, supervision, and writing—review & editing of this paper. K.I.-B. has contributed with the conceptualization, data curation, formal analysis, methodology, validation, visualization, and writing—review & editing of this paper. Finally, S.A.M. and I.B. have both contributed with data curation, investigation, software, and resources for the writing of this paper. All authors have read and agreed to the published version of the manuscript.

Funding

This work was funded by the Institutional Links grant, ID 413871894, under the Newton Fund Indonesia partnership. The grant is funded by the UK Department for Business, Energy and Industrial Strategy and the Indonesian Ministry of Research, Technology, and Higher Education and delivered by the British Council. For further information, please visit www.newtonfund.ac.uk.

Acknowledgments

This work also supported by the ALICE High-Performance Computing Facility at the University of Leicester. HSR (UK) and AS (IND), principal investigators of this project express their special thanks to our large set of stakeholders and project partners (see Refs. [29,30]) for the valuable discussions and data sharing.

Conflicts of Interest

The authors declare no conflict of interest.

References

  1. United Nations. Transforming Our World: The 2030 Agenda for Sustainable Development; United Nations: New York, NY, USA, 2016. [Google Scholar]
  2. IRENA. Global Energy Transformation: A Roadmap to 2050; International Renewable Energy Agency: Abu Dhabi, UAE, 2018; ISBN 1059-910X. [Google Scholar]
  3. REN21. Renewables 2019 Global Status Report; REN21 Secretariat: Paris, France, 2019; Volume 8, ISBN 9783981891140. [Google Scholar]
  4. DNV-GL. Energy Transition Outlook 2019: A Global and Regional Forecast to 2050; DNV GL AS: Høvik, Norway, 2019. [Google Scholar]
  5. IFC. Utility-Scale Solar Photovoltaic Power Plants: A Project Developer’s Guide; International Finance Corporation: Washington, DC, USA, 2015. [Google Scholar]
  6. Choi, Y.; Suh, J.; Kim, S.M. GIS-based solar radiation mapping, site evaluation, and potential assessment: A review. Appl. Sci. 2019, 9, 1960. [Google Scholar] [CrossRef] [Green Version]
  7. Noorollahi, E.; Fadai, D.; Shirazi, M.A.; Ghodsipour, S.H. Land suitability analysis for solar farms exploitation using GIS and fuzzy analytic hierarchy process (FAHP)—A case study of Iran. Energies 2016, 9, 643. [Google Scholar] [CrossRef]
  8. Asakereh, A.; Soleymani, M.; Sheikhdavoodi, M.J. A GIS-based Fuzzy-AHP method for the evaluation of solar farms locations: Case study in Khuzestan province, Iran. Sol. Energy 2017, 155, 342–353. [Google Scholar] [CrossRef]
  9. Charabi, Y.; Gastli, A. PV site suitability analysis using GIS-based spatial fuzzy multi-criteria evaluation. Renew. Energy 2011, 36, 2554–2561. [Google Scholar] [CrossRef]
  10. Doorga, J.R.S.; Rughooputh, S.D.D.V.; Boojhawon, R. Multi-criteria GIS-based modelling technique for identifying potential solar farm sites: A case study in Mauritius. Renew. Energy 2019, 133, 1201–1219. [Google Scholar] [CrossRef]
  11. Zoghi, M.; Houshang Ehsani, A.; Sadat, M.; Javad Amiri, M.; Karimi, S. Optimization solar site selection by fuzzy logic model and weighted linear combination method in arid and semi-arid region: A case study Isfahan-IRAN. Renew. Sustain. Energy Rev. 2017, 68, 986–996. [Google Scholar] [CrossRef]
  12. Al Garni, H.Z.; Awasthi, A. Solar PV power plant site selection using a GIS-AHP based approach with application in Saudi Arabia. Appl. Energy 2017, 206, 1225–1240. [Google Scholar] [CrossRef]
  13. Sánchez-Lozano, J.M.; Teruel-Solano, J.; Soto-Elvira, P.L.; Socorro García-Cascales, M. Geographical Information Systems (GIS) and Multi-Criteria Decision Making (MCDM) methods for the evaluation of solar farms locations: Case study in south-eastern Spain. Renew. Sustain. Energy Rev. 2013, 24, 544–556. [Google Scholar] [CrossRef]
  14. Merrouni, A.A.; Mezrhab, A.; Mezrhab, A. PV sites suitability analysis in the Eastern region of Morocco. Sustain. Energy Technol. Assess. 2016, 18, 6–15. [Google Scholar] [CrossRef]
  15. Giamalaki, M.; Tsoutsos, T. Sustainable siting of solar power installations in Mediterranean using a GIS/AHP approach. Renew. Energy 2019, 141, 64–75. [Google Scholar] [CrossRef]
  16. Uyan, M. GIS-based solar farms site selection using analytic hierarchy process (AHP) in Karapinar region Konya/Turkey. Renew. Sustain. Energy Rev. 2013, 28, 11–17. [Google Scholar] [CrossRef]
  17. Sun, Y.W.; Hof, A.; Wang, R.; Liu, J.; Lin, Y.J.; Yang, D.W. GIS-based approach for potential analysis of solar PV generation at the regional scale: A case study of Fujian Province. Energy Policy 2013, 58, 248–259. [Google Scholar] [CrossRef]
  18. Huang, T.; Wang, S.; Yang, Q.; Li, J. A GIS-based assessment of large-scale PV potential in China. Energy Procedia 2018, 152, 1079–1084. [Google Scholar] [CrossRef]
  19. Yang, Q.; Huang, T.; Wang, S.; Li, J.; Dai, S.; Wright, S.; Wang, Y.; Peng, H. A GIS-based high spatial resolution assessment of large-scale PV generation potential in China. Appl. Energy 2019, 247, 254–269. [Google Scholar] [CrossRef]
  20. Zhang, Y.; Ren, J.; Pu, Y.; Wang, P. Solar energy potential assessment: A framework to integrate geographic, technological, and economic indices for a potential analysis. Renew. Energy 2020, 149, 577–586. [Google Scholar] [CrossRef]
  21. Pillai, G.; Naser, H.A.Y. Techno-economic potential of largescale photovoltaics in Bahrain. Sustain. Energy Technol. Assess. 2018, 27, 40–45. [Google Scholar] [CrossRef] [Green Version]
  22. Fathoni, A.M.; Utama, N.A.; Kristianto, M.A. A Technical and Economic Potential of Solar Energy Application with Feed-in Tariff Policy in Indonesia. Procedia Environ. Sci. 2014, 20, 89–96. [Google Scholar] [CrossRef] [Green Version]
  23. Gürtürk, M. Economic feasibility of solar power plants based on PV module with levelized cost analysis. Energy 2019, 171, 866–878. [Google Scholar] [CrossRef]
  24. Sarker, P.C.; Islam, M.R.; Paul, A.K.; Ghosh, S.K. Solar Photovoltaic Power Plants: Necessity and Techno-Economical Development. In Renewable Energy and the Environment. Renewable Energy Sources & Energy Storage; Islam, M., Roy, N., Rahman, S., Eds.; Springer: Singapore, 2018. [Google Scholar]
  25. Rabiul Islam, M.D.; Rahman, F.; Xu, W. (Eds.) Advances in Solar Photovoltaic Power Plants; Green Energy and Technology; Springer: Berlin/Heidelberg, Germany, 2016. [Google Scholar] [CrossRef]
  26. IESR. Levelized Cost of Electricity in Indonesia: Understanding the Levelized Cost of Electricity Generation; IESR: London, UK, 2019. [Google Scholar]
  27. PwC Indonesia. Investment and Taxation Guide; PwC Indonesia: Jakarta, Indonesia, 2017; ISBN 9781786600356. [Google Scholar]
  28. President of the Republic of Indonesia Joko Widodo. Presidential Regulation No. 22 Year 2017 on General Plan on National Energy (RUEN); Dewan Perwakilan Rakyat DPR: Jakarta, Indonesia, 2017.
  29. Ruiz, H.; Sunarso, A.; Ibrahim Bathis, K.; Murti, S.A.; Budiarto, I. SolarBoost Web GIS. Available online: http://webmap.solarboost.tech/ (accessed on 1 May 2020).
  30. Ruiz, H.S.; Sunarso, A.; Ibrahim Bathis, K.; Murti, S.A.; Budiarto, I. GIS-AHP Multi-Decision-Criteria-Analysis for the Optimal Location of Solar Energy Plants at Indonesia. arXiv 2020, arXiv:2007.15351. [Google Scholar]
  31. The World Bank Group. Solar Resource and Photovoltaic Potential in Indonesia; Energy Sector Management Assistance Program, World Bank Group: Washington, DC, USA, 2017. [Google Scholar]
  32. The World Bank Group and Solargis. Solar Resource Maps of Indonesia; Global Solar Atlas 2.0, May 2017, Solargis: Bratislava, Slovakia; Available online: https://solargis.com/maps-and-gis-data/download/indonesia (accessed on 15 April 2019).
  33. IESR. Indonesia Clean Energy Outlook Imprint Indonesia Clean Energy Outlook; IESR: London, UK, 2020; pp. 1–71. [Google Scholar]
  34. Sabo, M.L.; Mariun, N.; Hizam, H.; Mohd Radzi, M.A.; Zakaria, A. Spatial matching of large-scale grid-connected photovoltaic power generation with utility demand in Peninsular Malaysia. Appl. Energy 2017, 191, 663–688. [Google Scholar] [CrossRef]
  35. OJK. Clean Energy Handbook For Financial Service Institutions; OJK: Jakarta, Indonesia, 2014; Volume 19.
  36. Vaillancourt, K. Electricity Transmission and Distribution; Technology Brief; IEA ETSAP: Paris, France, 2014; Volume E12, pp. 1–16. [Google Scholar]
  37. ADB. Technical Assistance Consultant’s Report Project Number 38479—Republic of Indonesia: Regional Roads Development Project (Financed by the Japan Special Fund); ADB: Toronto, ON, Canada, 2010; pp. 1–26. [Google Scholar]
Figure 1. Map of the West Kalimantan Province (WKP) showing the retrieved Global Horizontal Irradiation data (GHI) from the World Bank Group [31,32]. The inset illustrates the relative position of WKP (in blue) in the Indonesian territory.
Sustainability 12 06283 g001
Figure 2. Technical and economic feasibility assessment of utility-scale PV plants in the West Kalimantan Province, with (a) showing the annual energy production per square kilometer of area and (b) the levelized cost of electricity.
Sustainability 12 06283 g002
Figure 3. Map depicting the geographical location of the three selected ideal sites in the WKP. The infrastructural information, such as major roads, the main power grid, power substations, and major cities, is used for the preliminarily assessment of feasible sites.
Sustainability 12 06283 g003
Figure 4. Map of electricity cost and land usage of selected sites for solar PV plant development.
Sustainability 12 06283 g004
Table 1. Estimated annual energy production of solar PV plants in West Kalimantan Province.
No.Level of Annual Energy [GWh/km2]Average of Annual Energy [GWh/km2]Exploitable Area [km2]Percentage of Area [%]Total of Annual Energy [GWh]
1153.79–180.42167.1018433.70307,975
2180.43–184.83182.63928018.611,694,806
3184.84–188.50186.6713,97228.022,608,153
4188.51–191.99190.2514,51429.112,761,289
5192.00–200.62196.3110,25020.562,012,178
Total49,859100.009,384,400
Table 2. Estimated electricity cost of solar PV plants in West Kalimantan Province.
No.Level of Electricity Cost [Cent USD/kWh]Average of Electricity Cost [Cent USD/kWh]Exploitable Area [km2]Percentage of Area [%]
14.47–4.684.575974919.55
24.69–4.784.73514,84829.78
34.79–4.864.825962219.30
44.87–4.964.91512,14924.37
54.97–5.465.21534917.00
Total49,859100.00
Table 3. Technical information about the potential sites for solar PV plants.
NoTechnical ParameterMempawahNgabangTayan
1Average solar irradiation [kWh/m2/day]4.854.834.84
2Available area [ha]120023003100
3Average annual energy generation [GWh/km2]196.25195.25195.50
4Total annual energy generation [GWh]235,500449,075606,050
5Estimated total power capacity [GW]26.8851.2669.18
6Elevation [meter]52530
7Slope [%]<2<5<5
8Distance from substation [km]2.854.360.18
9Distance from main road [km]0.681.270.25
10Distance from nearest city [km]0.91.6657
11Distance from Pontianak city [km]588080

