Planning and Managing the Integrated Water System: A Spatial Decision Support System to Analyze the Infrastructure Performances


Abstract
:1. Introduction
- Accessibility—Everybody needs fresh water;
- Affordability—Reasonable price for water;
- Environmental sustainability—Reasonable use of water;
- Efficiency of the infrastructure—Good service for a reasonable price of drinking water;
- Environmental Protection—Wastewater treatment mandatory for the protection of the ecosystems;
- Public health—Disposal and treatment of sewage for all urbanized areas.
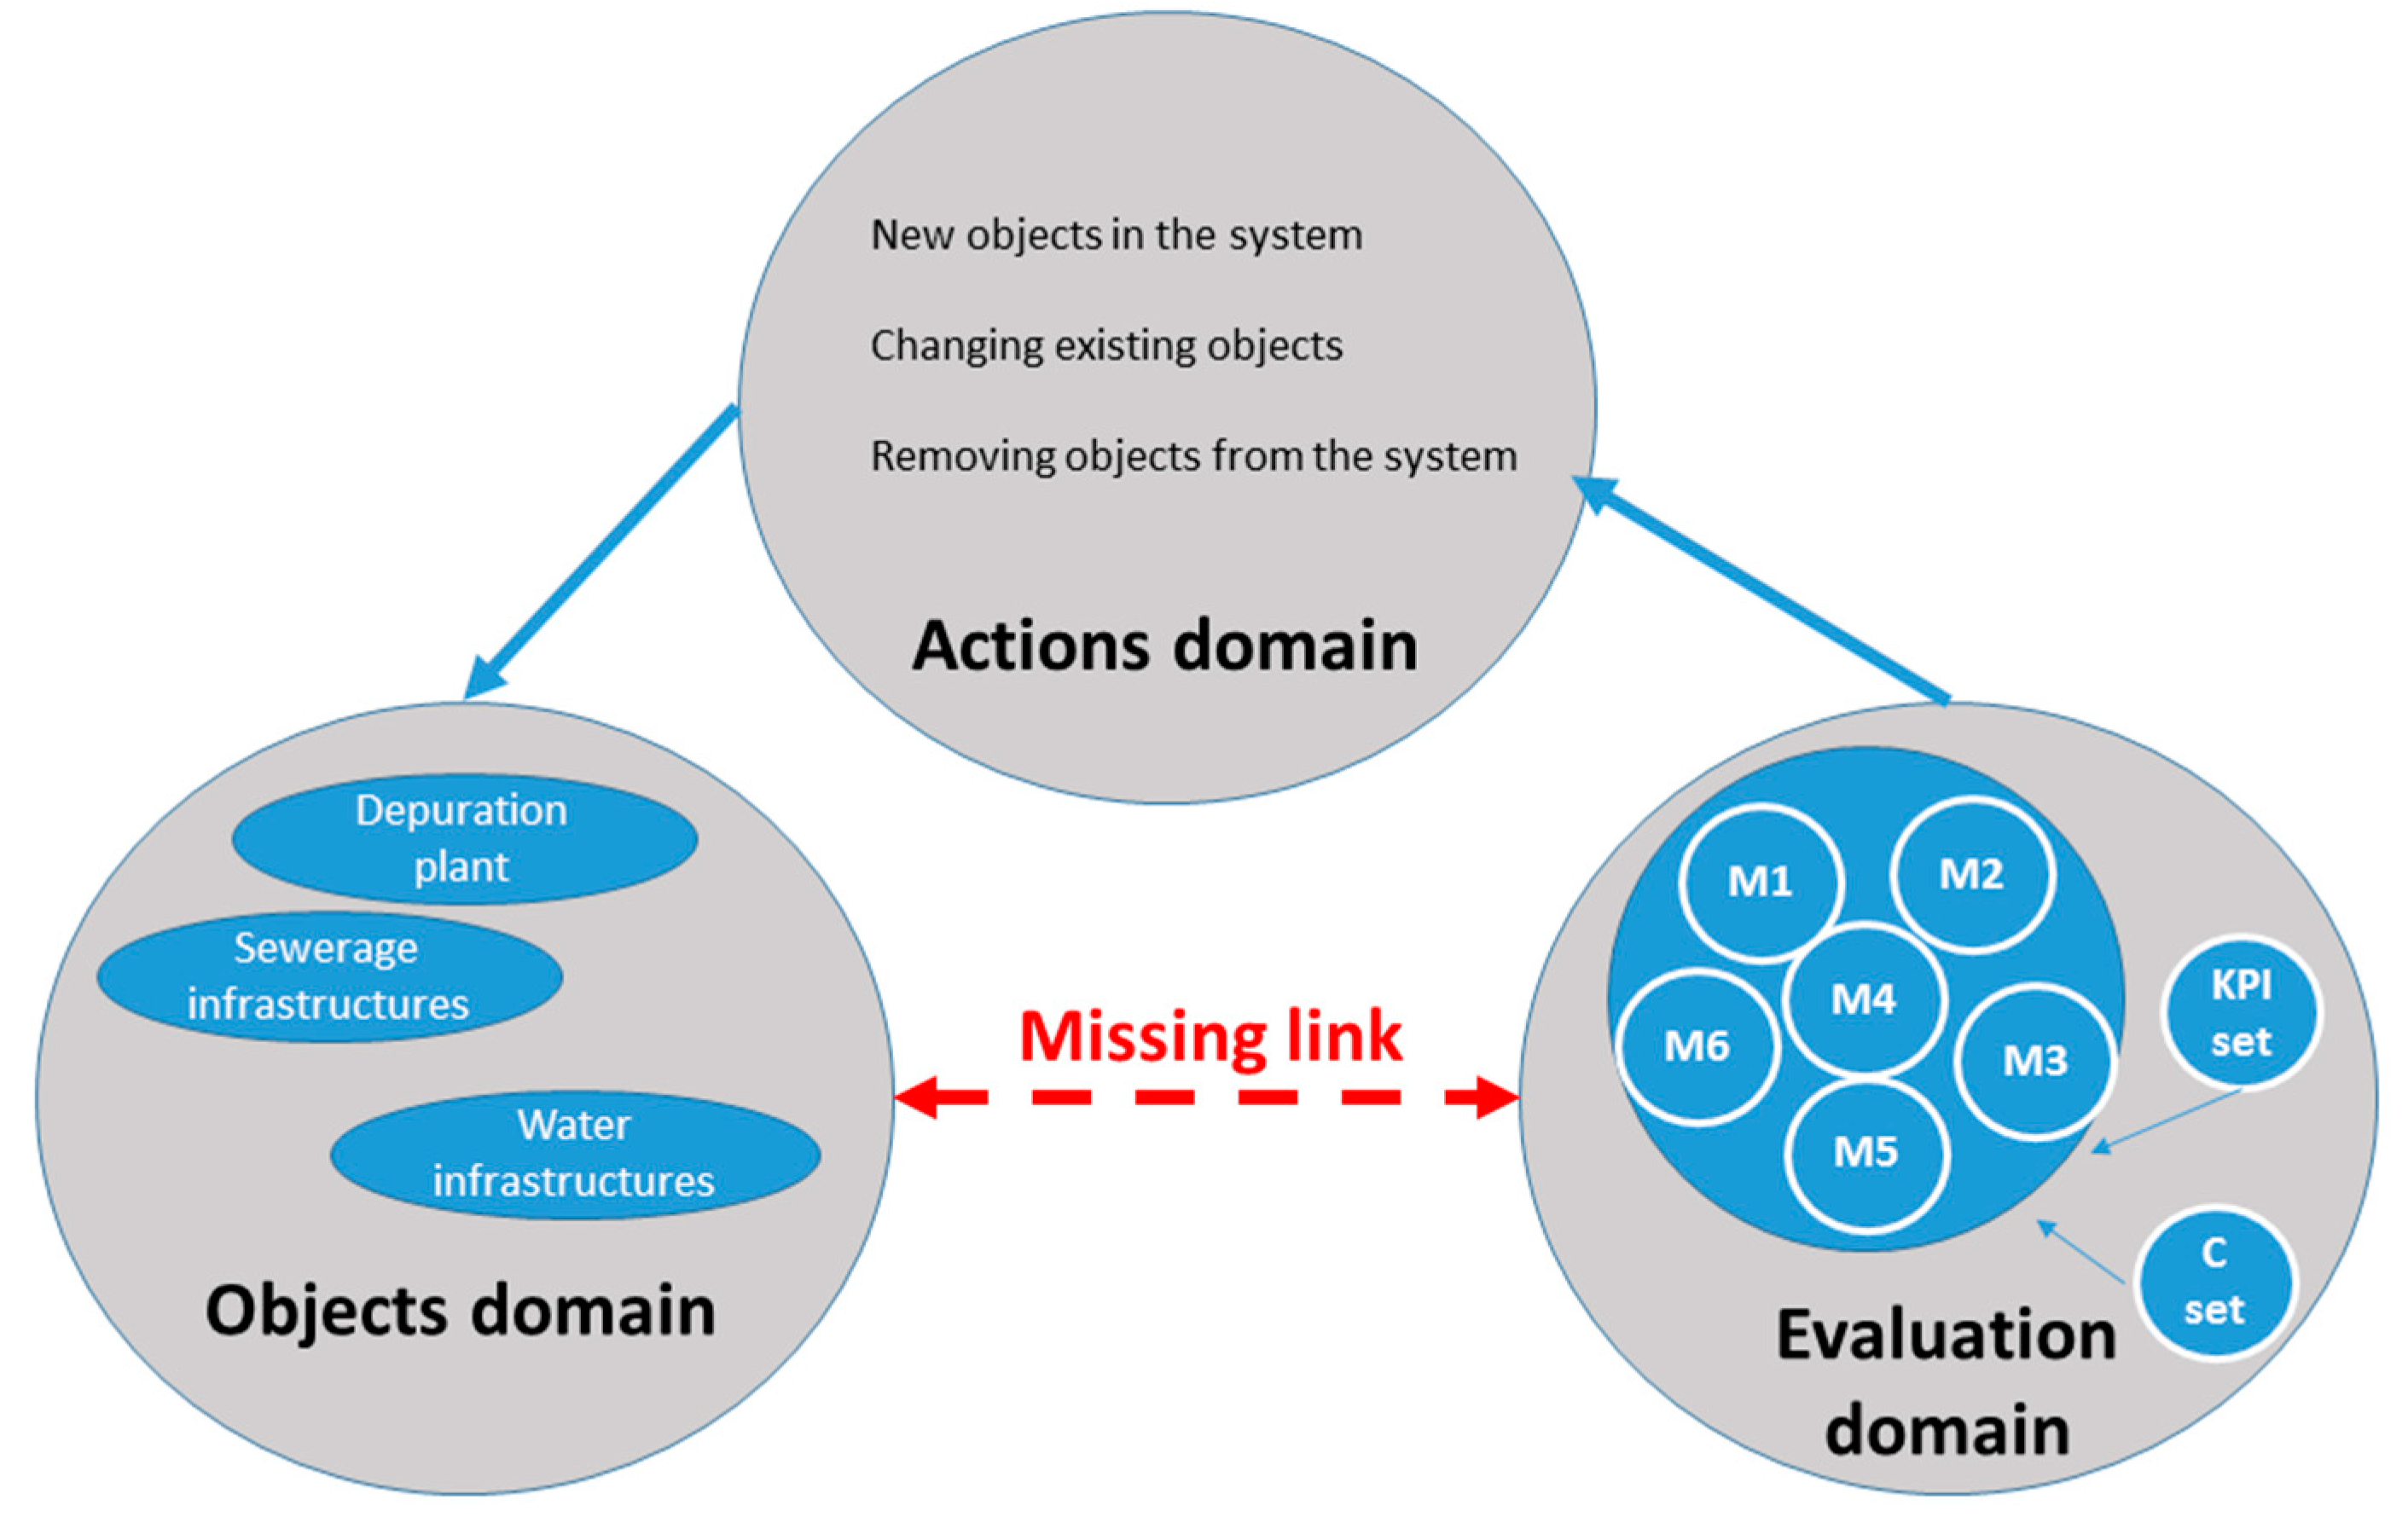
1.1. Evaluating Performances of IWS Planning Actions
1.2. Aims and Scope
2. Materials and Methods
2.1. Regulation of the IWS Technical Quality
- prerequisites—the necessary conditions for the admission to the incentive mechanism associated with the general standards;
- specific standards—performance parameters to be guaranteed for services provided to individual users where the noncompliance requires automatic indemnities;
- general standards—these parameters are broken down into macro-indicators and simple indicators, both describing technical conditions to provide a service by an incentive mechanism.
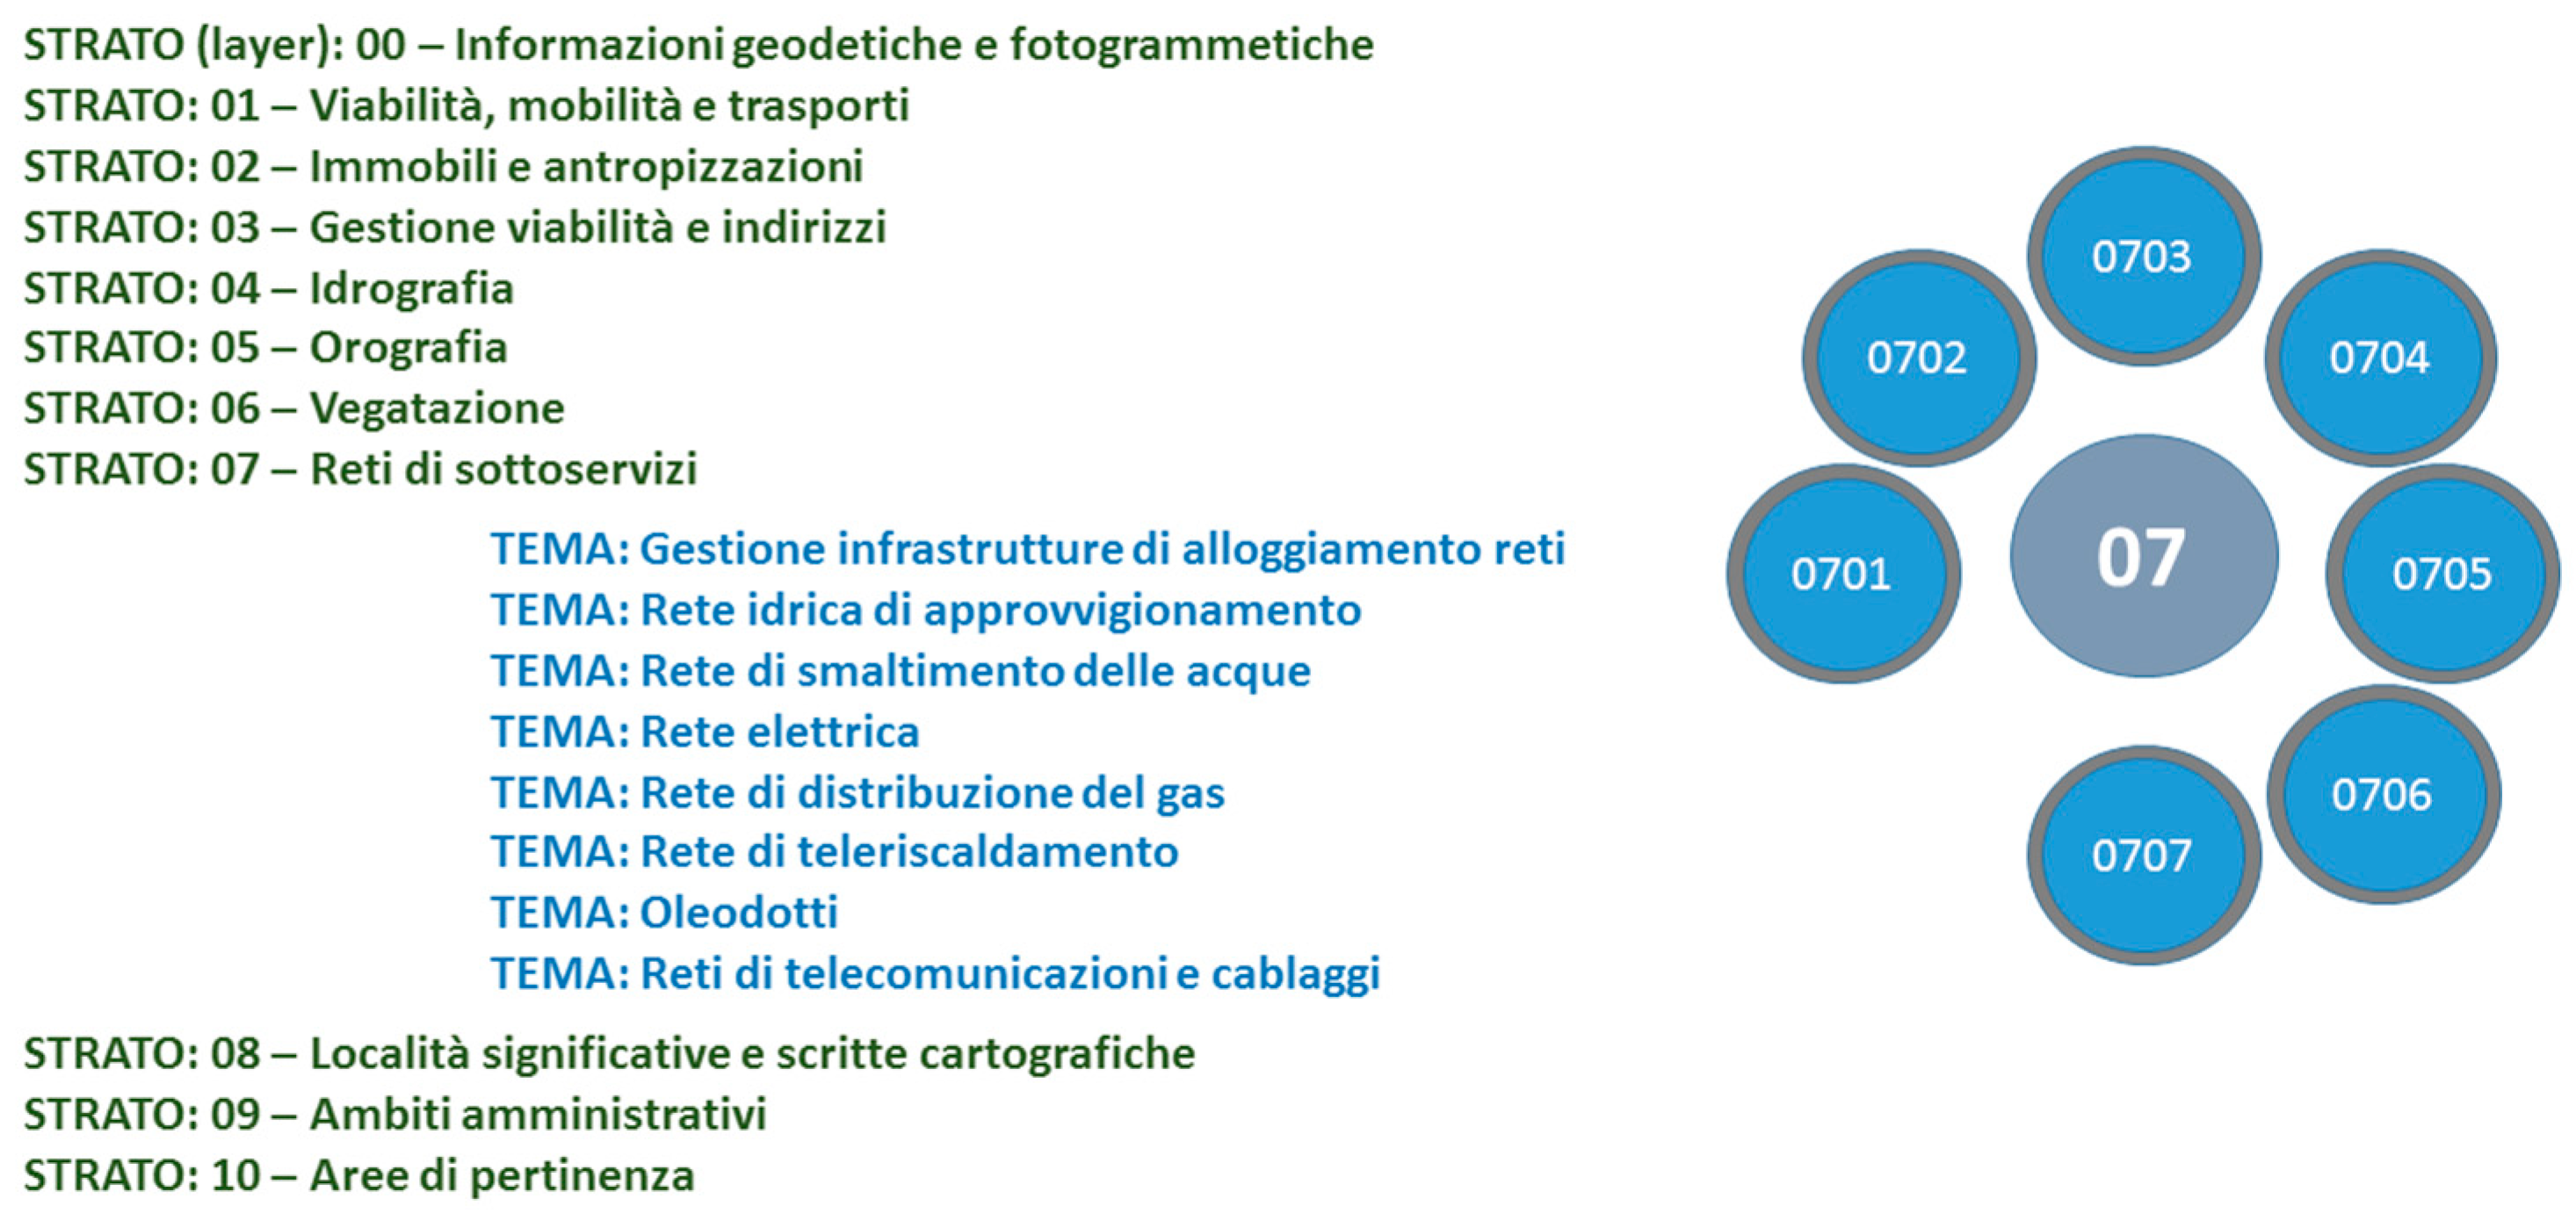
2.2. National Federated Infrastructure Information Service
2.3. Spatial Decision Support Systems
2.4. The GeoTOPSIS Multi-Criteria Technique
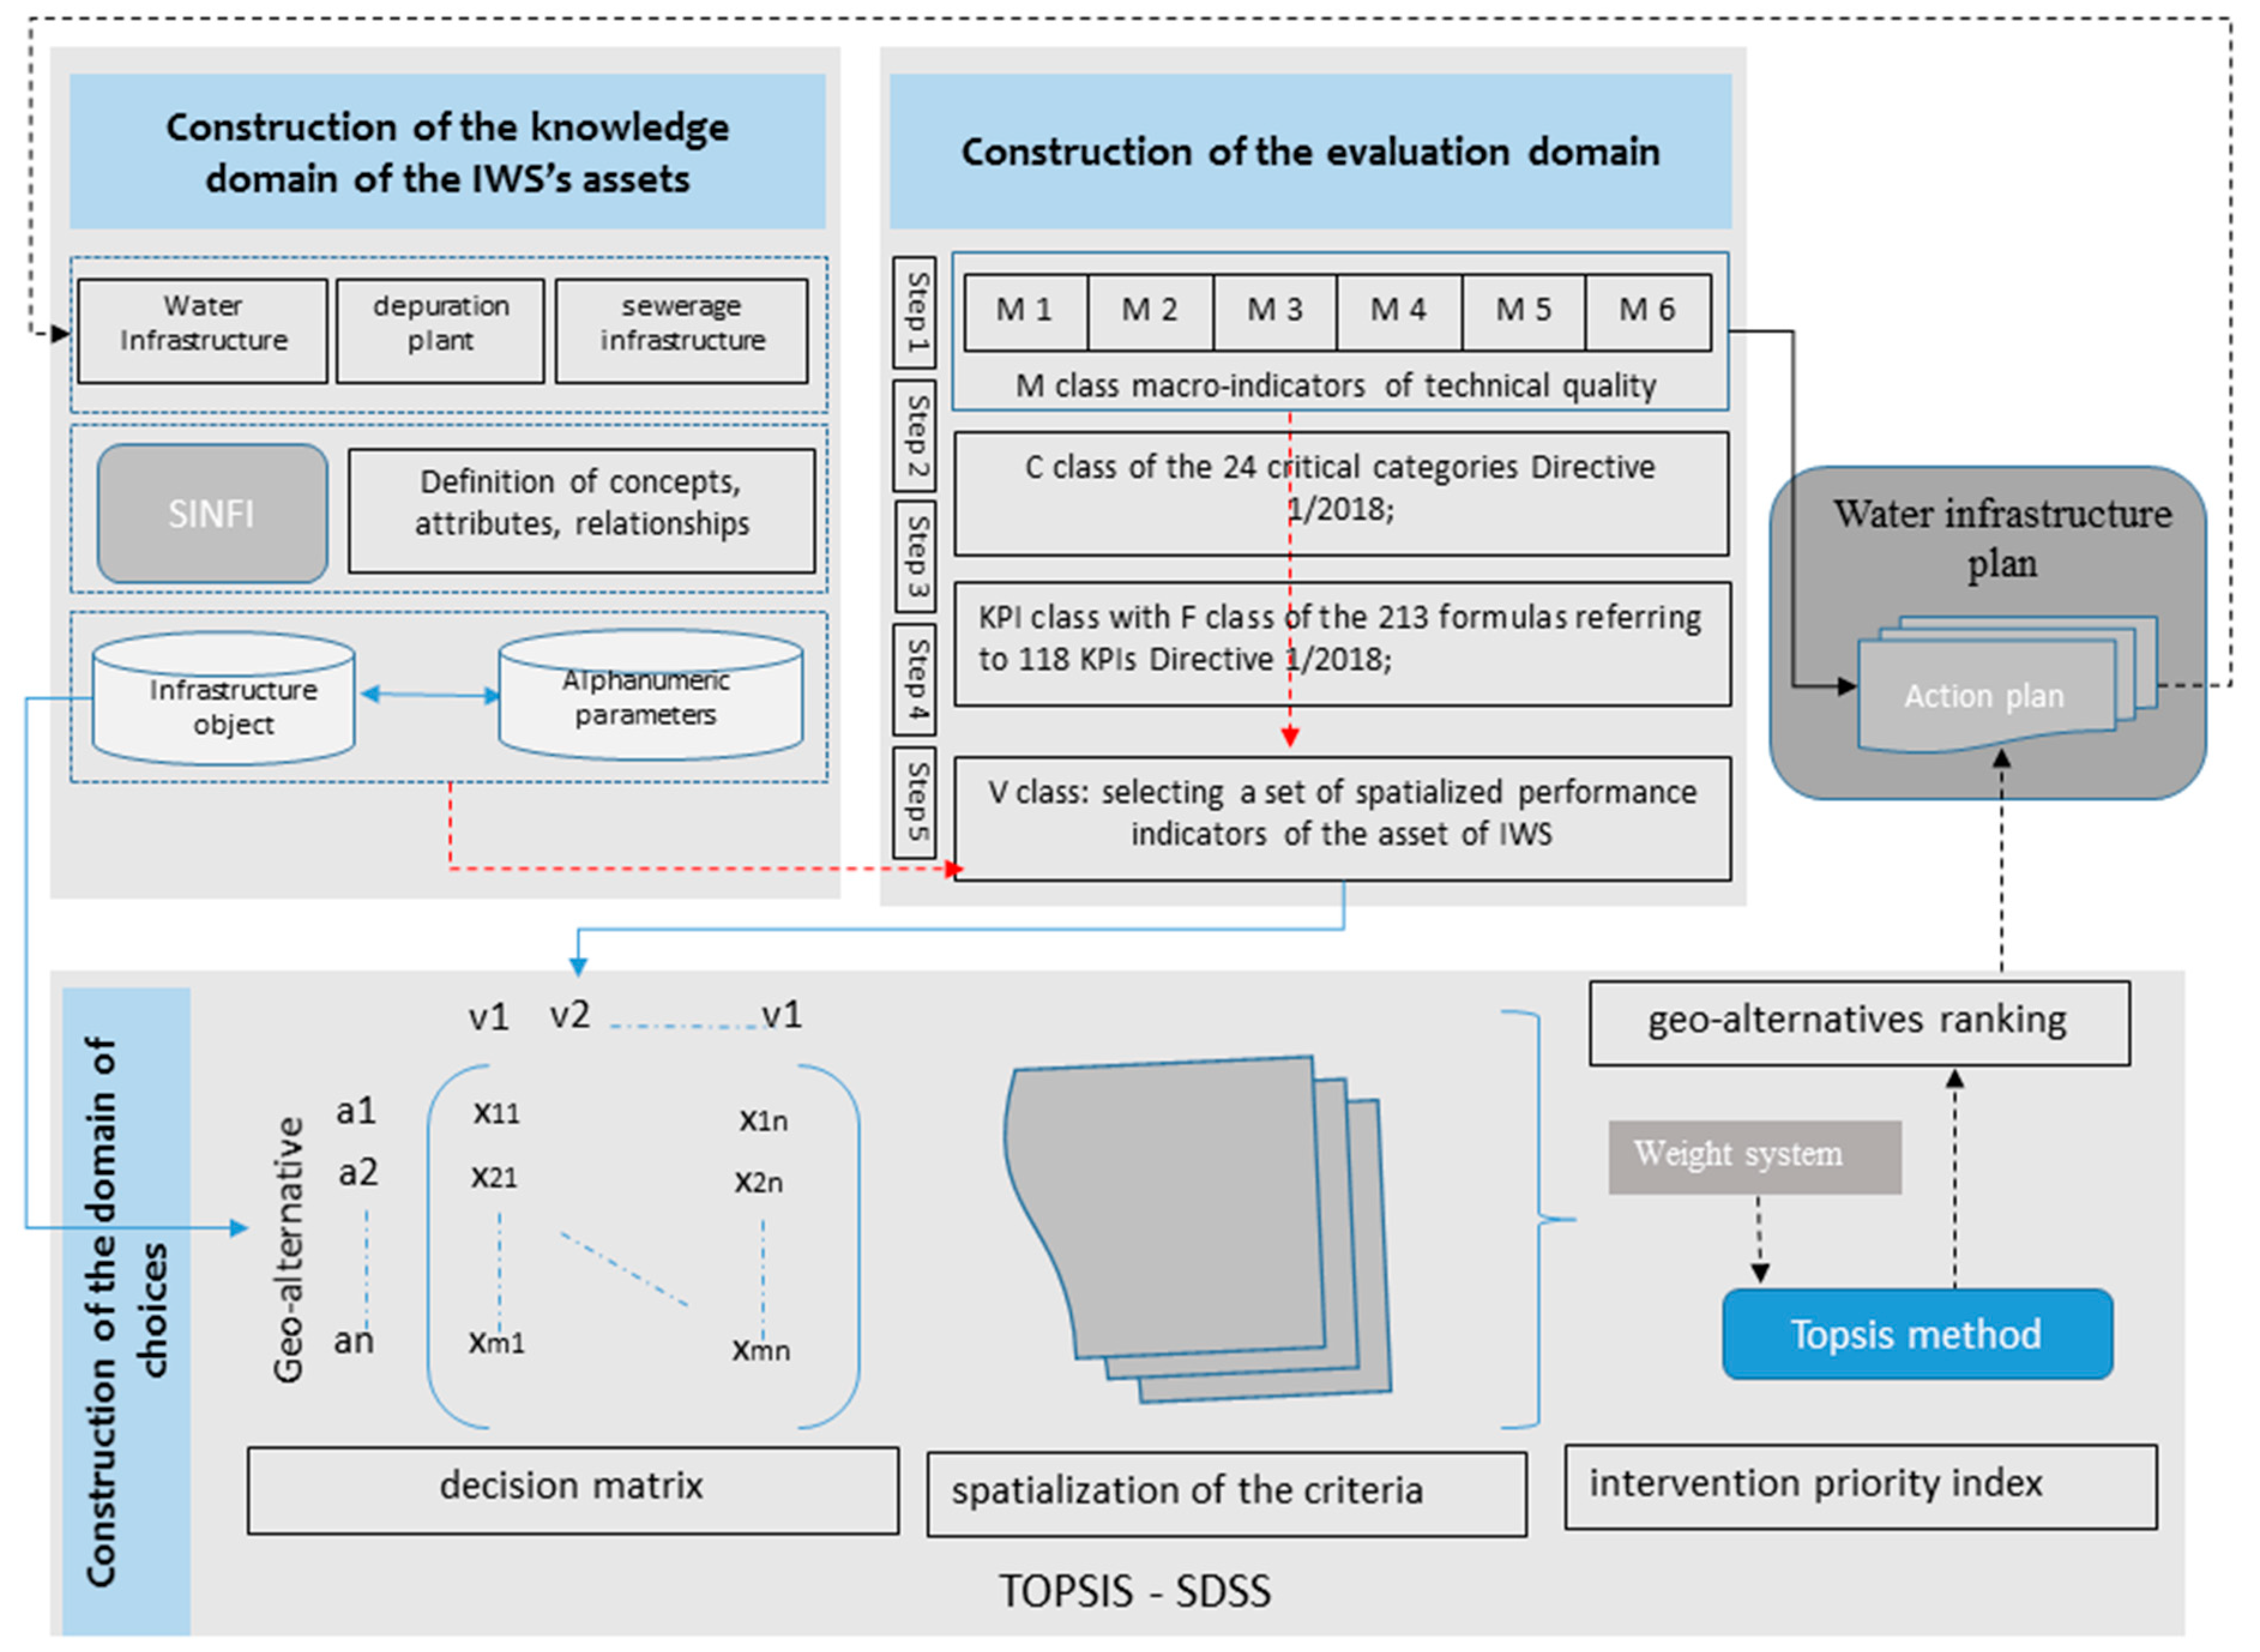
3. The Methodology for Designing a SDSS
- macro-phase 1: construction of the knowledge domain;
- macro-phase 2: construction of the evaluation domain through the selection of a set of decision criteria measured by spatialized performances;
- macro-phase 3: construction of the domain of choices by mapping critical issues and selection of investment priorities.
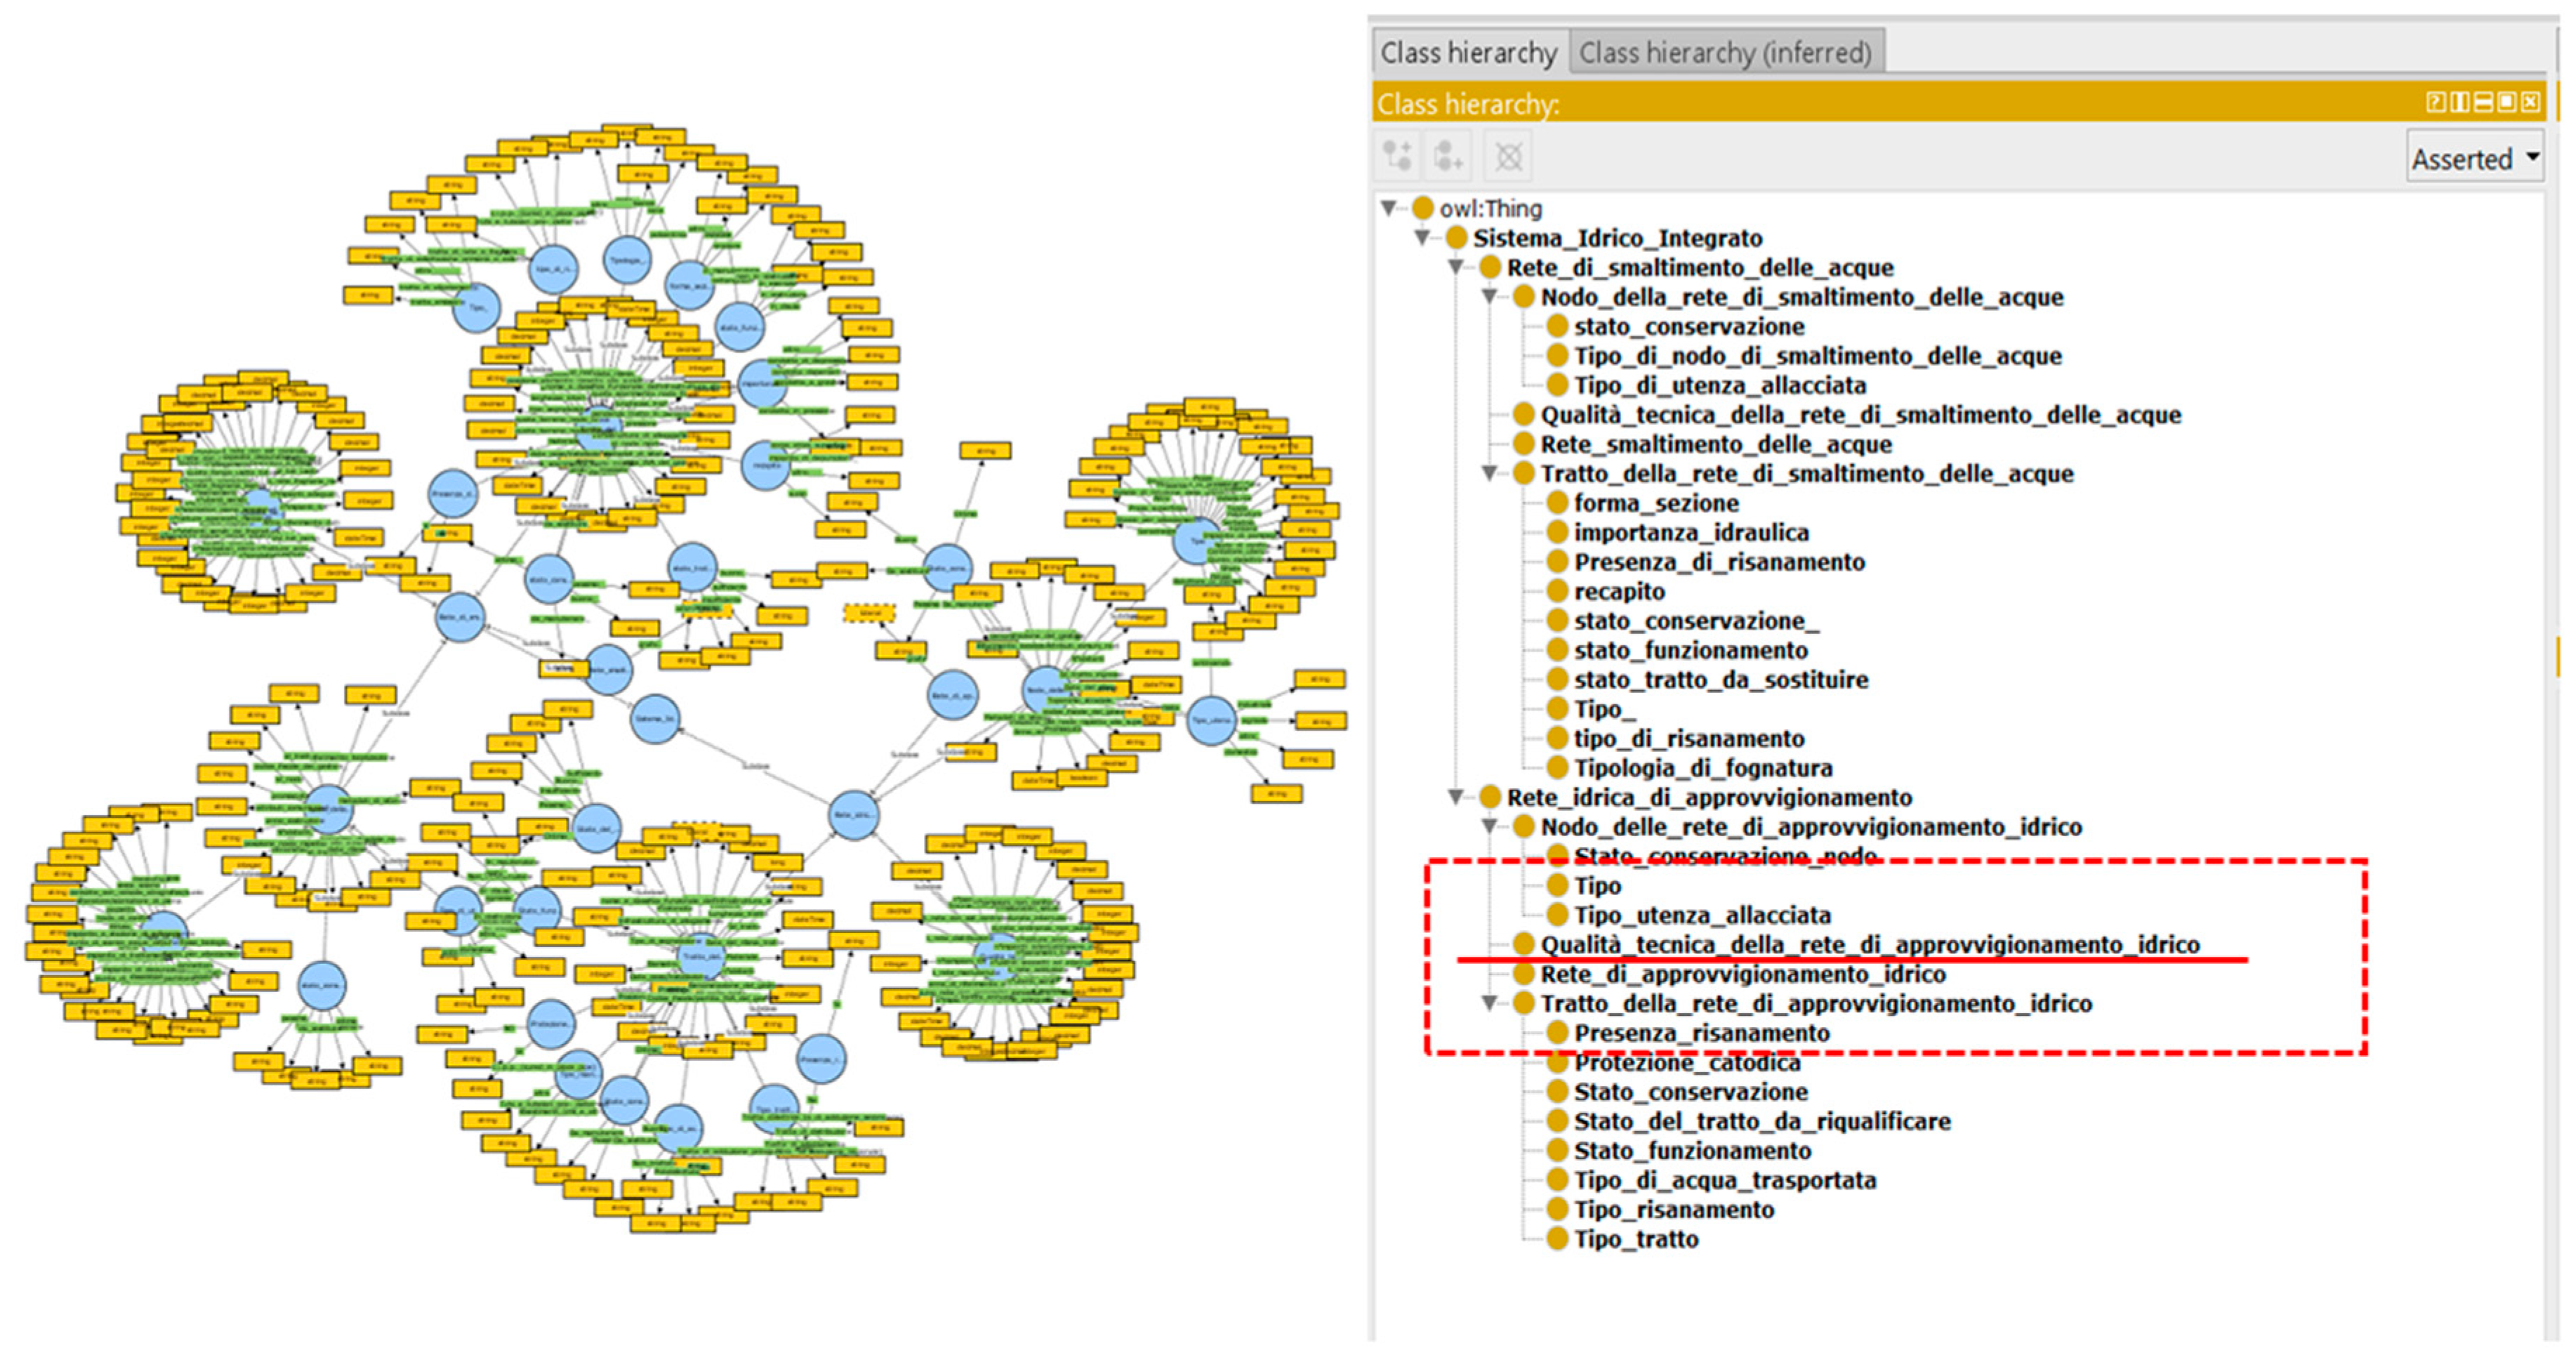
3.1. Macro-Phase 1
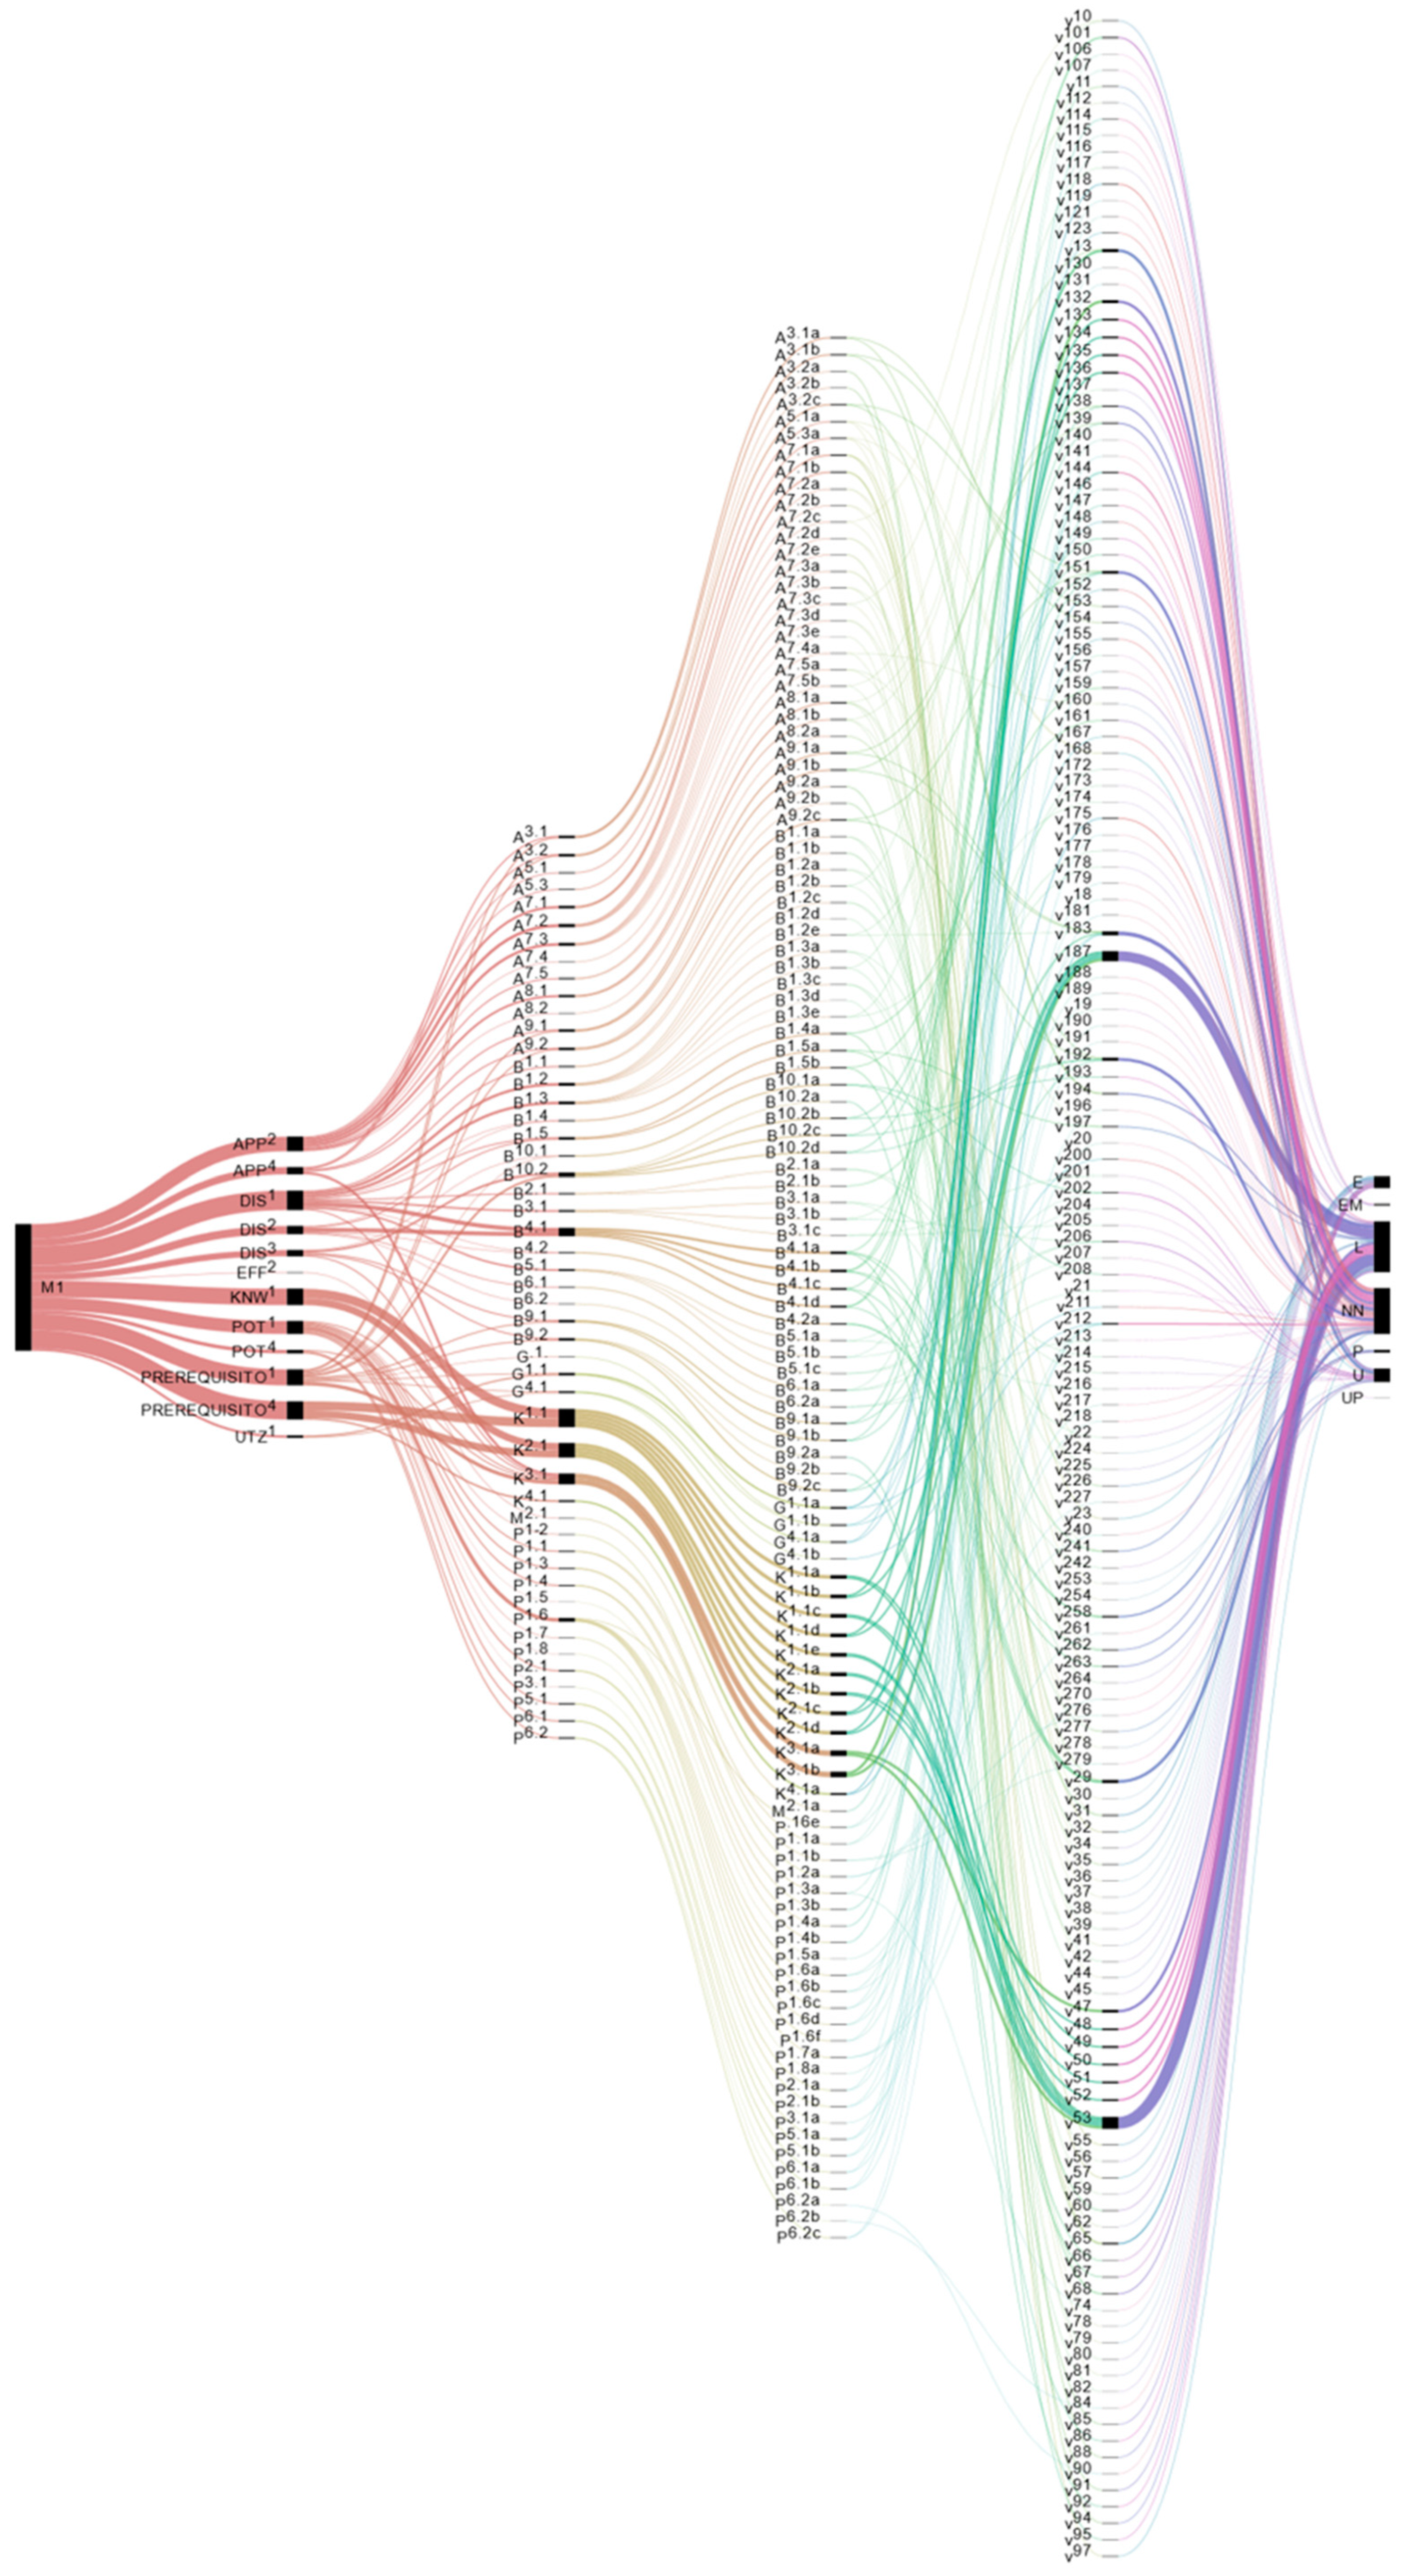
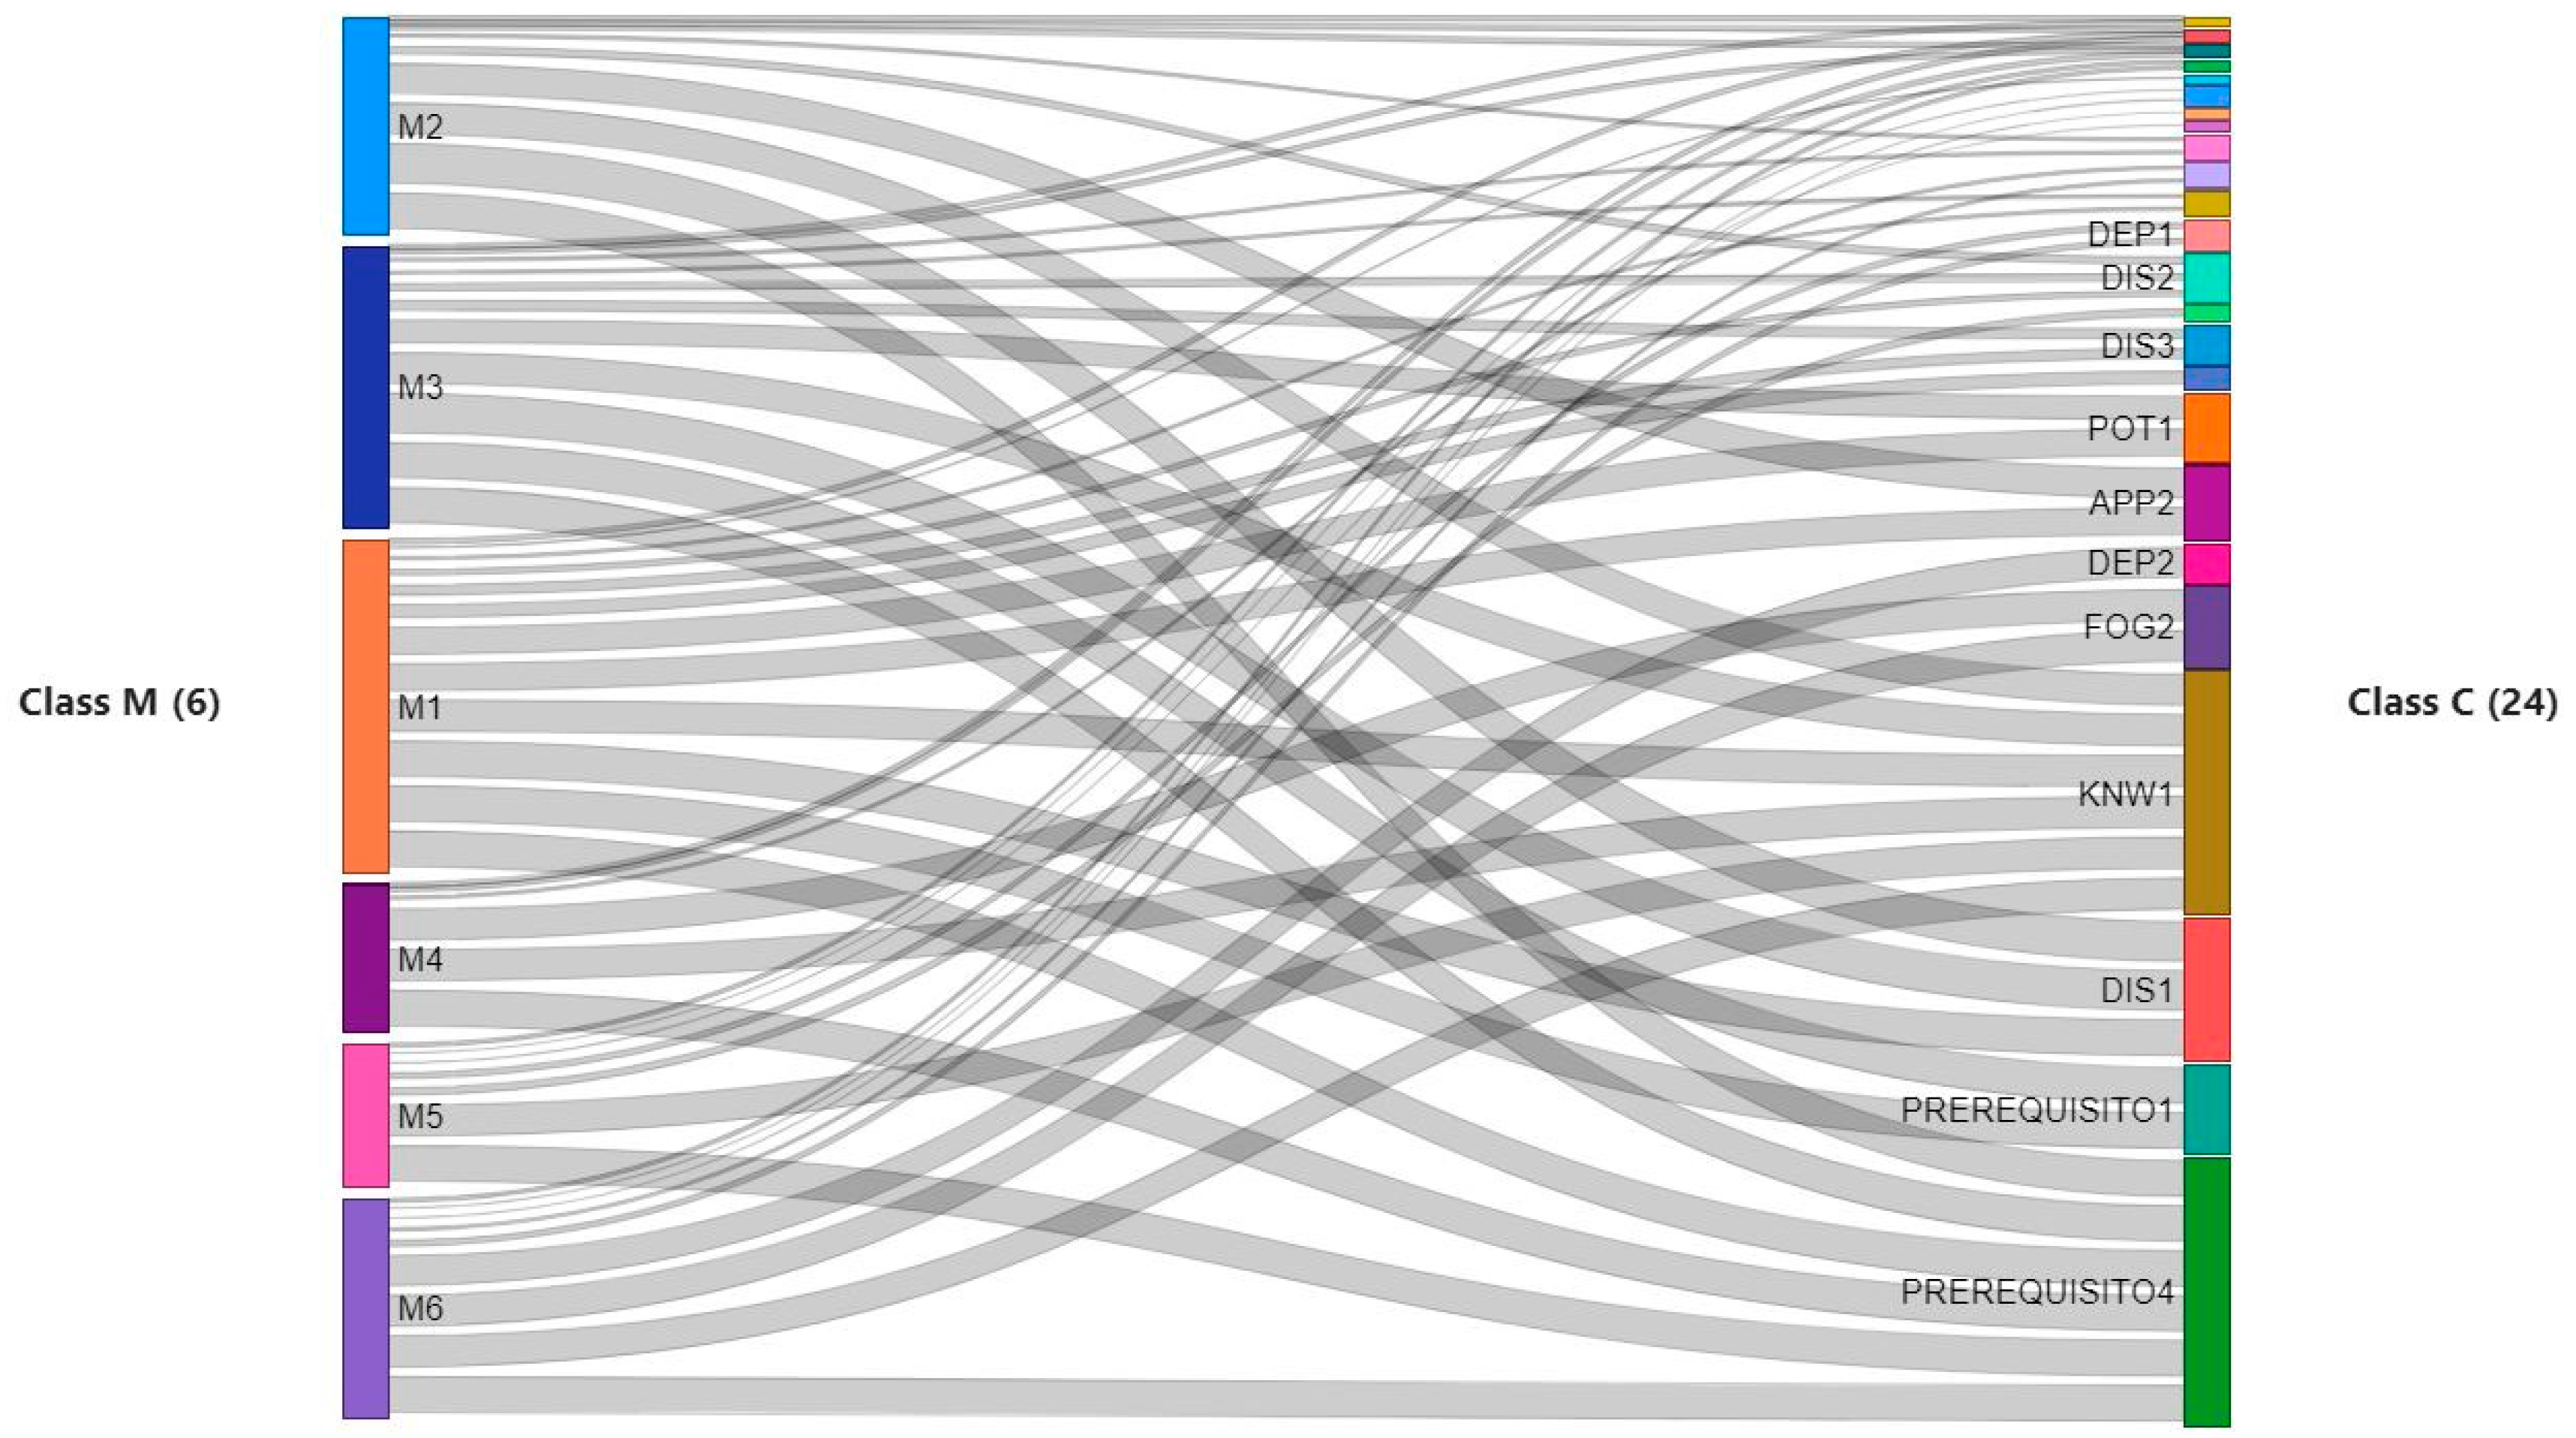
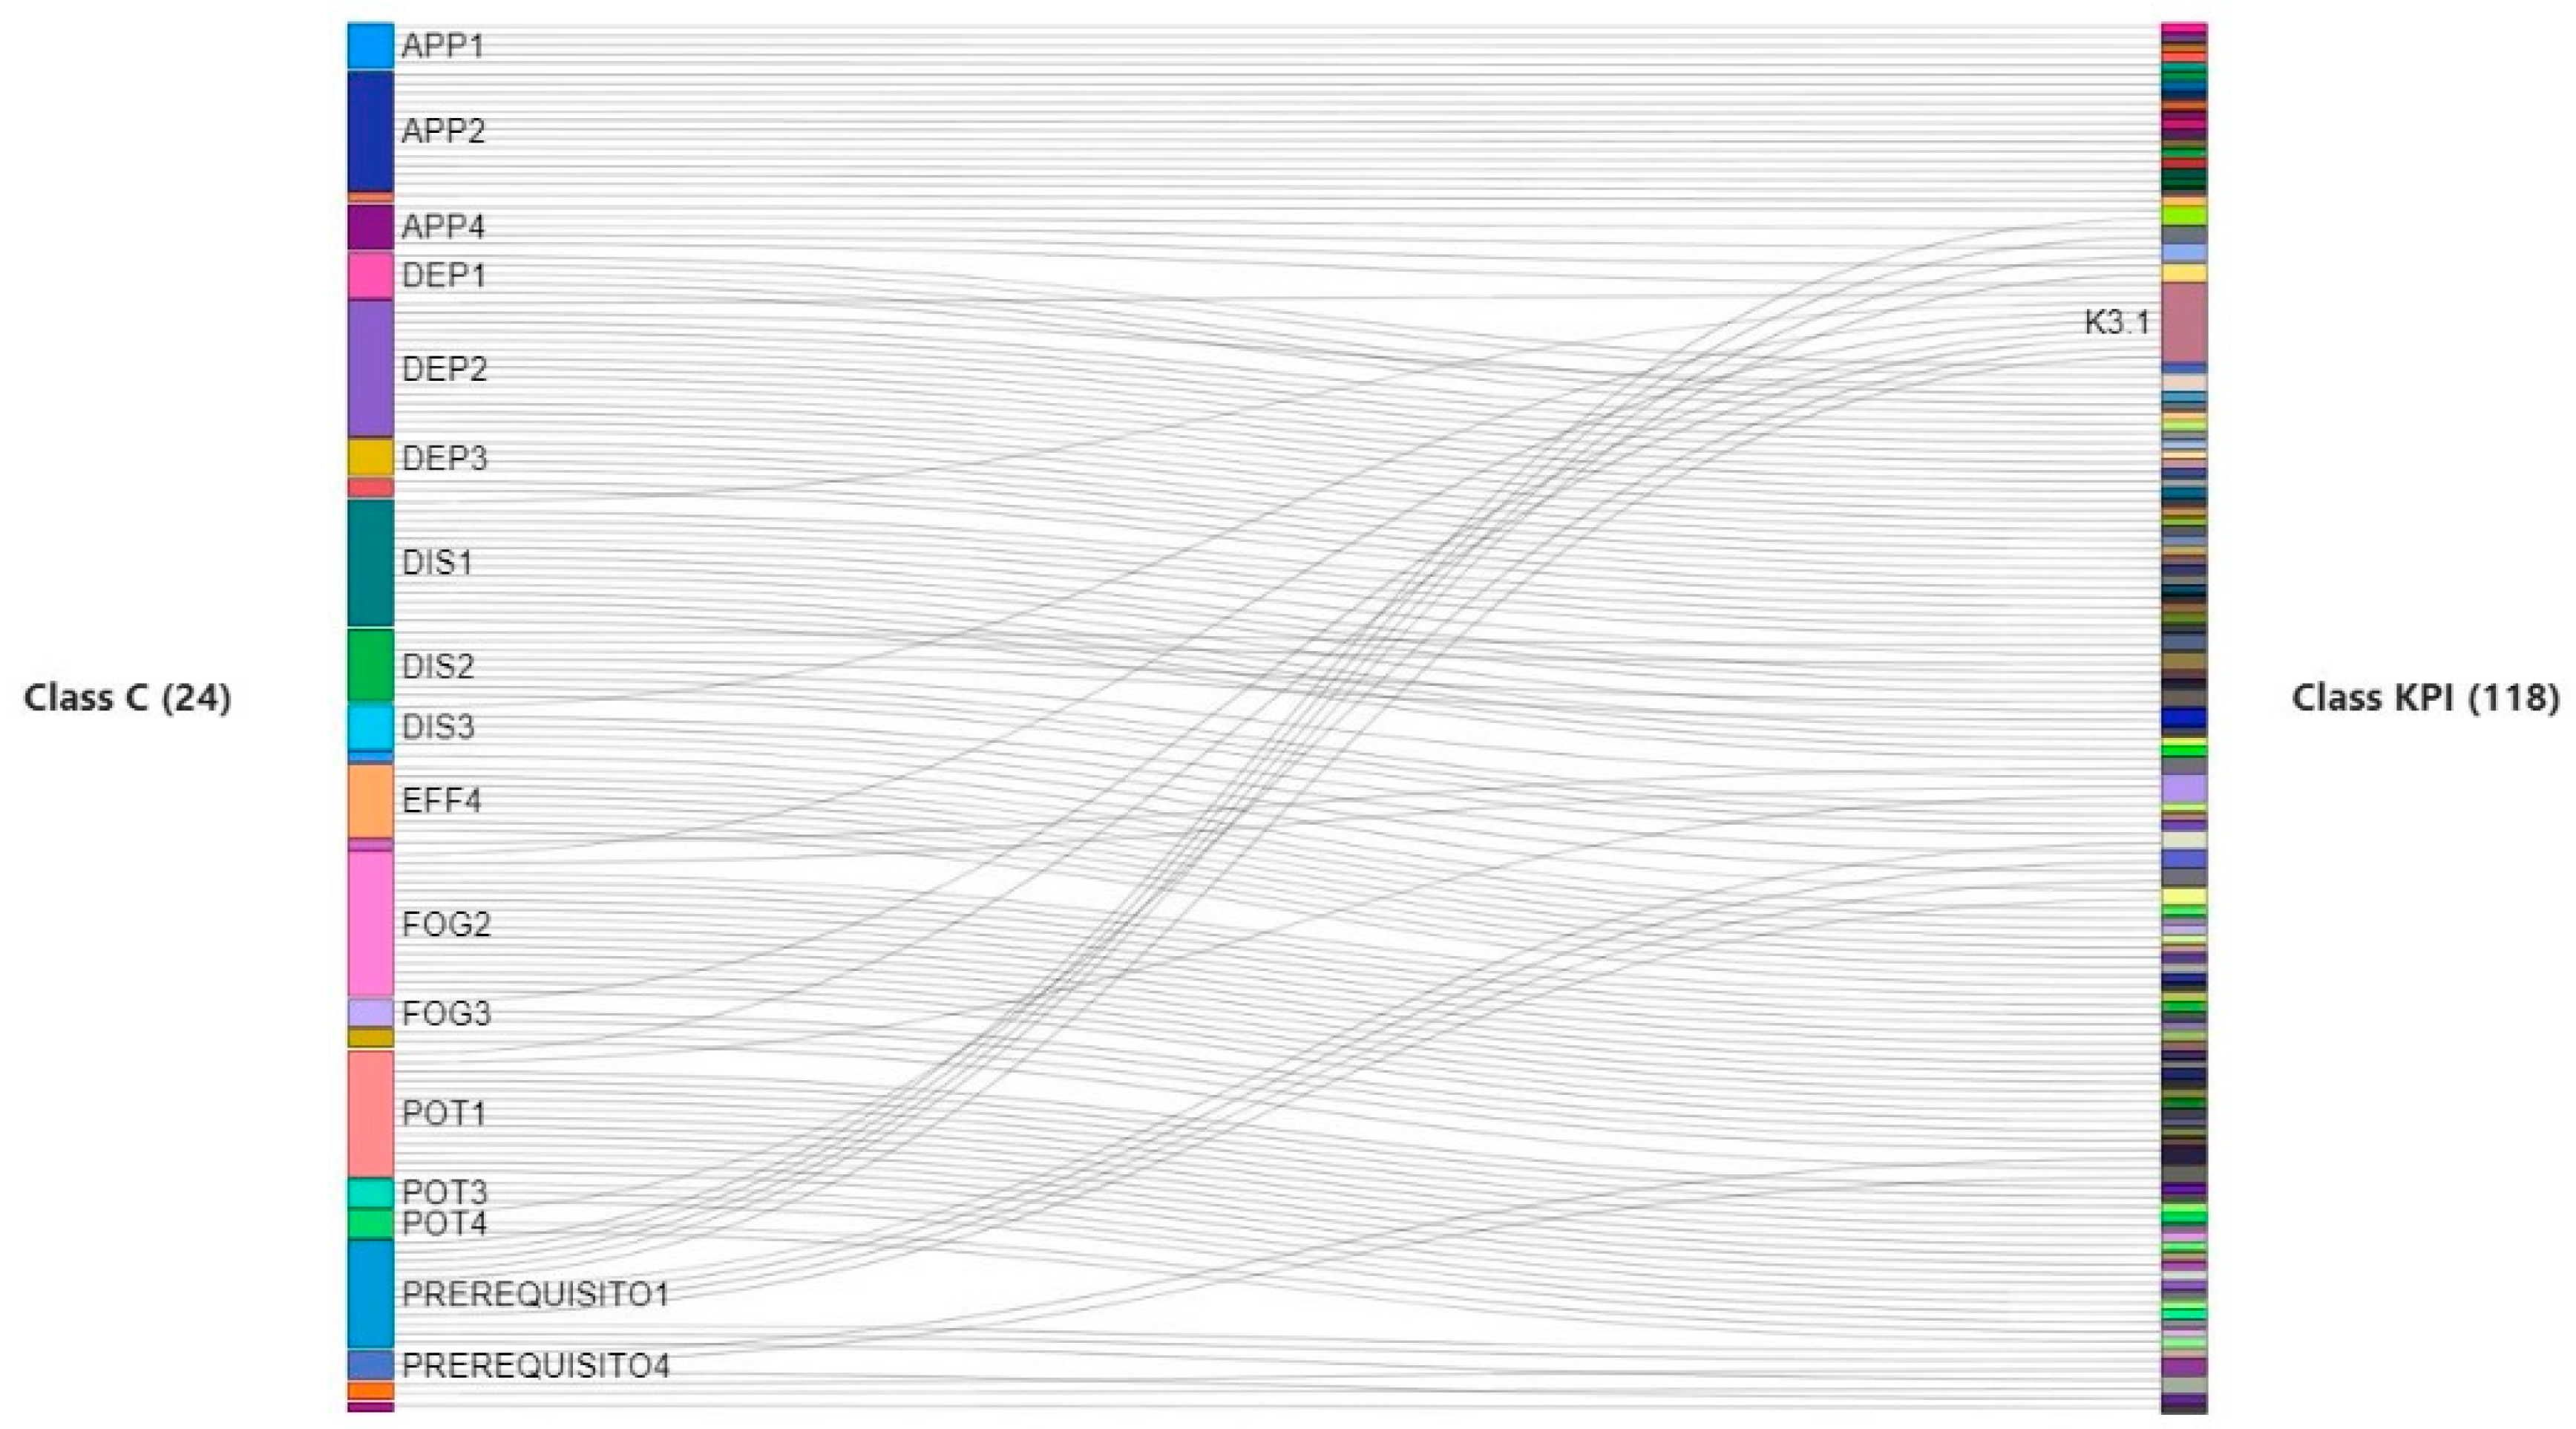
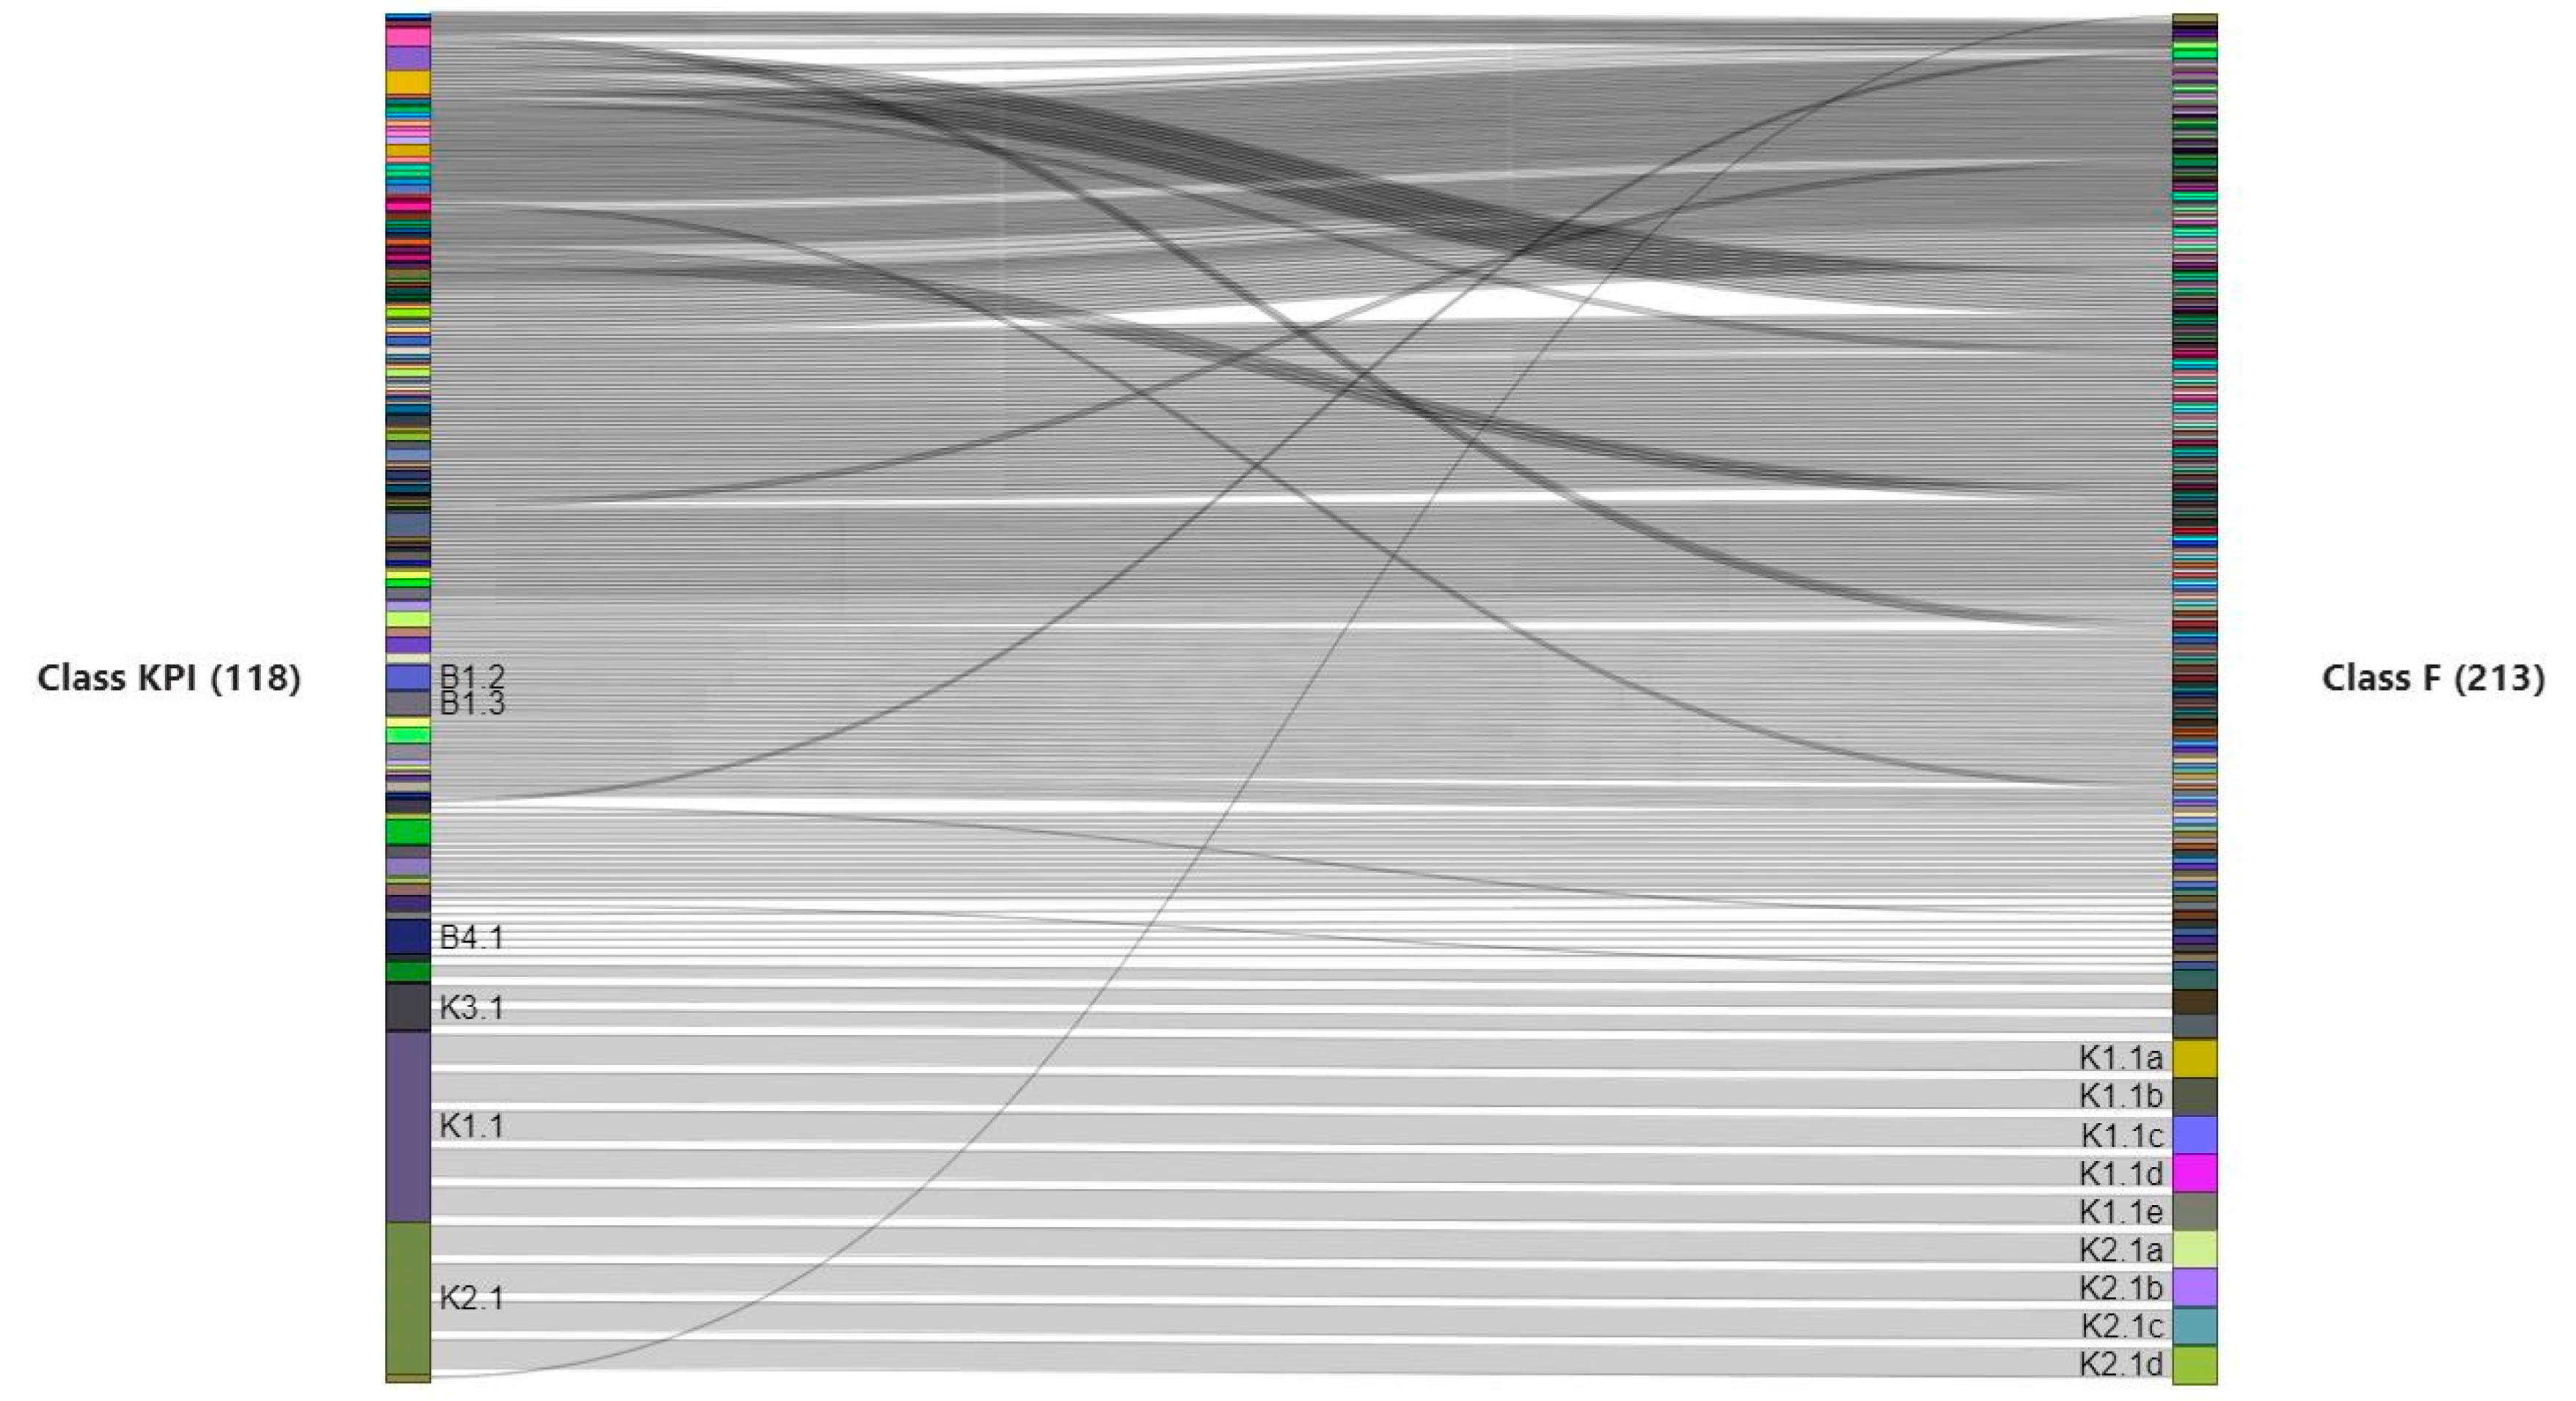
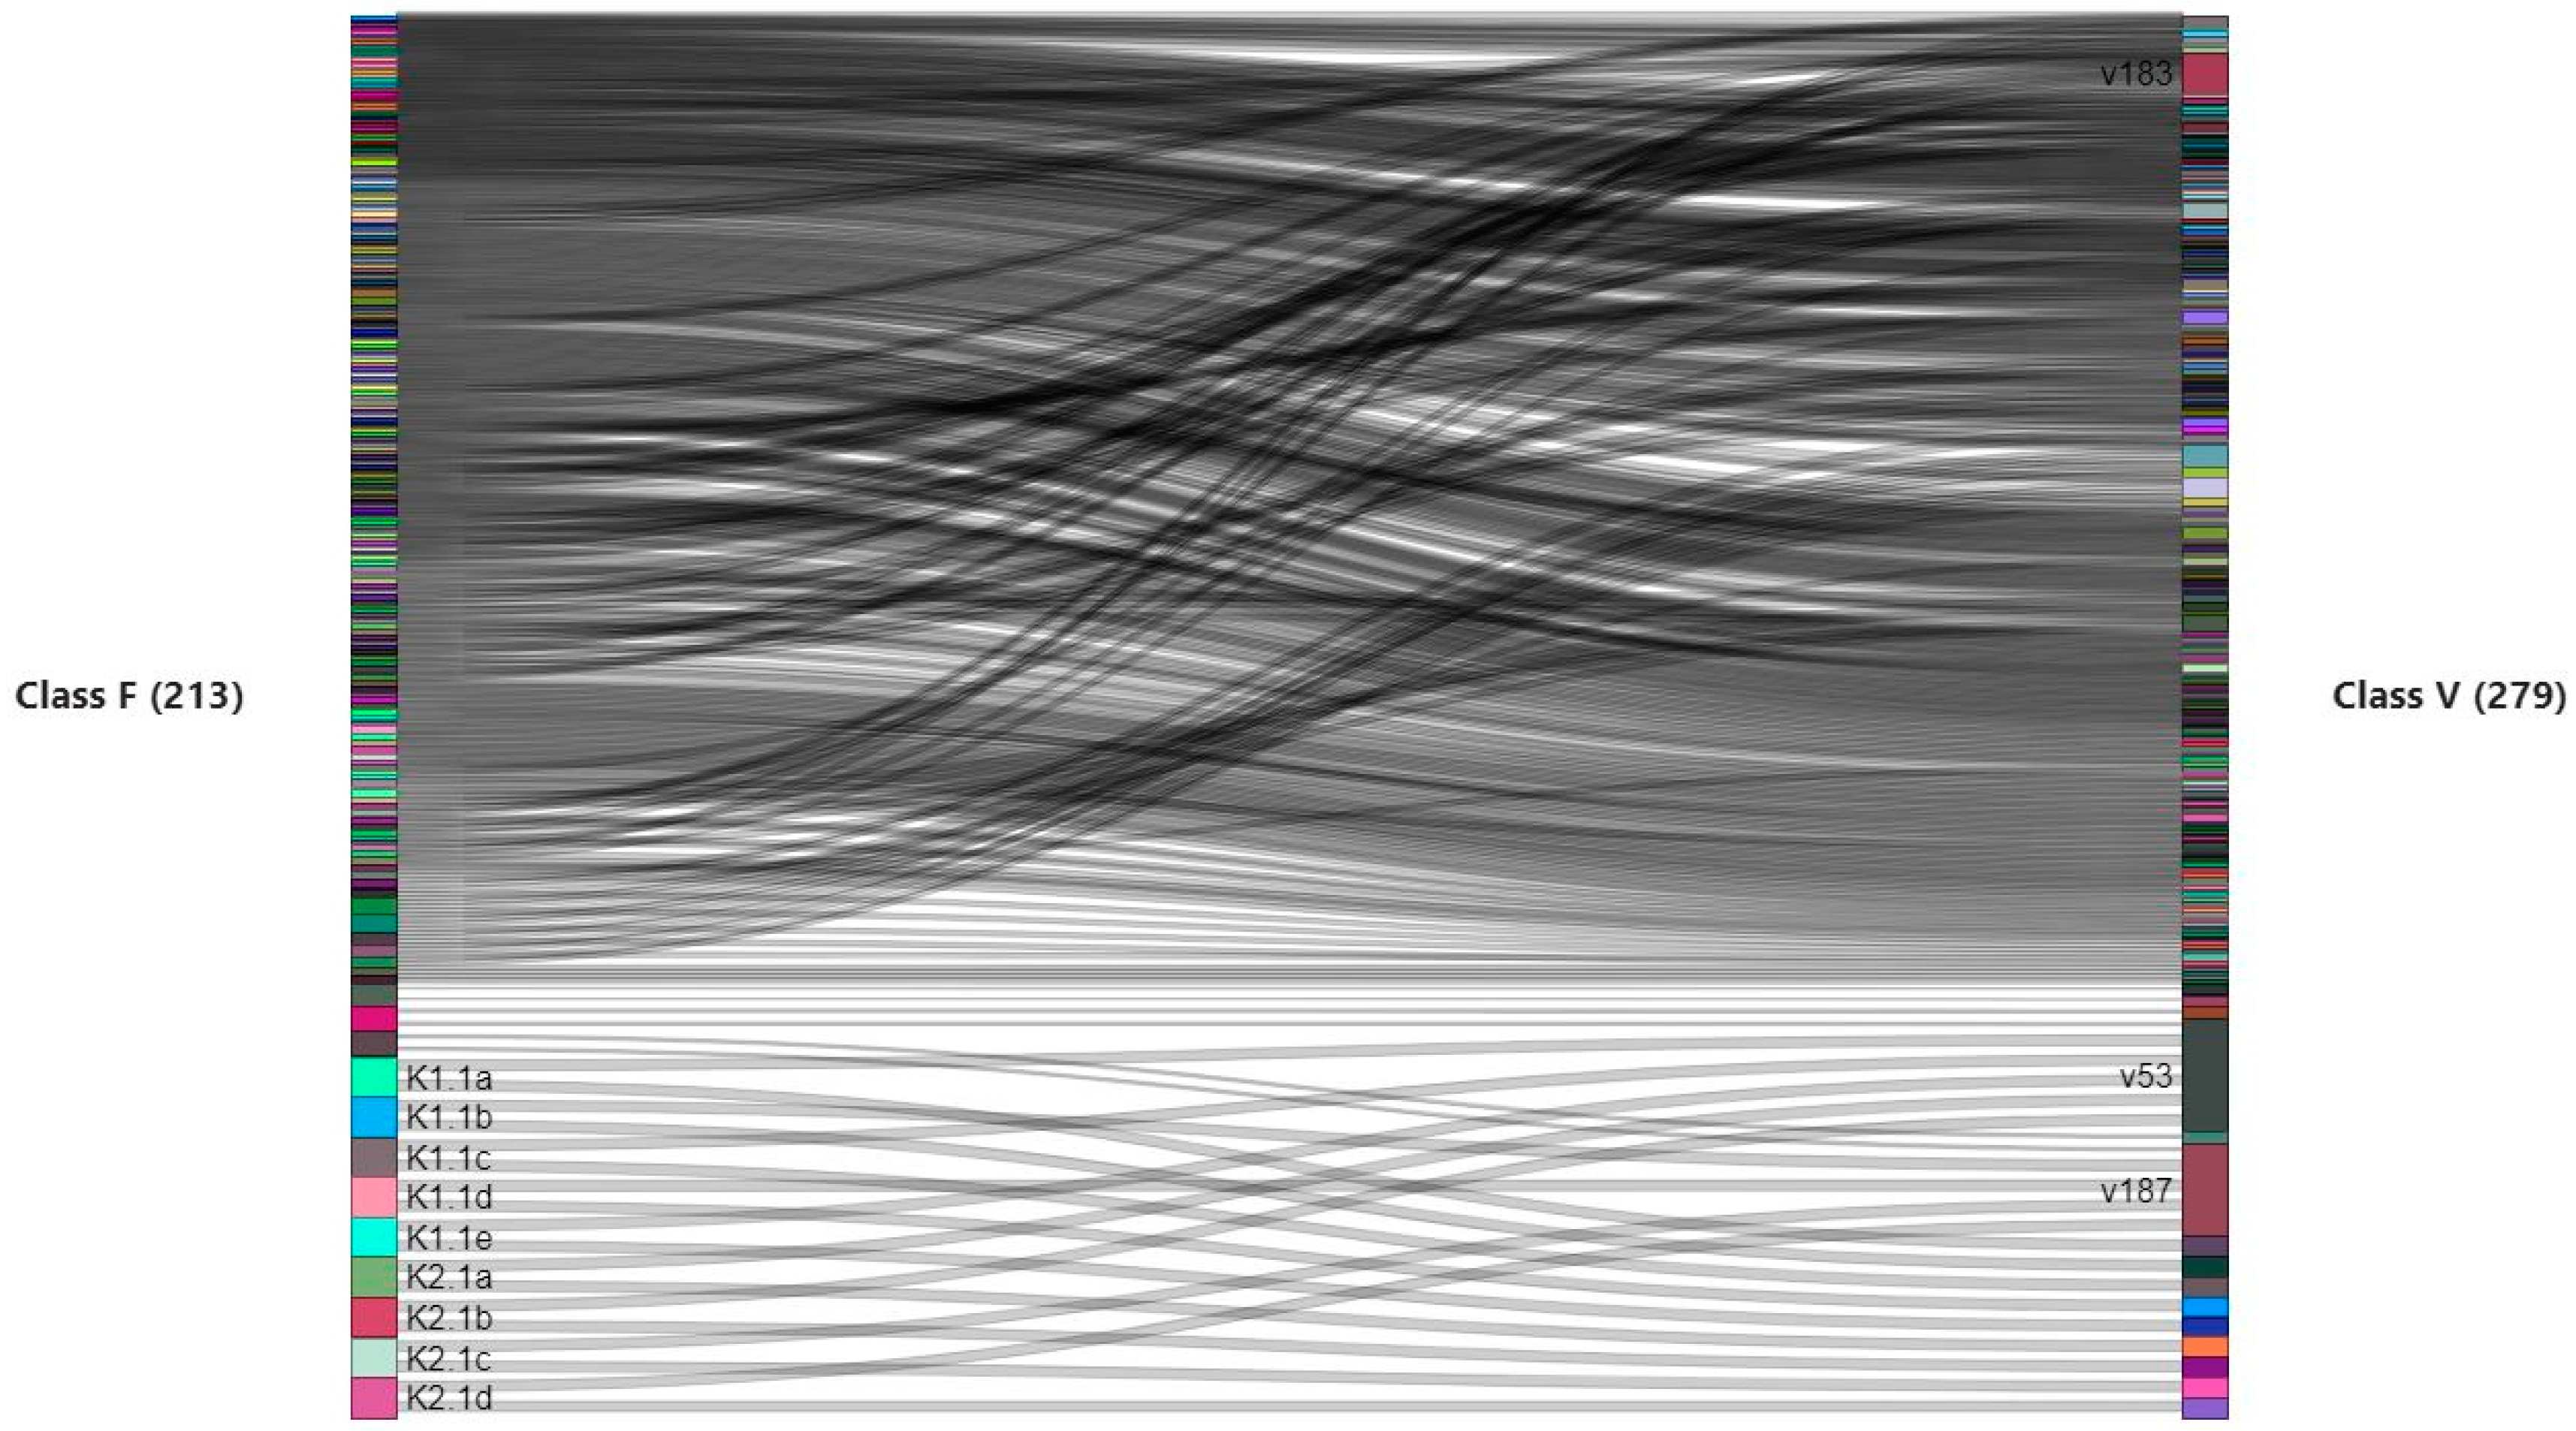
3.2. Macro-Phase 2
- the representation of the relations between the M class of the technical quality macro-indicators and the C class of the critical categories catalogued in Annex 4 of Directive 1/2018 [15];
- the representation of the relations between the previous C class and the KPIs detailed in Directive 2/2016 [14];
- the representation of the relations between the KPI class and the F class of the n-formulas referring to the same KPIs;
- the representation of the relations between the F class and the V class of the variables belonging to the same formulas;
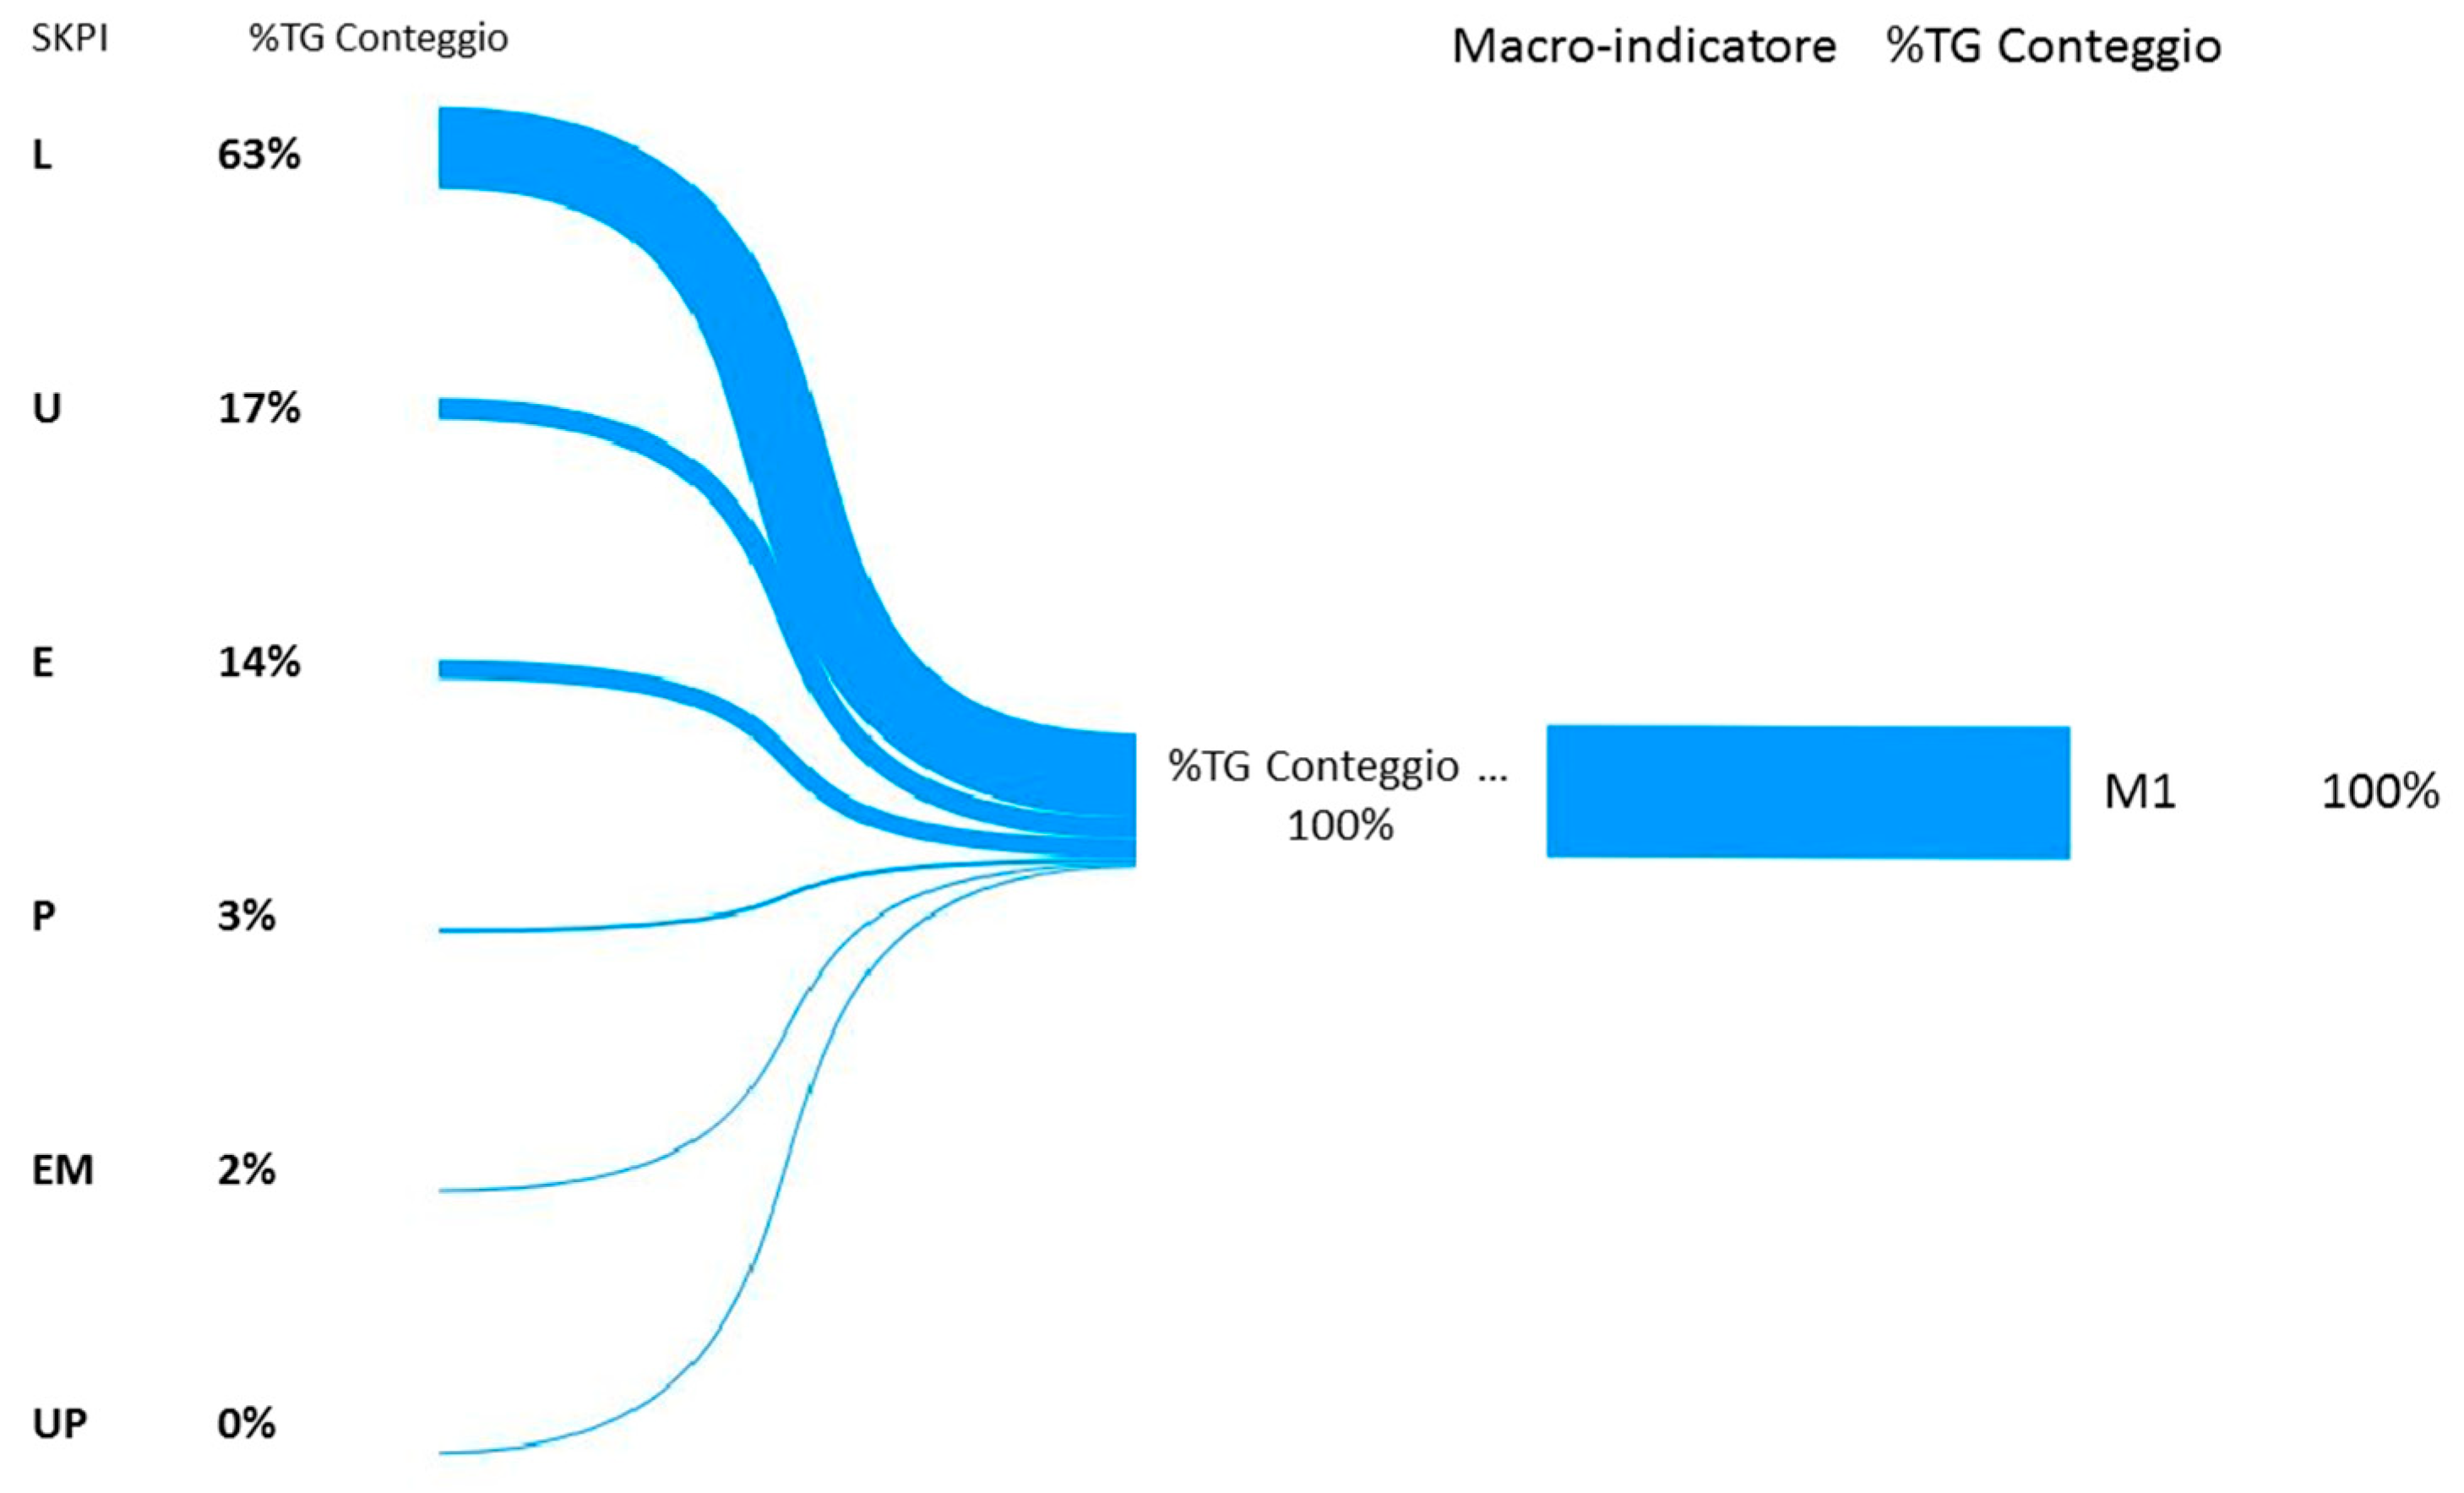
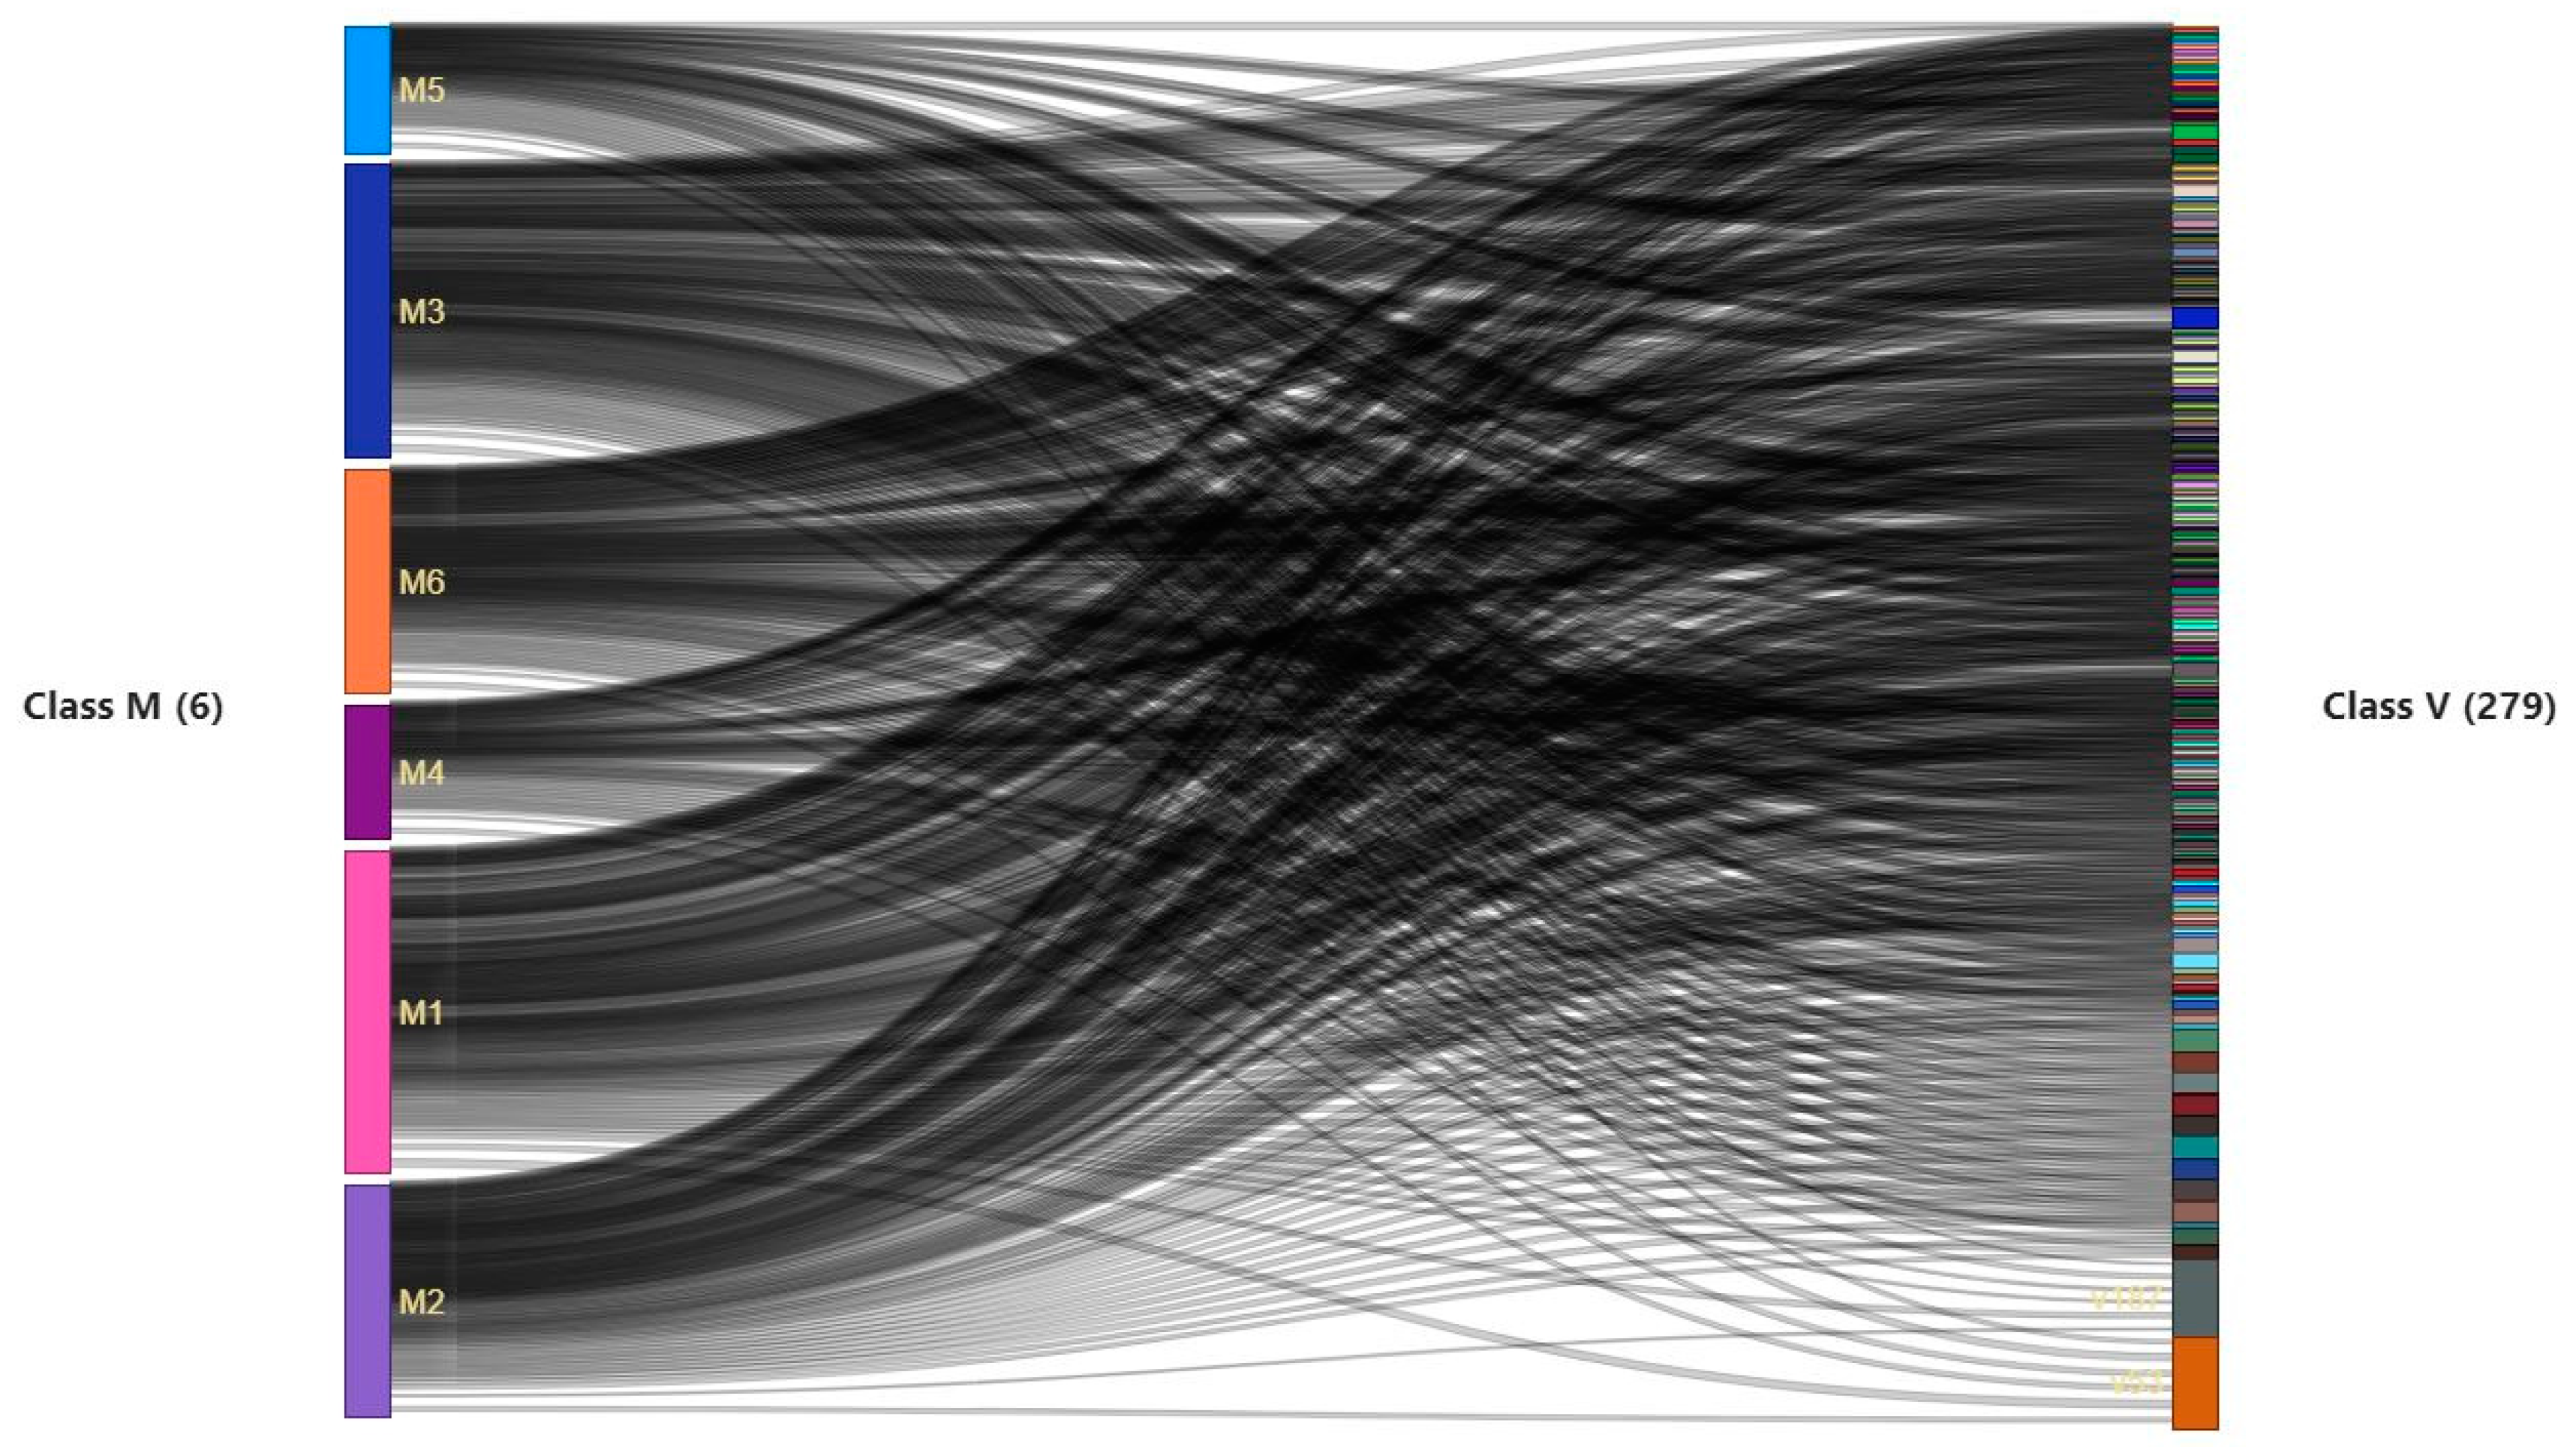
- the representation of the relations between the M and V classes. The frequency of each variable describes the weight that each of them expresses with respect to the variation of each Mi macro-indicator. Afterwards, the V variables are correlated at the spatial type attributes of the object class of the network data model, thus identifying the performance indicators.
3.3. Macro-Phase 3
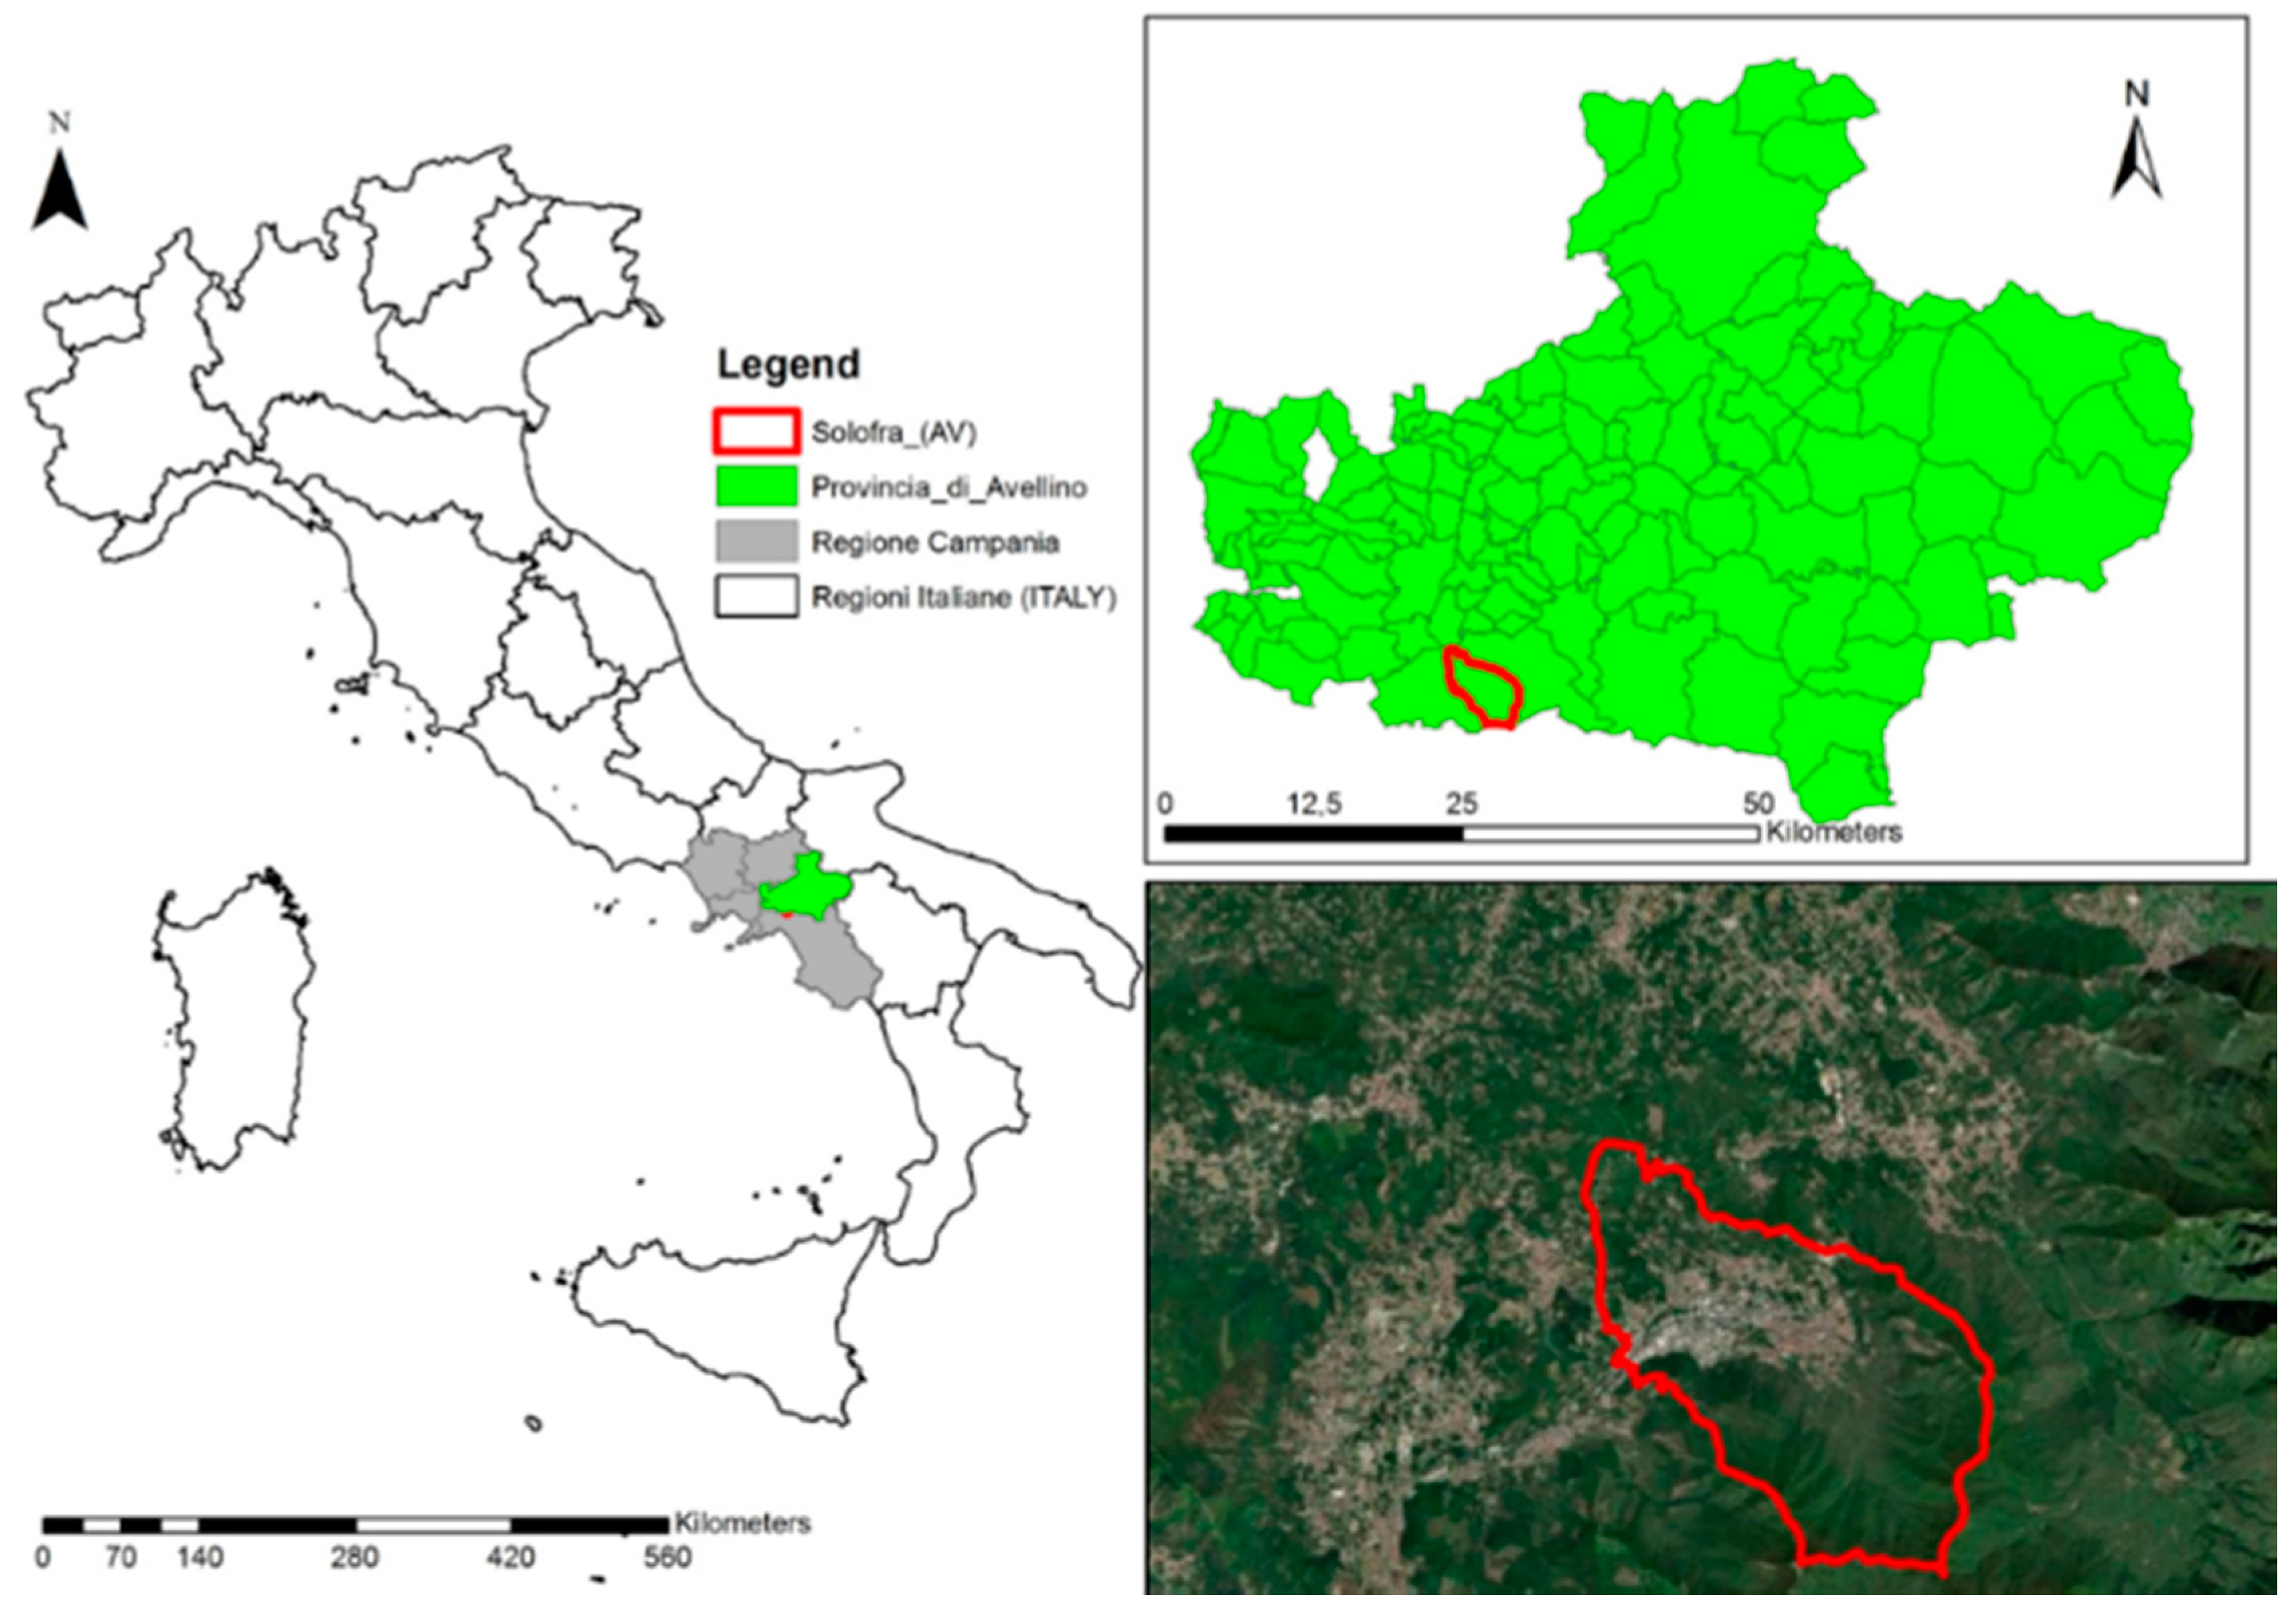
4. Analyzing the Water System of a Municipality: A Case Study
4.1. Macro-Phase 1
- responsible for the operation of the network;
- position and localization;
- typology and function of nodes and traits;
- environmental conditions;
- year of construction;
- operating status and physical conditions;
- survey date;
- type of user connected to the network;
- state of the elements to be maintained or replaced;
- length and working pressure of the pipes.
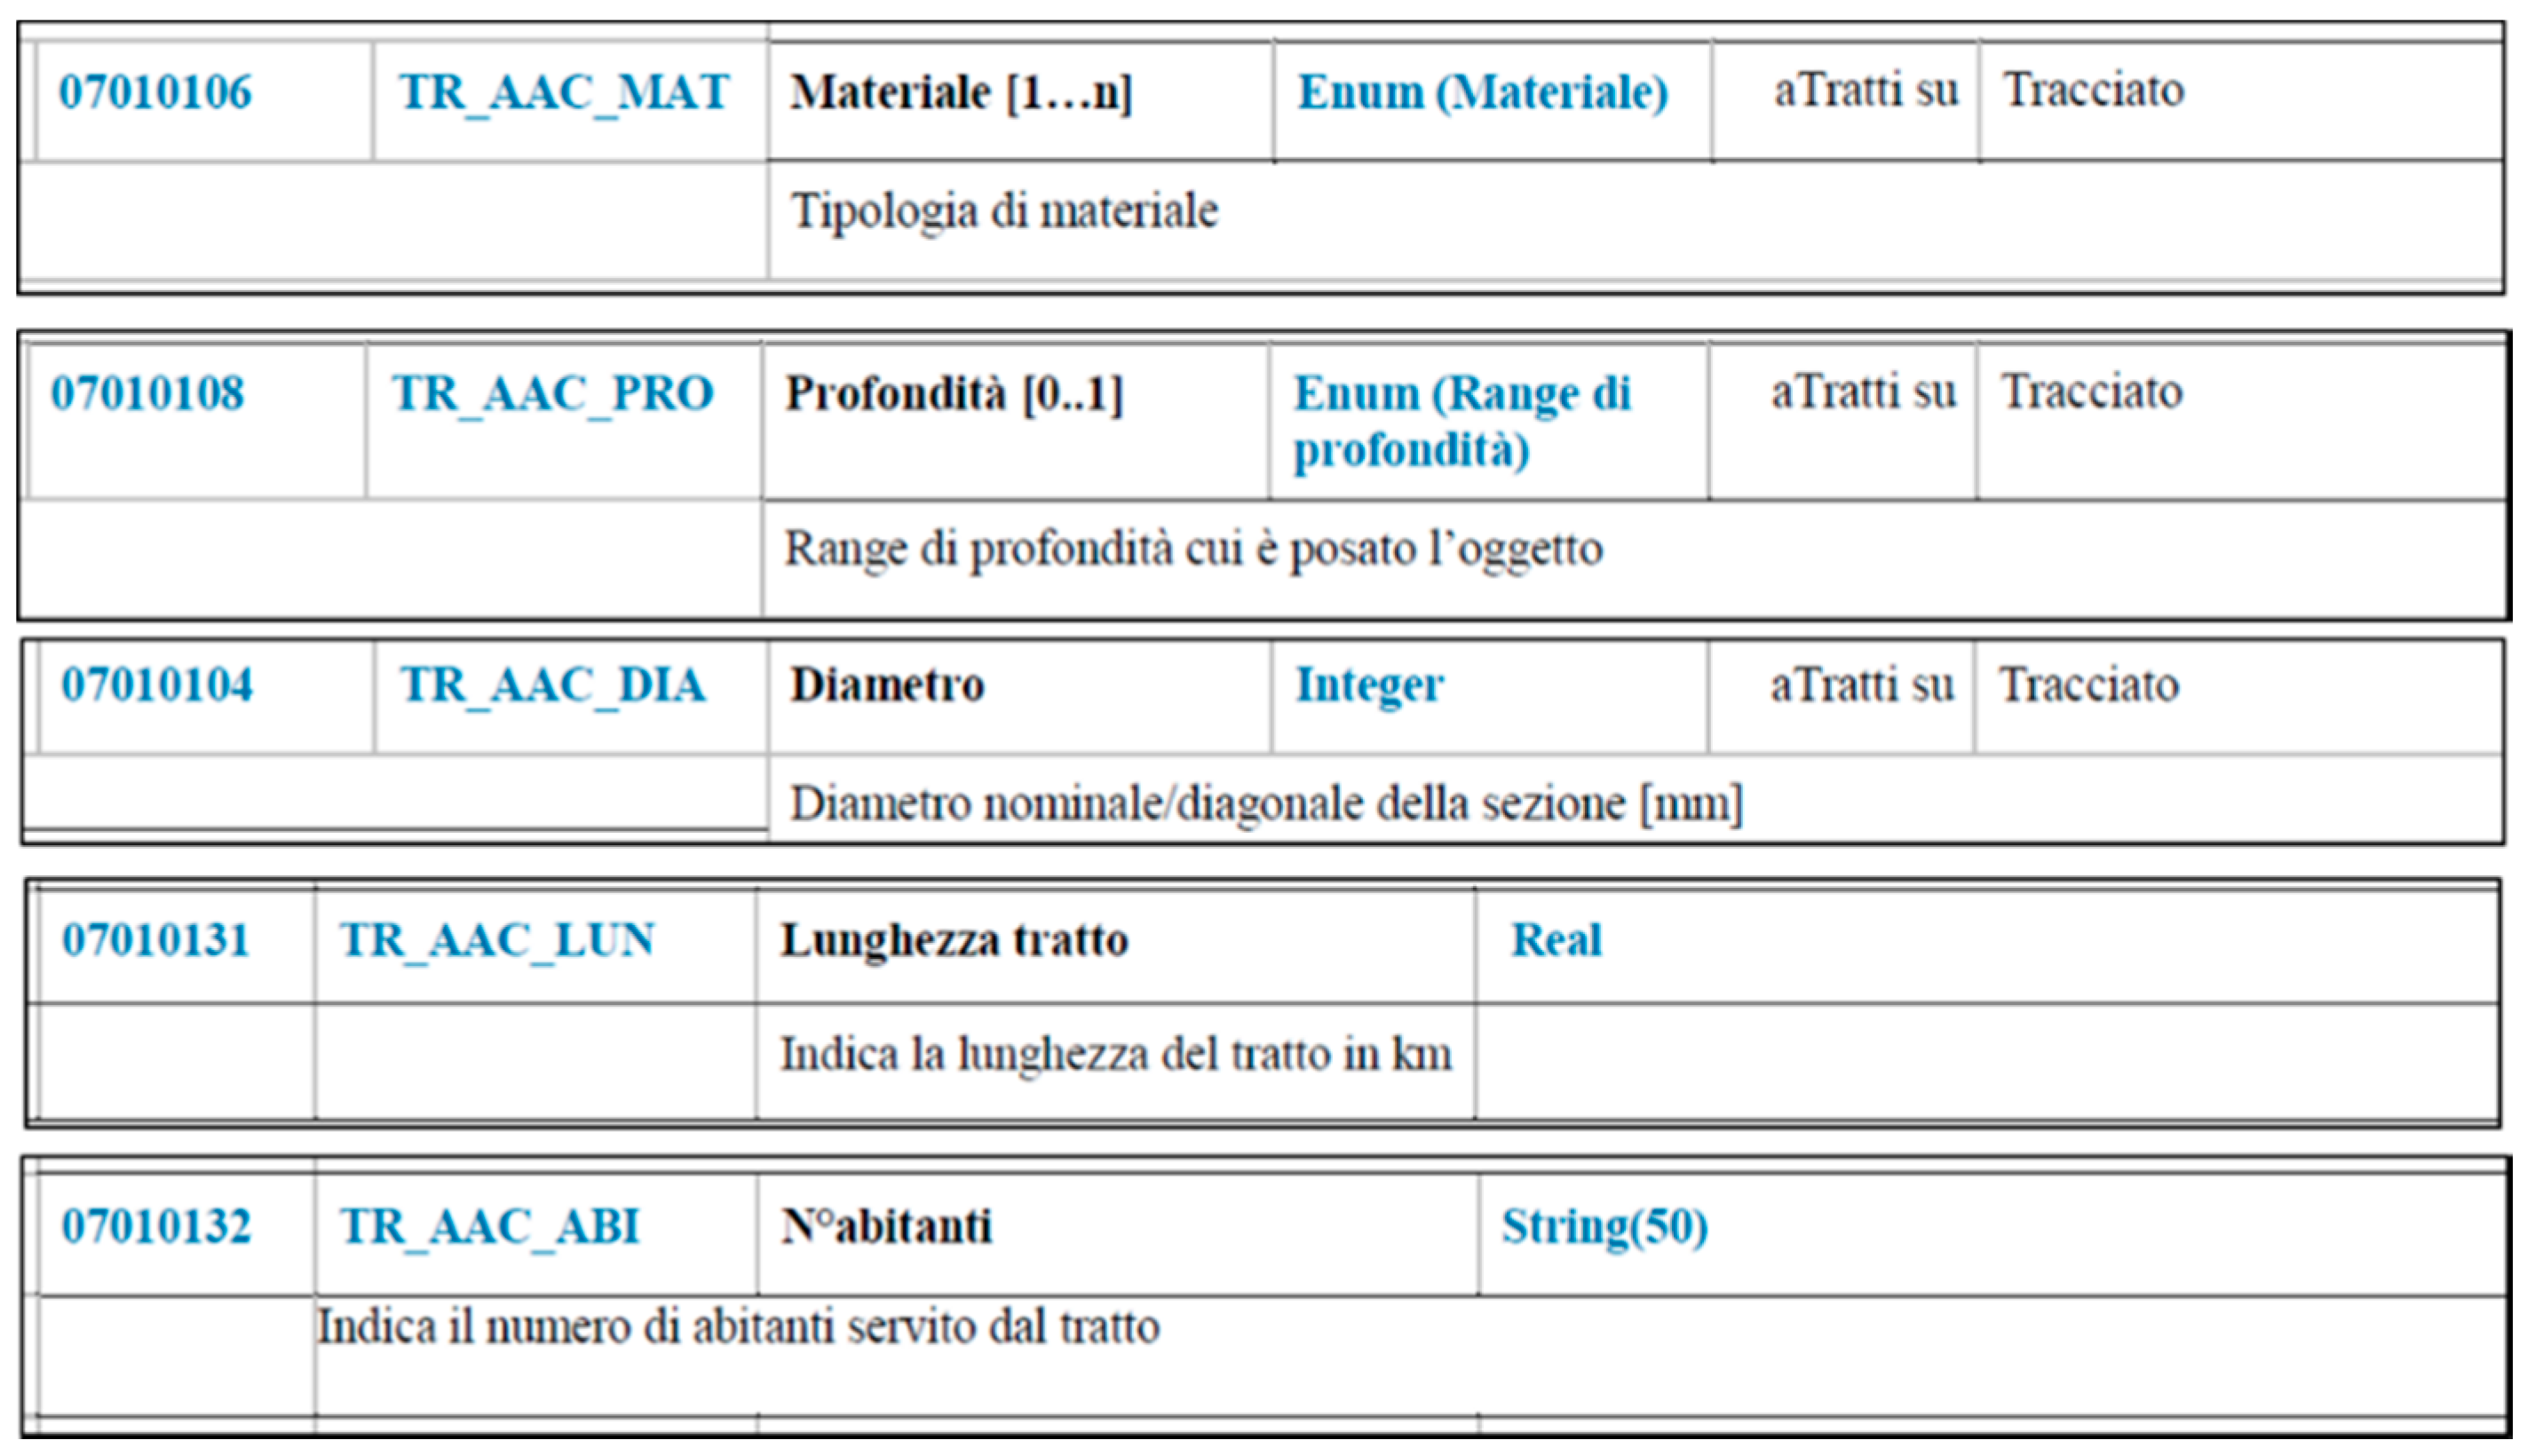
4.2. Macro-Phase 2
- age of conduct;
- material;
- diameter of the pipe;
- length of the network section;
- the hydraulic load under static conditions on each node and section of the network;
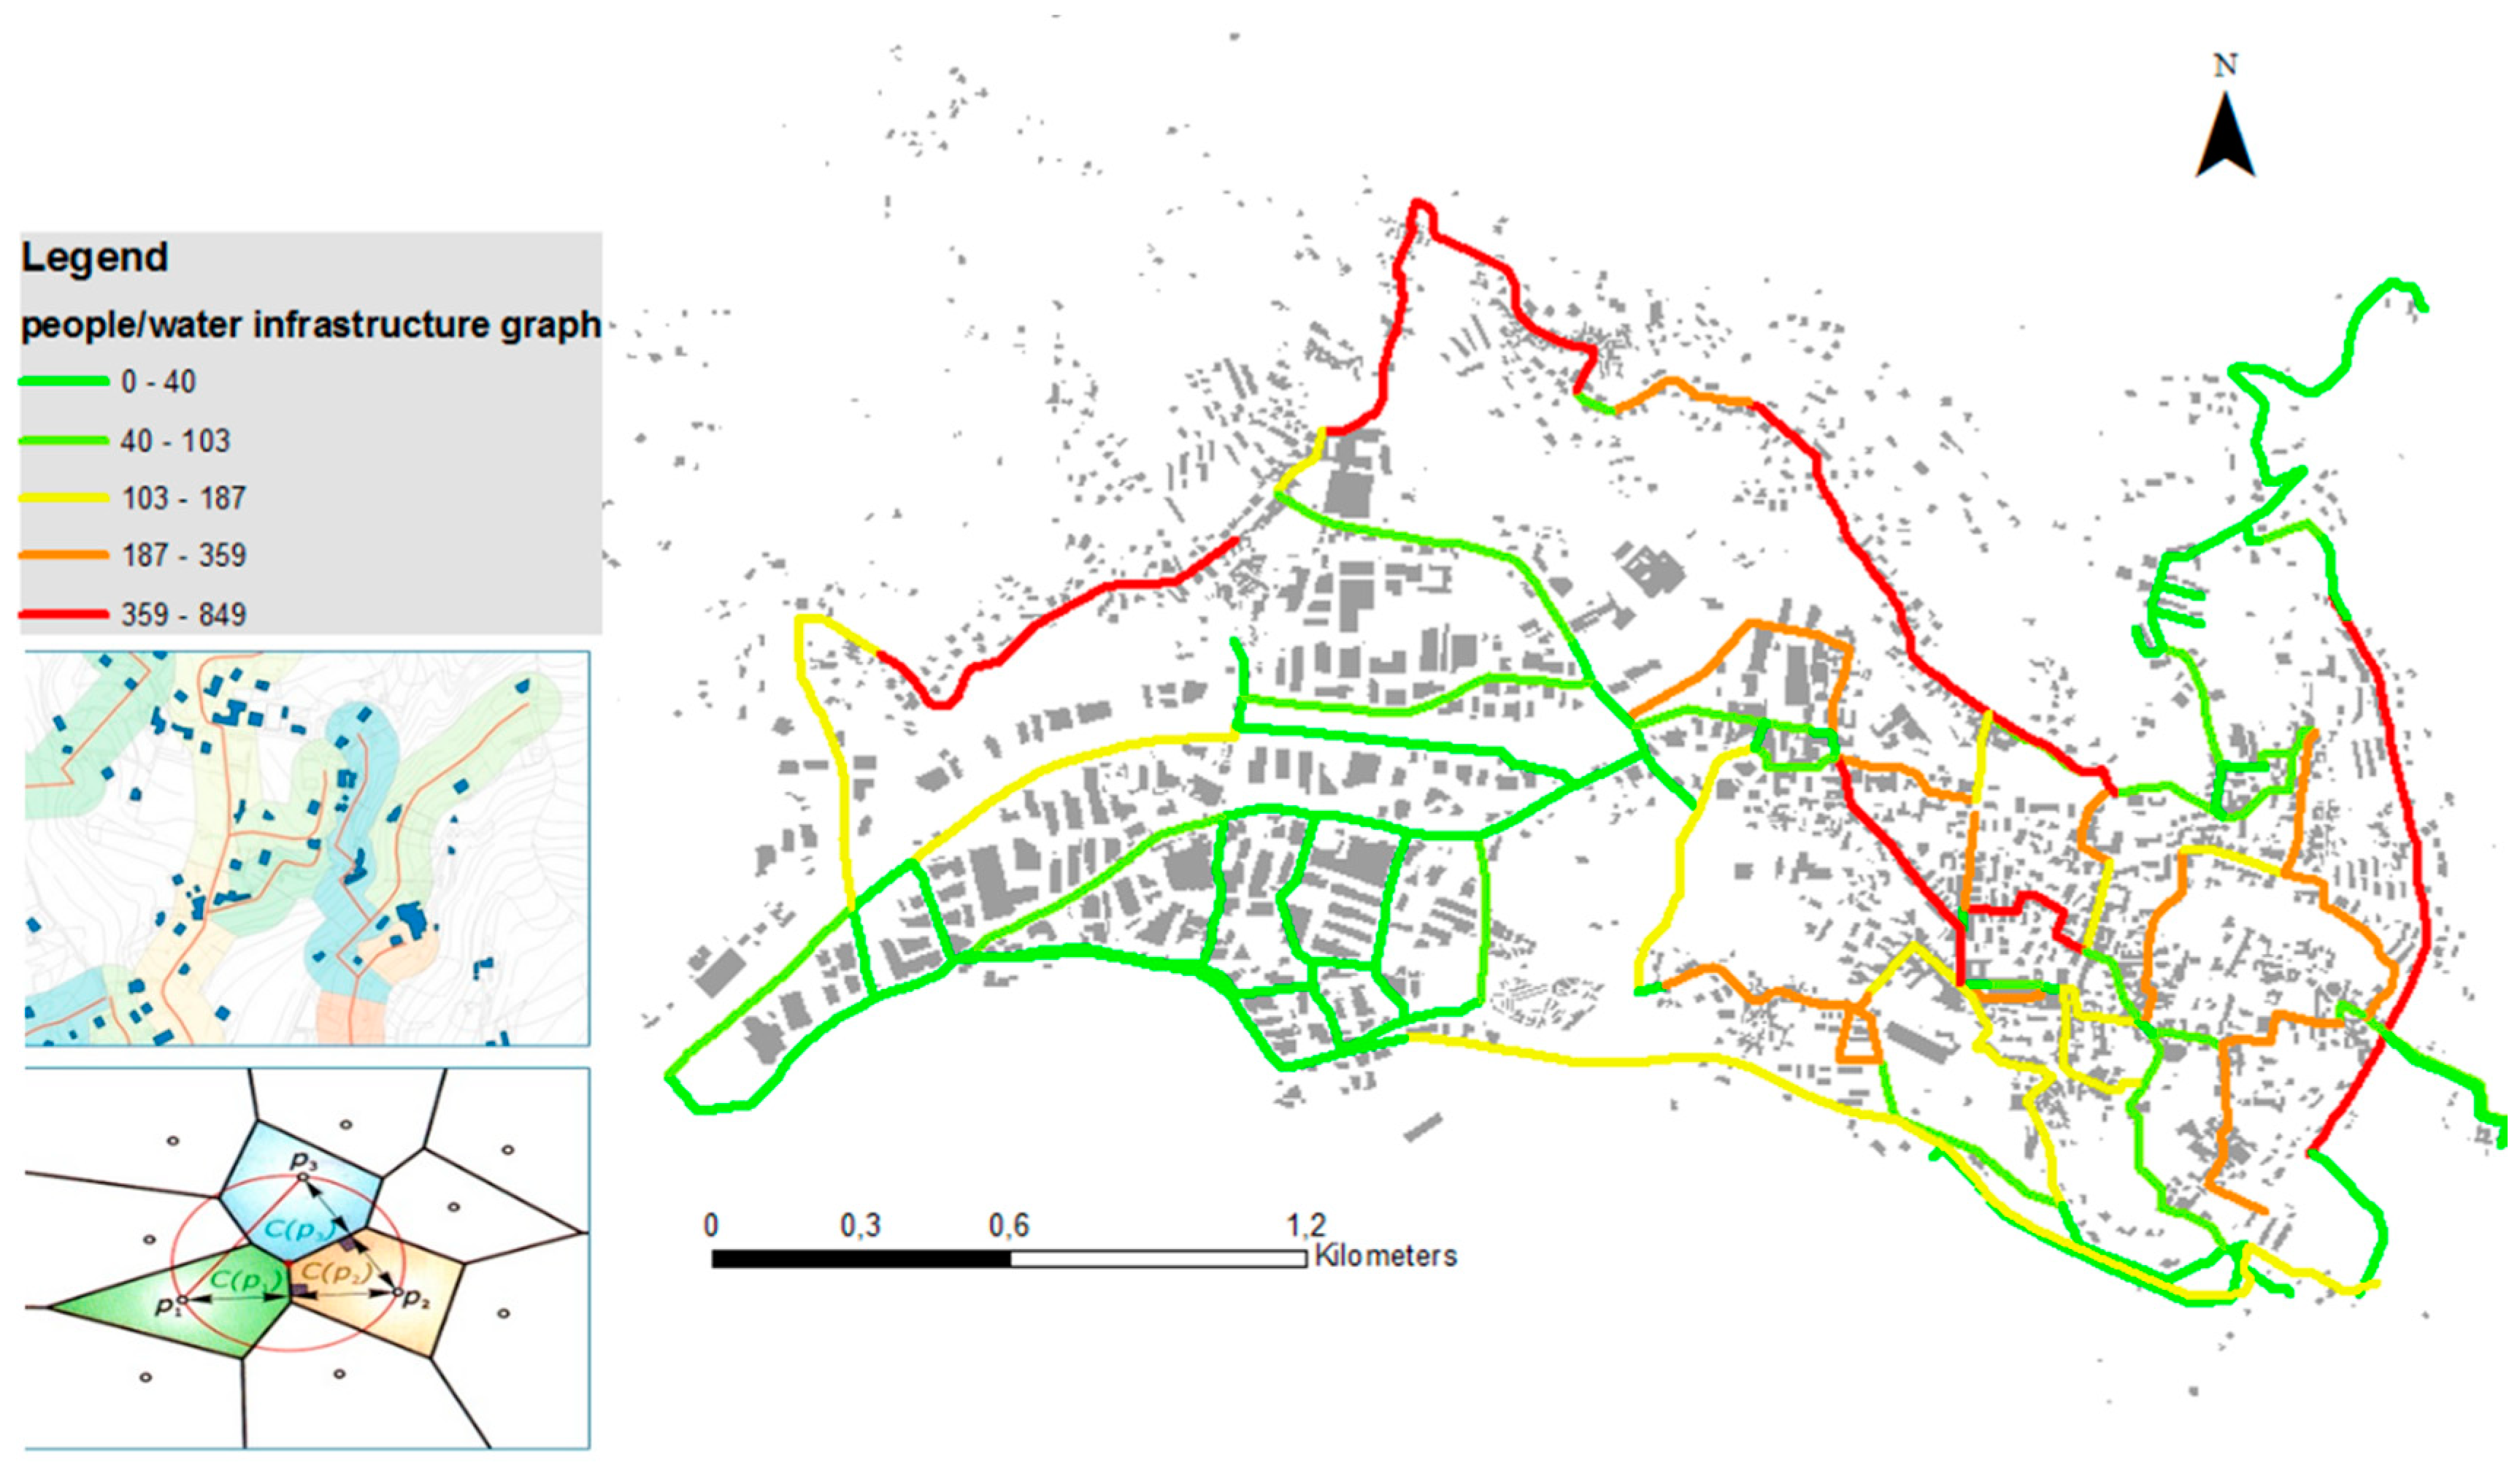
- number of users served by each arc of the network.
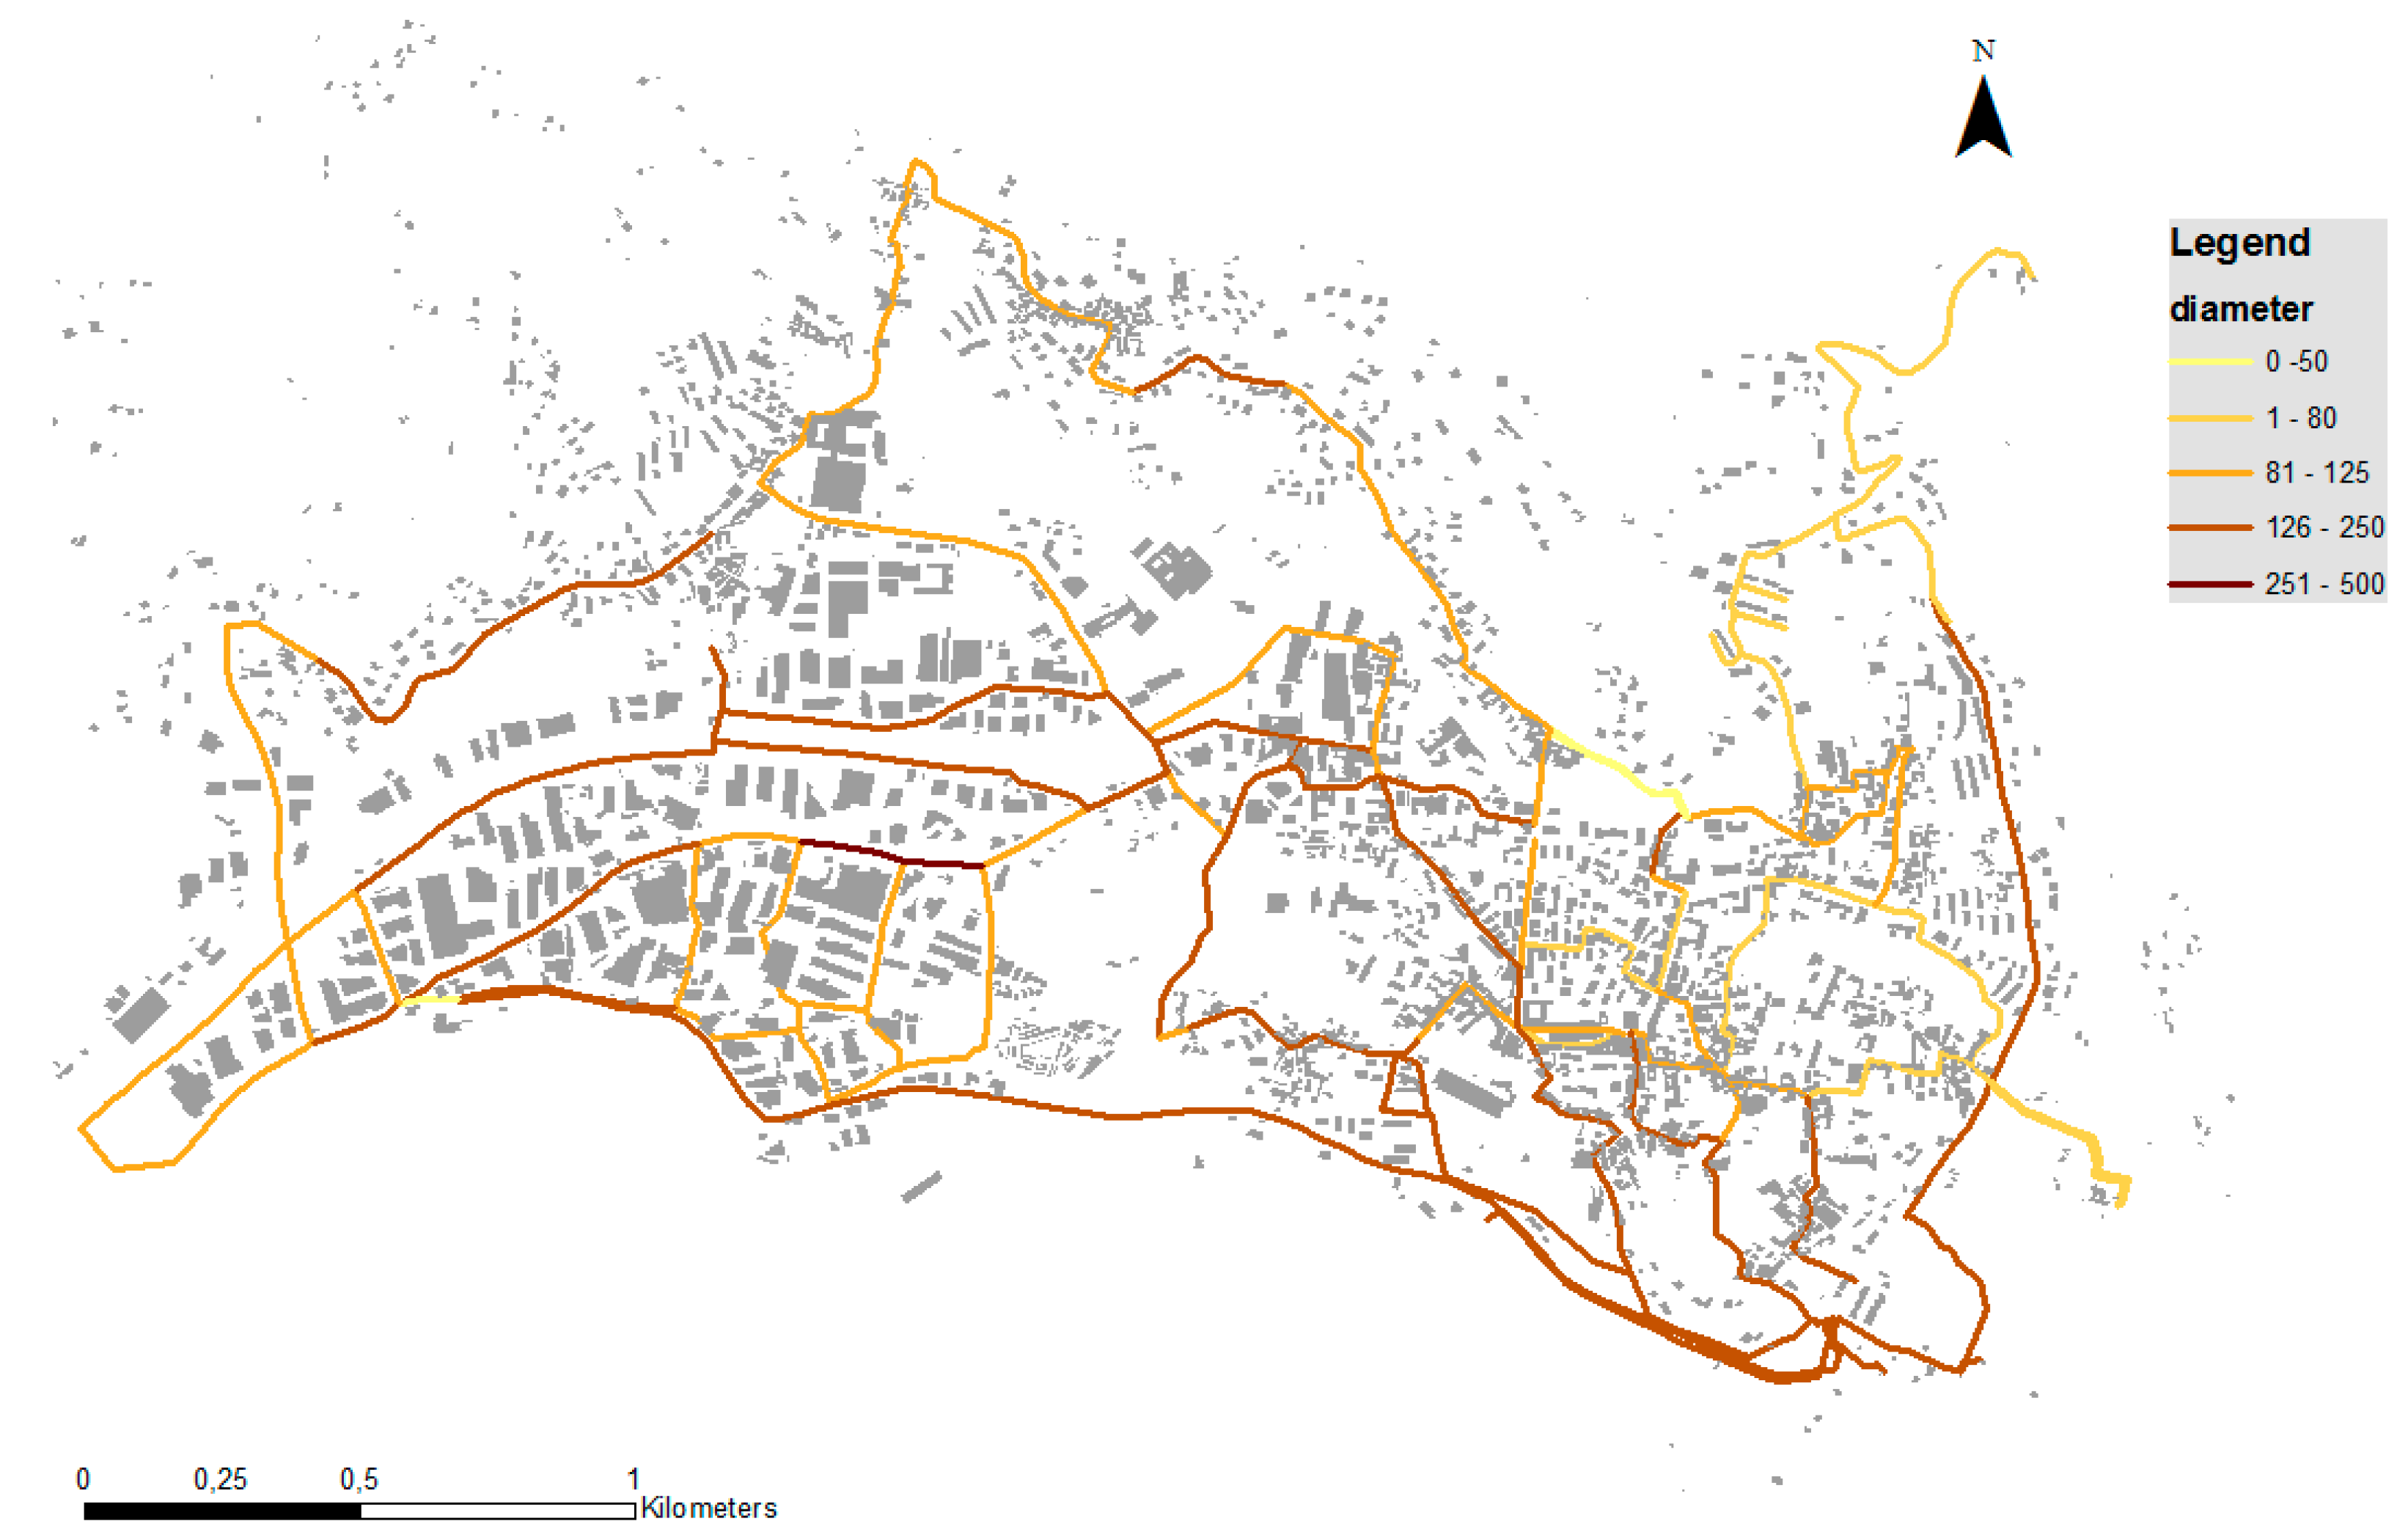
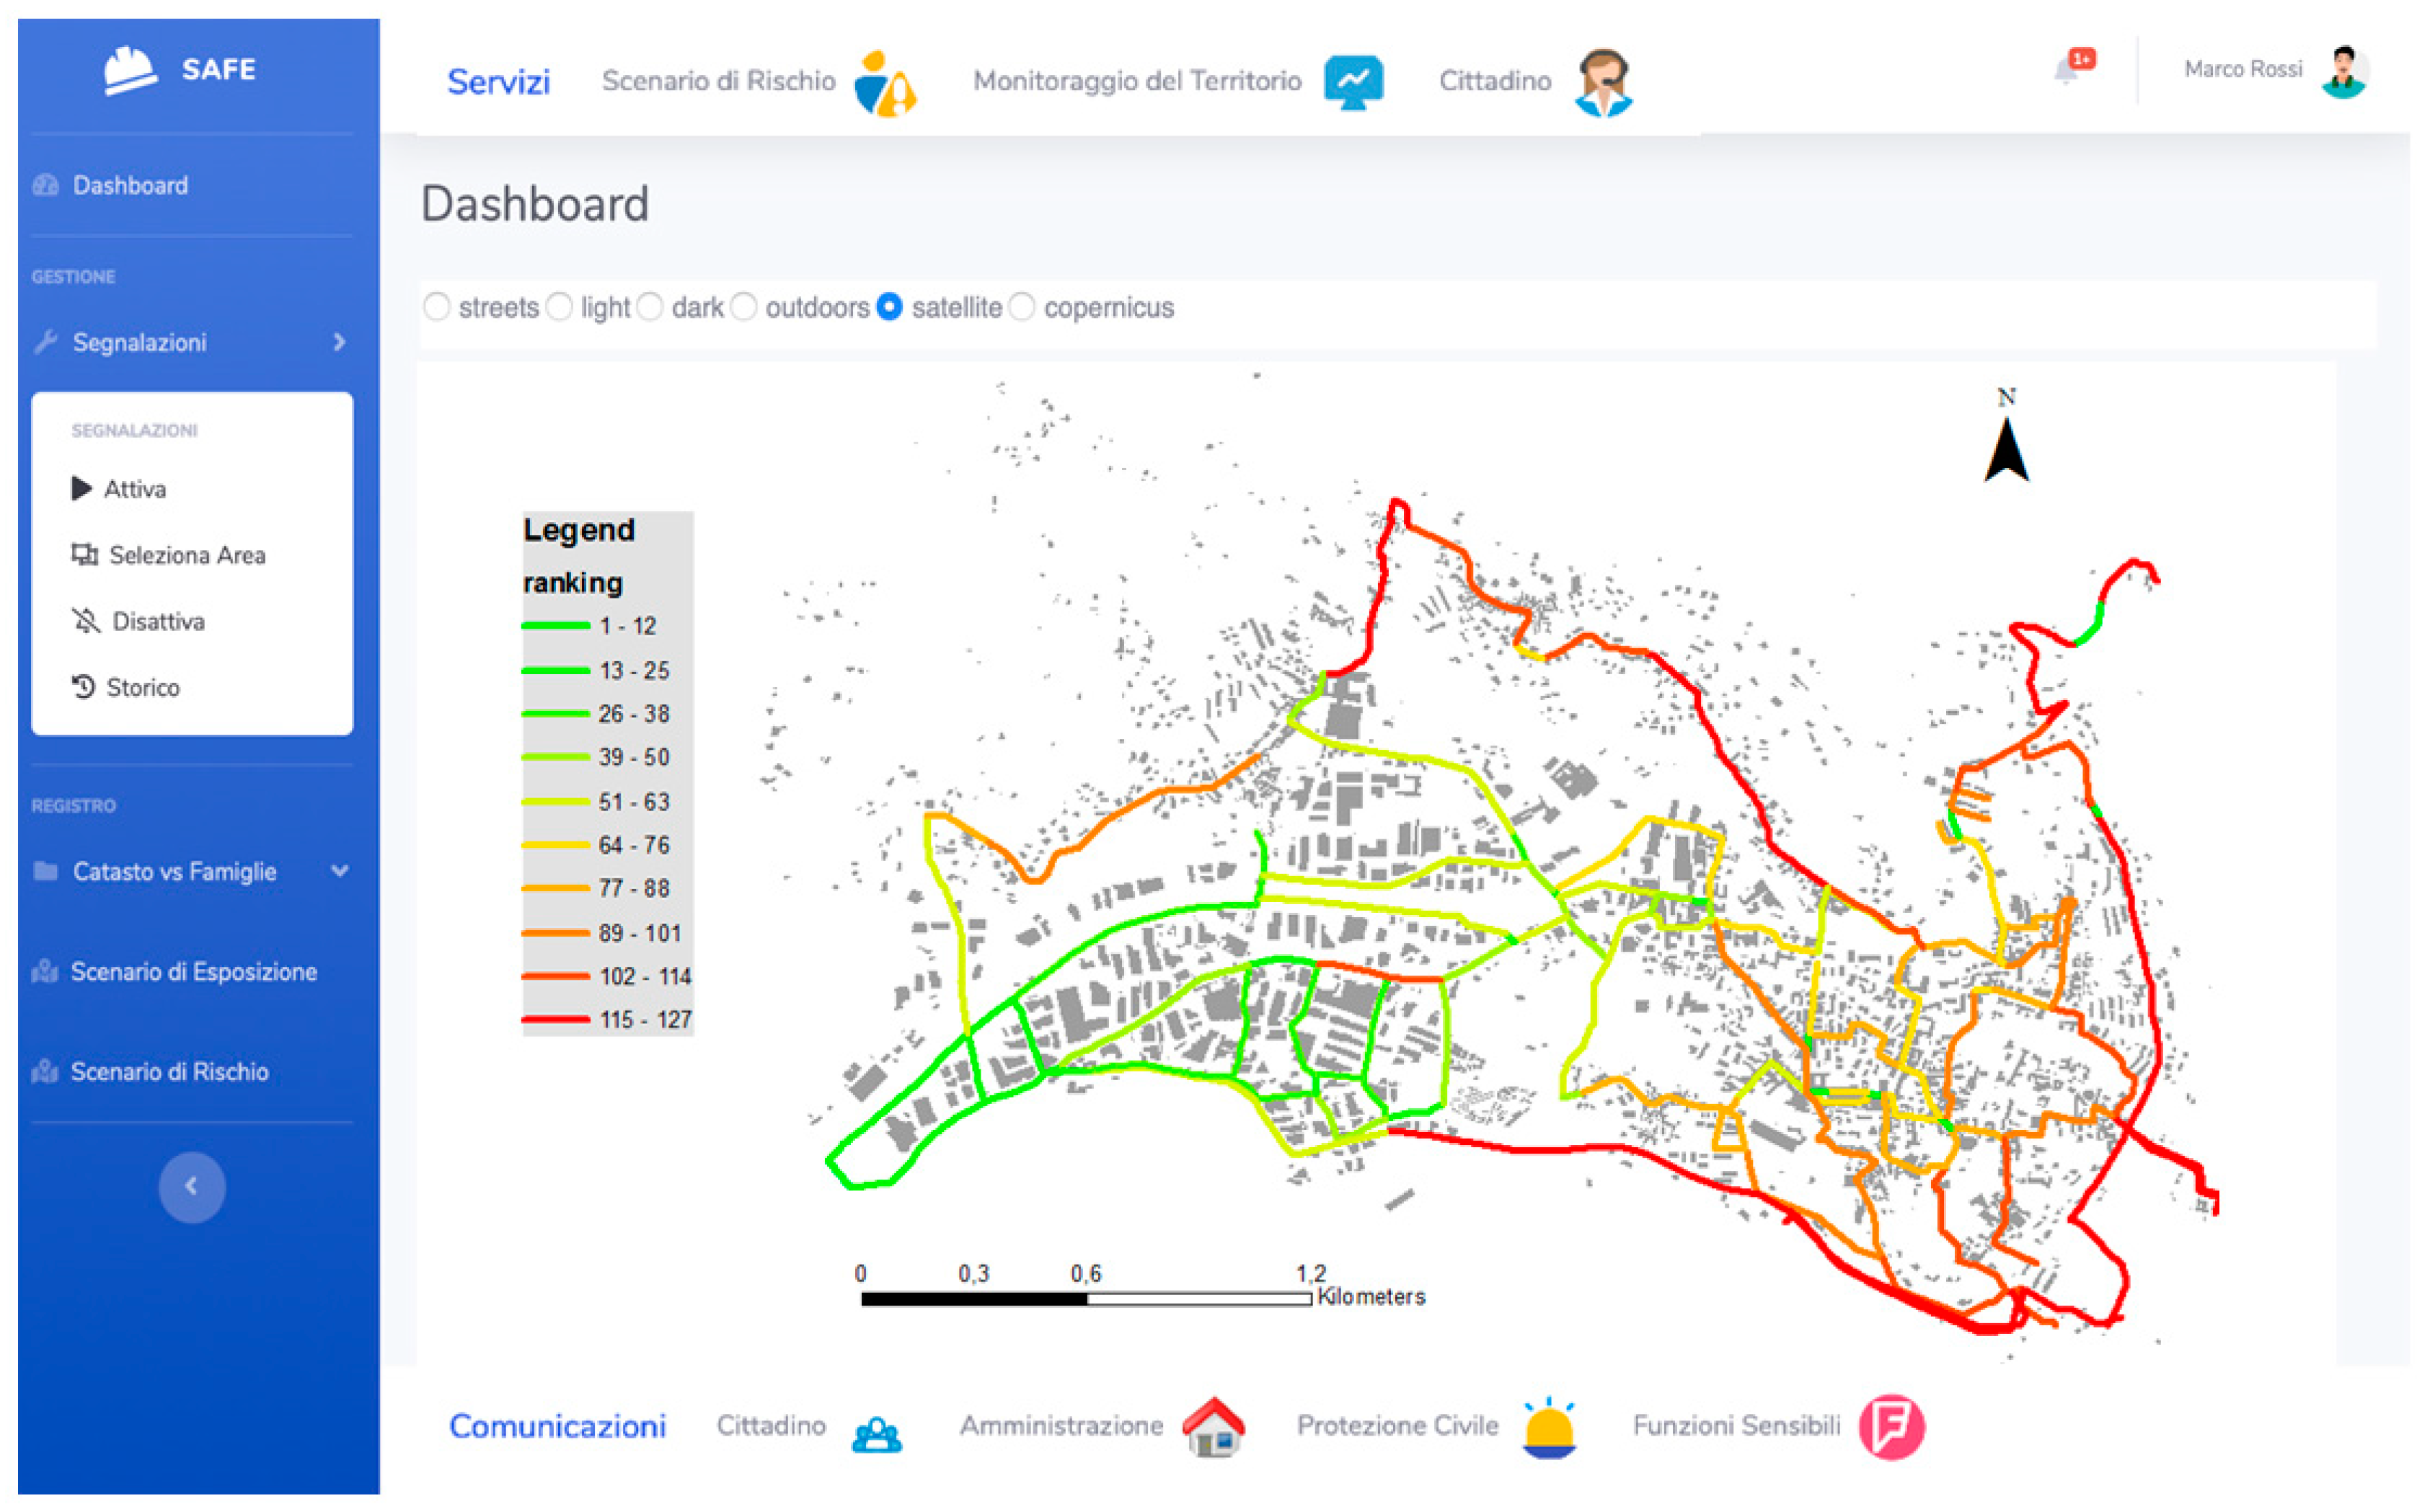
4.3. Macro-Phase 3
- -
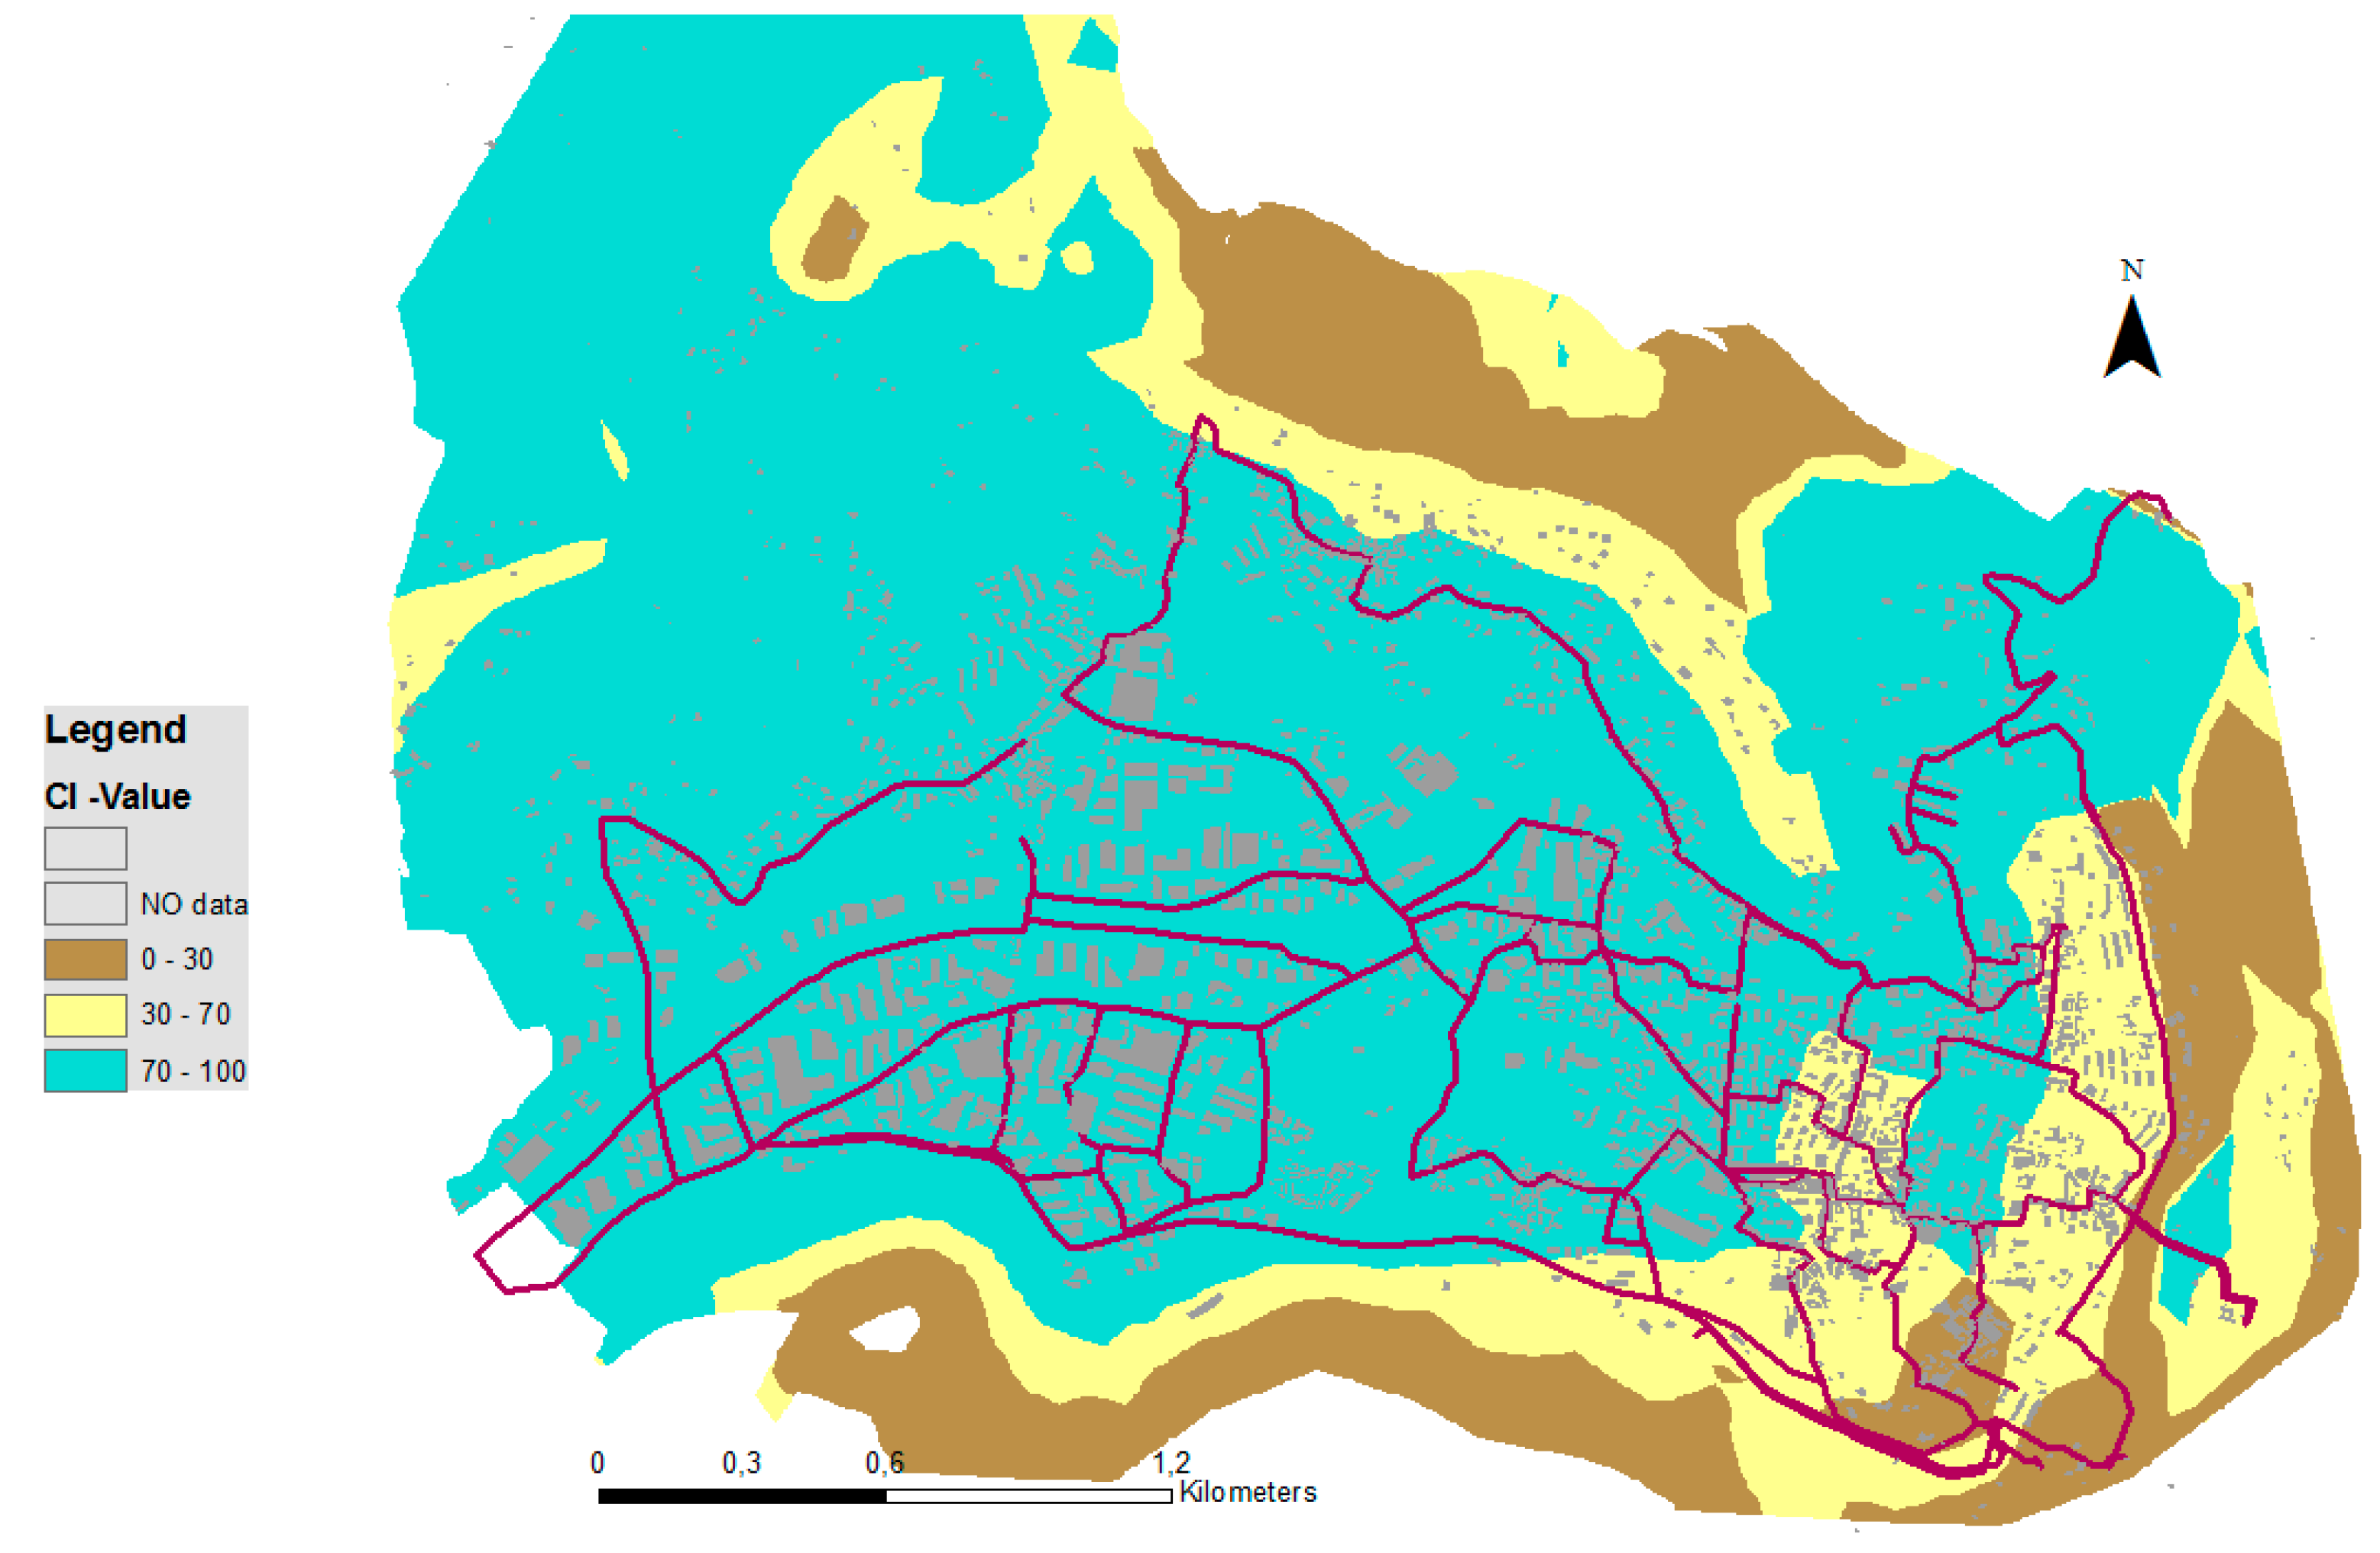
- CL1: This criterion allowed establishing that an arc of the water network maximizes losses when its length and diameter increase, age increases. Moreover, it depends on the type of material (cast iron/steel/plastic).
- -
- CL2: This criterion allowed establishing that a stretch of network maximizes losses when the pressure within its individual arcs and nodes increases.
- -
- CL3: This criterion allowed establishing that a section of the network maximizes losses when the number of users served increases.
5. Results and Discussion
6. Conclusions and Future Work
Author Contributions
Funding
Conflicts of Interest
Appendix A


References
- Grimaldi, M.; Fasolino, F.; Pellecchia, V. Urban Plan and Water Infrastructures Planning: A Methodology Based on Spatial ANP. Sustainability 2017, 9, 771. [Google Scholar] [CrossRef] [Green Version]
- E-Blue, U. I dati del Servizio Idrico Integrato in Italia; Blue e-Book; Noè Edizioni Multimedia: Firenze, Italia, 2017. [Google Scholar]
- Kruger, A.; Kolbe, T.H. Building Analysis for Urban Energy Planning Using Key Indicators on Virtual 3D City Models—The Energy Atlas of Berlin. In Proceedings of the ISPRS Congress 2012 in Melbourne, International Archives of the Photogrammetry, Remote Sensing and Spatial Information Sciences, Melbourne, Australia, 25 August–1 September 2012; Volume XXXIX-B2. [Google Scholar]
- Attardi, R.; Cerreta, M.; Sannicandro, V.; Torre, C. Non-compensatory composite indicators for the evaluation of urban planning policy: The Land-Use Policy Efficiency Index (LUPEI). Eur. J. Oper. Res. 2018, 264, 491–507. [Google Scholar] [CrossRef]
- Munda, G. Measuring sustainability: A multi-criterion framework. Environ. Dev. Sustain. 2005, 7, 117–134. [Google Scholar] [CrossRef]
- Singh, R.K.; Murty, H.R.; Gupta, S.K.; Dikshit, A.K. An overview of sustainability assessment methodologies. Ecol. Indic. 2012, 15, 281–299. [Google Scholar] [CrossRef]
- Italian Regulatory Authority for Electricity Gas and Water. Directive 917/2017/R/IDR (Raccolta dati Qualità tecnica); ARERA: Milano, Italy, 2017.
- Guitouni, A.; Martel, J.M. Tentative guidelines to help choosing an appropriate MCDA method. Eur. J. Oper. Res. 1998, 109, 501–521. [Google Scholar] [CrossRef]
- Nardo, M.; Saisana, M.; Saltelli, A.; Tarantola, S.; Hoffman, A.; Giovannini, E. Handbook on constructing composite indicators: Methodology and user guide. In OECD Statistics Working Paper; OECD Publishing: Paris, France, 2008. [Google Scholar]
- Zhou, P.; Ang, B.W. Comparing MCDA aggregation methods in constructing composite indicators using the Shannon-Spearman measure. Soc. Indic. Res. 2008, 94, 83–96. [Google Scholar] [CrossRef]
- Italian Regulatory Authority for Electricity Gas and Water. Dco 562/2017/R/IDR; ARERA: Milano, Italy, 2017.
- Italian Regulatory Authority for Electricity Gas and Water. 748/2017/R/IDR; Italian Regulatory Authority for Electricity Gas and Water: Milano, Italy, 2017.
- E-Blue, U. I dati del Servizio Idrico Integrato in Italia; Blue e-Book; Noè Edizioni Multimedia: Firenze, Italy, 2019. [Google Scholar]
- Authority for Electricity Gas and Water. Directive 2/2016; Italian Regulatory Authority for Electricity Gas and Water: Milano, Italy, 2016.
- Authority for Electricity Gas and Water. Directive 1/2018; Italian Regulatory Authority for Electricity Gas and Water: Milano, Italy, 2018.
- Lieberman, J. Introduction to MUDDI: Model for Underground Data Definition and Integration; OGC: Wayland, MA, USA, 2018. [Google Scholar]
- Open Geospatial Consortium. Model for Underground Data Definition Integration (MUDDI); Engineering Report; Open Geospatial Consortium: Wayland, MA, USA, 2018. [Google Scholar]
- Agenzia per l’Italia Digitale. Specifiche Di Contenuto di Riferimento per I DataBase Delle Reti Di Sottoservizi E per Il SINFI-Versione 3.0; Agenzia per l’Italia Digitale: Rome, Italy, 2016.
- Agenzia per l’Italia Digitale. Specifiche Di Contenuto Di Riferimento per I Database Delle Reti Di Sottoservizi E per Il SINFI-Versione 3.0; Agenzia per l’Italia Digitale: Rome, Italy, 2017.
- Ministero Dello Sviluppo Economico: Manuale Operativo Di Prima Consegna Dei Dati Per Il SINFI. Available online: https://www.sinfi.it/portal/index.php/conferimento-dati-sinfi/documentazione (accessed on 21 February 2020).
- INFRATEL. AgID, Linee Guida Per La Produzione Dati Del SINFI. Available online: http://www.infratelitalia.it/piani-nazionali-e-regionali/catasto-delle-infrastrutture (accessed on 21 March 2020).
- GU Serie Generale n.139 del 16-06-2016; Gazzetta Ufficiale Della Repubblica Italiana: Rome, Italy, 2016.
- Agenzia per l’italia Digitale. Modifiche Introdotte Nella Versione 3.0 Delle Specifiche Di Contenuto Di Riferimento per I Database Delle Reti Di Sottoservizi E per Il SINFI; Agenzia per l’Italia Digitale: Rome, Italy, 2017.
- Gubbi, J.; Buyya, R.; Marusic, S.; Palaniswami, M. Internet of Things (IoT): A vision, architectural elements, and future directions. Future Gener. Comput. Syst. 2013, 29, 1645–1660. [Google Scholar] [CrossRef] [Green Version]
- Hitzler, P.; Krotzsch, M.; Rudolph, S. Foundations of Semantic Web Technologies; CRC Press: Boca Raton, FL, USA, 2019. [Google Scholar]
- Copernicus. Copernicus is the European Union’s Earth Observation Programme, looking at our planet and its environment for the ultimate benefit of all European citizens. Available online: https://www.copernicus.eu/it (accessed on 21 May 2020).
- Shekhar, S.; Xiong, H. Encyclopedia of GIS; Springer: New York, NY, USA, 2008. [Google Scholar]
- Poleto, T.; Diogho Heuer de Carvalho, V.; Cabral Seixas Costa, A.P. The Roles of Big Data in the Decision-Support Process: An Empirical Investigation. In Decision Support Systems V—Big Data Analytics for Decision Making. Proceedings of the First International Conference, ICDSST 2015, Belgrade, Serbia, 27–29 May 2015; Delibašić, B., Hernández, J.E., Papathanasiou, J., Dargam, F., Zaraté, P., Ribeiro, R., Liu, S., Linden, I., Eds.; Springer: Cham, Switzerland, 2015. [Google Scholar]
- Andrienko, G.; Andrienko, N.; Weibel, R. Geographic Data Science. In IEEE Computer Graphics and Applications; IEEE Computer Society: Washington, DC, USA, 2017; Volume 37, pp. 15–17. [Google Scholar]
- Edzer, P.; Roger, B. Spatial Data Science. Available online: https://opengeohub.org/spatial-data-science-pebesma-and-bivand (accessed on 26 May 2020).
- Open Geospatial Consortium. The OGC’s Emerging Role in Geospatial Business Intelligence—GeoBI. Available online: https://www.ogc.org/domain/geobi (accessed on 29 May 2020).
- Laurini, R. Geographic Knowledge Infrastructure: Applications to Territorial Intelligence and Smart Cities; ISTE Press-Elsevier: London, UK, 2017. [Google Scholar]
- Laurini, R. Nature of Geographic Knowledge Bases. In Handbook of Research on Geographic Information Systems Applications and Advancements; Faiz, S., Mahmoudi, K., Eds.; IGI Global: Hershey, PA, USA, 2017; pp. 29–60. [Google Scholar] [CrossRef] [Green Version]
- Miedes Ugarte, B. Territorial Intelligence and the Three Components of Territorial Governance. In Proceedings of the International Conference of Territorial Intelligence, Besancon, France, 16–17 October 2008; p. 10. [Google Scholar]
- Garvey, P.R. Analytical Methods for Risk Management. A Systems Engineering Perspective; CRC Press Taylor & Francis Group: Boca Raton, FL, USA, 2009. [Google Scholar]
- Tzeng, G.H.; Huang, J.J. Multiple Attribute Decision Making. Methods and Applications; CRC Press Taylor & Francis Group: Boca Raton, FL, USA, 2011. [Google Scholar]
- Torlak, G.; Sevklim, M.; Sanal, M.; Zaim, S. Analyzing business competition by using fuzzy TOPSIS method: An example of Turkish domestic airline industry. Expert Syst. Appl. 2011, 38, 3396–3406. [Google Scholar] [CrossRef]
- Anojkumar, L.; Ilangkumaran, M.; Sasirekha, V. Comparative analysis of MCDM methods for pipe material selection in sugar industry. Expert Syst. Appl. 2014, 41, 2964–2980. [Google Scholar] [CrossRef]
- Ishizaka, A.; Nemery, P. Multi-Criteria Decision Analysis. Method and Software; Jonh Wiley & Sons: Chichester, UK, 2013. [Google Scholar]
- Milani, A.S.; Shanian, A.; Madoliat, R.; Nemes, J.A. The effect of normalization norms in multiple attribute decision making models: A case study in gear material selection. Struct. Multidiscip. Optim. 2005, 29, 312–318. [Google Scholar] [CrossRef]
- Çelen, A. Comparative Analysis of Normalization Procedures in TOPSIS Method: With an Application to Turkish Deposit Banking Market. Informatica 2014, 25, 185–208. [Google Scholar] [CrossRef] [Green Version]
- Rocchi, L.; Massei, G.; Paolotti, L.; Boggia, A. Geographic MCDA for sustainability assessment: The new tool VectorMCDA. In Proceedings of the 27th European Conference on Operational Research, Glasgow, UK, 12–15 July 2015. [Google Scholar]
- Simon, H. The New Science of Management Decision; Prentice Hall: Upper Saddle River, NJ, USA, 1977. [Google Scholar]
- Fasolino, I.; Grimaldi, M.; Zarra, T.; Naddeo, V. Implementation of Inte-grated Nuisances Action Plan. Chem. Eng. Trans. 2016, 54, 19–24. [Google Scholar] [CrossRef]
- Fasolino, I.; Grimaldi, M.; Zarra, T.; Naddeo, V. Odour control strategies for a sustainable nuisances action plan. Glob. NEST J. 2016, 4, 734–741. [Google Scholar] [CrossRef] [Green Version]
- Gerundo, R.; Fasolino, I.; Grimaldi, M. ISUT Model. A Composite Index to Measure the Sustainability of the Urban Transformation. In Smart Energy in the Smart City. Urban Planning for a Sustainable Future; Papa, R., Fistola, R., Eds.; Springer: Cham, Switzerland, 2016. [Google Scholar]
- Grimaldi, M.; Sebillo, M.; Vitiello, G.; Pellecchia, V. An Ontology Based Ap-proach for Data Model Construction Supporting the Management and Planning of the Integrated Water Service. In Computational Science and Its Applications—IC-CSA 2019-Part VI; Misra, S., Gervasi, O., Murgante, B., Stankova, E., Korkhov, V., Torre, C., Rocha, A.M.A.C., Taniar, D., Apduhan, B.O., Tarantino, E., Eds.; Springer Nature Switzerland AG: Basel, Switzerland, 2019. [Google Scholar] [CrossRef]
- Pundt, H. Domain ontologies for data sharing—An example from environmental monitoring using field GIS. Comput. Geosci. 2002, 28, 95–102. [Google Scholar] [CrossRef]
- Métral, C.; Falquet, G.; Vonlanthen, M. An Ontology-based Model for Urban Planning Communication. In Ontologies for Urban Development. Studies in Computational Intelligence; Teller, J., Lee, J.R., Roussey, C., Eds.; Springer: Berlin/Heidelberg, Germany, 2007; Volume 61. [Google Scholar]
- Fox, M. A Foundation Ontology for Global City Indicators; Global Cities Institute, University of Toronto: Toronto, ON, Canada, 2013. [Google Scholar]
- Jarar Oulidi, H. Spatial Data on Water, Geospatial Technologies and Data Management; ISTE Press-Elsevier: London, UK, 2018. [Google Scholar]
- Loukis, E. An ontology for G2G collaboration in public policy making, implementation and evaluation. Artif. Intel. Law 2007, 15, 19–48. [Google Scholar] [CrossRef]
- Bouyerbou, H.; Bechkoum, K.; Lepage, R. Geographic ontology for major disasters: Methodology and implementation. Int. J. Dis. Risk Reduct. 2019, 34, 232–242. [Google Scholar] [CrossRef]
- Gil, Y.; Blythe, J. PLANET: A shareable and reusable ontology for representing plans. In Workshop on Representational Issues for Real-World Planning Systems; AAAI: Palo Alto, CA, USA, 2000. [Google Scholar]
- Sebillo, M.; Vitiello, G.; Grimaldi, M.; De Piano, A. Citizen-Centric Approach for the Improvement of Territorial Services Management. ISPRS Int. J. Geo-Inf. 2020, 9, 223. [Google Scholar] [CrossRef] [Green Version]
- Sebillo, M.; Vitiello, G.; Risi, M.; Grimaldi, M.; Dello Buono, D. Civil Protection 2.0. A Diagram-based Approach for Managing an Emergency Plan. In Proceedings of the 22nd AGILE Conference on Geo-Information Science, Cyprus University of Technology, Limassol, Cyprus, 17–20 June 2019; Kyriakidis, P., Hadjimitsis, D., Skarlatos, D., Mansourian, A., Eds.; Stichting AGILE: Lymassol, Cyprus, 2019. ISBN 978-90-816960-9-8. [Google Scholar]
- Sebillo, M.; Vitiello, G.; Grimaldi, M.; Dello Buono, D. SAFE (Safety for Families in Emergency). A Citizen-Centric Approach for Risk Management. In Proceedings Part II, The 19th International Conference on Computational Science and its Applications ICCSA, Saint Petersburg University, Saint Petersburg, Russia, 1–4 July 2019; LNCS 11620; Misra, S., Gervasi, O., Murgante, B., Stankova, E., Korkhov, V., Torre, C., Rocha, A.M.A.C., Taniar, D., Apduhan, B.O., Tarantino, E., Eds.; © Springer Nature Switzerland AG: Basel, Switzerland, 2019; pp. 424–437. [Google Scholar] [CrossRef]
- Microsoft. Che cos’è Power BI? Available online: https://docs.microsoft.com/it-it/power-bi/fundamentals/power-bi-overview (accessed on 26 April 2020).
- Bandura, R. A Survey of Composite Indices Measuring Country Performance: Update. In UNDP/ODS Working Paper; United Nations Development Programme, Office of Development Studies: New York, NY, USA, 2008. [Google Scholar]
- Joint Research Centre-European Commission. Handbook on Constructing Composite Indicators: Methodology and User Guide; OECD Publishing: Paris, France, 2008. [Google Scholar]
- Mazziotta, M.; Pareto, A. Methods for constructing composite indices: One for all or all for one. Riv. Ital. Econ. Demog. Stat. 2013, 67, 67–80. [Google Scholar]
- Blackorby, C.; Donaldson, D.; Weymark, J.A. A normative approach to industrial-performance evaluation and concentration indices. Eur. Econ. Rev. 1982, 19, 89–121. [Google Scholar] [CrossRef]
- Sgobbo, A. Eco-social innovation for efficient urban metabolisms. TECHNE J. Technol. Archit. Environ. 2017, 14, 337–344. [Google Scholar] [CrossRef]
- Sgobbo, A. Resilienza e rigenerazione: L’approccio water sensitive urban planning come strategia di sostenibilità urbana. BDC-Boll. Del Cent. Calza Bini 2018, 18, 105–126. [Google Scholar] [CrossRef]
- Tira, M.; Giannouli, I.; Sgobbo, A.; Brescia, C.; Cervigni, C.; Carollo, L.; Tourkolias, C. INTENSSS PA: A systematic approach for INspiring Training ENergy-Spatial Socioeconomic Sustainability to Public Authorities. UPLanD-J. Urban Plan. Landsc. Environ. Des. 2017, 2, 65–84. [Google Scholar] [CrossRef]
- INSPIRE-Infrastructure for Spatial Information in Europe. Available online: https://inspire.ec.europa.eu/ (accessed on 10 August 2020).
- Saaty, R.W. Decision Making in Complex Enviroments: The Analytic Hierarchy Process (AHP) for Decision Making and the Analytic Network Process (ANP) for Decision Making with Dependence and Feedback; RWS Publications: Pittsburgh, PA, USA, 2003. [Google Scholar]


| Macro-Indicator | Description |
|---|---|
| M1 | “Water losses” (to minimize losses, with effective monitoring of water infrastructure), taking into account both actual and percentage water losses; |
| M2 | “Service interruptions” (to maintain service continuity, also through a suitable configuration of supply sources). It represents the ratio between the total length of interruptions in a year and the number of end users served by the supplier; |
| M3 | “Quality of water supplied” (to ensure adequate quality of the resource for human consumption). It uses multi-stage logic, considering: (i) the incidence of non-potability orders; (ii) the rate of noncompliant internal samples; (iii) the level of parameters from noncompliant internal controls; |
| M4 | “Adequacy of the sewage system” (to minimize environmental impact from wastewater). It uses multi-stage logic—considering: (i) the frequency of flooding and/or spills from sewers; (ii) the legal adequacy of flood drains; (iii) the control of flood drains; |
| M5 | “Landfill sludge disposal” (to minimize the environmental impact of wastewater treatment, for sludge). It represents the ratio between the amount of sewage sludge measured dry that is disposed of in landfills and the total quantity of sewage sludge measured dry; |
| M6 | “Quality of purified water” (to minimize the environmental impact of wastewater treatment, for the water line). This represents the rate of wastewater discharge samples exceeding the limits. |
| Theme | Classes |
|---|---|
| theme 01: Water supply network (0701) | class 01: Section of the water supply network (TR_AAC-070101) |
| class 02: Node of the water supply network (TR_AAC-070102) | |
| class 03: Water supply network (TR_AAC-070103) | |
| theme 02: Water disposal network (0702) | class 01: Section of the water disposal network (TR_AAC-070201) |
| class 02: Node of the water disposal network (TR_AAC-070202) | |
| class 03: Water disposal network (TR_AAC-070203) |
© 2020 by the authors. Licensee MDPI, Basel, Switzerland. This article is an open access article distributed under the terms and conditions of the Creative Commons Attribution (CC BY) license (http://creativecommons.org/licenses/by/4.0/).
Share and Cite
Grimaldi, M.; Sebillo, M.; Vitiello, G.; Pellecchia, V. Planning and Managing the Integrated Water System: A Spatial Decision Support System to Analyze the Infrastructure Performances. Sustainability 2020, 12, 6432. https://0-doi-org.brum.beds.ac.uk/10.3390/su12166432
Grimaldi M, Sebillo M, Vitiello G, Pellecchia V. Planning and Managing the Integrated Water System: A Spatial Decision Support System to Analyze the Infrastructure Performances. Sustainability. 2020; 12(16):6432. https://0-doi-org.brum.beds.ac.uk/10.3390/su12166432
Chicago/Turabian StyleGrimaldi, Michele, Monica Sebillo, Giuliana Vitiello, and Vincenzo Pellecchia. 2020. "Planning and Managing the Integrated Water System: A Spatial Decision Support System to Analyze the Infrastructure Performances" Sustainability 12, no. 16: 6432. https://0-doi-org.brum.beds.ac.uk/10.3390/su12166432