Influence of Individual Perceptions on the Decision to Adopt Automated Bus Services


1
Chair of Transportation Systems Engineering, Department of Civil, Geo and Environmental Engineering, Technical University of Munich, Parkring 37, 85748 Garching, Germany
2
Institute for Transport Studies, University of Natural Resources and Life Sciences, Peter Jordan St 82, 1190 Vienna, Austria
3
Integrated Transport Research Lab, KTH Royal Institute of Technology, SE-100 44 Stockholm, Sweden
*
Author to whom correspondence should be addressed.
Sustainability 2020, 12(16), 6484; https://0-doi-org.brum.beds.ac.uk/10.3390/su12166484
Submission received: 25 June 2020
/
Revised: 24 July 2020
/
Accepted: 7 August 2020
/
Published: 11 August 2020
(This article belongs to the Special Issue Sustainability of Automated and Connected Transport - The User Perspective)
Abstract
:The rapid development of automated buses holds great potential for the development of transportation systems. As research into innovative forms of automated transportation systems gains momentum, it is important to understand the public’s perceptions of such public transport systems. Previous studies have contributed based on hypothetical scenarios, but not based on real observations. Based on an online survey in Stockholm in March 2019, the current research addresses this gap by investigating the public’s perceptions from a real, fully operational, automated public transportation service operated in a mixed traffic environment on public roads. The respondents were selected along the automated bus line in Barkabystaden, Stockholm. Our findings indicate that (1) The presence of onboard operators has a positive impact on respondents’ perceived safety, (2) People who have not taken automated buses before have a more negative perception of driving speed of the bus service than people who have taken the buses before, (3) Attitudinal factors, such as public perceptions of safety, driving speed, reliability, and convenience, have a significant influence on the acceptance of the new bus system, (4) As an emerging and innovative transportation mode, automated buses are expected to attract a high share of regular public transportation mode users and the younger generations in the future, (5) Social-demographic characteristics such as gender and income had no significant impacts on the adoption of the new technology. The results provide the characteristics of early bus adopters and their travel behavior and help to prioritize possible investments and allow the policymakers and private industries to identify the special needs of users.
1. Introduction
Automated vehicles have great potential to have positive impacts on the transportation system. The introduction of automation technology is expected to generate social and economic benefits, such as reducing labor costs for operations and maintenance, improving roadway safety and capacity, inducing traffic congestion, and providing more accessibility to young, elderly and disabled people [1,2,3,4,5,6,7,8]. Such potential benefits of the new transport mode are widely discussed and expected to be examined in the coming years. For any emerging technology, an important consideration for policymakers is to evaluate and forecast the public’s perceptions and the acceptance of the technology.
Recognizing the need for research into the factors shaping the automation technology acceptance, a growing body of literature has examined people’s attitudes towards the automation technology and assessed the impacts on the public’s intention to use the new transport mode. For instance, adopting a car technology acceptance model, introducing attitudinal factors, Sener et al. [9] examined the impacts of these factors on the intention to use self-driving vehicles in Texas cities. The results related to perceived safety were as expected and significant in adoption. In another study, Madigan et al. [10] investigated the factors influencing users’ acceptance of automated road transport systems (ARTS) and found users’ enjoyment of the system had a strong impact on behavioral intentions to use ARTS in the future. These previous studies suggest that subjective attitudes towards new technology will influence the acceptance of automated vehicles.
The potential benefits for automation technology are not limited to private cars but extend to public transportation systems [7,11,12,13]. Vehicle automation holds the potential to benefit the public transportation system through the implementation of partially or fully automated buses [7,14]. Over the last decades, many trials of automated buses have been carried out worldwide (CityMobil2, WEpods Project, Drive Sweden Project [15,16,17]. While it is assumed that the automated technology will have significant benefits on public transportation services, it is important to understand the dynamic elements of public acceptance of this new transportation mode.
Several previous studies have examined user acceptance and public perception of automated buses. For instance, based on a stated choice survey in twelve European cities, Alessandrini et al. [18] examined user preferences towards automated road transport systems and conventional buses and examined the social-economic characteristics of the users. Similarly, in a pilot experiment of an automated bus service in Neuhausen am Rheinfall, Switzerland, Wicki, and Bernauer [19] found that passengers of autonomous shuttle buses show relatively high trust in the system safety and reliability. In the trial in Berlin–Schöneberg, Germany, Nordhoff et al. [20] presented the results of a questionnaire study among individuals who physically experienced autonomous shuttles on an office campus in Berlin–Schöneberg. Their findings indicated that passengers reported that taking a ride in the shuttle was fun and enjoyable. However, the respondents were not inclined to replace their current transport mode for the shuttle, which may not be surprising as the shuttle operated under very limited conditions.
Although progress has been made in the understanding of the public’s perceptions of automated bus services, such as operational safety, vehicle comfort, service frequency, and reliability of the new technology, compared to automated vehicles, little is known about how the public’s perceptions influence the behavioral intention of automated buses, leaving major gaps for further study. Among the few notable exceptions, Winter et al. [21] developed a discrete choice model to shed light on users’ attitudes towards automated buses and how they trade-off travel time and travel cost linked to using an automated bus. Their study found that trust in automated vehicles, which relates to the safety and performance perceptions of a self-driving bus, has a larger impact on the choices made by women than men. More recently, Dong et al. [7] reported regular transit users’ willingness to ride and concerns about autonomous buses in the Philadelphia region. Using a stated choice experiment, their study suggested that riders might have concerns about personal safety if driverless buses don’t have a transit employee providing customer service or monitoring the bus’s operational systems. The more a passenger is concerned with operational vehicle safety, the less willing she or he will be to ride in an automated bus.
These studies provide an understanding regarding the public’s perceptions of the new transportation mode based on the hypothetical scenario test approach. Studies based on real automated bus services, in a mixed road setting, as a part of an integrated public transport service in the neighborhood are still limited. Although such hypothetical scenario-based approaches contribute to the exploration of the public’s perceptions towards the automated bus service, the predicted adoption intention may not be materialized as the users are not exposed to the real bus service and develop a different set of criteria in interacting with the autonomous bus service [22]. Thus, exploring public perception and acceptance of automated buses is crucial to deploy this automation technology to the public realm. To fill this research gap, focusing on real-life experiences and public perception of a fully automated public bus service operation in Barkabystaden, Stockholm, we were interested in knowing how bus adopters and non-adopters assessed their perceptions towards automated buses and how these attitudinal factors would influence the likelihood of using this new technology. This study could be used for both policymakers and private industries to create new business models and services and promote adoption of emerging technologies.
The remainder of this paper is organized as follows. The next section contains a review of the literature on the public’s perceptions towards automated buses, followed by a description of the survey and analysis method. Then, we present the results of the survey, the estimation results based on multinomial logistic regression models are discussed. Lastly, the paper is concluded with some discussions on future directions.
2. Survey and Data Collection
The survey targeted both adopters and non-adopters of the automated bus service in Barkabystaden, Stockholm, Sweden. It included public’s perceptions towards the bus service. The study area and survey design are described in this section.
2.1. Study Area
The data were collected via an online survey in Barkabystaden, Stockholm, Sweden. Barkarbystaden is the largest housing development project in Northern Europe and plans for 18,000 new homes, 140 blocks, and 10,000 new workplaces until 2030. Barkarbystaden is developed with the most sustainable and modern public transport solutions available. By 2023, a complete solution consisting of automated door-to-door shuttles, an electrified Bus Rapid Transit (BRT) with automated city buses, and a new Mobility as a Service (MaaS) solution will be in place [23].
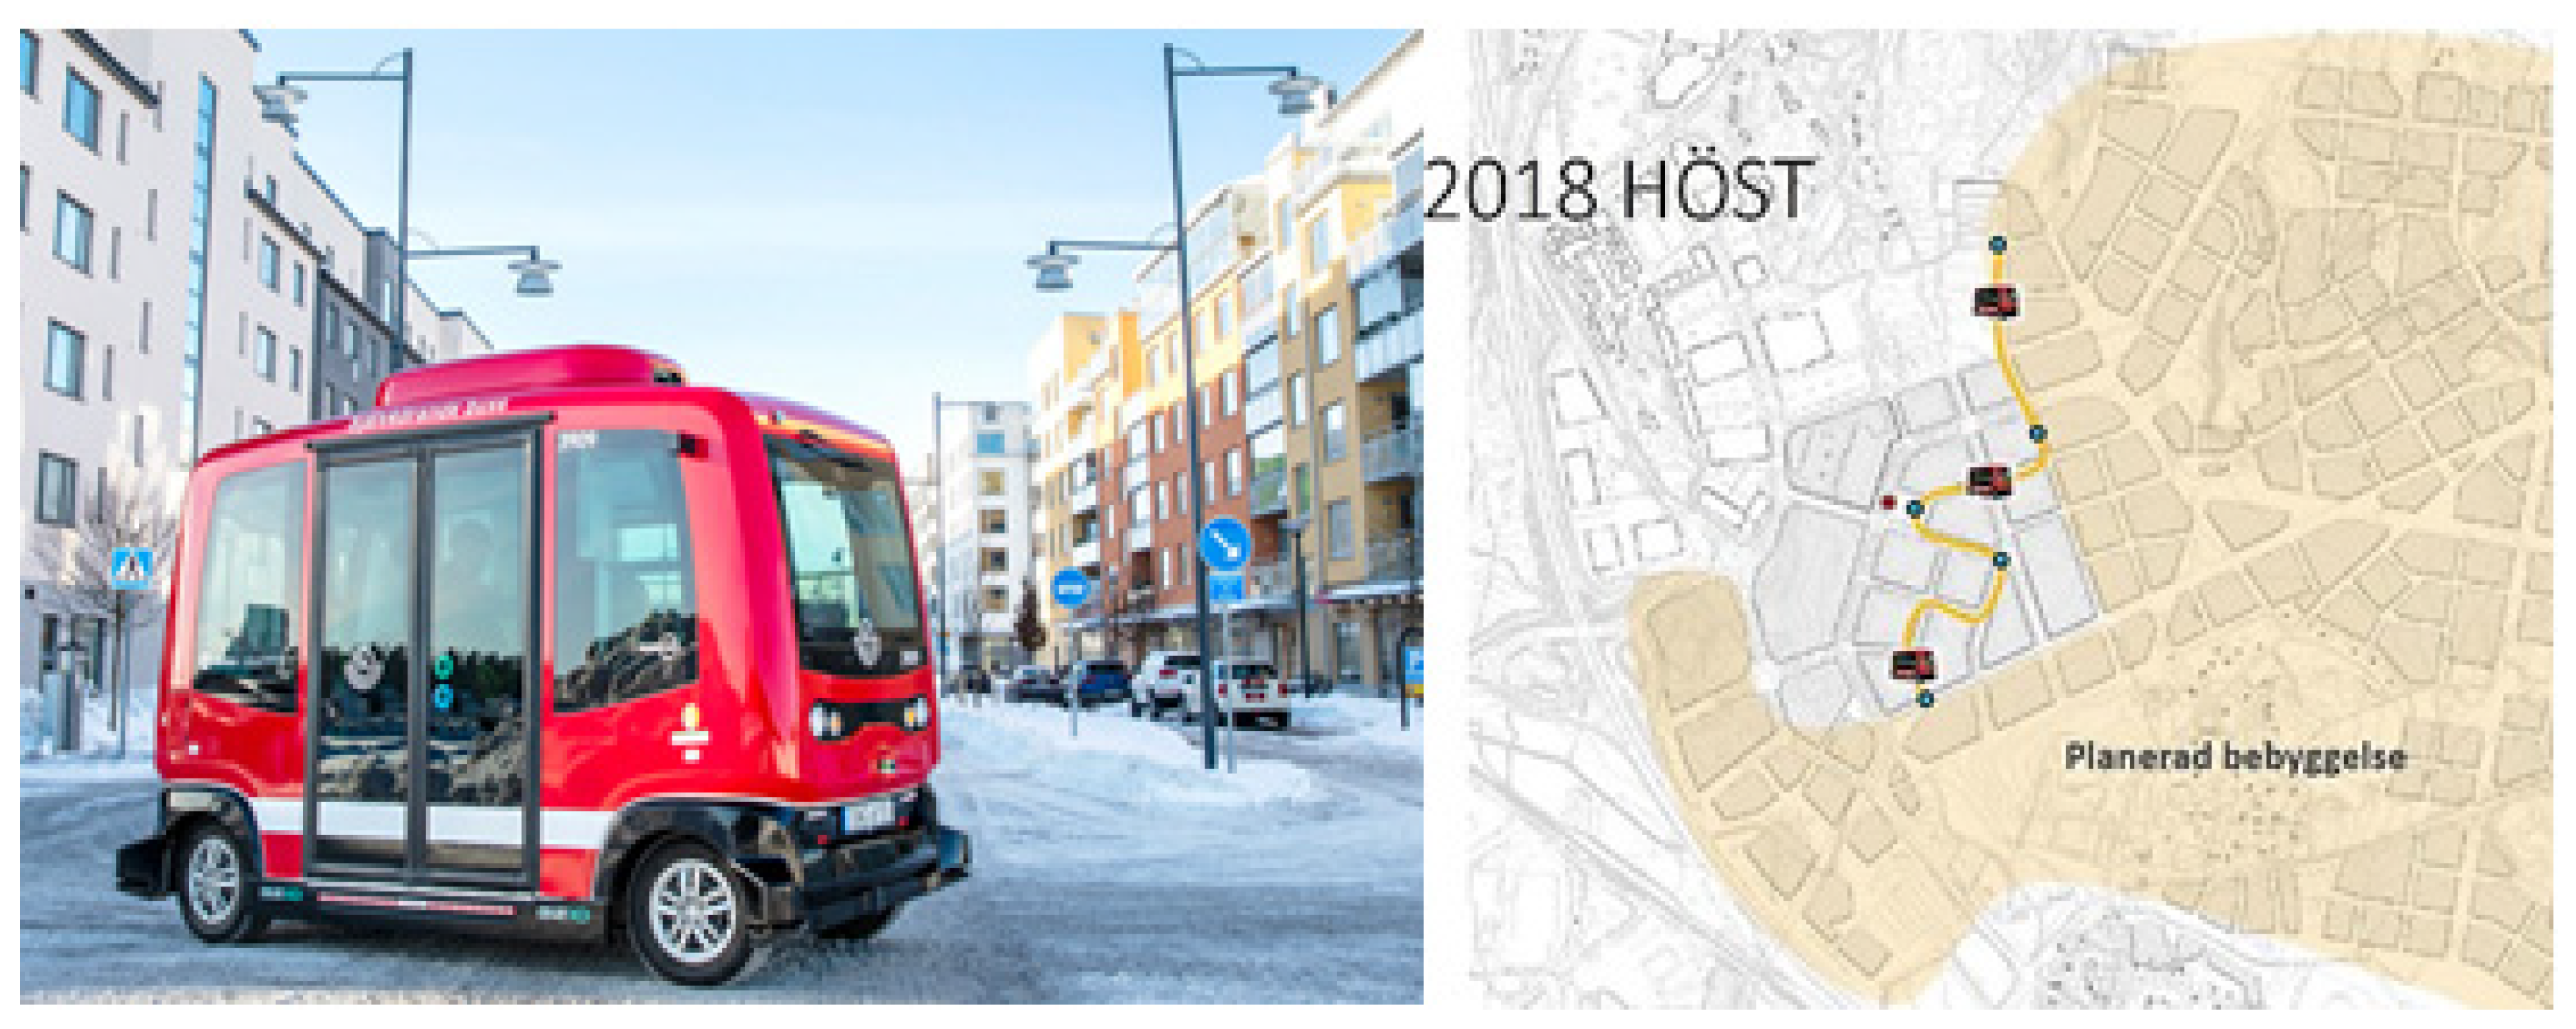
Since October 2018, automated buses have been operating in Barkabystaden as public transport line 549. Line 549 is the first public transport line in the world with automated electric buses on a regular, scheduled service. The buses have space for twelve passengers (six seated and six standing) (See Figure 1 Left, for an image of an automated bus). The automated buses operate between newly built residential blocks, Herrestaskolan and Stora Torget, where a switch to regular bus lines could take place (See Figure 1 Right, for the automated bus route). Currently, the length of the line is 2.5 km, and it is planned that the service route would be doubled in 2020. The current maximum speed is 12 km/h; later, the speed would reach 18 km/h. The automated buses are combined with high-speed buses between Barkarby station, Barkarby city, and Akalla. By integrating a first/last mile feeder service with a public transport service, the aim is to provide a better door-to-door travel experience.
2.2. Survey and Data Collection
Since this research aimed to investigate the public’s perceptions of the current automated bus service, the target respondents were recruited among residents and workers who work or live along the automated bus line in Barkabystaden. Three waves of panel data were collected from an online survey company in March, September, and December 2019, respectively. In this study, we focused on the analysis of the first survey wave.
The first survey waves’ questions consisted of three parts. First, all respondents answered a series of five-point Likert-scale (‘strongly disagree’ to ‘strongly agree’) questions related to their perceptions towards the automated bus service. Specifically, we captured public perception of driving speed and travel time about the automated bus system with three items and the perception of the system safety with two items in this survey. The second section asked questions regarding the respondents’ behavioral intention to use or accept the automated buses. The respondents were asked whether they were aware of the automated buses on the public road in Barkabystaden and whether they had taken the automated bus ride before. For those who had taken the automated bus ride before, we asked follow-up questions related to the automated bus usage (i.e., frequency, reasons to ride, etc.). For individuals who had not taken automated buses before, we asked about their intention to take the bus ride in the future. The final section assessed the characteristics of the survey participants. The socio-demographic characteristics, such as age range, gender, annual income range, education level, and employment status were reported by the respondents.
3. Data Analysis
The data used in this study were collected from the first survey wave. The respondents were asked to report how long they had been living and working in the area, and how familiar they were with the bus line. Ultimately, responses from 505 out of 518 respondents were used in the analysis.
The descriptive statistics of the main socio-demographic variables and other characteristics of the respondents are reported in Table 1. Gender was almost equally distributed: 55.4% of the respondents were females, 44.6% were males. The people participating in the survey were relatively young, which was due to our survey area (Barkabystanden); a newly developed area with a relatively young population. 44.8% of the respondents has mid-level income between 300,000 SEK (about 27,500 EUR) and 700,000 SEK (about 64,000 EUR), while 20.8% denied to provide income information. Additionally, the employment status of the participants was assessed—76.1% of participants stated that they were currently employed and 7.1% were students. 52.1% of the respondents had a Master’s degree, which was higher than the average in Sweden. As for the residential and job location, 92.1% of the respondents lived nearby a bus line, 8.9% worked nearby the bus line, while the remaining 2.0% were visitors that neither lived or worked nearby. Lastly, around 75% of the participants stated they owned cars.
4. Results
4.1. Descriptive Analysis of Automated Bus Adoption and Usage Behavior
Table 2 presents the awareness and usage of the automated bus. 87.9% reported they had seen the automated buses in Barkabystaden, while 11.3% were aware of a public transport service by an automated bus in Barkabystaden, but had not seen it before; only 0.8% reported that they did not know of the existence of the automated bus system. In addition, we examined the adoption of automated buses. Although 99.2% of the respondents knew that the bus service existed in Barkabystaden, only 24.3% had taken a ride with it. However, 86.4% of the respondents, who had not taken the automated bus before, indicated that they would take an automated bus ride in the future (hereafter called ‘prospective adopters’). Only a remaining 13.6% of people, with no experience in taking the automated bus, did not indicate a propensity to take such a bus ride (hereafter called ‘non-adopters’). This finding suggests that although the adoption rate of the new technology is not high, the attitude towards automated buses is still positive in general among most respondents.
The results also indicate that 88.6% of automated bus adopters used the service no more than five times, while only 6.5% and 4.9% used it 6–10 times and more than 10 times, respectively. Similarly, when the respondents were asked how often they used automated buses on their daily trips, 81.3% of the respondents reported they took the automated bus ride once a week, 13.8% on 2–3 days a week, while only 4.9% tokk the bus ride more than three days a week. This finding implies that, at least in the near term, participants exhibited less frequent automated bus use.
Besides, adopters provided explanations for why they had taken the automated buses for the first time. The majority of adopters stated they took automated buses just for fun, another 9.8% reported they took the ride for buying daily groceries or other shopping purposes, and only 2.4% and 1.6% have taken automated bus rides for work and school, respectively.
4.2. Public Perceptions Towards the Automated Buses: Adopters and Non-Adopters
Various studies have proposed that behavioral intention could be predicted by public perceptions and attitudes towards new products or services. The more positive perceptions and attitudes individuals have, the stronger their intention to conduct a certain behavior [24,25,26,27,28,29]. To have a better understanding of future adoption of the automation technology, it is important to examine respondents’ perceptions of the current bus system. The publics’ perceptions towards the automated bus service were measured with seven items in this study. Table 3 illustrates the public’s perceptions related to the driving speed, reliability and convenience, and safety of automated buses and discusses the attitudinal response differences among adopters, prospective adopters, and non-adopters.
4.2.1. Perception of Driving Speed and Travel Time
The perception of driving speed and travel time of the bus service was assessed with three items: ‘I feel the driving speed of the automated bus service is higher/lower than the regular bus’; ‘Given same travel distance and route, I feel that travel time of taking an automated bus is longer/shorter than taking a regular bus’; ‘Given same travel distance and route, I feel that travel time of taking an automated bus is longer/shorter than driving a car’.
Table 3 shows that the perceived driving speed of the automated bus is not high—the majority of participants answered that an automated bus would be slower or much slower than a regular bus. Among the three subgroups, non-adopters had the most negative perception. 71.2% of them stated that they believed the driving speed of the automated bus was much lower than the regular bus, while 21.2% answered the speed was lower, only 7.7% stated that the speed would be same, while no one stated that the automated bus would be faster or much faster than the regular bus. Similar trends were found in both adopters and prospective adopters. Nearly 90% reported they believed the speed of the automated buses would be lower or much lower than the regular buses. These findings suggest that the speed limits of the automated buses may lead to lower adoption of automated buses.
Not surprisingly, with respect to the length of the travel time, the majority of participants stated that, given the same travel distance and route, they felt that the travel time of taking an automated bus would be longer or much longer than taking a regular bus. Only 8.1% of adopters, 5.4% of prospective adopters, and 1.9% of non-adopters believed the length of the trip time would be shorter than taking a conventional bus. Similar findings were found when compared with the travel time of driving a car. The respondents of all subgroups reported negative perception towards their feeling of the length of the trip time compared to driving a car. Among them, 58.5% of the adopters, 45.5% of the prospective adopters, and 67.3% of the non-adopters reported that compared to driving a car, the travel time of taking an automated bus would be much longer. This finding implies that the probability of being unwilling to ride in automated buses would increase for participants who regard the new transportation mode takes a too long time to travel and consequently could not meet their travel needs.
4.2.2. Perception of Reliability and Convenience
The perception of reliability and convenience of the automated bus system was measured with two items: ‘I feel that the reliability of the AB service is better/worse than the reliability of the regular bus.’; ‘I feel that the convenience of an AB service is better/worse than the convenience of a regular bus’.
Our analysis pointed out that public perception of the reliability of the automated bus was relatively low. The majority of respondents reported they believed the reliability of the automated bus service would be the same or worse than the reliability of a regular public bus service. Non-users expected lower reliability overall. Only 13.4% of non-users reported their perception of the reliability of the automated buses would be better than the conventional buses. In terms of how convenient the system was to the public, the majority of respondents indicated that they assumed the convenience of the automated buses would be the same to conventional buses.
4.2.3. Perception of Safety
The arrival of automation technology is expected to increase safety for drivers, pedestrians, and cyclists [2]. From a psychological perspective, it is critical to understand the influence of perceived safety on the acceptance of the automated bus system. If people cannot perceive sufficient safety from their riding experience, they cannot be expected to use the new transport mode. For this study, the public’s perception of safety was measured by two items on a five-point scale. The first item indicated if people felt safe enough, when there was no operator or steward onboard to monitor the vehicle operations and provide customer service; whereas, the second item indicated the public’s safety perception towards the automated bus system when there was an operator or steward onboard.
According to our results, the presence of an onboard steward had a strong positive impact on the respondents’ perceived safety. It was found that when an employee is onboard to provide customer service, the majority of respondents stated they would feel the automated bus was safe enough. In particular, when an employee is onboard to monitor operations and provide customer service, 36.6% of adopters, 24.9% of the prospective users, and 19.2% of non-users stated that they felt the bus ride to be extremely safe. In contrast, the perceived safety was negative when there is no employee onboard. In addition, differences were found among subgroups. In particular, without an operator onboard, non-adopters exhibited more unsafe feelings—28.8% of the non-adopters reported they felt extremely unsafe, whereas only 3.8% expressed the same feeling with an operator onboard.
4.3. Principal Component Analysis
As the public’s attitudes towards transportation modes are important to the decision to take the bus system, seven observed attitudinal factors are included in the automated buses adoption model. Some attitudinal variables are likely to be closely correlated, and multicollinearity may lead to biased estimates. To address this issue and obtain uncorrelated independent variables, a principal component analysis (PCA) model was conducted to explore the interrelationships among these attitudinal statements and to define new combined attitudinal indicators.
Table 4 summarizes the results of the principal component analysis. Cronbach’s alpha for the overall scale was 0.72. The factor loadings, which were higher than the threshold of 0.5, were considered to be the most dominant variables in the new combined component. Accordingly, three new factors were classified in the PCA model. The first component clustered people who perceived the driving speed of the automated buses as high. The second component identified individuals who perceived the reliability and convenience of the automated buses as high. The last component was characterized by the perception of safety, indicating individuals who felt safe when taking the automated bus ride.
5. Impact of Perceptions on the Adoption of the Automated Bus Service
To test what kind of factors would influence the acceptance of automated buses, multinomial logistic regression models were used in this study. For adopters, the model was statistically significant, χ2 (df = 5) = 37.8, p < 0.05. The pseudo-R2 value was moderate with Nagelkerke = 0.27. For people who had not taken the bus before, the Pseudo-R2 (Nagelkerke) value was 0.23. The χ2 test achieved a significance of p < 0.05. The results of both models are presented in Table 5.
The results provide insights about how attitudinal variables influence individuals’ willingness to use the automated bus service. As shown in Table 5, the perceived safety of the new service was found significant in influencing the acceptance of the automated buses for both adopters and people who had not taken the new mode before. This indicated that people a perceiving higher level of safety tended to judge automated buses more favorably and were more likely to use the bus service. Safety is one of the major basic human needs, as people place highly exacting requirements on transportation safety [30,31,32,33]. Thus, it is critical to enhance the perceived safety to the widespread deployment of the automation technology in the future. Furthermore, the results revealed that those who felt the driving speed of the automated bus was high were more willing to take the bus. Hence, bus companies need to undertake efforts to increase the public’s perception of the driving speed of the bus service and, thus enhance the travelers’ intention to travel by this mode. Similarly, the results revealed that a high perception of reliability and convenience of the service was positively correlated with the probability of adopters and potential adopters to use the service.
In addition to attitudinal variables, we included a measure of ‘use frequency of public transportation mode’ as a predictor of the intention to use the bus. Compared with different subgroups, our findings indicated that the usage frequency of the public transportation mode was not found as a significant predictor for the intention to use the technology among adopters. However, since the automation technology has not been widely commercialized yet, only a few people had interactions with this new transportation mode so far. As an emerging and innovative transportation mode, the automated bus is expected to attract a high share of regular public transport users in the future.
Further, we explore the relationship between willingness to take the bus and the socio-demographic characteristics (i.e., gender, age, and annual income) of the respondents. Some empirical studies found that gender and income both played significant roles in the intention to accept a new technology [18,34]; however, such findings were not found in this study. Thus, income and gender were removed from the final model, as they were not significant. The exception of a significant social-demographic factor was age. Empirical evidence shows that younger people are enthusiastic about experiencing new technologies, while older people are more cautious about interacting with a new technology [26,35]. In line with the previous literature, our results suggest that age plays an important role in determining technology acceptance among people who have not taken the bus before.
6. Conclusions and Discussions
The introduction of public transport services by automation technology will potentially change the way public transit services are operated and enhance mobility in the coming decades. Automation technology will only become widely used if automated services are accepted by the public. Although previous studies have contributed to the literature on the adoption behavior of the new transport mode, several gaps exist in this field of research. First, the effort to understand what factors and to what extent they affect public’s acceptance and adoption of the automated public transport mode is very limited. Second, as a new emerging technology, most existing studies measured public perception and acceptance of this new transport mode based on hypothetical scenarios rather than the collection of actual behavioral data in real-life situations. The participants lacking knowledge or riding experience of this new public transportation system might express much more positive or negative views, and thus cause biased estimates and misleading results.
To address these research gaps, based on a dataset collected at Barkarbystaden, Stockholm, this study first examined the awareness and usage behaviors of the automated buses service operated as a part of regular public transport in Stockholm, Sweden. The results are representative of the perception of not only passengers who had experienced the automated bus ride, but also potential adopters and non-adopters. Further, it examined what factors could influence passengers’ behavioral intentions of the automated buses in the real world. The findings provide valuable guidance for public transport operators in designing inclusive and attractive automated bus systems.
The results of the statistical analysis show that although 99.2% of the participants were aware of the existence of the automated bus service in Barkabystaden, only about 20% had used the system. Moreover, among the adopters, roughly 90% stated they took the bus ride no more than five times, and roughly 75% stated they took the bus ride for the first time just for fun and curiosity. These findings imply that the deployment and adoption of the automated bus ride as a fully functional public transport service was still at an early stage; people had not yet taken this new transportation mode as part of their daily commute. In terms of public perceptions of the automated bus service, the results revealed that in general, the public perception of the driving speed was not high. Comparing the differences in attitudinal responses of adopters and non-adopters, the authors found that people, who had not taken an automated bus before, had a more negative perception of the safety and driving speed of the bus service than people who had taken the bus before. The presence of onboard operators has a positive impact on respondents’ perceived safety. The majority of adopters, prospective adopters, and non-adopters stated that they feel the automated bus safe enough when an employee is onboard to provide customer service.
Furthermore, multinomial logistic regression models were used to test the association between a range of variables and the adoption of the automated bus service. Our analysis pointed out that the perception of traffic safety, driving speed, and reliability and convenience of the automated bus system were essential factors of successful public transport. Policies addressing these attitudinal factors could support the adoption process. The results also indicated that travel behavior characteristics are important for predicting behavior intentions. As an emerging and innovative transportation mode, the automated bus is expected to attract a high share of regular public transportation mode users and the young generation in the future. The findings could help policymakers address this issue by allowing them to proactively develop marketing strategies to increase acceptance among different groups of people.
The current research provides an empirical assessment of public perceptions towards automated bus services and advances our understanding of the relations between attitudinal factors and public acceptance of the new bus system. As the number of automated bus users grows, individuals will become more familiar with automation technology. Moreover, as the automated bus service improves, the overall quality of the service will change over time. To be more specific, at the moment, the maximum speed of the automated buses in the mixed traffic environment on the public road in Stockholm is around 10 km/h and would reach 18 km/h in the next few years. Meanwhile, both the service route and size of the buses would be doubled in the future. This study is based on the first wave of surveys; both awareness and adoption rates are expected to be increased in the second and third waves. In addition, concerns about speed, safety, reliability and convenience would influence passengers’ willingness to take automated buses. A longitudinal tracking study based on panel survey data will be done in the next step to explore whether public perceptions would change, and whether improved perceptions of the automated buses would help to increase ridership. Lastly, the development of automated public travel mode is still in the early phase. To promote a new technology and increase the market share, it is necessary to understand the needs of potential consumers. It would be important in future studies to identify how well the new bus service satisfies current and potential users’ travel demands and to understand what factors prevent from using the new public transport mode.
Author Contributions
Conceptualization, J.G. and Y.S.; Data curation, J.G. and Y.S.; Formal analysis, J.G. and Y.S.; Funding acquisition, A.P.B.; Investigation, J.G. and Y.S.; Methodology, J.G., Y.S., and C.A.; Project administration, Y.S.; Resources, A.P.B.; Supervision, Y.S. and C.A.; Writing—original draft, J.G.; Writing—review and editing, J.G., Y.S., C.A. and A.P.B. All authors have read and agreed to the published version of the manuscript.
Funding
This research is funded by Drive Sweden, Vinnova, under grant number 2018-02759. This work is also supported by Cost Action CA16222 (WISE-ACT), a European-wide network that explores the wider impacts of Autonomous and Connected Transport and Marie Skłodowska–Curie fellowship (No. 754462).
Acknowledgments
The authors want to express our gratitude to Nobina AB and ITRL—the Integrated Transport Research Lab at KTH Royal Institute of Technology, who granted the authors access to the “Barkarby MMiB”.
Conflicts of Interest
The authors declare no conflict of interest.
References
- Hoogendoorn, R.; van Arem, B.; Hoogendoorn, S. Automated Driving, Traffic Flow Efficiency, and Human Factors. Transp. Res. Rec. 2014, 2422, 113–120. [Google Scholar] [CrossRef]
- Fagnant, D.; Kockelman, K. Preparing a Nation for Autonomous Vehicles: Opportunities, Barriers and Policy Recommendations. Transp. Res. Part A 2015, 77, 167–181. [Google Scholar] [CrossRef]
- Greenblatt, J.B.; Saxena, S. Autonomous Taxis Could Greatly Reduce Greenhouse-Gas Emissions of US Light-duty Vehicles. Nat. Clim. Chang. 2015, 5, 860–863. [Google Scholar] [CrossRef]
- Harper, C.D.; Hendrickson, C.T.; Mangones, S.; Samaras, C. Estimating Potential Increases in Travel with Autonomous Vehicles for the Non-driving, Elderly and People with Travel-restrictive Medical Conditions. Transp. Res. Part C 2016, 72, 1–9. [Google Scholar] [CrossRef]
- Wadud, Z.; MacKenzie, D.; Leiby, P. Help or Hindrance? The Travel, Energy and Carbon Impacts of Highly Automated Vehicles. Transp. Res. Part A 2016, 86, 1–18. [Google Scholar] [CrossRef] [Green Version]
- Letter, C.; Elefteriadou, L. Efficient Control of Fully Automated Connected Vehicles at Freeway Merge Segments. Transp. Res. Part C 2017, 80, 190–205. [Google Scholar] [CrossRef]
- Dong, X.; DiScenna, M.; Guerra, E. Transit User Perceptions of Driverless Buses. Transportation 2019, 46, 35–50. [Google Scholar] [CrossRef]
- Narayanan, S.; Chaniotakis, E.; Antoniou, C. Shared Autonomous Vehicle Services: A Comprehensive Review. Transp. Res. Part C 2020, 111, 255–293. [Google Scholar] [CrossRef]
- Sener, I.; Zmud, J.; Williams, T. Measures of Baseline Intent to Use Automated Vehicles: A Case Study of Texas Cities. Transp. Res. Part F 2019, 62, 66–77. [Google Scholar] [CrossRef]
- Madigan, R.; Louw, T.; Wilbrink, M.; Schieben, A.; Merat, N. What Influences the Decision to Use Automated Public Transport? Using UTAUT to Understand Public Acceptance of Automated Road Transport Systems. Transp. Res. Part F 2017, 50, 55–64. [Google Scholar] [CrossRef]
- Lutin, J.M.; Kornhauser, A.L. Application of Autonomous Driving Technology to Transit-Functional Capabilities for Safety and Capacity. Transp. Res. Rec. 2014, 14, 0207–0222. [Google Scholar]
- Ainsalu, J.; Arffman, V.; Bellone, M.; Ellner, M.; Haapamäki, T.; Haavisto, N.; Josefson, E.; Ismailogullari, A.; Lee, B.; Madland, O.; et al. State of the Art of Automated Buses. Sustainability 2018, 10, 3118. [Google Scholar]
- Tirachini, A.; Antoniou, C. The Economics of Automated Public Transport: Effects on Operator Cost, Travel Time, Fare and Subsidy. Econ. Transp. 2020, 21, 100151. [Google Scholar] [CrossRef]
- Badia, H.; Jenelius, E. Feeder Transit Services in Different Development Stages of Automated Buses: Comparing Fixed Routes versus Door-to-Door Trips. Transp. Res. Procedia 2020, 47, 521–528. [Google Scholar] [CrossRef]
- CityMobil2-Cities Demonstrating Automated Road Passenger Transport. Available online: https://cordis.europa.eu/project/id/314190/reporting (accessed on 11 November 2019).
- WEpods Project. DAVI–Dutch Automated Vehicle Initiative. Available online: https://davi.connekt.nl/wepods-project/ (accessed on 11 November 2019).
- Barkabystaden. Autopilot in Barkaby. 2019. Available online: https://www.nobina.com/sv/sverige/nyheter/Forsta-sjalvkorande-bussarna-i-linjetrafik/# (accessed on 25 October 2019).
- Alessandrini, A.; Alfonsi, R.; Site, P.D.; Stam, D. Users’ Preferences towards Automated Road Public Transport: Results from European Surveys. Transp. Res. Procedia 2014, 3, 139–144. [Google Scholar] [CrossRef] [Green Version]
- Wicki, M.; Bernauer, T. Public Opinion on Route 12. Interim Report on the First Survey on the Pilot Experiment of an Automated Bus Service in Neuhausen am Rheinfall; ISTP Paper Series 3; Institute of Science, Technology and Policy (ISTP), ETH Zurich: Zurich, Switzerland, 2018. [Google Scholar]
- Nordhoff, S.; de Winter, J.; Madigan, R.; Merat, N.; van Arem, B.; Happee, R. User Acceptance of Automated shuttles in Berlin-Schöneberg: A Questionnaire Study. Transp. Res. Part F 2018, 58, 843–854. [Google Scholar] [CrossRef] [Green Version]
- Winter, K.; Wien, J.; Molin, E.; Cats, O.; Morsink, P.; van Arem, B. Taking The Automated Bus: A User Choice Experiment. In Proceedings of the 2019 6th International Conference on Models and Technologies for Intelligent Transportation Systems (MT-ITS), Cracow, Poland, 5–7 June 2019. [Google Scholar]
- Chee, E.P.N.; Susilo, Y.O.; Pernestål-Brenden, A.; Wong, Y.D. Which Factors Affect Willingness-to-pay for Automated Vehicle Services? Evidence from Public Road Deployment in Stockholm, Sweden. Eur. Transp. Res. Rev. 2020, 12, 1–17. [Google Scholar] [CrossRef]
- Pernestål, A.; Susilo, Y.; Jenelius, E.; Hafmar, P. SARA1 Results Report Shared Automated Vehicles-Research and Assessment in a 1st Pilot; Drive Sweden, SARA1 Project; ITRL-Integrated Transport Research Lab. KTH Roya l Institute of Technology: Stockholm, Sweden, 2018. [Google Scholar]
- Beck, L.; Ajzen, I. Predicting Dishonest Actions using the Theory of Planned Behavior. J. Res. Personal. 1991, 25, 285–301. [Google Scholar] [CrossRef]
- Carrion, C.; Levinson, D. Value of Travel Time Reliability: A Review of Current Evidence. Transp. Res. Part A 2012, 46, 720–741. [Google Scholar] [CrossRef] [Green Version]
- Payre, W.; Cestac, J.; Delhomme, P. Intention to Use a Fully Automated Car: Attitudes and a Priori Acceptability. Transp. Res. Part F 2014, 27, 252–263. [Google Scholar] [CrossRef] [Green Version]
- Anania, E.; Rice, S.; Walters, N.; Pierce, M.; Winter, S.; Milner, M. The Effects of Positive and Negative Information on Consumers’ Willingness to Ride in a Driverless Vehicle. Transp. Policy 2018, 72, 218–224. [Google Scholar] [CrossRef]
- Liljamo, T.; Liimatainen, H.; Pöllänen, M. Attitudes and Concerns on Automated Vehicles. Transp. Res. Part F 2018, 59, 24–44. [Google Scholar] [CrossRef]
- Panagiotopoulos, I.; Dimitrakopoulos, G. An Empirical Investigation on Consumers’ Intentions towards Autonomous Driving. Transp. Res. Part C 2018, 95, 773–784. [Google Scholar] [CrossRef]
- Lord, D.; Persaud, B. Estimating the Safety Performance of Urban Road Transportation Networks. Accid. Anal. Prev. 2004, 36, 609–620. [Google Scholar] [CrossRef]
- Hadayeghi, A.; Shalaby, A.; Persaud, B. Development of Planning Level Transportation Safety Tools using Geographically Weighted Poisson Regression. Accid. Anal. Prev. 2010, 42, 676–688. [Google Scholar] [CrossRef]
- Wang, X.; Jin, Y.; Abdel-Aty, M.; Tremont, P.; Chen, X. Macrolevel Model Development for Safety Assessment of Road Network Structures. Transp. Res. Rec. 2012, 2280, 100–109. [Google Scholar] [CrossRef]
- Abdel-Aty, M.; Lee, J.; Siddiqui, C.; Choi, K. Geographical Unit Based Analysis in the Context of Transportation Safety Planning. Transp. Res. Part A 2013, 49, 62–75. [Google Scholar] [CrossRef]
- Bansal, P.; Kockelman, K.; Singh, A. Assessing Public Opinions of and Interest in New Vehicle Technologies: An Austin Perspective. Transp. Res. Part C 2016, 67, 1–14. [Google Scholar] [CrossRef]
- Howard, D.; Dai, D. Public Perceptions of Self-driving Cars: The Case of Berkeley, California. In Proceedings of the Transportation Research Board 93rd Annual Meeting, Washington, DC, USA, 12–16 January 2014. [Google Scholar]
Figure 1.
(Left): Automated bus in Barkabystaden; (Right): The automated bus route. (Source: https://www.drivesweden.net/; https://www.barkarbystaden.se).
Figure 1.
(Left): Automated bus in Barkabystaden; (Right): The automated bus route. (Source: https://www.drivesweden.net/; https://www.barkarbystaden.se).


Table 1.
Socio-demographic characteristics of the respondents.
| Variable | Classification | # of Cases | Percentage |
|---|---|---|---|
| Gender | Female | 280 | 55.4 |
| Male | 225 | 44.6 | |
| Age | Less than 25 | 33 | 6.5 |
| 25–34 | 163 | 32.3 | |
| 35–44 | 138 | 27.3 | |
| 45–54 | 69 | 13.7 | |
| 55–64 | 45 | 8.9 | |
| More than 65 | 57 | 11.3 | |
| Annual Income (thousand kronor) | Less than 100 | 9 | 1.7 |
| 100–299 | 54 | 10.7 | |
| 300–499 | 120 | 23.8 | |
| 500–699 | 106 | 21.0 | |
| 700–899 | 66 | 13.1 | |
| More than 900 | 45 | 8.9 | |
| Do not want to specify | 105 | 20.8 | |
| Employment | Working | 364 | 72.1 |
| Self-employed | 20 | 4.0 | |
| Students | 36 | 7.1 | |
| Others | 85 | 16.8 | |
| Education | Primary school | 15 | 3.0 |
| Upper secondary school | 144 | 28.5 | |
| Bachelor degree | 83 | 16.4 | |
| Master degree | 257 | 50.9 | |
| Doctoral degree | 6 | 1.2 | |
| Live or work nearby (within 250 m of the routes) | Live nearby | 465 | 92.1 |
| Work nearby | 45 | 8.9 | |
| Neither live or work nearby | 10 | 2.0 | |
| Car ownership | Own a car | 381 | 75.4 |
| Have no car | 124 | 24.6 |
Table 2.
Awareness and usage of automated buses.
| Variable | Classification | # of Cases | Percentage |
|---|---|---|---|
| Are you aware that there are automated buses (ABs) in Barkabystaden? | Yes, and I have seen it myself. | 444 | 87.9 |
| Yes, but I have not seen it myself. | 57 | 11.3 | |
| No, I do not. | 4 | 0.8 | |
| Have you taken an AB ride? | Yes, I have taken an AB ride before. | 123 | 24.3 |
| No, but I intend to take an AB ride in the future. | 330 | 65.3 | |
| No, and I will not take an AB ride in the future. | 52 | 10.3 | |
| How many times have you taken ABs? | 1–5 times. | 109 | 88.6 |
| 6–10 times. | 8 | 6.5 | |
| 11–15 times. | 2 | 1.6 | |
| More than 15 times. | 4 | 3.3 | |
| How many days did you use ABs last week? | One day. | 100 | 81.3 |
| 2–3 days. | 17 | 13.8 | |
| 4–5 days. | 4 | 3.3 | |
| More than five days. | 2 | 1.6 | |
| What is the main purpose you used the AB service for the first time? | To go to work. | 3 | 2.4 |
| To go to school/further education. | 2 | 1.6 | |
| Buying daily groceries or other shopping purposes. | 12 | 9.8 | |
| Just for fun. | 93 | 75.6 | |
| Others. | 13 | 10.6 |
Table 3.
Public perceptions about the automated bus ride.
| Adopters (n = 123 ) | Prospective Adopters (n = 330) | Non-Adopters (n = 52 ) | ||
|---|---|---|---|---|
| Variable | # of Cases (Percentage) | # of Cases (Percentage) | # of Cases (Percentage) | |
| Perception of driving speed and travel time | ||||
| I feel that the driving speed of the AB service is _____ than a regular bus. | Much lower | 68 (55.3) | 157 (47.6) | 37 (71.2) |
| Lower | 40 (32.5) | 137 (41.5) | 11 (21.2) | |
| Same | 4 (3.3) | 27 (8.2) | 4 (7.7) | |
| Higher | 10 (8.1) | 4 (1.2) | 0 (0.0) | |
| Much higher | 1 (0.8) | 5 (1.5) | 0 (0.0) | |
| Given same travel distance and route, I feel that travel time of taking an AB ride is _____ than taking a regular bus. | Much longer than taking a regular bus | 52 (42.3) | 75 (22.7) | 26 (50.0) |
| Longer than taking a regular bus ride | 51 (41.5) | 185 (56.1) | 19 (36.5) | |
| Same | 10 (8.1) | 52 (15.8) | 6 (11.5) | |
| Shorter than taking a regular bus ride | 8 (6.5) | 13 (3.9) | 1 (1.9) | |
| Much shorter than taking a regular bus | 2 (1.6) | 5 (1.5) | 0 (0.0) | |
| Given same travel distance and route, I feel that travel time of taking an AB ride is _____ than driving a car. | Much longer than driving a car | 72 (58.5) | 150 (45.5) | 35 (67.3) |
| Longer than driving a car | 32 (26.0) | 121 (36.6) | 10 (19.2) | |
| Same | 12 (9.8) | 41 (12.4) | 5 (15.4) | |
| Shorter than driving a car | 5 (4.1) | 17 (5.2) | 2 (3.8) | |
| Much shorter than driving a car | 2 (1.6) | 1 (0.3) | 0 (0.0) | |
| Perception of reliability and convenient | ||||
| I feel that the reliability of an AB service is _____ than the reliability of a regular bus. | Much worse | 18 (14.6) | 10 (3.0) | 10 (19.2) |
| Worse | 29 (23.6) | 97 (29.4) | 14 (26.9) | |
| Same | 39 (31.8) | 137 (41.5) | 21 (40.5) | |
| Better | 26 (21.1) | 61 (18.5) | 6 (11.5) | |
| Much better | 11 (8.9) | 25 (7.6) | 1 (1.9) | |
| I feel that the convenience of an AB service is _____ than the convenience of a regular bus. | Much worse | 7 (5.7) | 2 (0.6) | 8 (15.4) |
| Worse | 31 (25.2) | 43 (13.0) | 6 (11.5) | |
| Same | 59 (48.0) | 210 (63.6) | 31 (49.6) | |
| Better | 22 (17.8) | 63 (19.1) | 5 (15.4) | |
| Much better | 4 (3.3) | 12 (3.6) | 2 (3.8) | |
| Perception of safety | ||||
| I feel _____ when there is no operator/steward on an AB. | Extremely unsafe | 13 (10.6) | 12 (3.6) | 15 (28.8) |
| Unsafe | 37 (30.1) | 109 (33.0) | 14 (26.9) | |
| Neutral | 34 (27.6) | 85 (25.8) | 16 (30.8) | |
| Safe | 26 (21.1) | 96 (29.1) | 3 (5.8) | |
| Extremely safe | 13 (10.6) | 28 (8.5) | 4 (7.7) | |
| I feel _____ when there is an operator/steward on an AB. | Extremely unsafe | 1 (0.8) | 6 (1.8) | 2 (3.8) |
| Unsafe | 8 (6.5) | 11 (3.3) | 2 (3.8) | |
| Neutral | 32 (26.0) | 96 (29.1) | 19 (36.5) | |
| Safe | 37 (30.1) | 135 (40.9) | 19 (36.5) | |
| Extremely safe | 45 (36.6) | 82 (24.9) | 10 (19.2) | |
Table 4.
Component matrix for principal components analysis.
| Factor | Statement | Component | ||
|---|---|---|---|---|
| 1 | 2 | 3 | ||
| Perception of driving speed and travel time | Perception of the driving speed of AB service compared with regular bus service. | 0.77 | - | |
| Perception of the travel time of taking an AB compared with taking a regular bus. | 0.84 | - | ||
| Perception of the travel time of taking an AB compared with driving a car. | 0.78 | - | ||
| Perception of reliability and convenience | Perception of reliability of an AB service compared with taking a regular bus. | 0.71 | - | |
| Perception of the convenience of an AB service compared with taking a regular bus. | 0.55 | - | ||
| Perception of safety | Perception of safety of an AB service when there is no operator/steward on an AB. | - | ||
| Perception of safety of AB service when there is an operator/steward on an AB. | 0.94 | |||
Table 5.
Estimation results for automated bus adoption and acceptance.
| Adopters | Potential Adopters | |||||
|---|---|---|---|---|---|---|
| Variable | Value | S.E. | Sig. | Value | S.E. | Sig. |
| Perception of driving speed and travel time | 0.79 | 0.32 | 0.01 | 0.63 | 0.20 | 0.01 |
| Perception of reliability and convenience | 0.96 | 0.28 | 0.00 | 0.81 | 0.19 | 0.00 |
| Perception of safety | 0.52 | 0.20 | 0.01 | 0.67 | 0.15 | 0.00 |
| Use frequency of public transportation mode | 0.05 | 0.19 | 0.80 | 0.53 | 0.17 | 0.00 |
| Age (Young 1; Old −1) | 0.40 | 0.40 | 0.32 | 0.72 | 0.34 | 0.03 |
| Constant | 2.45 | 1.37 | 0 | 2.27 | 0.97 | 0.02 |
| Nagelkerke | 0.27 | 0.23 | ||||
© 2020 by the authors. Licensee MDPI, Basel, Switzerland. This article is an open access article distributed under the terms and conditions of the Creative Commons Attribution (CC BY) license (http://creativecommons.org/licenses/by/4.0/).
Share and Cite
MDPI and ACS Style
Guo, J.; Susilo, Y.; Antoniou, C.; Pernestål Brenden, A. Influence of Individual Perceptions on the Decision to Adopt Automated Bus Services. Sustainability 2020, 12, 6484. https://0-doi-org.brum.beds.ac.uk/10.3390/su12166484
AMA Style
Guo J, Susilo Y, Antoniou C, Pernestål Brenden A. Influence of Individual Perceptions on the Decision to Adopt Automated Bus Services. Sustainability. 2020; 12(16):6484. https://0-doi-org.brum.beds.ac.uk/10.3390/su12166484
Chicago/Turabian StyleGuo, Jia, Yusak Susilo, Constantinos Antoniou, and Anna Pernestål Brenden. 2020. "Influence of Individual Perceptions on the Decision to Adopt Automated Bus Services" Sustainability 12, no. 16: 6484. https://0-doi-org.brum.beds.ac.uk/10.3390/su12166484
Note that from the first issue of 2016, this journal uses article numbers instead of page numbers. See further details here.