Solids Removal Efficiency of a Sedimentation Tank in a Peri-Urban Catchment
by
 , , and
Salvatore Falco
1, 
Giuseppe Brunetti
2,
Giovanna Grossi
3,*,
Mario Maiolo
4 ,
,
Michele Turco
1 and
Patrizia Piro
1 1
Department of Civil Engineering, University of Calabria, 87036 Rende, Italy
2
Institute for Soil Physics and Rural Water Management, University of Natural Resources and Life Sciences, 1190 Vienna, Austria
3
Department of Civil, Environmental, Architectural Engineering, and Mathematics—University of Brescia, 25123 Brescia, Italy
4
Department of Environment Engineering, University of Calabria, 87036 Rende, Italy
*
Author to whom correspondence should be addressed.
Sustainability 2020, 12(17), 7196; https://0-doi-org.brum.beds.ac.uk/10.3390/su12177196
Submission received: 5 August 2020
/
Revised: 30 August 2020
/
Accepted: 31 August 2020
/
Published: 3 September 2020
(This article belongs to the Collection Sustainability Challenges for Medium-Size Urban Systems)
Abstract
:At the outlet of the Vermicelli catchment—a peri-urban area located in the campus of University of Calabria (Cosenza, Southern Italy)—a sedimentation tank is located, aiming at collecting the basin surface runoff and improve its quality. First, experimental results of the treatment effects are here presented and analyzed. In addition, a monitoring campaign was conducted in order to characterize the particles transported by surface runoff and to determine the treatment efficiency of the tank. The analysis showed the presence of a pollutant load in the surface runoff of the Vermicelli basin and provided information on its particle-size distribution (PSD). Results were considered in terms of the treatment efficiency of the sedimentation tank, showing a good overall removal efficiency value, together with a high variability of the removal sedimentation efficiency. This variability is mainly due to the different grain size of the suspended solids and the characteristics of the rainfall event.
1. Introduction
Hydrological processes occurring in a watershed affect the quality and quantity of water conveyed at its outlet as runoff. In fact, surface runoff generated by the rain falling on the ground mobilizes solid particles and transports them downstream. According to the local climate and land cover characteristics, transported solid particles may consist of pollutants or be associated with pollutants and may raise quality and quantity issues in the lower part of the basin, where solid particles more easily settle. In addition, sediment transport could be a big issue in natural rivers, altering their geomorphology [1].
This is, namely an important topic in the field of environmental protection and for the protection of the receiving water bodies, often involving a proper treatment and management plan of the solid transport of rivers and creeks, besides those crossing urban areas.
Urbanization affects the development of urban drainage systems, as in urban environment the ongoing surface sealing produces a constant loss of natural areas with drastic effects following a storm, both in terms of runoff quantity and of its quality [2,3,4,5,6,7].The direct consequence is the excessive growth of the size of the sewer pipes and devices, as well as of the water discharge conveyed first to the treatment plants and then to the unloaded receiving waters.
In urban areas the different land use activities and the degree of waterproofing can produce different categories of pollutants and different surface runoff volumes. On average an increase in runoff volumes and a decrease in the number and size of mobilized particles is to be expected. On the other hand, polluted stormwater may reach the receiving body in a few drainage ditches rather than continuously along the side of the receiving body. Urban runoff may then contain high concentrations of pollutants. Therefore, dealing with urban drainage system management, it is crucial to control the concentration of total suspended solids, especially in the early parts of runoff where the pollutant concentration is expected to be the highest. In fact, the negative impact of the polluted stormwater can be mitigated by inline storages and subsequent treatment devices [8,9,10,11,12], which may also include constructed wetlands aiming at restoring ecosystem services [13].
Providing distributed stormwater control measures throughout the catchment, made of several first treatment tanks for stormwater close to vast paved areas, increases more generally the sustainability of water management, especially in view of various forms of reuse. In this perspective, it is useful to experiment these tanks technologically and to analyze their efficiency. This issue is properly accounted for in the general context of sustainable water management and in more specific Life Cycle Assessment (LCA), in terms of potential control of contamination risks and the different possibilities of reuse of water [14,15,16,17,18,19].
Flush stormwater tanks are storage devices designed to accommodate and retain the first portion of stormwater. They are undoubtedly among the best solutions aiming at reducing mostly particulate pollutants in stormwaters, which may also be a vector of other inorganic pollutants such as heavy metals. These works are traditional treatment systems, installed in urban environment to reduce the concentration of pollutants, such as particulate matter (PM), nutrients (phosphorus and nitrogen) and heavy metals [20,21] through the sedimentation process. The hydraulic and PM loadings of these systems are highly variable, and their effectiveness depends largely upon catchment characteristics, such as land use, traffic activity and rainfall events [22]. Other uncertainties for the evaluation of the efficiency of storage removal concern the nature of the pollutants diluted and transported by the stormwater and the spatial and temporal variability of their concentration inside the tank. In fact, several scientific studies have already shown that the pollutant load is influenced by numerous chemical, physical and biologic factors [23,24,25].
In order to characterize the pollutants, the particle-size distribution (PSD) must be analyzed. Therefore, information about influent PM PSD is useful for defining which treatment (physical or chemical) is the most effective one for removing targeted pollutants [26]. To mitigate PM inflows into receiving water bodies, Unit Operations (UOs) are utilized to separate PM from stormwater, primarily by discrete particle Type I sedimentation [27,28].
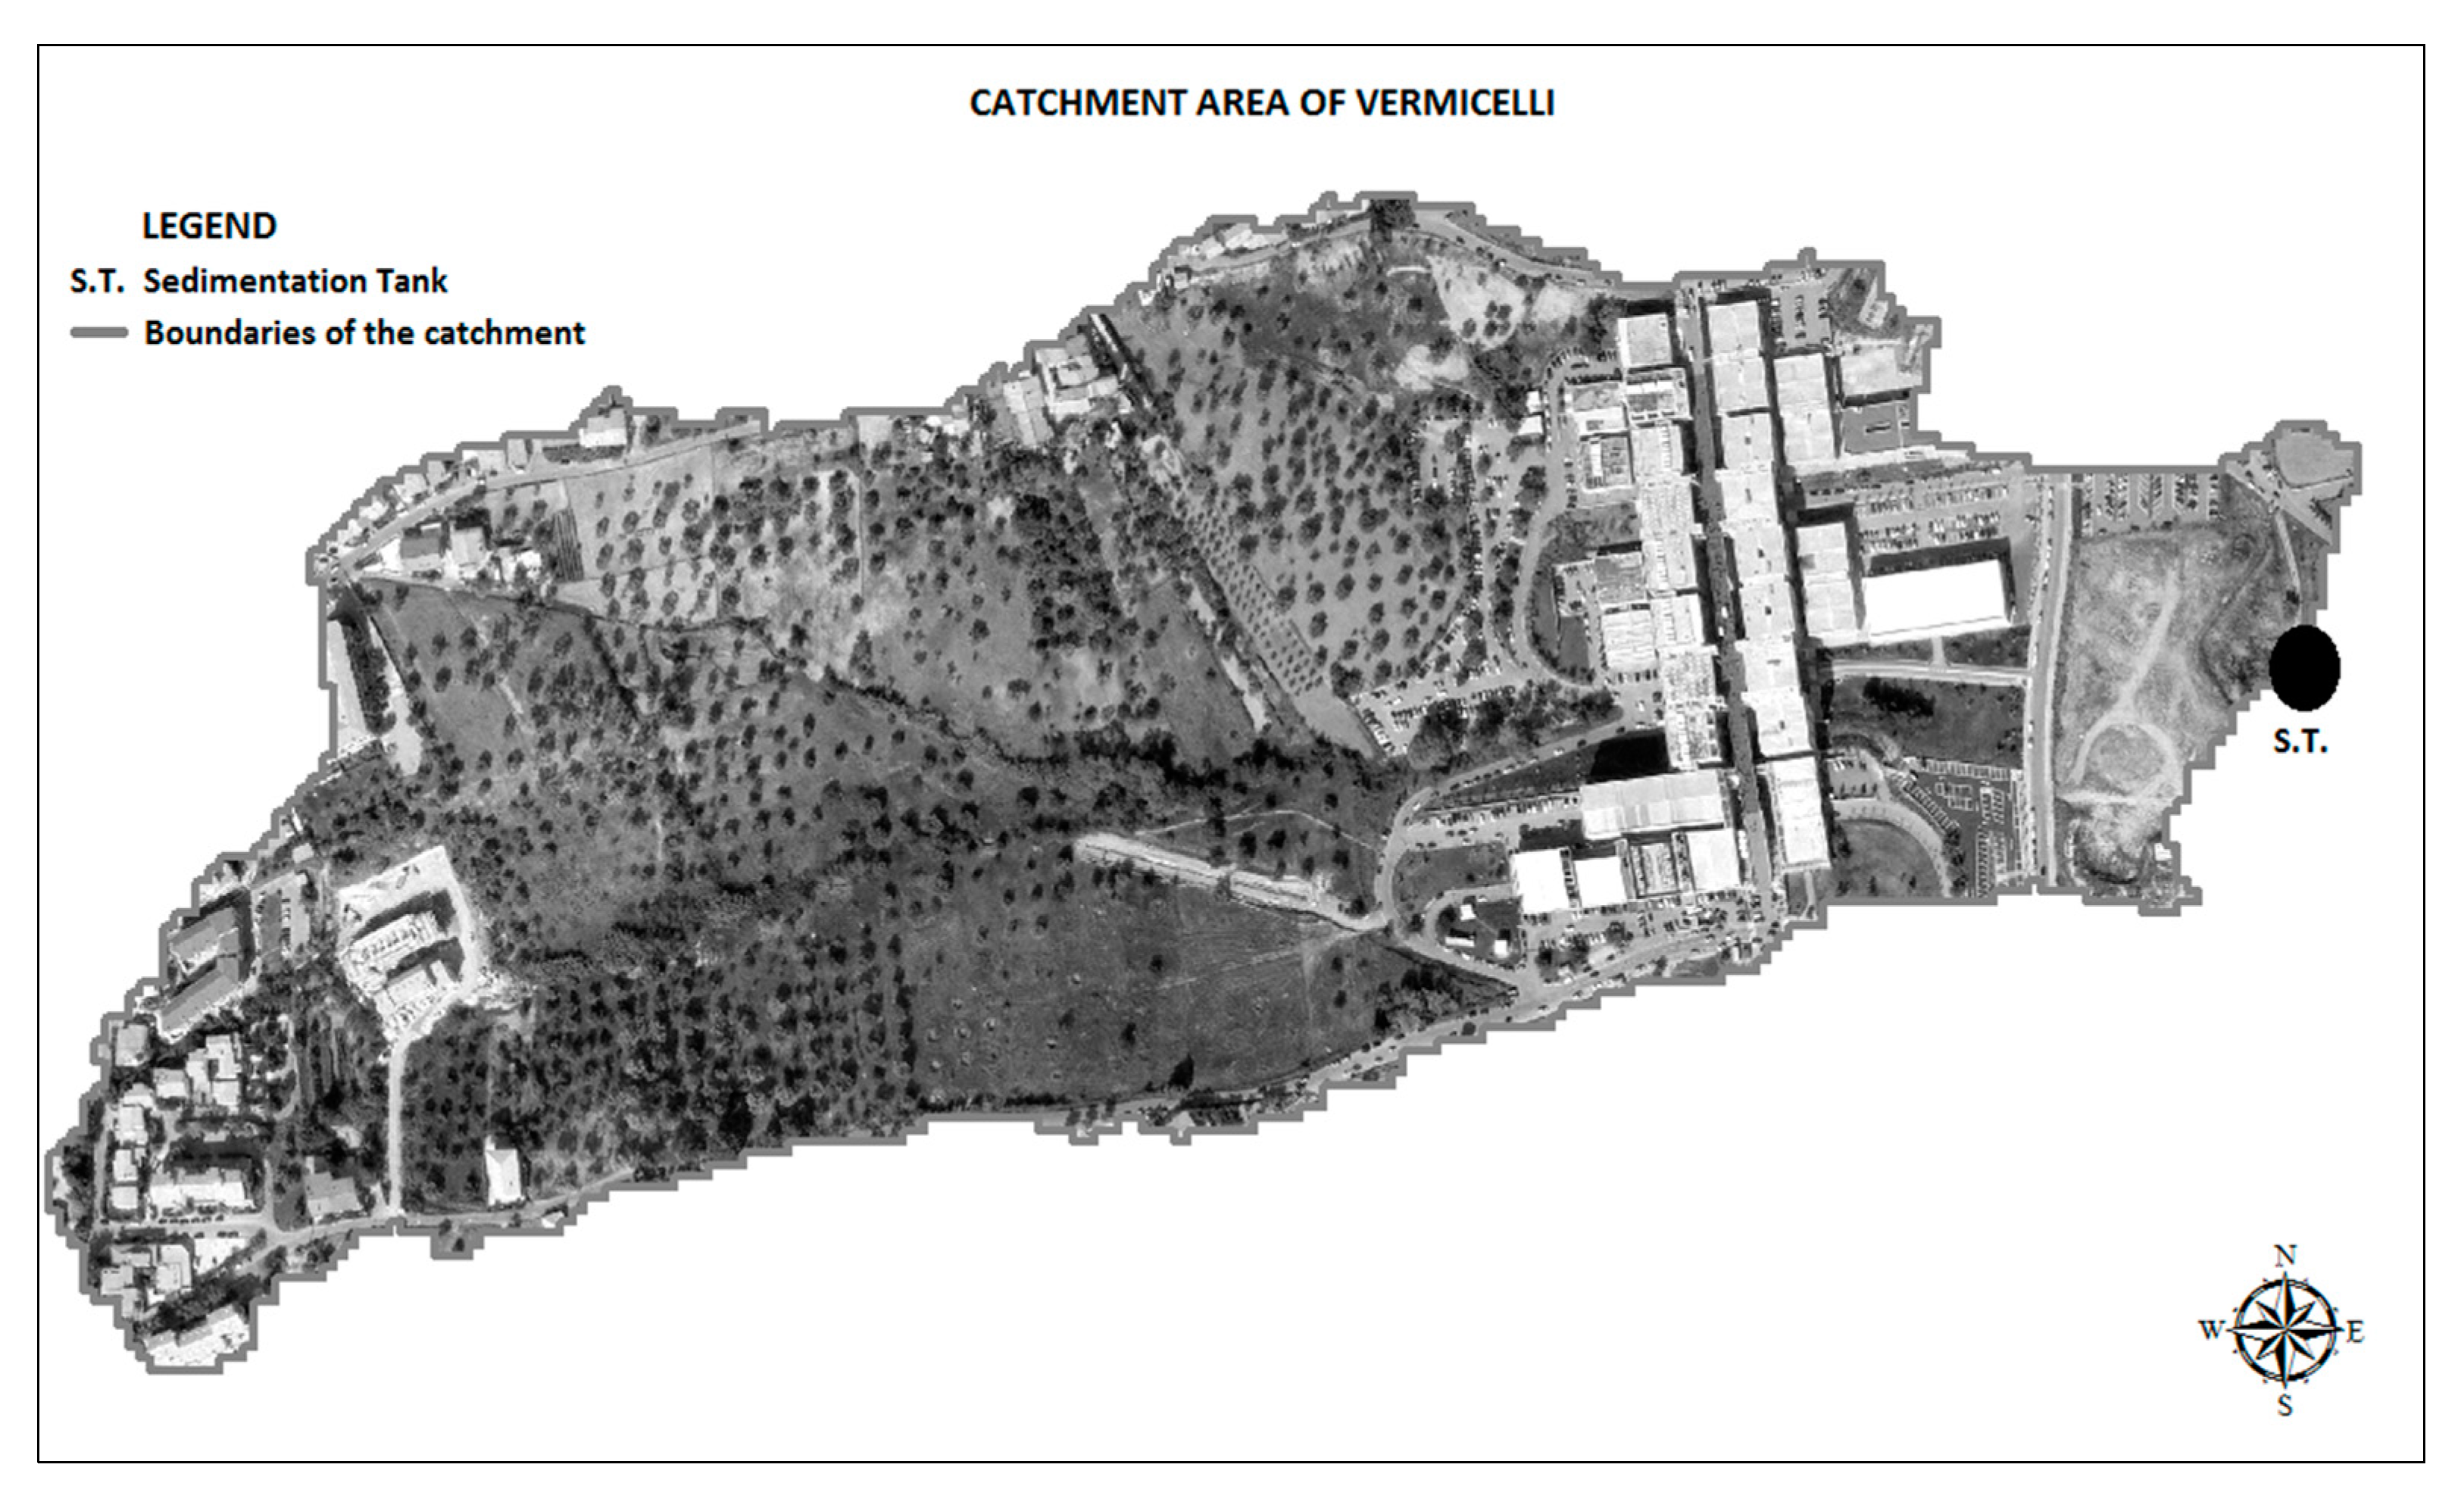
A case study is here presented that demonstrates the efficacy of a treatment system when it is applied to surface runoff produced in a catchment that is roughly 25% urbanized, with the remainder natural. The experimental water treatment plant is located at the outlet of the Vermicelli catchment of 28 ha on the campus of University of Calabria (Figure 1).The samples of water taken during the tests were used to define the particle-size distribution (PSD) and to determine the concentration and the mass of the total suspended solid (TSS). This analysis aimed at checking the performance of single components of the treatment plant for each considered storm, as well as at characterizing the overall performance of the system regardless of the removal process.
2. Experimental Facility and Procedure
2.1. Case Study Description
The Vermicelli basin (University of Calabria) covers about 28 ha. The drainage area consists of natural area for the 74% and urbanized area for the 26%. Average height of the catchment is 252 m ASL, between 272 m ASL (maximum height) and 210 m ASL (closing section of the catchment). The average slope is 2.4%; the length of the main reach is 919 m.
The experimental water treatment plant is located at the closure section of the catchment and consists of a sedimentation tank and a filtration unit: surface water coming into the plant is treated first by the sedimentation tank and subsequently by the filtration unit.
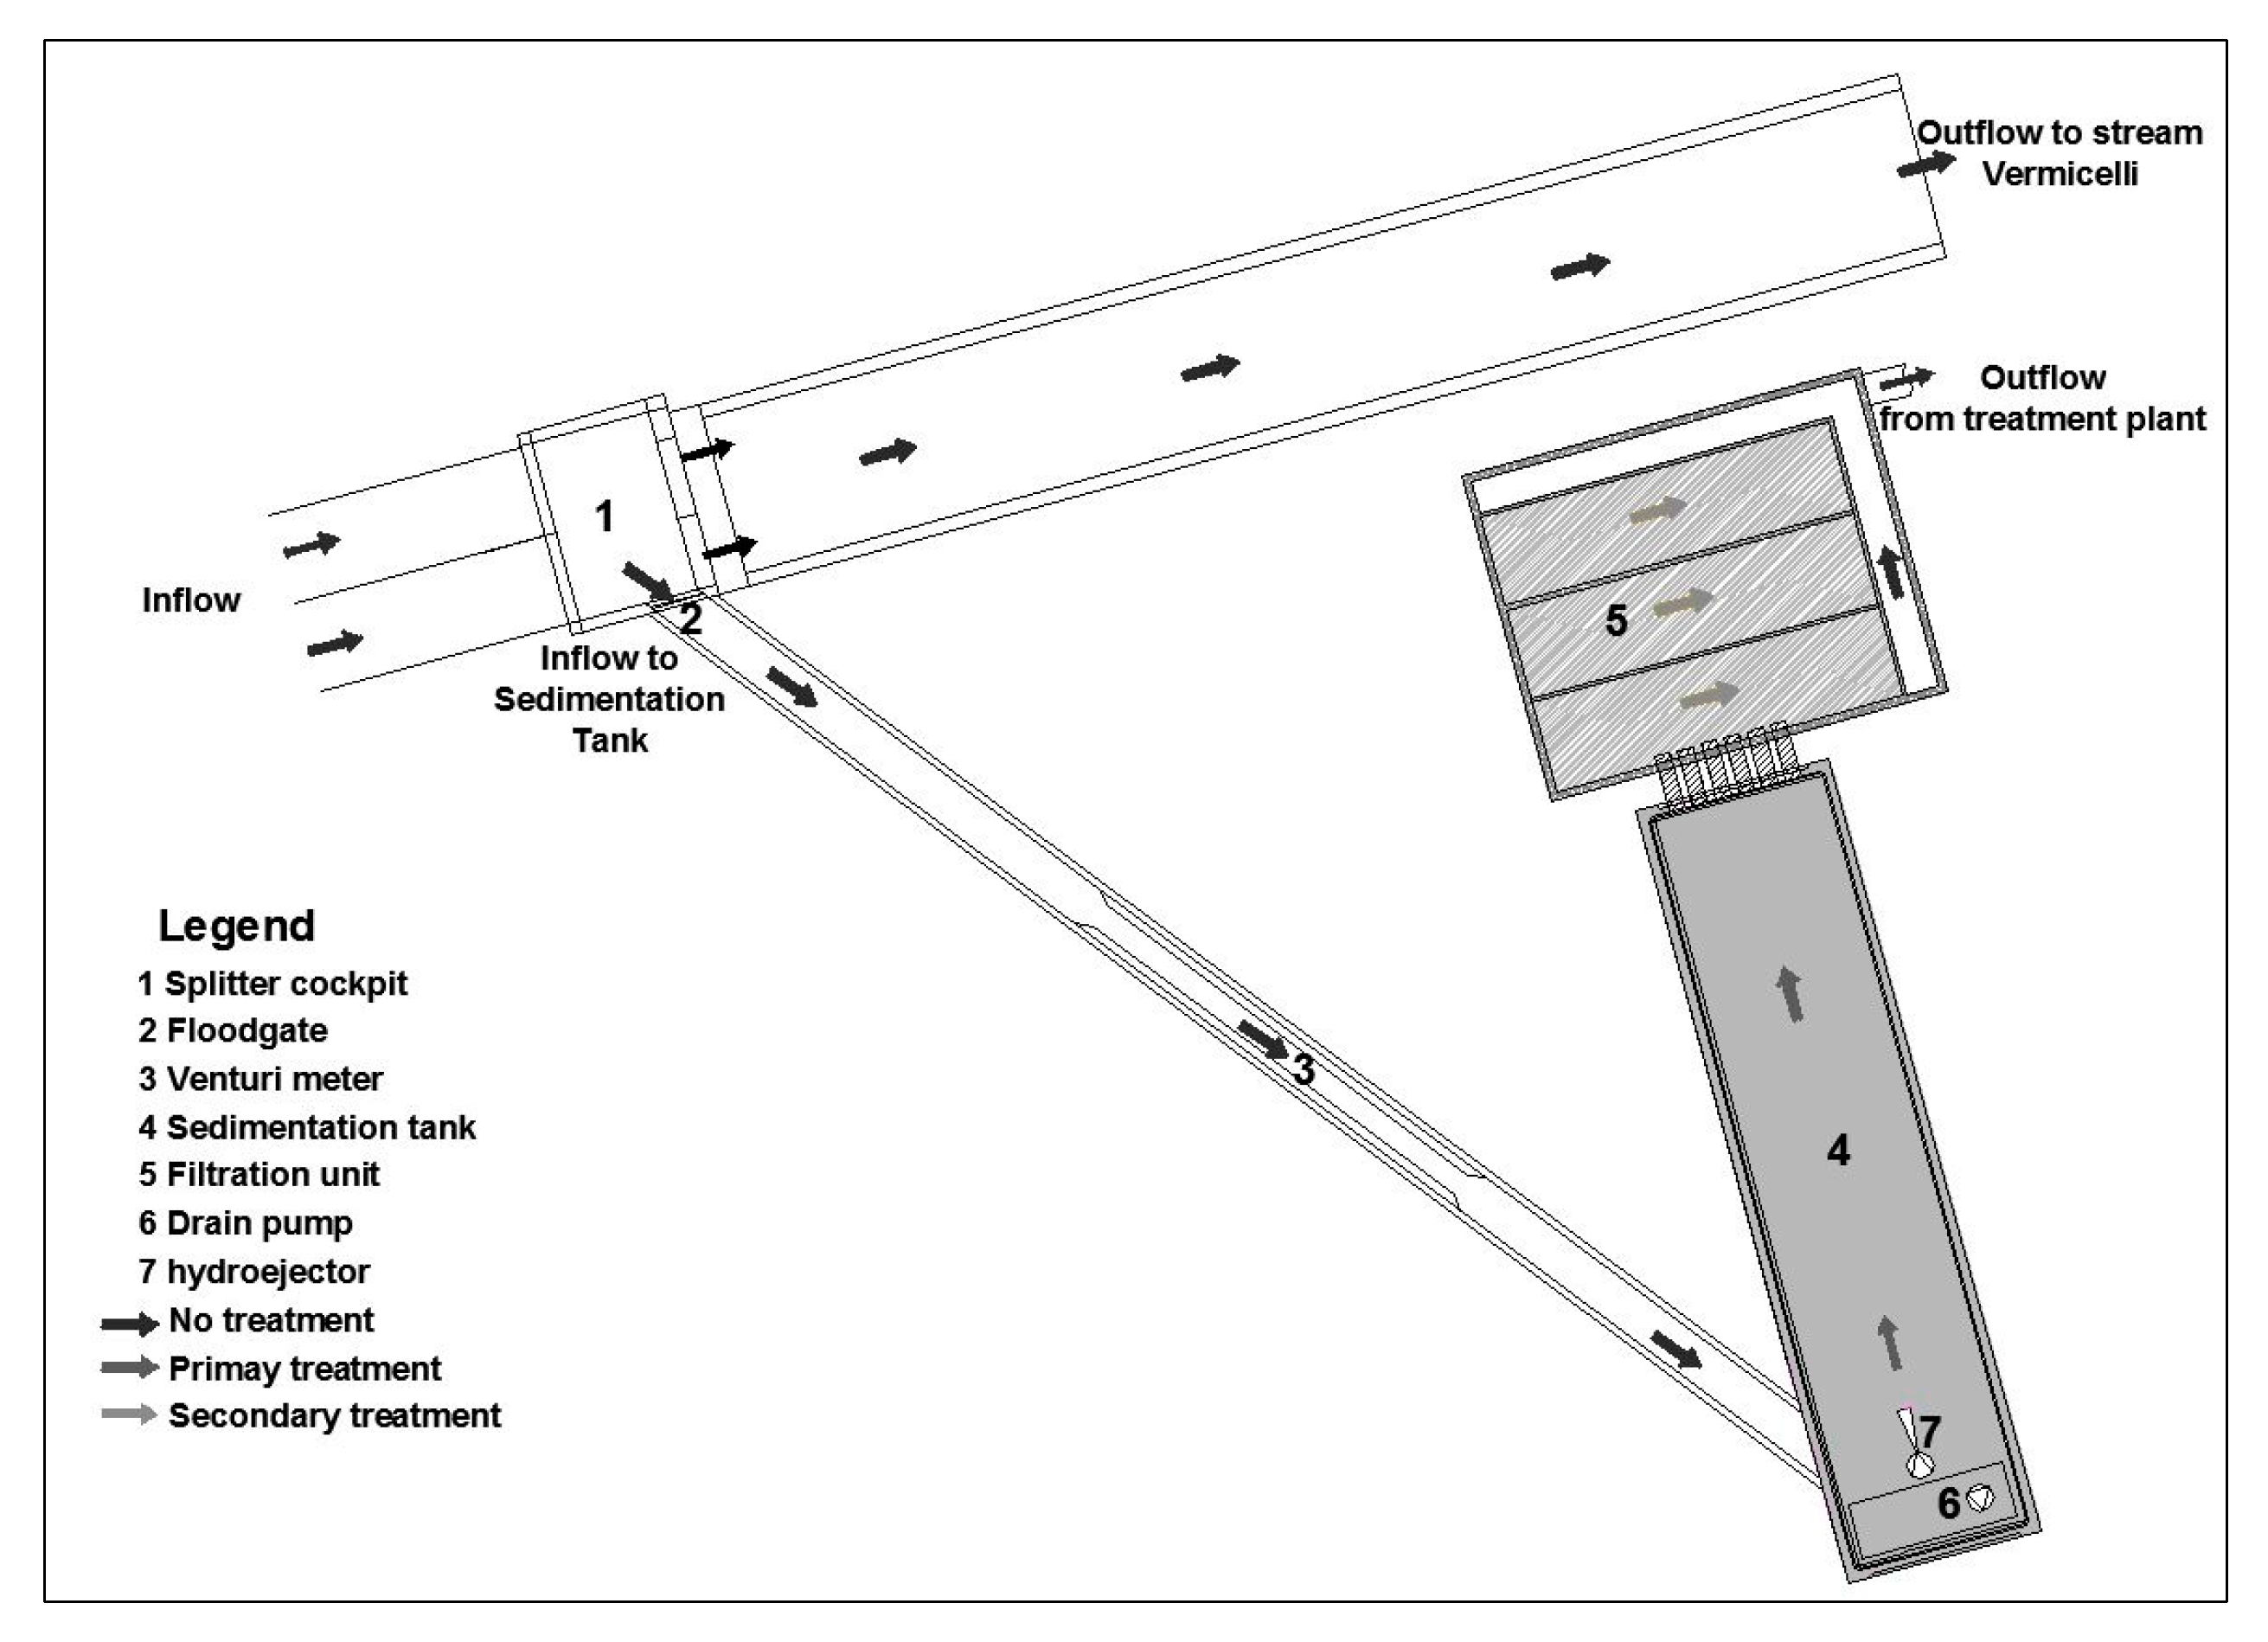
The sedimentation tank is responsible for the treatment of the coarse particles transported by the stormwater. The filtration unit carries out the task of retaining particles of lower dimension (diameter <20 µm) [29]. The outline of the experimental apparatus is shown in Figure 2. Its elements are:
- Stormwater splitter. The first portion of drained stormwater goes to the plant through a rectangular weir of 7 cm height, while the excess flow continues towards the Vermicelli stream. The cockpit has a slope towards the plant of 1%.
- Floodgate. The outflow to the plant is regulated by bulkhead.
- Venturi tube. It performs the measurement of the flow rates entering the plant. The measurable range is between 0.55 L/s and 17.27 L/s.
- Sedimentation tank. It is a rectangular basin (size 2.5 × 2.5 × 10 m). Its internal shape consists of sloping internal surfaces at corners and along the entire basic perimeter, is such as to avoid the concentrated accumulation of sedimented solids. In the sedimentation tank, sedimentation of the coarsest particles occurs. These are predominantly inorganic and ether-dispersed particulate matter (PM), having a diameter between 0.01 and 10,000 μm [30]. The main mechanism responsible for the removal of solid particles within the sedimentation tank is the sedimentation process of Type I [31]: solid particles follow independent trajectories and do not interact with each other. The sedimentation tank is equipped with an optimized system for draining and cleaning. This system consists of a drain pump (6) and a hydroejector (7).
- Filtration unit. The outflow from the sedimentation tank reaches the filtration unit through small ducts, in order to obtain a uniform distribution throughout the length of the filtering system. The filtration unit is divided into three rectangular compartments (110 cm × 410 cm), in which the filter packages are housed. The flow passes through the filter and flows towards the Vermicelli Creek. The filtration layer is divided into two parts: the first part is made of a layer of polyurethane, 2.5 cm thick; the second part is made of a layer of crushed olive stones. The polyurethane layer is used to block lightweight coarse material escaping the previous sedimentation treatment; the second layer filters the smaller particles. Recent studies [32] proved that this filtering system is able to discharge high flows, still keeping the filter width fairly high and hence enhancing the removal efficiency potential.
The layout of the treatment facilities was chosen according to the orography of the landscape, which is characterized, in this particular case, by considerable slopes and jumps in altitude. Therefore, a sharp turn in the flow direction was unavoidable between the conveyance channel and the Venturi tube and this abrupt change may induce turbulence. Further insights in the field of Computational Fluid Dynamics are needed to describe in more detail this phenomenon.
2.2. Experimental Campaign
Studies carried out on the plant concerned the qualitative and quantitative analysis of surface waters of the Vermicelli basin arriving at the plant and treated by the first flush tank with sedimentation effect.
The analyses were conducted through a planned monitoring campaign (Table 1).
2.3. Precipitation Analysis
A preliminary precipitation analysis was carried out to hydrologically characterize the catchment. Besides a two-year-long precipitation time series, starting on 1 January 2015 and ending on 31 December 2016, was selected for the analysis. The precipitation data were recorded every 1 min by a tipping-bucket rain gauge with a resolution of 0.254 mm and simultaneously saved on a hardware placed on site. Rain data were preprocessed for the identification of missing data and outliers and stored in an SQLite database for fast querying and analysis. The hydrological characterization of the recorded time series of observations was carried out in Python language. In particular, the duration, the peak and the total volume of single rainfall events were extracted. A Minimum Inter Event time of 3 h was adopted to identify independent events. Only precipitation events with a total volume higher than 5 mm were considered in the following analysis.
2.4. TSS Efficiency Evaluation
Total suspended solid (TSS) analysis was performed through the filtration test, with which the concentration of TSS (mg/L) for each tested sample was calculated.
It was then possible to determine the mass of TSS (1).
TSSi represents the concentration of total suspended solids in the volume Vi. The relationship (1) can be used to calculate: the mass of total suspended solids in the rainwater incoming into the sedimentation tank Mi,TSS; the mass of total suspended solids in the rainwater outgoing from the sedimentation tank Mout,TSS; the mass of total suspended solids in the rainwater caught by the sedimentation tank Mc,TSS.
After the mass was calculated, it was possible to determine the overall, catch and sedimentation removal efficiency of the sedimentation tank (2)–(4).
EO represents the overall removal efficiency; EC represents the catch removal efficiency; ES represents the sedimentation removal efficiency.
2.5. Particle-Size Distribution (PSD) through Malvern Mastersize 3000
PSD measurements were performed using the Malvern Mastersize 3000 instrument using laser diffraction technique (LD).
In a laser diffraction measurement, a laser beam passes through a dispersed particulate sample and the angular variation in intensity of the scattered light is measured. Large particles scatter light at small angles relative to the laser beam, while small particles scatter light at large angles. The angular scattering intensity data are then analyzed to calculate the size of the particles that created the scattering pattern using the Mie theory of light scattering. The particle size is reported as a volume equivalent sphere diameter.
The patented folded optical design in the Mastersizer 3000 provides an impressive particle size range from 10 nm up to 3.5 mm using a single optical measurement path. The Mastersizer 3000 uses a sequential combination of measurements with red and blue light sources to measure across the entire particle size range. Measurement of large particulates is provided by an advanced focal plane detector design able to resolve exceedingly small diffraction angles. Sensitivity to sub-100 nm particles, scattering light at wide angles, is achieved using advanced optics and a powerful 10 mW solid state blue light source.
On the basis of the measured PSD, characteristic values d50 and d90 were easily estimated.
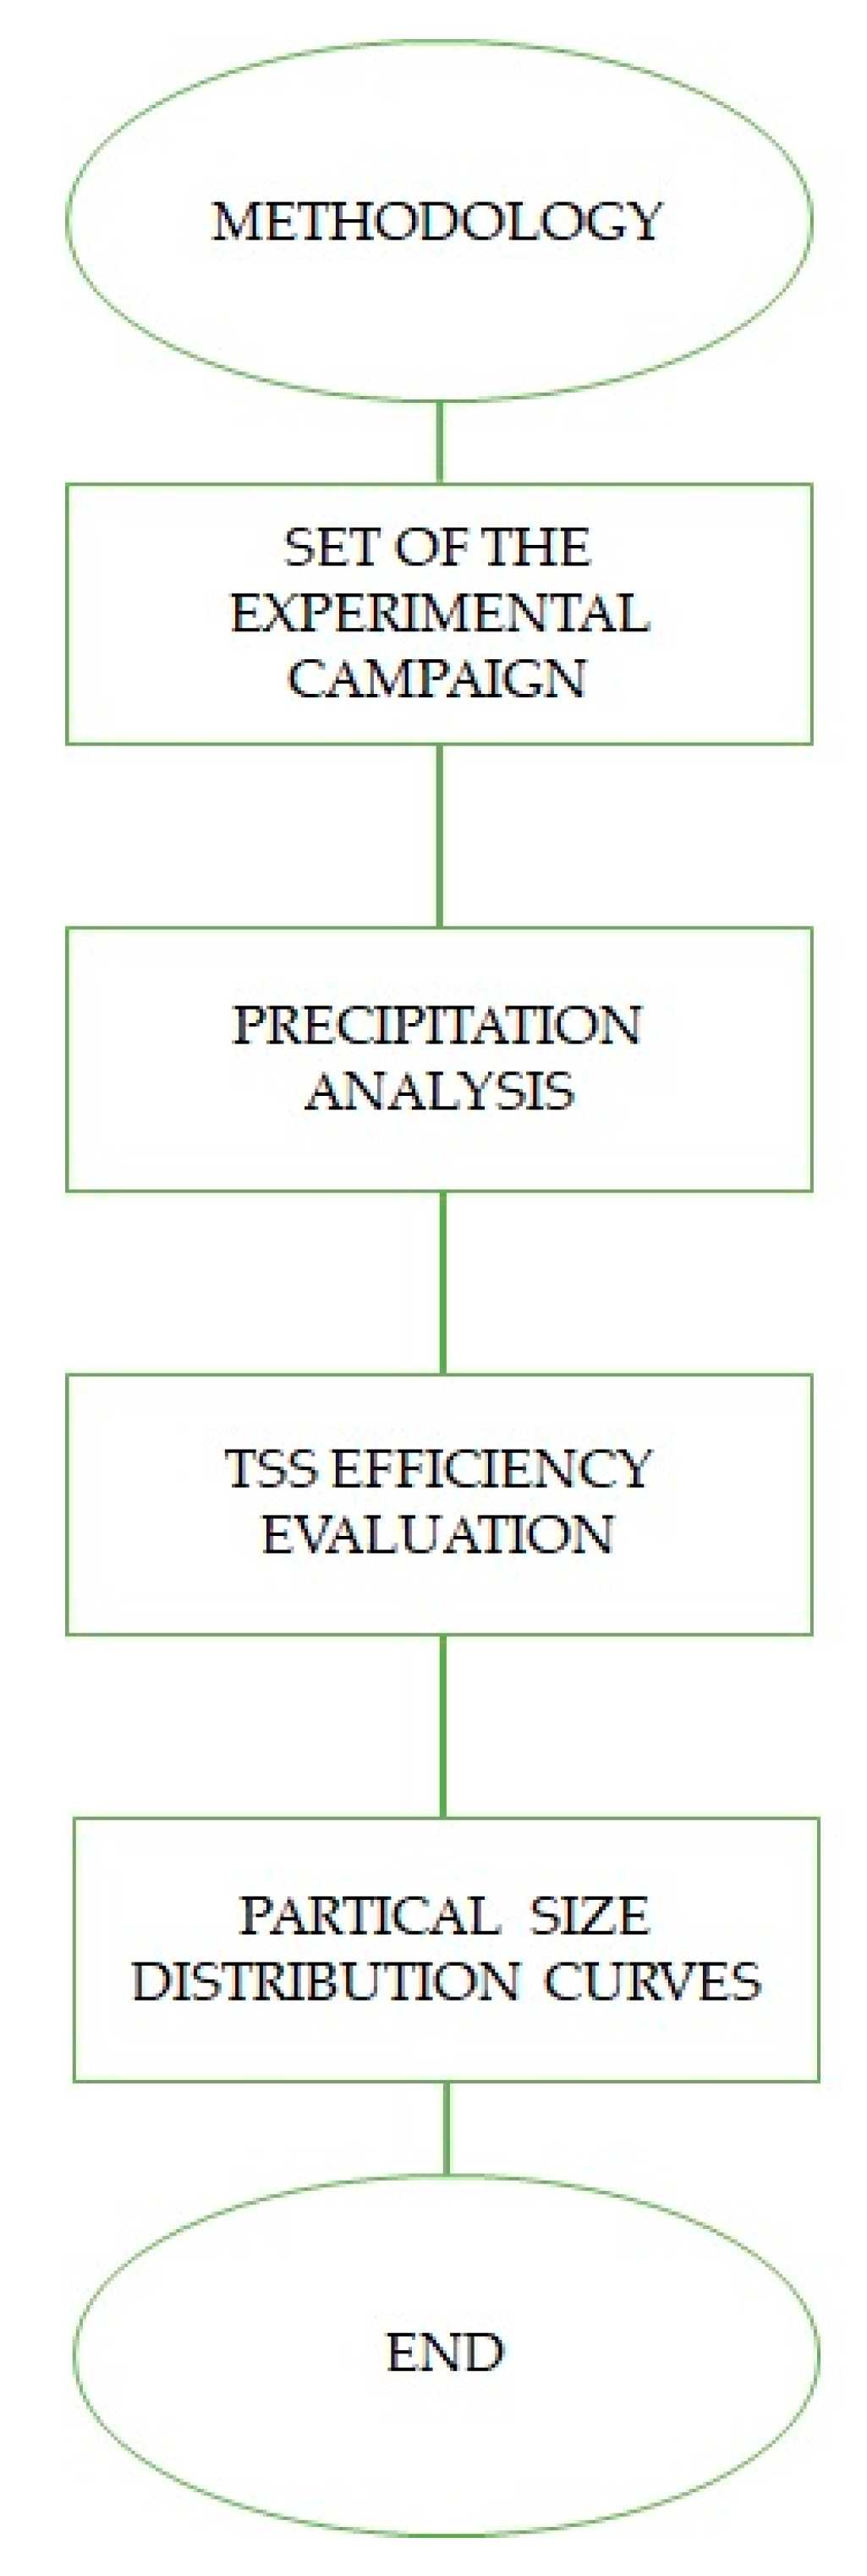
The methodological approach is summarized in Figure 3.
3. Results and Discussion
3.1. Precipitation Analysis
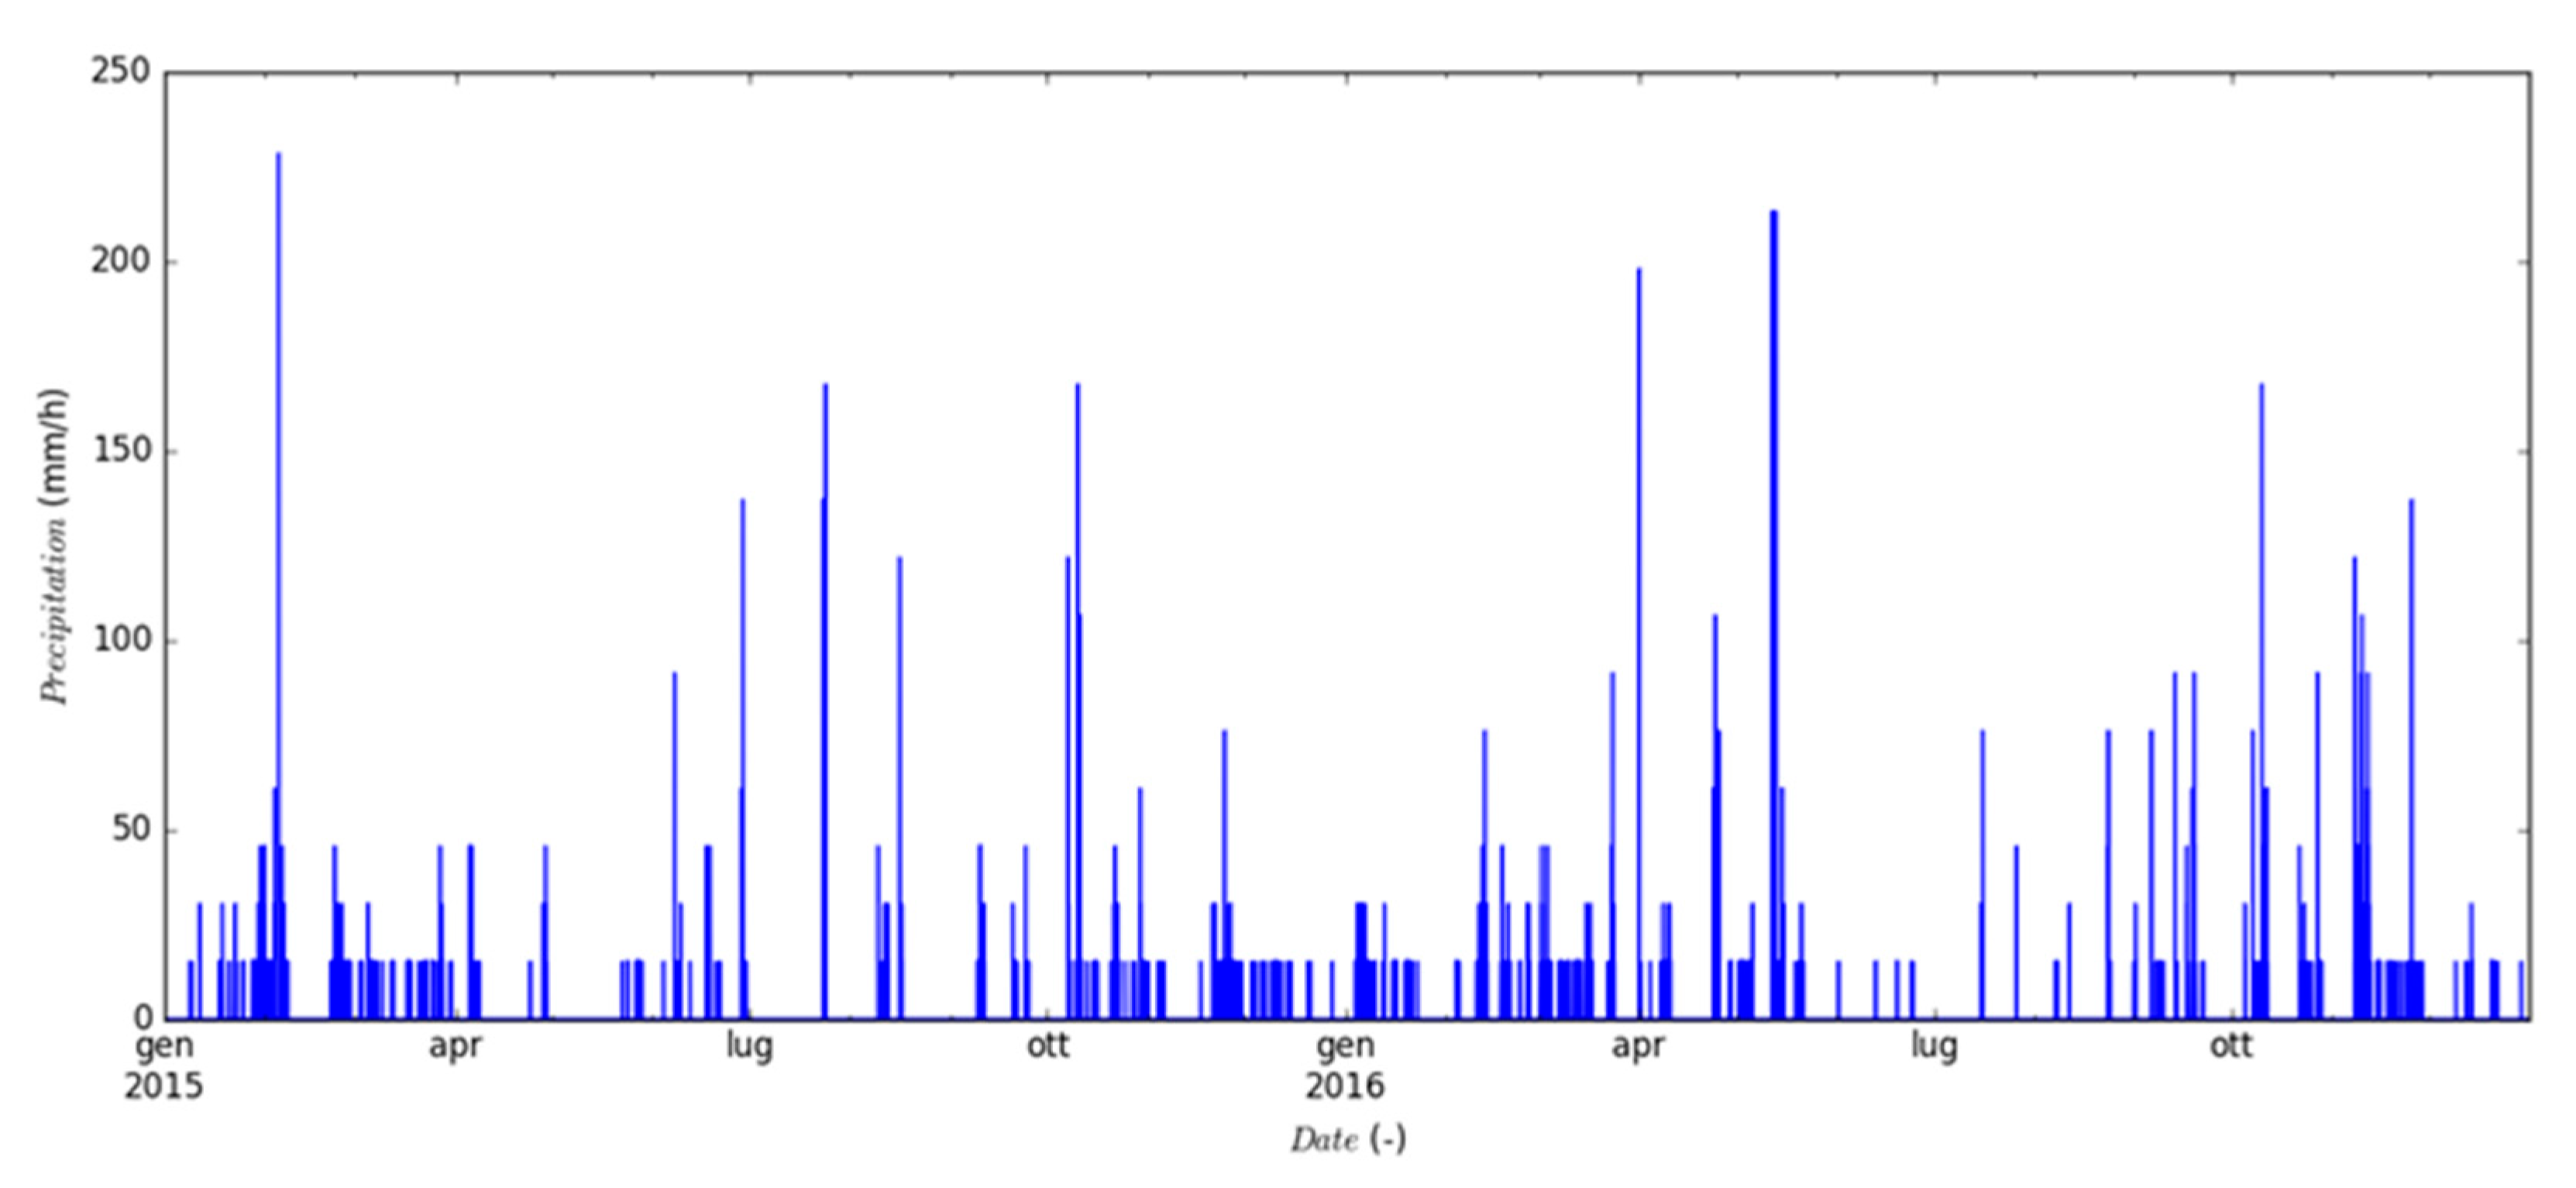
Precipitation recorded during the analyzed period is plotted in Figure 4. At a first inspection, it is evident how the precipitation pattern exhibited a significant seasonality. While the winter months were characterized by frequent precipitation events, the summer months were generally drier with only a few isolated precipitation events. This behavior is typical of a semi-arid Mediterranean climate, which is characterized by wet winters and prolonged drought periods during summer. The total precipitation recorded during the analyzed period (2 years) was 2600 mm, a significant amount for the site. It must be emphasized that some uncertainties may arise during the measurement of very intense precipitation (e.g., precipitation intensity >150 mm/h), for which the tipping-bucket rain gauge could introduce bias in the measure itself. In such circumstances, the precipitation amount could be slightly overestimated or underestimated.
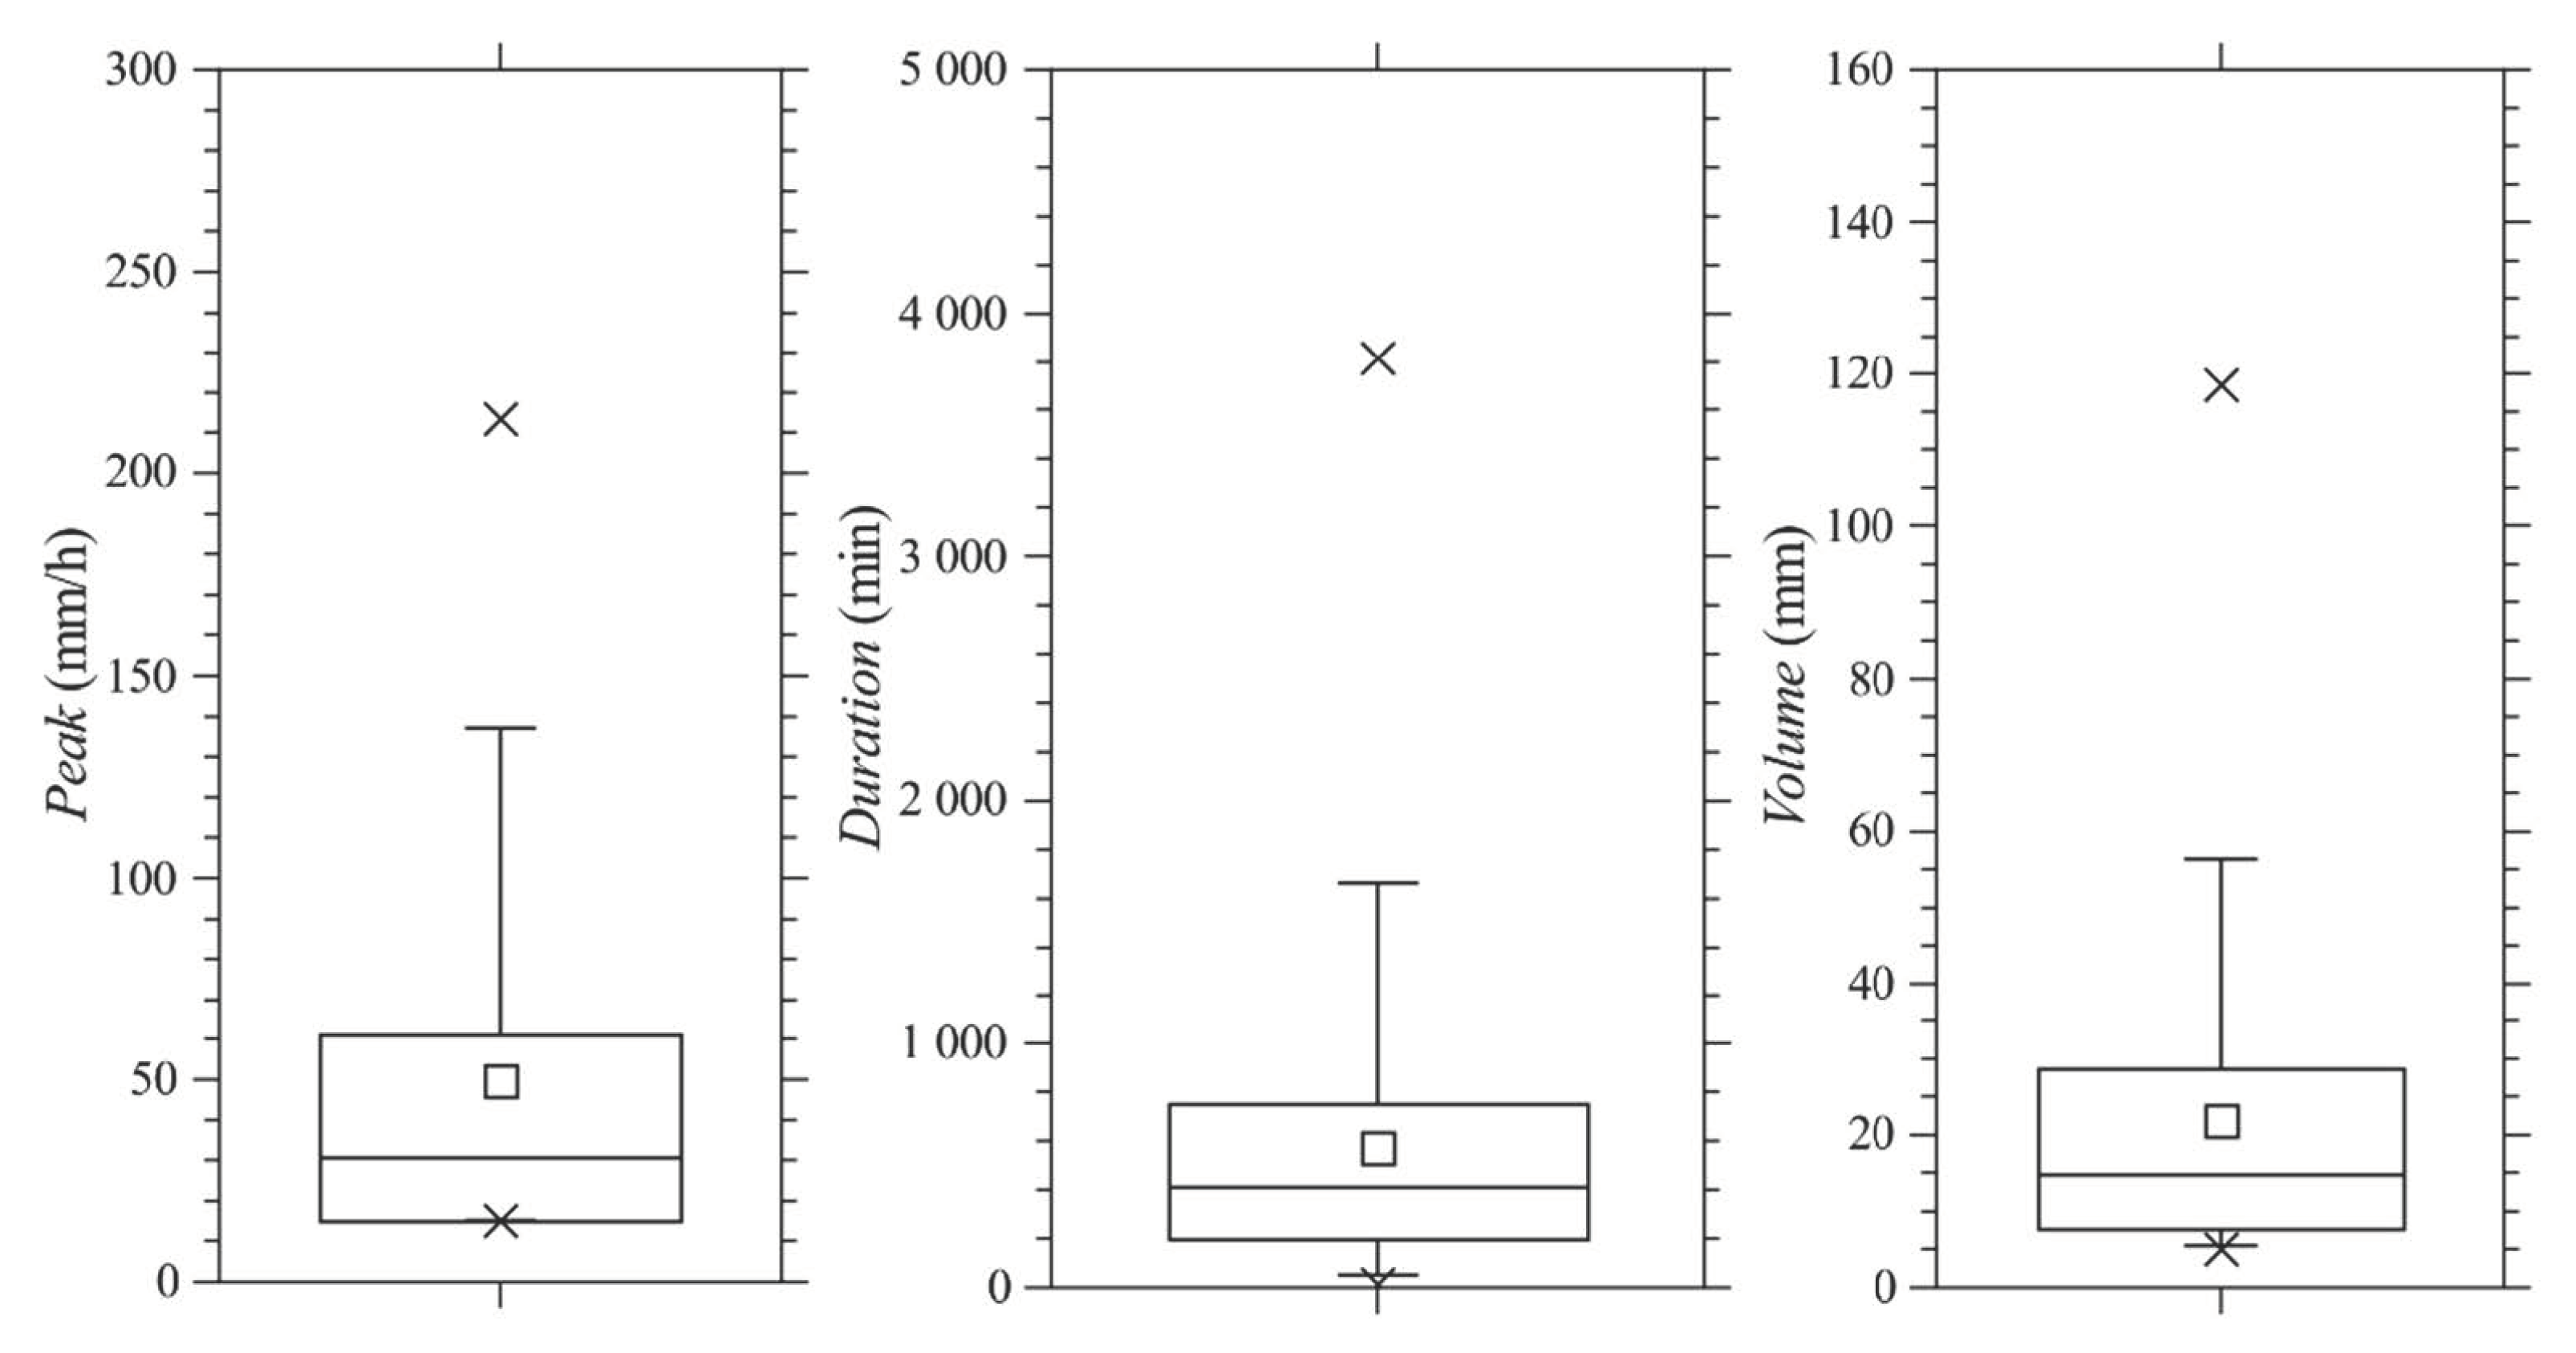
The analysis of the precipitation time series led to the identification of 107 independent rainfall events. Results are reported in Figure 5, in which a box plot for each variable of interest (i.e., peak intensity, duration and volume) was used to summarize the statistics of the analyzed sample. The average peak intensity (quadrangle in the left plot) was 49.7 mm/h, while the 75th percentile was 61 mm/h. The average duration and volume were 574 min and 21.9 mm, respectively. A comprehensive analysis of the main statistics of the sample is shown in Table 2. Interestingly, only 8 rainfall events were subhourly. However, it must be emphasized that subhourly events were characterized by an average peak of 68.5 mm/h, which is significantly higher than the average value of the whole sample (i.e., 49.7 mm/h).
3.2. TSS Efficiency Evaluation
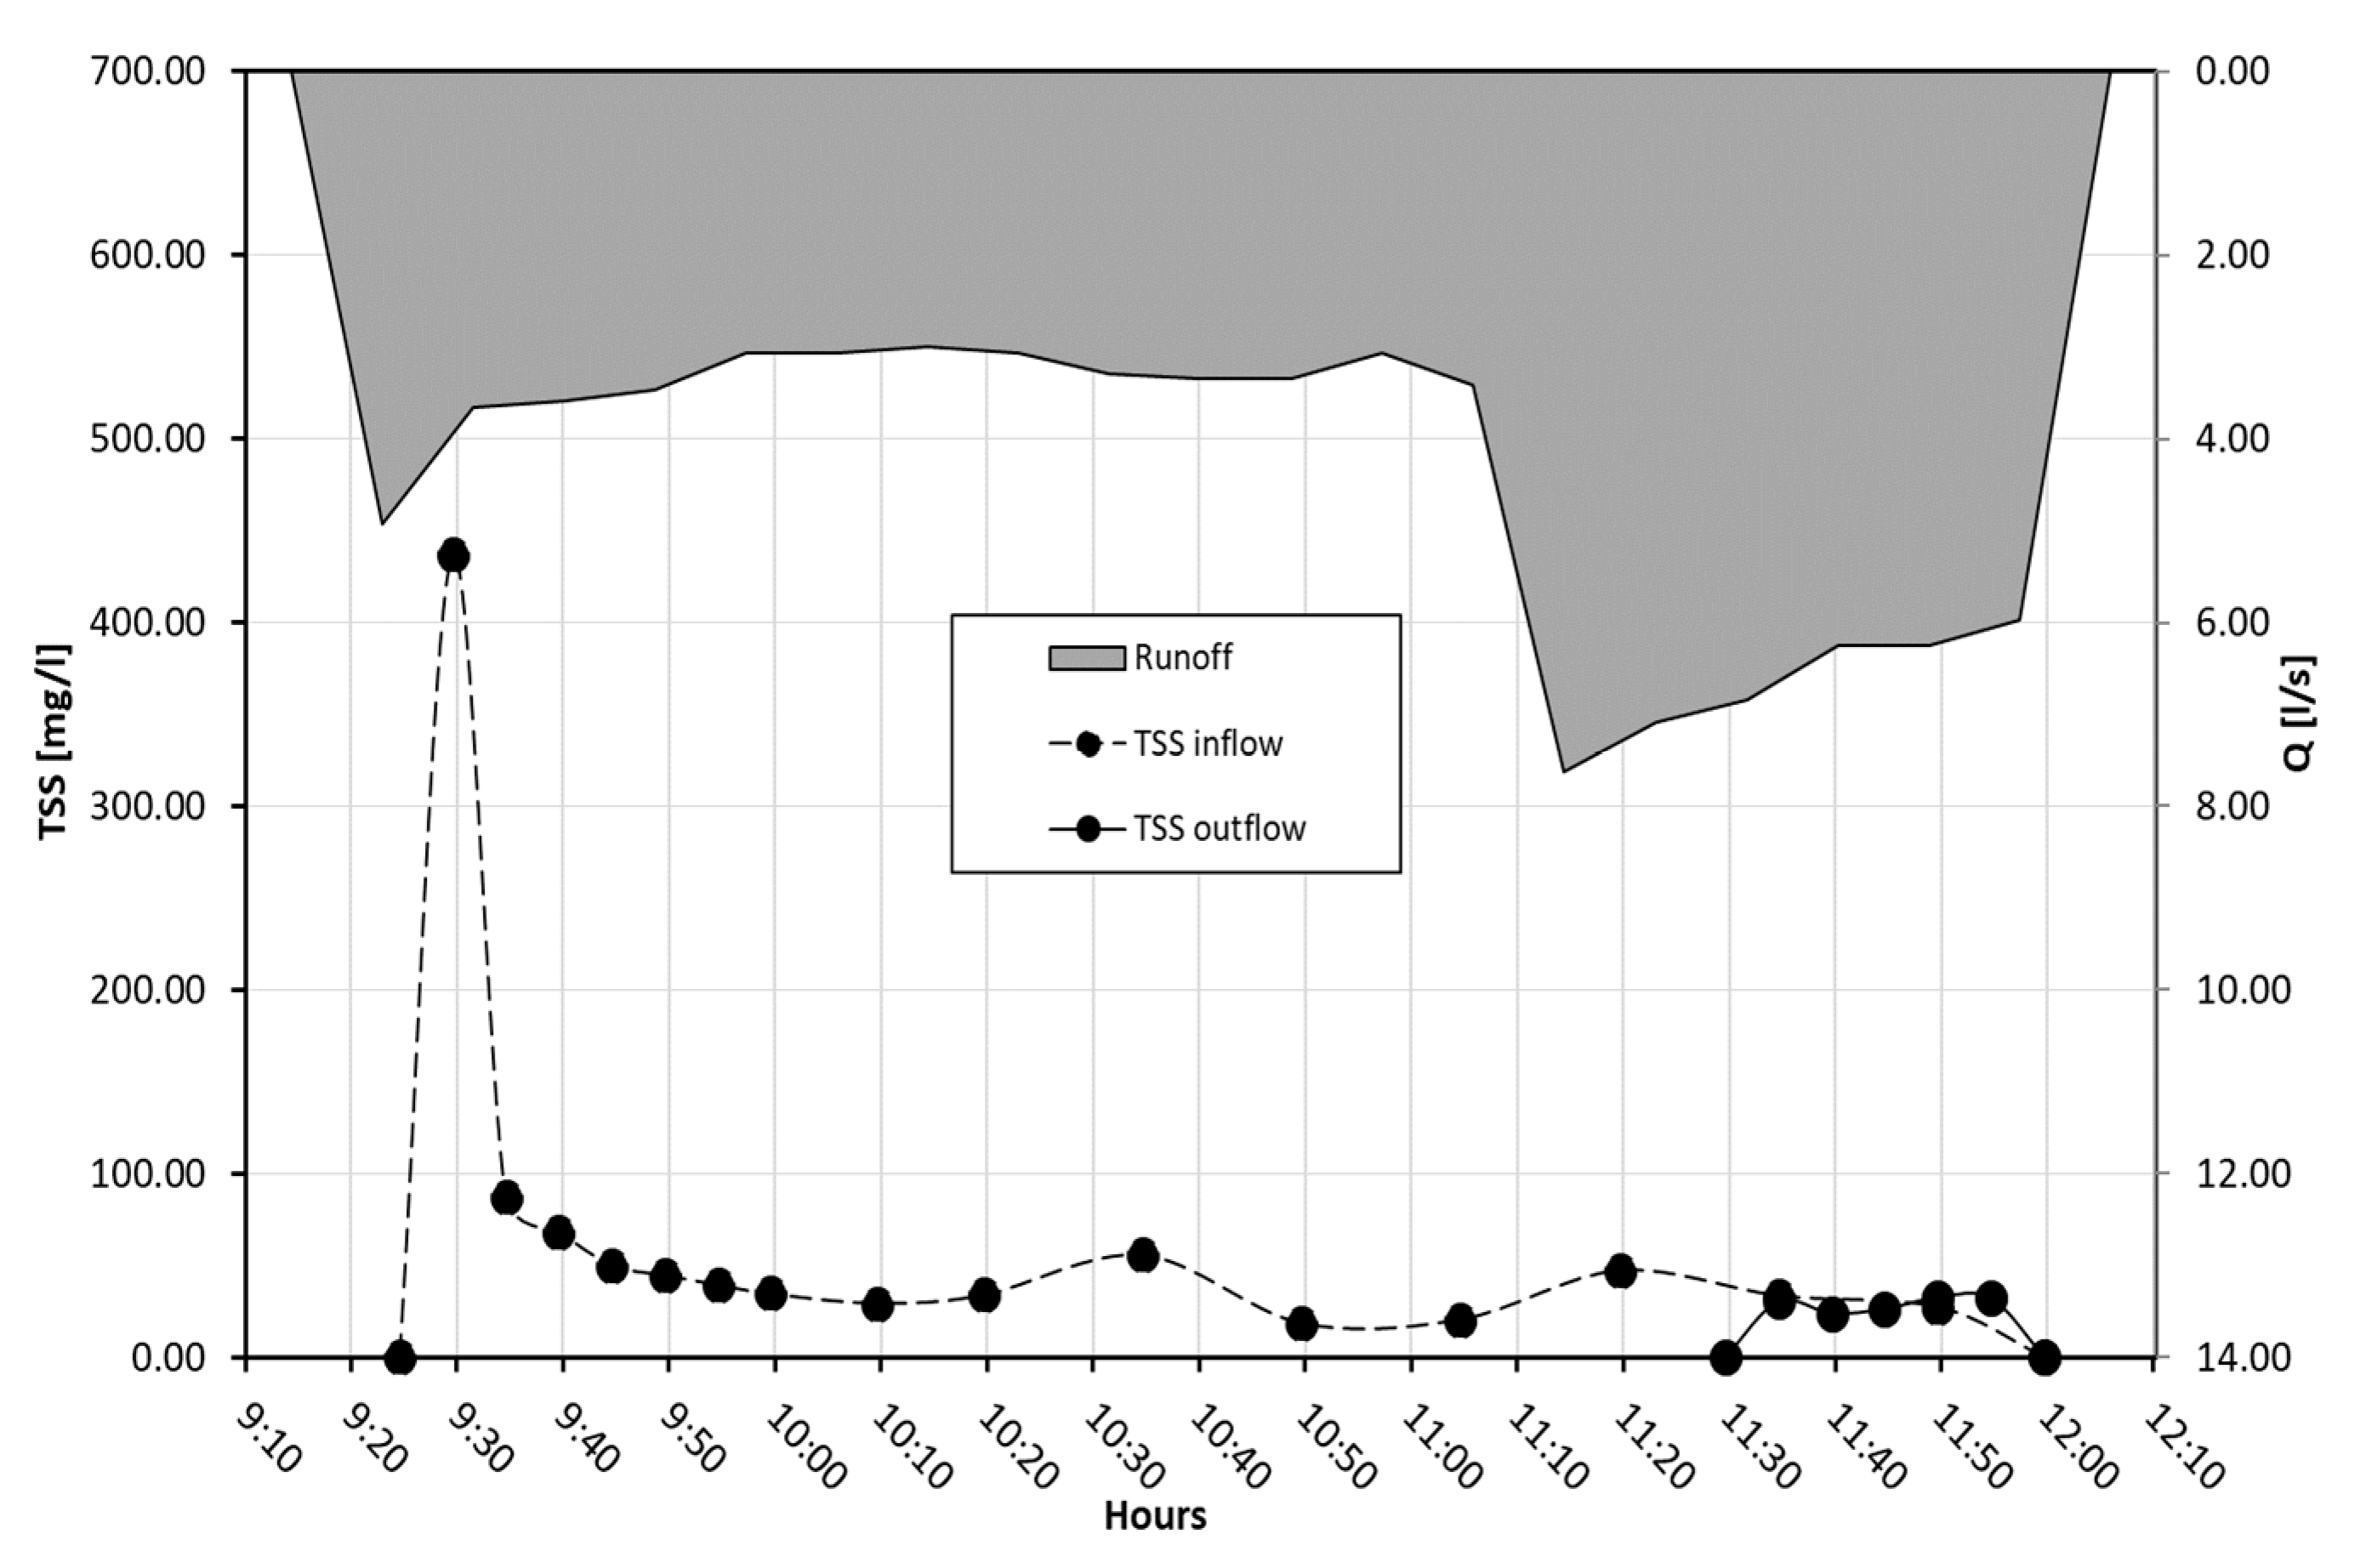
3.2.1. Test A
Figure 6 shows the TSS inflow into and outflow from the sedimentation tank with the water flow entering the plant.
The TSS concentration measured in the rainwater flowing into the sedimentation tank showed a maximum value of approximately 450 mg/L, during the first moments of runoff. Later, the value remained constant with concentrations below 100 mg/L. The high value of TSS in the first moments of runoff were probably due to the first flush phenomenon while the TSS concentration measured in the water outflowing from the sedimentation tank was constant and lower than 50 mg/L.
The water flow to the sedimentation tank was always higher than 2 L/s with the peak value of 7.62 L/s.
The overall efficiency of removing the pollutant was 84%, with catch removal efficiency of 83% and sedimentation removal efficiency of 1%.
The removal sedimentation efficiency was extremely low: probably the runoff to the sedimentation tank triggered particle resuspending motions when the sedimentation tank reached the maximum degree of filling.
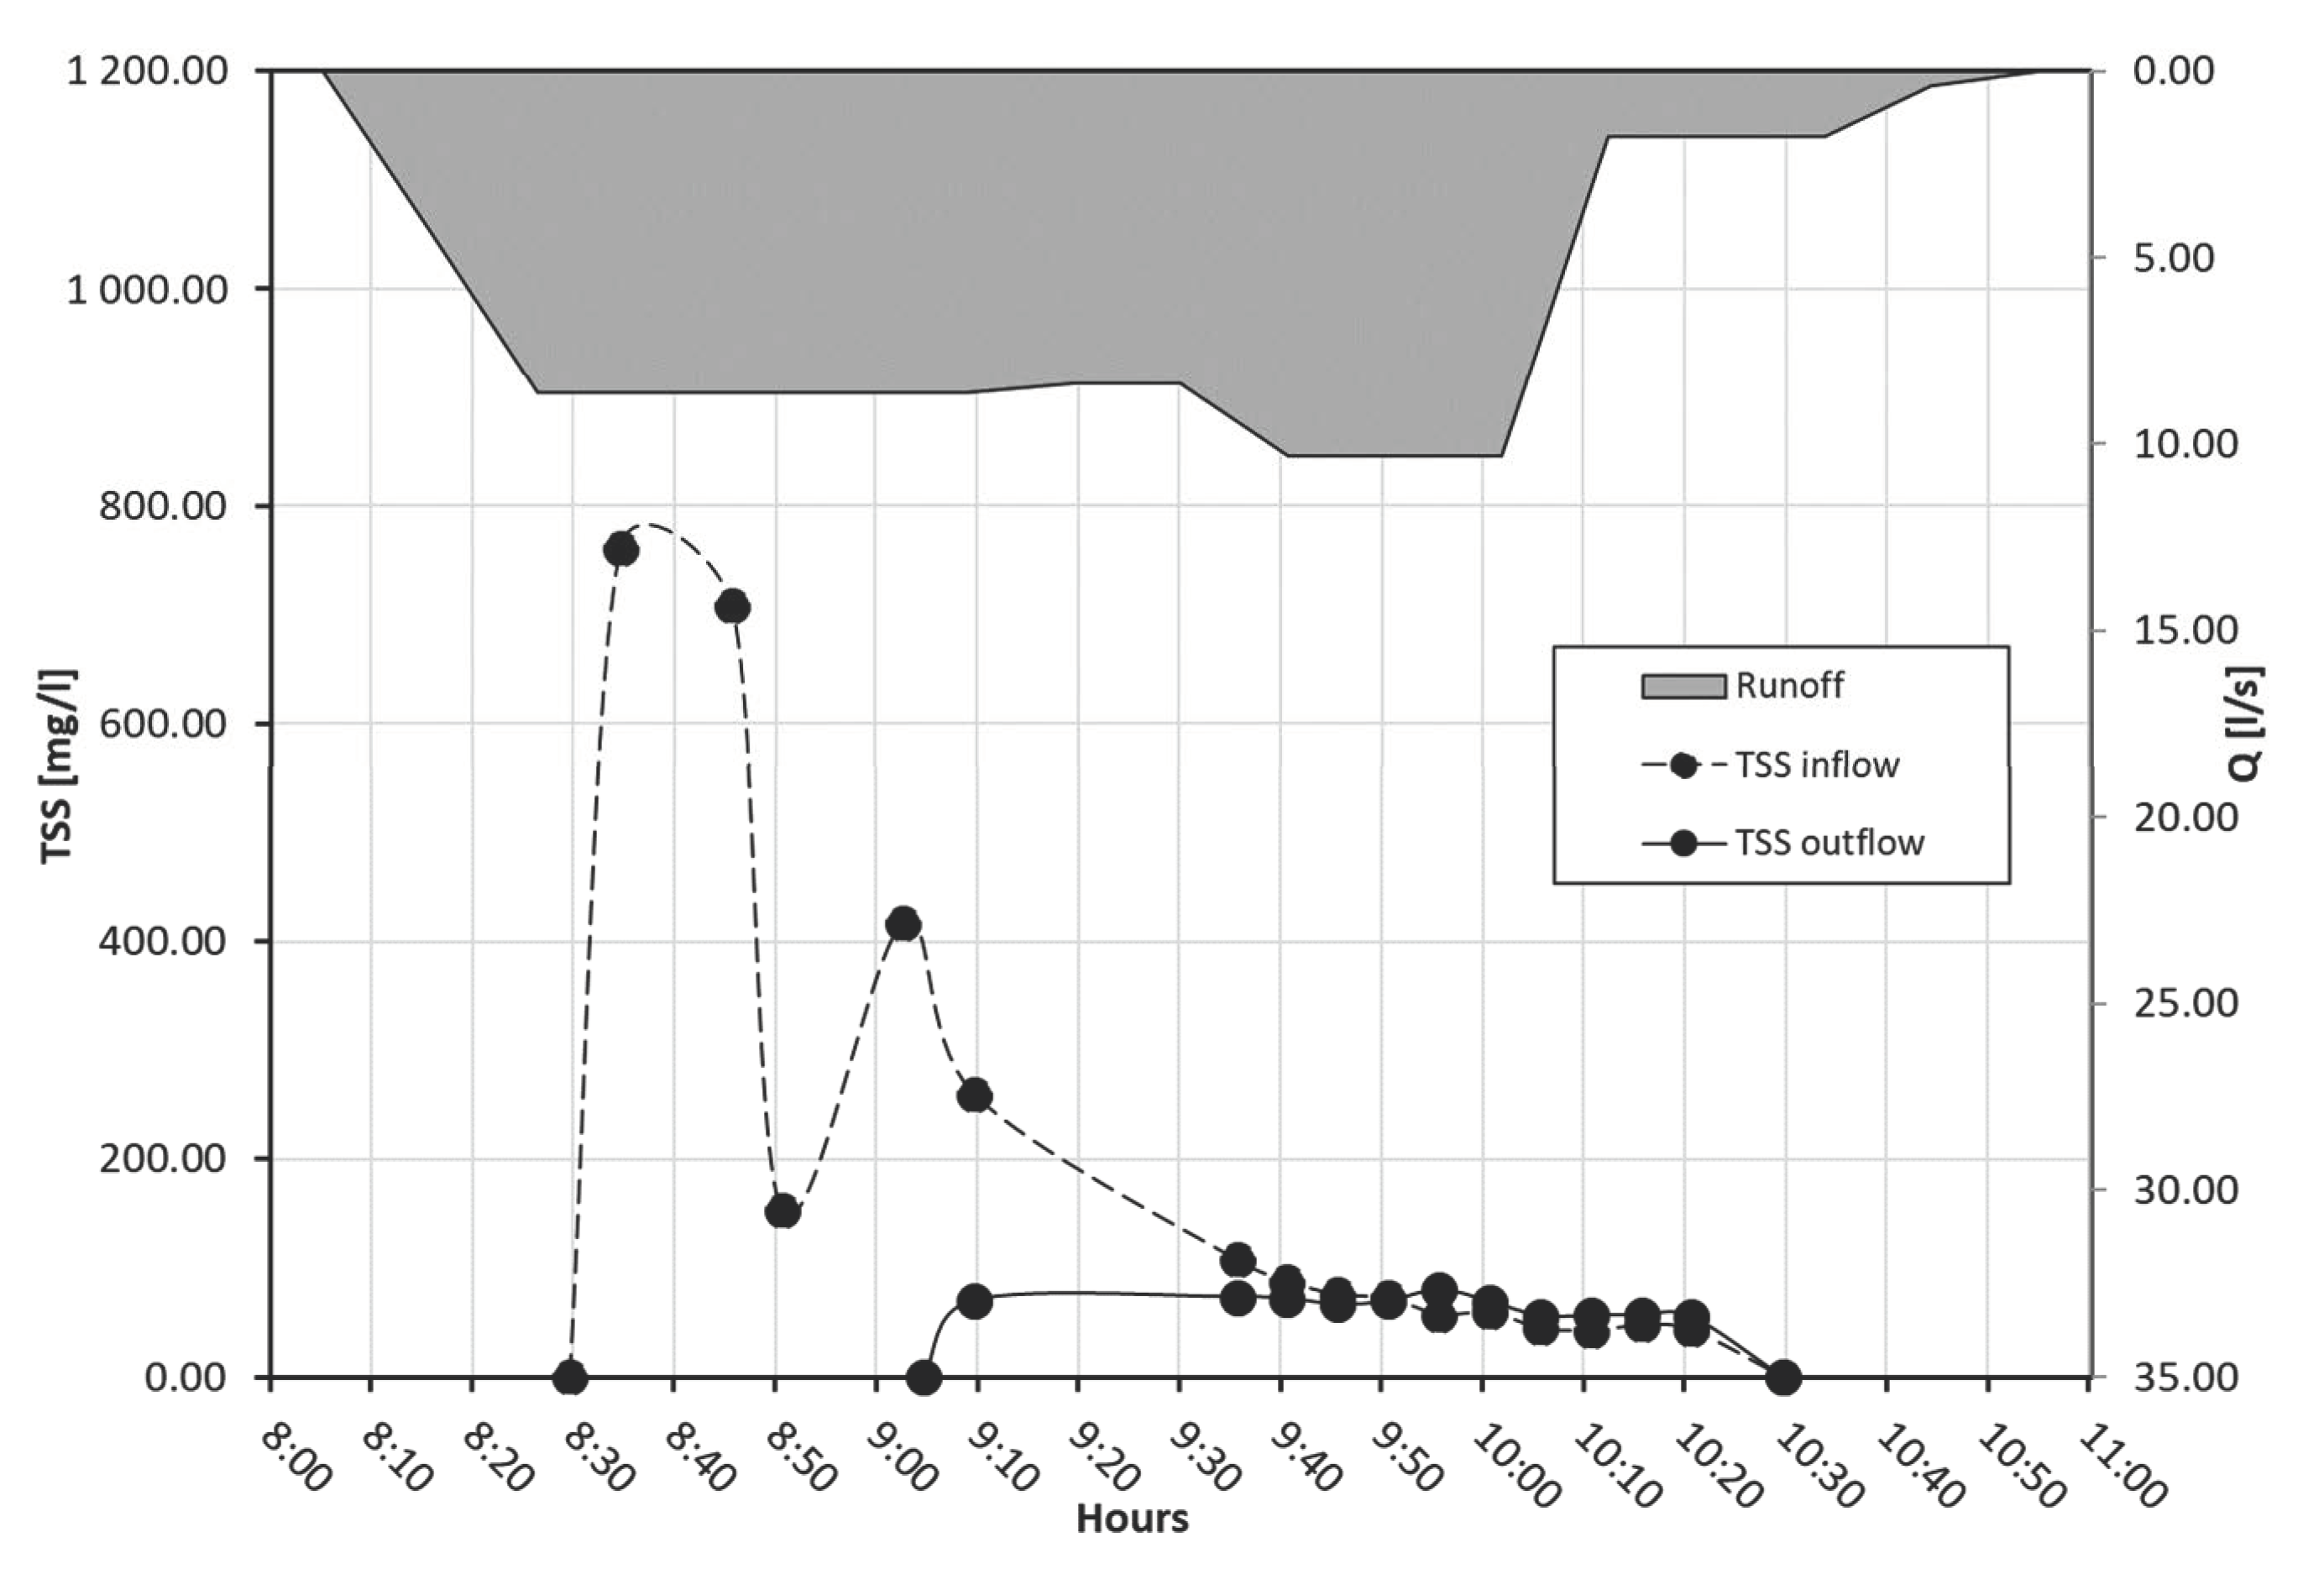
3.2.2. Test B
Figure 7 shows the TSS inflow into and outflow from the sedimentation tank with the water flow entering the plant.
The TSS concentration measured in the rainwater flowing into the sedimentation tank showed a maximum value of approximately 800 mg/L, during the first instants of runoff. Then it had a further peak value of 400 mg/L. These two peak values were probably due to the first flush phenomenon and to the sand deposit in the sewerage.
Afterwards, the value remained constant with concentrations below 100 mg/L.
In contrast, the TSS concentration measured in the water out of the sedimentation tank was constant and lower than 100 mg/L.
The water flow to the sedimentation tank showed peak values included between 8 and 10 L/s.
The overall efficiency of removing the pollutant was 77%, with a catch removal efficiency of 55% and sedimentation removal efficiency of 22%.
This test showed an improvement in the sedimentation efficiency when compared to the previous one. Likely, this efficiency value was due to a bigger particle size of suspended solids.
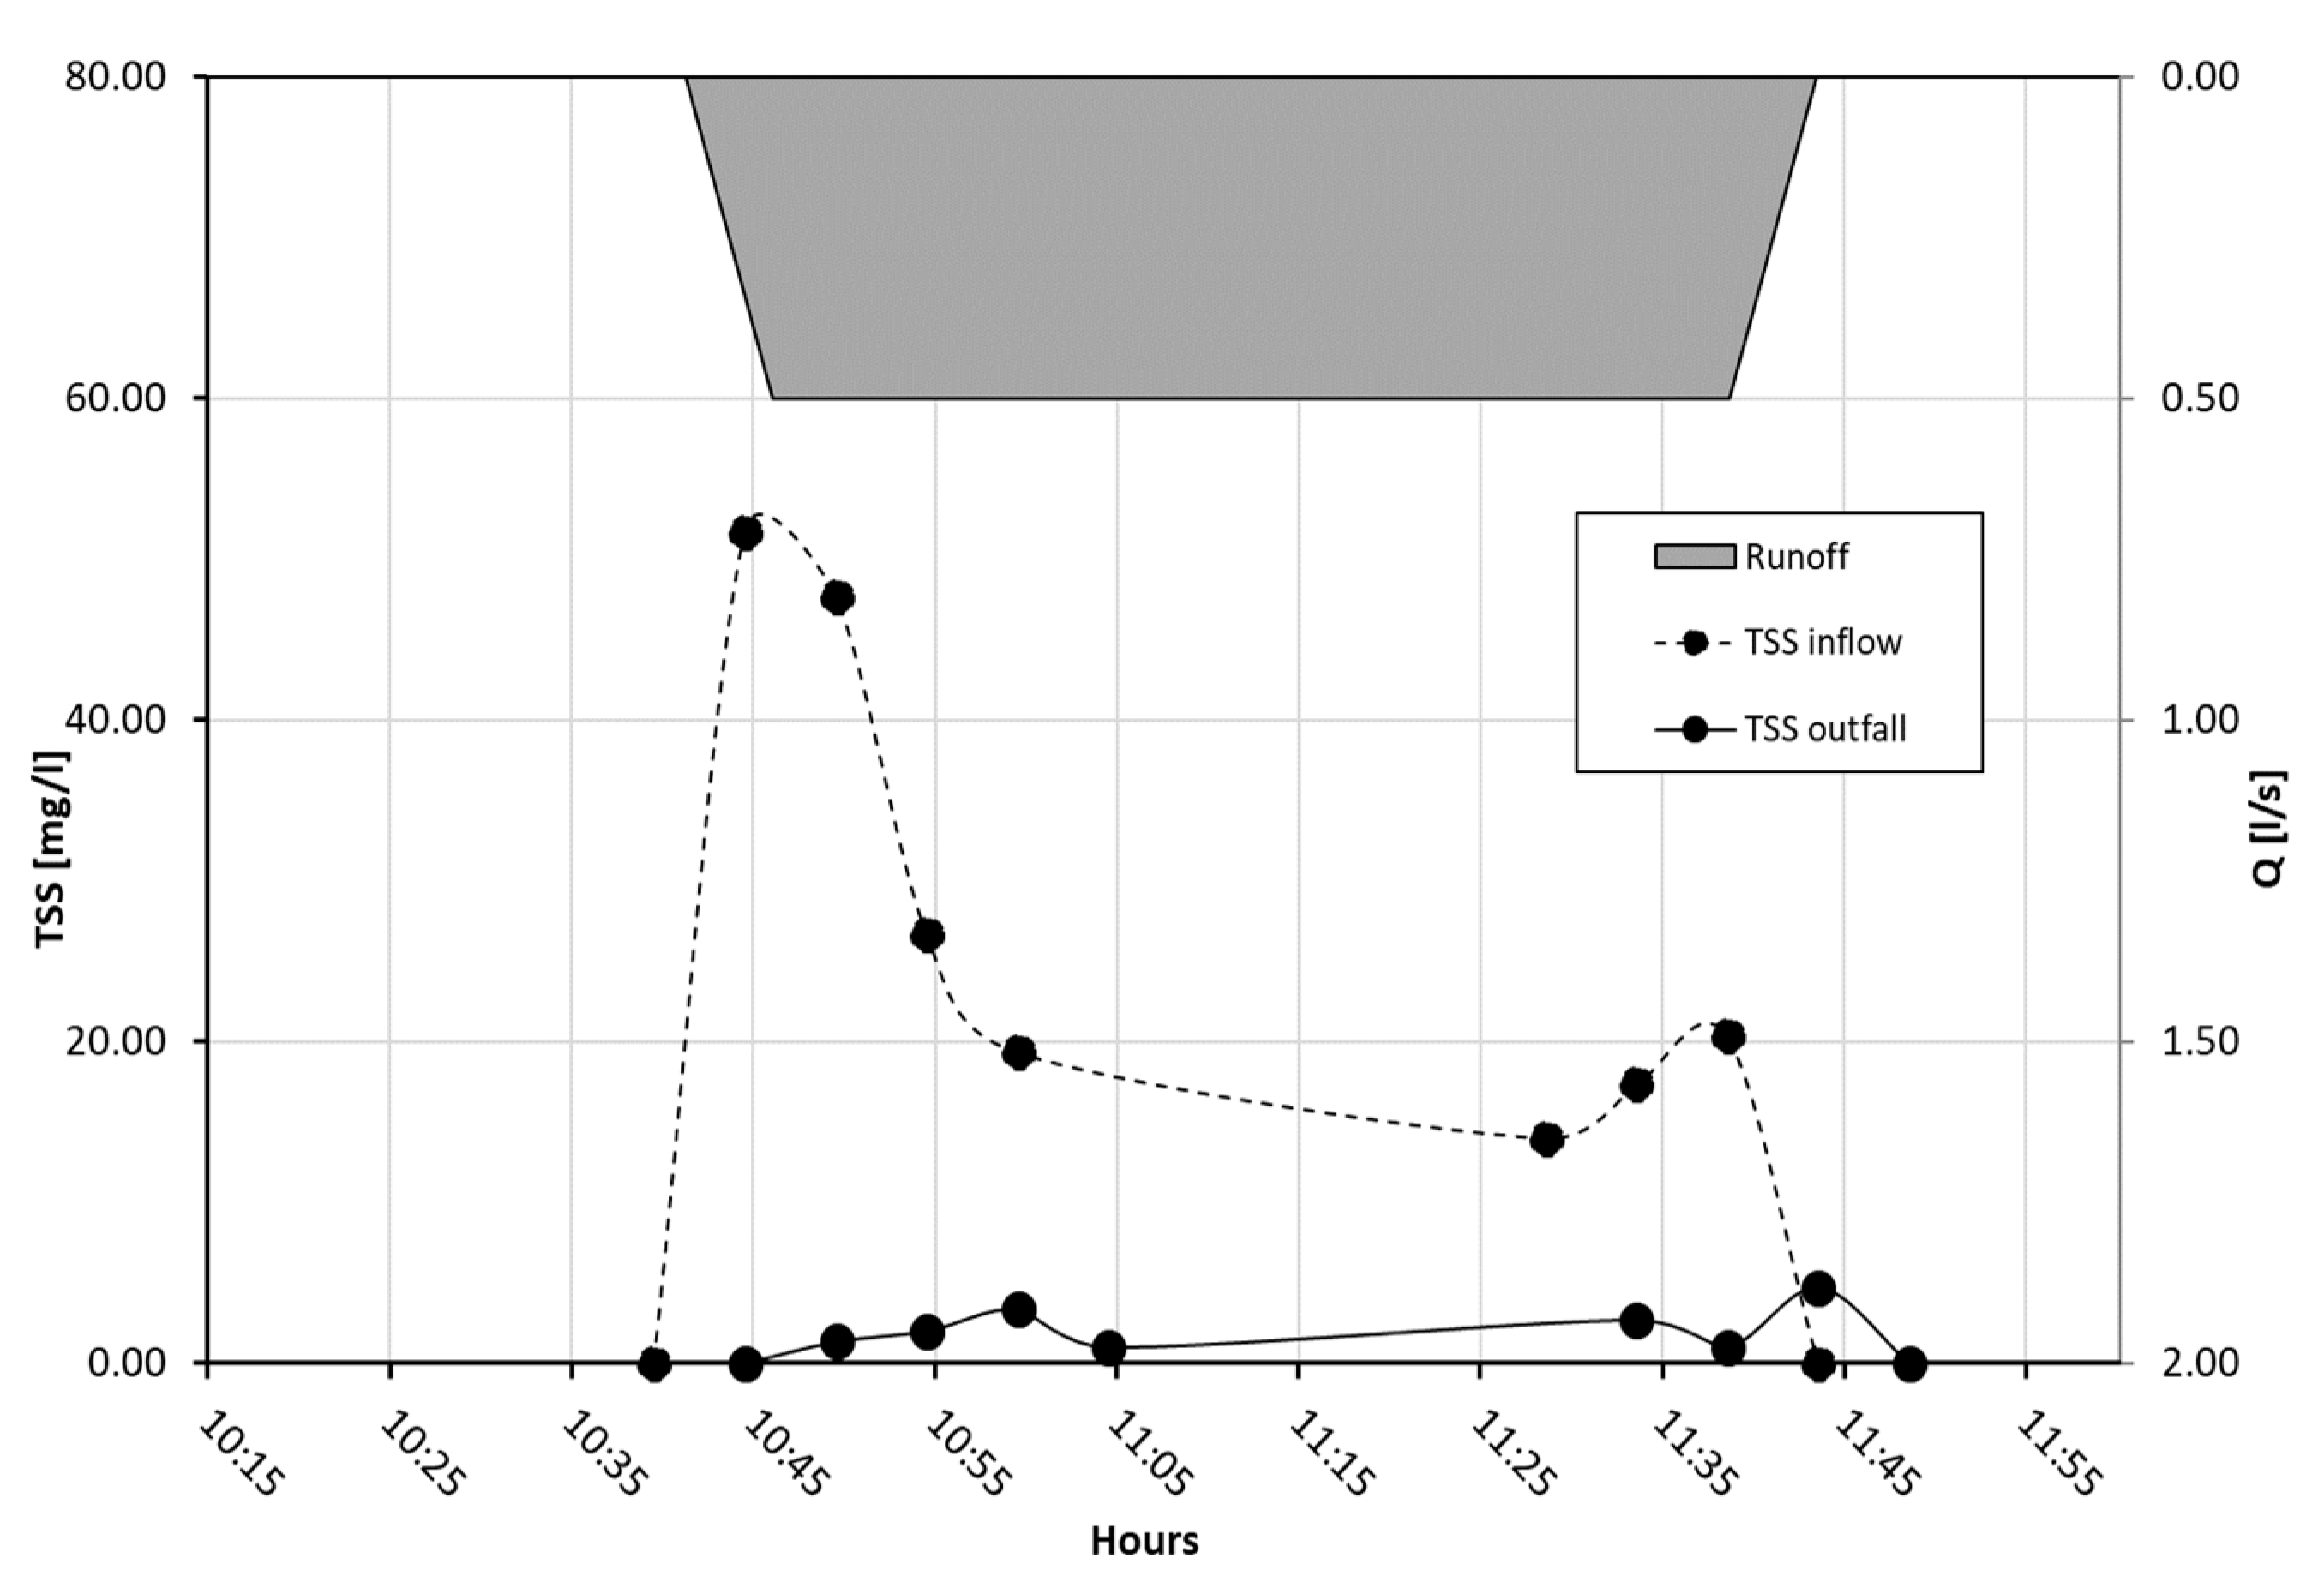
3.2.3. Test C
Figure 8 relates the TSS inflow into and outflow from the sedimentation tank with the water flow entering the plant.
The TSS concentration measured in the rainwater flowing into the sedimentation tank showed a maximum value approximately of 52 mg/L, during the first instants of runoff and a subsequent peak value about 20 mg/L.
In contrast, the TSS concentration measured in the water out of the sedimentation tank was constant and less than 5 mg/L.
The water flow to the sedimentation tank showed a constant value of 0.5 L/s.
The overall efficiency of removing the pollutant was 91%. In this test the sedimentation tank was full before the rain event. Therefore, the removal efficiency was due solely to the sedimentation process.
3.3. Particle-Size Distribution Curves
3.3.1. Test A
In Figure 9 the particle-size distribution (PSD) curves for inflow to and outflow from the sedimentation tank are plotted.
The inlet PSD had a characteristic diameter d50 of 27 µm and a characteristic diameter d90 of 200 µm.
The outlet PSD had a characteristic diameter d50 of 8.68 µm and a characteristic diameter d90 of 29 µm.
3.3.2. Test B
In Figure 10 the particle-size distribution (PSD) curves for inflow to and outflow from the sedimentation tank are plotted.
The inlet PSD had a characteristic diameter d50 of 32 µm and a characteristic diameter d90 of 400 µm.
The outlet PSD had a characteristic diameter d50 of 46 µm and a characteristic diameter d90 of 150 µm.
3.3.3. Test C
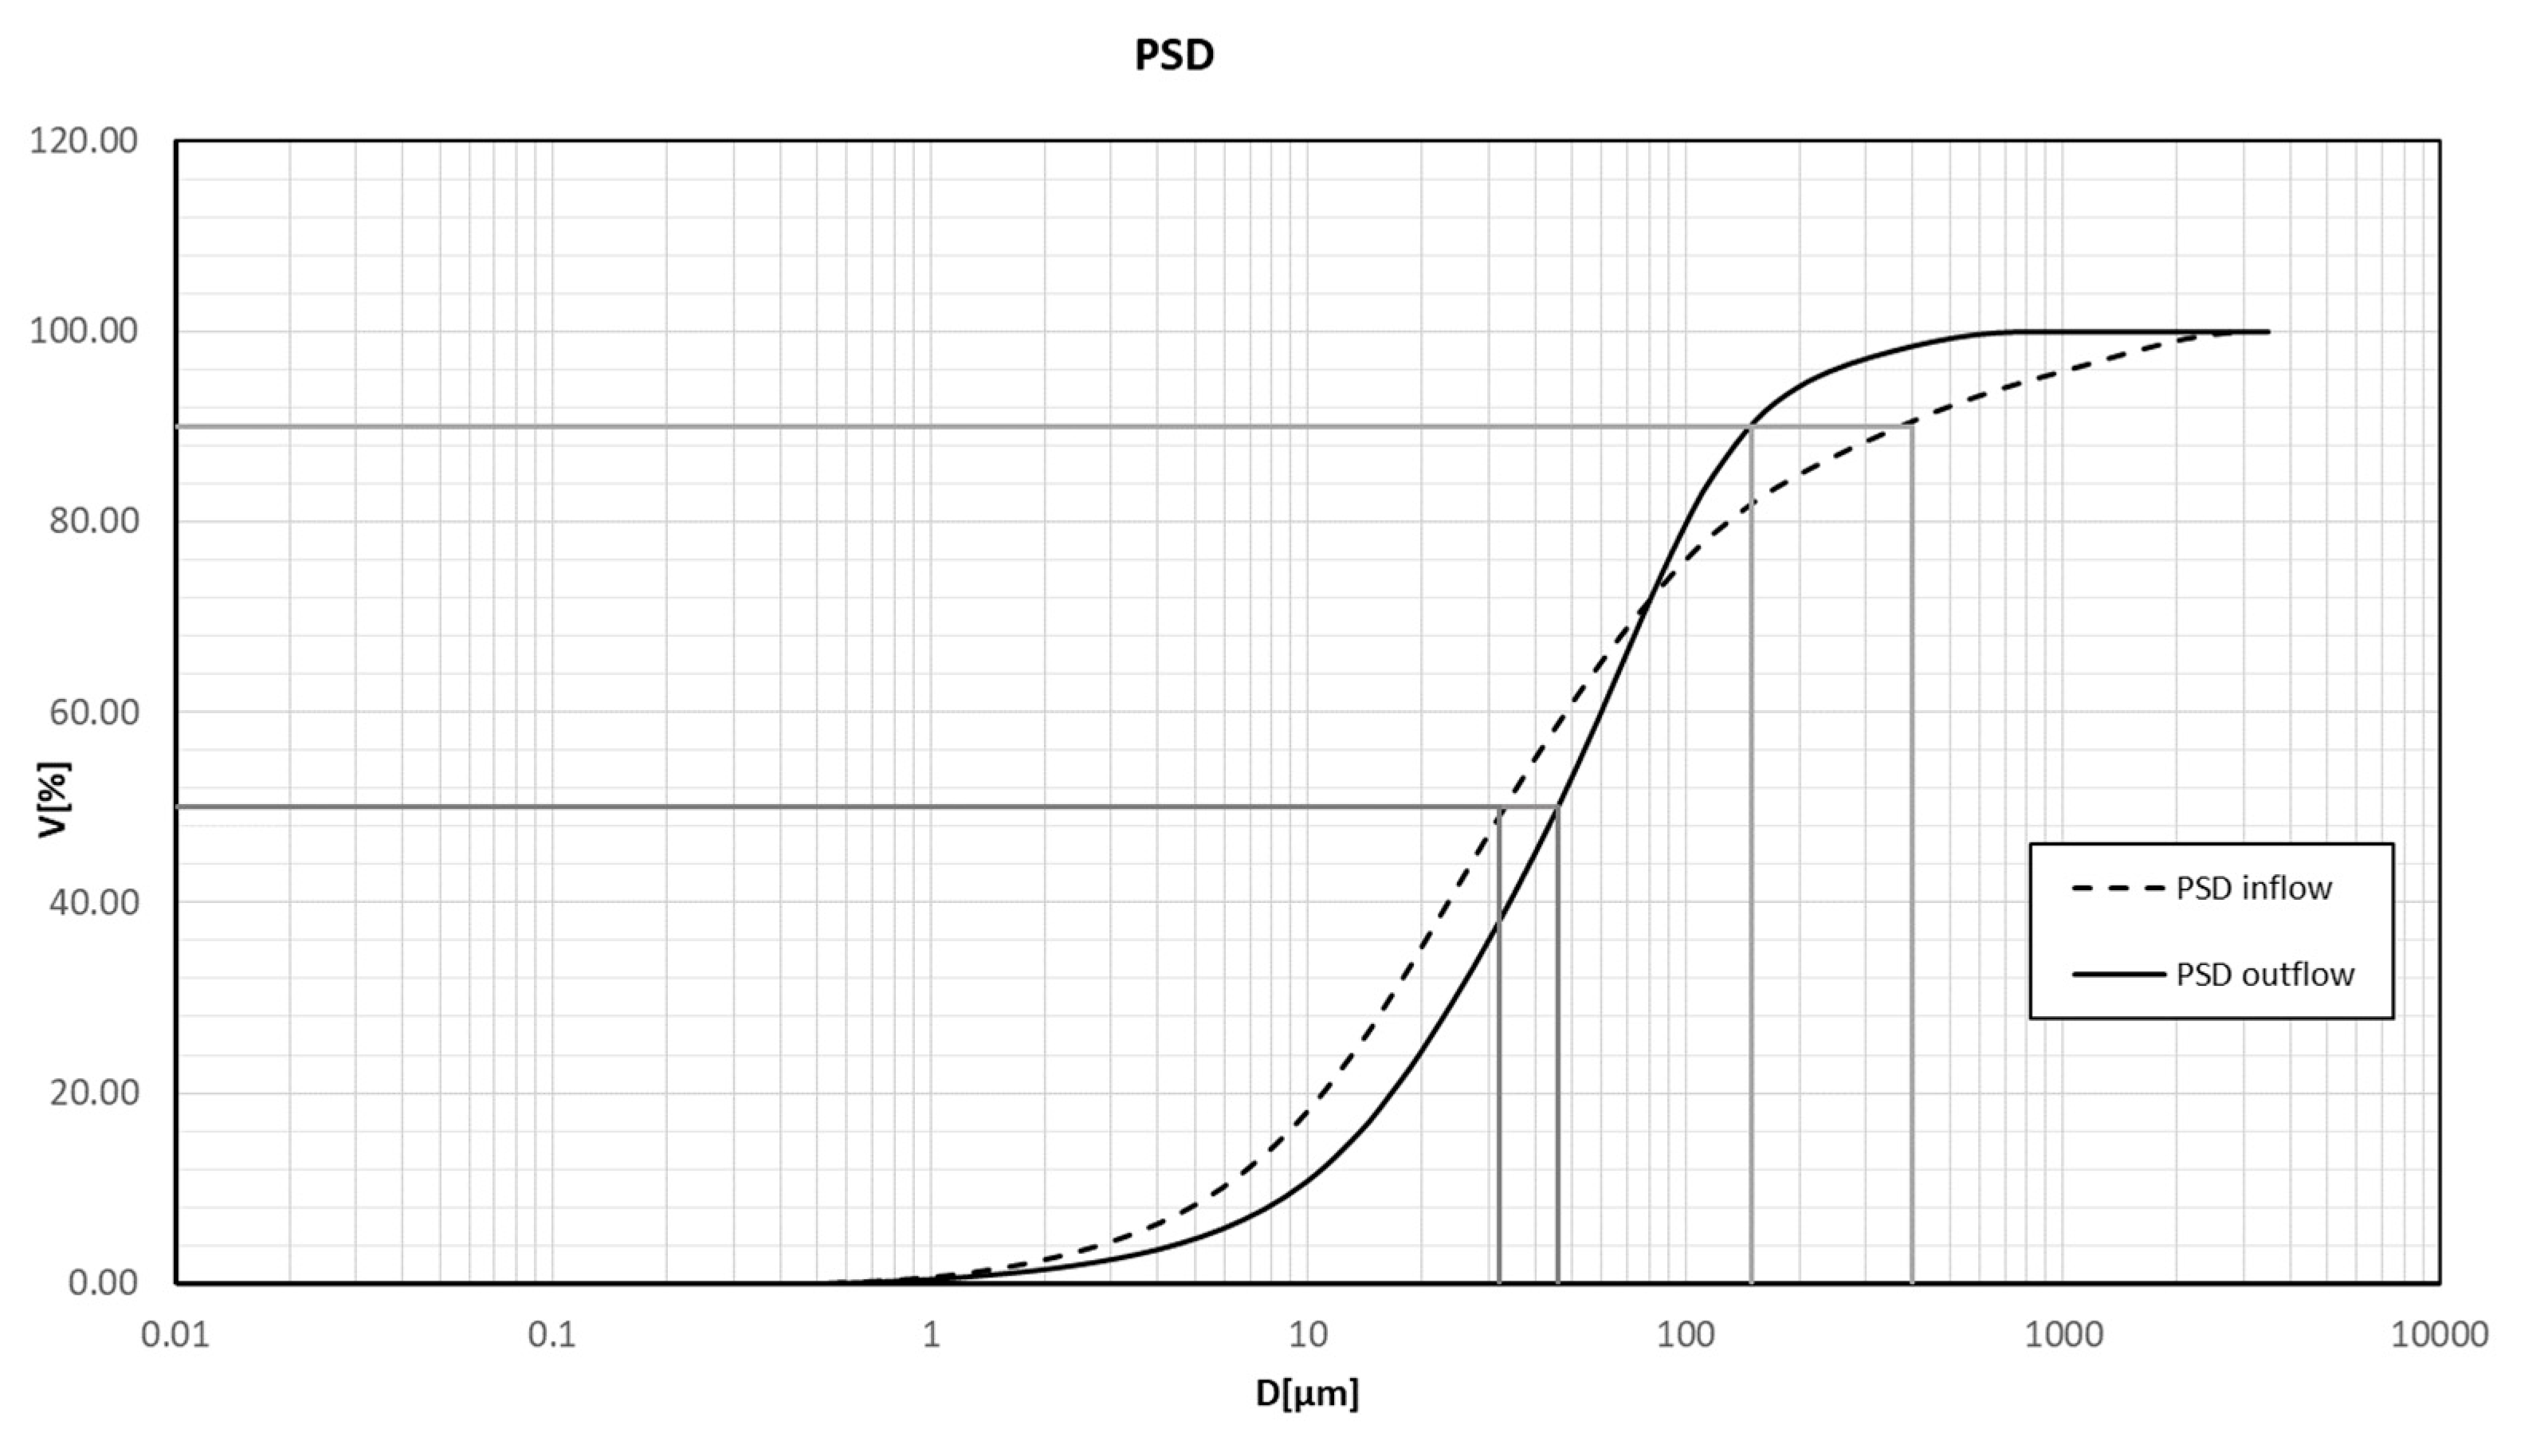
In Figure 11 the particle-size distribution (PSD) curves for inflow to and outflow from the sedimentation tank are plotted
The inlet PSD had a characteristic diameter d50 of 30 µm and a characteristic diameter d90 of 240 µm.
The outlet PSD had a characteristic diameter d50 of 16.4 µm and a characteristic diameter d90 of 54 µm.
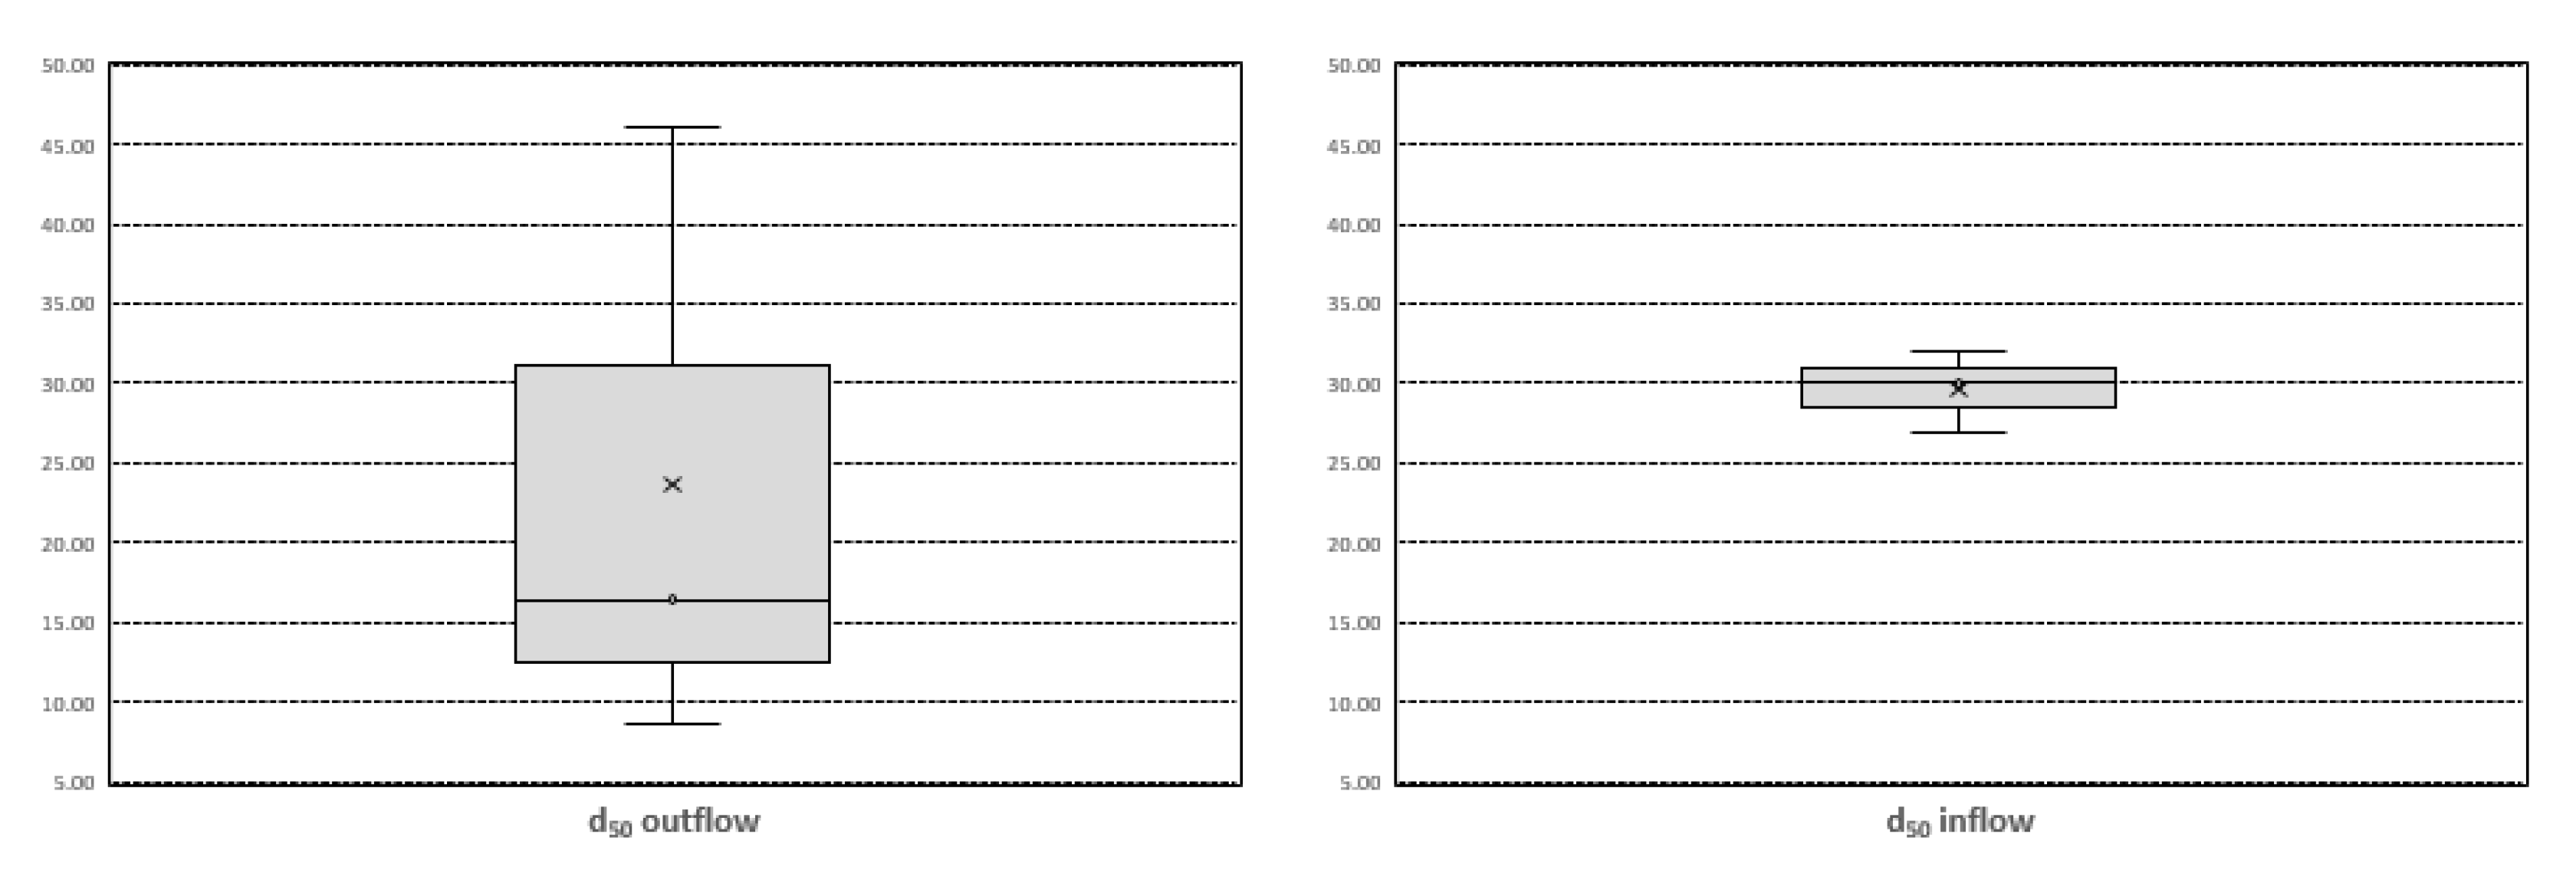
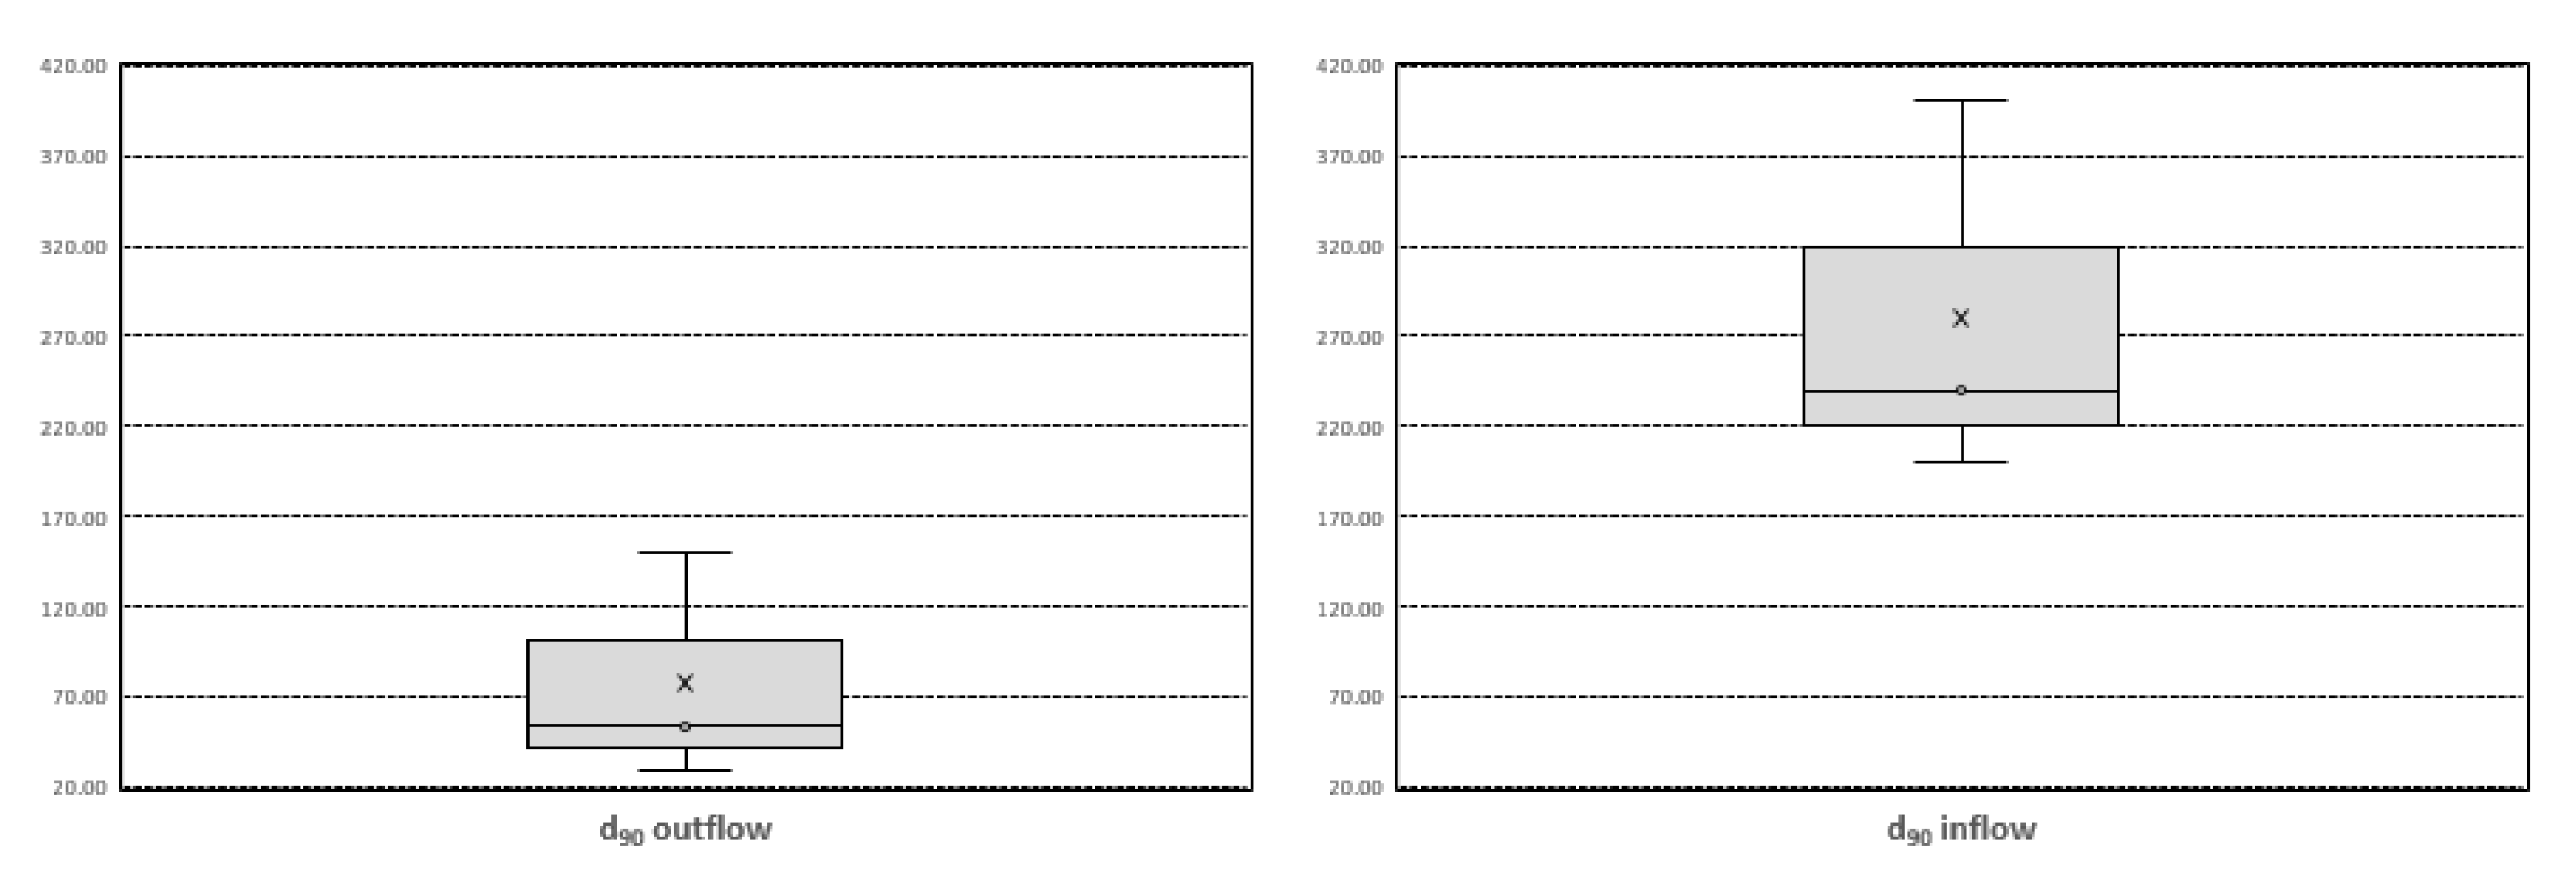
The comparison of the examined characteristic diameters outlines the following features:
- Minimum variability of the characteristic diameter d50 measured in the inlet section (Figure 12);
- Greater variability of the characteristic diameter d50 measured in the outlet section (Figure 12);
- Lower variability of the characteristic diameter d90 measured in the outlet section (Figure 13);
- Greater variability of the characteristic diameter d90 measured in the inlet section (Figure 13).
More specifically, the main findings of this work are:
- The overall efficiency of the treatment facilities ranged from 77% to 91% reaching the highest value when the sedimentation tank was full and only sedimentation processes occurred;
- Results obtained from three different tests showed overall a high removal efficiency value, but different values of the sedimentation removal efficiency;
- The diameter characteristics had an influence on the overall efficiency and on the type of treatment process that took place in the treatment unit.
Considering this work represents a case study with experimental results, further investigations regarding the turbulence processes that are triggered within the treatment units by use of computational fluid dynamics analysis (CFD) and numeric modeling are needed.
4. Conclusions
In this paper, first results of the experimental site located in the Vermicelli basin (University of Calabria campus, Cosenza, Southern Italy) are presented. They were obtained by analyzing the treatment of surface runoff through the sedimentation tank. A monitoring campaign was conducted in order to characterize the particles transported by the drainage system to determine the efficiency of the treatment of the sedimentation tank.
Tests were carried out to define the particle-size distribution (PSD) and to determine the concentration and the mass of the total suspended solid (TSS). Performed analyses showed the presence of a pollutant load in runoff waters of Vermicelli basin and provided the estimate of the treatment efficiency of the sedimentation tank. The overall treatment efficiency was determined by considering the removal catch efficiency and the removal sedimentation efficiency. The results obtained from three different tests showed a high overall removal efficiency value, ranging from 77% to 91% and reaching the highest value when the sedimentation tank was full, but different values of the removal sedimentation efficiency. These differences are mainly due to the different grain size of the suspended solids and other characteristics of the rainfall event. In fact, the comparison between examined characteristic diameters showed a high variability in different tests.
Instead, a recurrent result in all three tests was the presence of a high value of TSS in the inflow to the system in the first moments of runoff (first flush phenomenon).
The occurrence of a first flush and the optimal overall removal efficiency confirm that the sedimentation tanks are optimal solutions to reduce the pollution in the stormwater.
An even greater efficiency can be obtained by optimizing the behavior of the entire treatment plant made up of the sedimentation tank and the filtration unit.
In the near future, a new experimental monitoring campaign will be carried out focusing on a performance analysis of the entire plant.
Author Contributions
Conceptualization, S.F. and G.B.; methodology S.F. and M.T.; validation, G.G. and M.T.; formal analysis and investigation, S.F., M.M. and P.P.; data curation, S.F. and G.B.; writing—original draft preparation, S.F., G.B., M.T.; writing—review and editing, S.F. and G.G., M.T.; visualization, M.T., G.B.; supervision, M.M. and P.P.; project administration, P.P.; funding acquisition, G.G. and P.P.. All authors have read and agreed to the published version of the manuscript.
Funding
This research was cofunded by the University of Brescia and University of Calabria in the framework of the research project URBAID ‘Assisted and Integrated Urban Restoration’ (University of Brescia Health and Wealth call 2015).
Conflicts of Interest
The authors declare no conflict of interest.
References
- Kuriqi, A.; Koçileri, G.; Ardiçlioğlu, M. Potential of Meyer-Peter and Müller approach for estimation of bed-load sediment transport under different hydraulic regimes. Model. Earth Syst. Environ. 2020, 6, 129–137. [Google Scholar] [CrossRef]
- Garofalo, G.; Palermo, S.; Principato, F.; Theodosiou, T.; Piro, P. The influence of hydrologic parameters on the hydraulic efficiency of an extensive green roof in mediterranean area. Water 2016, 8, 44. [Google Scholar] [CrossRef]
- Adams, B.J.; Papa, F. Urban Stormwater Management Planning with Analytical Probabilistic Models; Wiley: West Sussex, UK, 2000. [Google Scholar]
- Walesh, S.G. Urban Surface Water Management; John Wiley & Sons Baffms Lane: West Sussex, UK, 1989. [Google Scholar]
- Piro, P.; Turco, M.; Palermo, S.A.; Principato, F.; Brunetti, G. A comprehensive approach to stormwater management problems in the next generation drainage networks. In The Internet of Things for Smart Urban Ecosystems; Cicirelli, F., Guerrieri, A., Mastroianni, C., Spezzano, G., Vinci, A., Eds.; Springer: Cham, Switzerland, 2019. [Google Scholar]
- Turco, M.; Brunetti, G.; Carbone, M.; Piro, P. Modelling the hydraulic behaviour of permeable pavements through a reservoir element model. In Proceedings of the International Multidisciplinary Scientific GeoConference Surveying Geology and Mining Ecology Management, SGEM, Sofia, Bulgaria, 2–8 July 2018. [Google Scholar]
- Carbone, M.; Turco, M.; Nigro, G.; Piro, P. Modeling of hydraulic behaviour of green roof in catchment scale. In Proceedings of the 14th International Multidisciplinary Scientific GeoConference SGEM 2014, Albena, Bulgaria, 17–26 June 2014. [Google Scholar]
- Bacchi, B.; Balistrocchi, M.; Grossi, G. Proposal of a semi-probabilistic approach for storage facility design. Urban Water J. 2008, 5, 195–208. [Google Scholar] [CrossRef]
- Balistrocchi, M.; Grossi, G.; Bacchi, B. An analytical probabilistic model of the quality efficiency of a sewer tank. Water Resour. Res. 2009, 45, W12420. [Google Scholar] [CrossRef]
- Soonthornnonda, P.; Christensen, E.R. Source apportionment of pollutants and flows of combined sewer wastewater. Water Res. 2008, 42, 1989–1998. [Google Scholar] [CrossRef]
- Krajewski, A.; Wasilewicz, M.; Banasik, K.; Sikorska, A.E. Operation of Detention Pond in Urban Area–Example of Wycigi Pond in Warsaw, Environmental Engineering V; Magorzata, P., Lucjan, P., Eds.; CRC Press/Balkema: Leiden, The Netherlands, 2017; pp. 211–216. [Google Scholar]
- Guo, Y. Hydrologic design of urban flood control detention ponds. J. Hydrol. Eng. 2001, 6, 472–479. [Google Scholar] [CrossRef]
- Stefanakis, A.I. The role of constructed wetlands as green infrastructure for sustainable urban water management. Sustainability 2019, 11, 6981. [Google Scholar] [CrossRef] [Green Version]
- Maiolo, M.; Pantusa, D. A methodological proposal for the evaluation of potable water use risk. Water Pract. Technol. 2015, 10, 152–163. [Google Scholar] [CrossRef]
- Maiolo, M.; Pantusa, D. An optimization procedure for the sustainable management of water resources. Water Sci. Technol. Water Supply 2016, 16, 61–69. [Google Scholar] [CrossRef]
- Maiolo, M.; Pantusa, D. A proposal for multiple reuse of urban wastewater. J. Water Reuse Desalin. 2017, 8, 468–478. [Google Scholar] [CrossRef] [Green Version]
- Carini, M.; Maiolo, M.; Pantusa, D.; Chiaravalloti, F.; Capano, G. Modelling and optimization of least-cost water distribution networks with multiple supply sources and user. Ric. Mat. 2017, 67, 465–479. [Google Scholar] [CrossRef]
- Maiolo, M.; Carini, M.; Capano, G.; Nigro, G.; Piro, P. Life cycle assessment of a bitumen anti-root barrier on a green roof in the Mediterranean area. Int. J. Petrochem. Res. 2017, 1, 92–95. [Google Scholar] [CrossRef] [Green Version]
- Maiolo, M.; Mendicino, G.; Pantusa, D.; Senatore, A. Optimization of DrinkingWater Distribution Systems in Relation to the Effects of Climate Change. Water 2017, 9, 803. [Google Scholar] [CrossRef]
- Piro, P.; Carbone, M.; Garofalo, G.; Sansalone, J. Size distribution of wet weather and dry weather particulate matter entrained in combined flows from an urbanizing sewershed. Water Air Soil Pollut. 2010, 206, 83–94. [Google Scholar] [CrossRef]
- Sansalone, J.J.; Kim, J.Y. Transport of particulate matter fractions in urban source area pavement surface runoff. J. Environ. Qual. 2008, 37, 1883–1893. [Google Scholar] [CrossRef]
- Li, W.; Shen, Z.; Tian, T.; Liu, R.; Qiu, J. Temporal variation of heavy metal pollution in urban stormwater runoff. Front. Environ. Sci. Eng. 2012, 6, 692–700. [Google Scholar] [CrossRef]
- McCarthy, D.T.; Hathaway, J.M.; Hunt, W.F.; Deletic, A. Intra-event variability of Escherichia coli and total suspended solids in urban stormwater runoff. Water Res. 2012, 46, 6661–6670. [Google Scholar] [CrossRef]
- Wang, K.; Li, Y.; Ren, S.; Yang, P. A case study on settling process in inclined-tube gravity sedimentation tank for drip irrigation with the yellow river water. Water 2020, 12, 1685. [Google Scholar] [CrossRef]
- Rommel, S.H.; Helmreich, B. Influence of temperature and de-icing salt on the sedimentation of particulate matter in traffic area runoff. Water 2018, 10, 1738. [Google Scholar] [CrossRef] [Green Version]
- Garofalo, G.; Carbone, M.; Piro, P. Sampling, testing and modeling particle size distribution in urban catch basins. Water Sci. Technol. 2014, 70, 1873–1879. [Google Scholar] [CrossRef]
- Karlsson, K.; Viklander, M.; Scholes, L.; Revitt, M. Heavy metal concentrations and toxicity in water and sediment from stormwater ponds and sedimentation tanks. J. Hazard. Mater. 2010, 178, 612–618. [Google Scholar] [CrossRef] [PubMed]
- Kertesz, R.; Sansalone, J.; Raje, S.; Garofalo, G.; Pathapati, S. Redesign of infrastructure with green technology for hydrologic and constituent load reduction. In World Environmental and Water Resources Congress 2013: Showcasing the Future; ASCE Library: Reston, VA, USA, 2013; pp. 313–324. [Google Scholar]
- Piro, P.; Carbone, M. A modelling approach to assessing variations of total suspended solids (tss) mass fluxes during storm events. Hydrol. Process. 2014, 28, 2419–2426. [Google Scholar] [CrossRef]
- Kim, J.; Sansalone, J. Event–Based size distribution of particulate matter transported during urban rainfall-runoff events. Water Res. 2008, 42, 2756–2768. [Google Scholar] [CrossRef] [PubMed]
- Sansalone, J.; Lin, H.; Ying, G. Experimental and field studies of type I settling for particulate matter transported by urban runoff. J. Environ. Eng. 2009, 135, 953–963. [Google Scholar] [CrossRef]
- Carbone, M.; Garofalo, G.; Nigro, G.; Piro, P. Hydraulic performance of olive stone filtration systems. Adv. Mater. Res. 2014, 941, 970–974. [Google Scholar] [CrossRef]
Figure 1.
Vermicelli catchment (CS, Southern Italy).

Figure 2.
Overhead view of the experimental facility.

Figure 3.
Methodological approach.

Figure 4.
Time-series of observed precipitation for the analyzed period.

Figure 5.
Boxplots of the main statistics for independent rain events.

Figure 6.
Total suspended solid (TSS) inflow and outflow for the event of Test A.

Figure 7.
TSS inflow and outflow for the event of Test B.

Figure 8.
TSS inflow and outflow for the event of Test C.

Figure 9.
Inflow and outflow particle-size distribution (PSD) for the event of Test A.

Figure 10.
Inflow and outflow PSD for the event of Test B.

Figure 11.
Inflow and outflow PSD for the event of Test C.

Figure 12.
Statistical analysis for d50.

Figure 13.
Statistical analysis for d90.


Table 1.
Rainfall events characteristics during the experimental campaign.
| Monitoring Experiment | ||||
|---|---|---|---|---|
| Test ID | Date | Rainfall Characteristics | ||
| V (mm) | imax (mm/h) | d (h) | ||
| A | 4 February 2016 | 1.78 | 15.24 | 1.75 |
| B | 3 March 2016 | 7.36 | 60.96 | 2.66 |
| C | 15 March 2016 | 5.35 | 30.48 | 1.83 |
The water samples were taken in the inlet and the outlet sections of the sedimentation tank.
Table 2.
Main statistics calculated starting from the independent rain events.
| Statistics | Peak (mm/h) | Duration (minutes) | Volume (mm) |
|---|---|---|---|
| Average | 49.7 | 574 | 21.9 |
| Standard deviation | 41.2 | 600 | 20.5 |
| Minimum | 15.24 | 15 | 5.08 |
| Percentile 25% | 15.24 | 201 | 7.75 |
| Percentile 50% | 30.48 | 409 | 14.73 |
| Percentile 75% | 60.96 | 752 | 28.57 |
| Maximum | 213.36 | 3817 | 118.6 |
© 2020 by the authors. Licensee MDPI, Basel, Switzerland. This article is an open access article distributed under the terms and conditions of the Creative Commons Attribution (CC BY) license (http://creativecommons.org/licenses/by/4.0/).
Share and Cite
MDPI and ACS Style
Falco, S.; Brunetti, G.; Grossi, G.; Maiolo, M.; Turco, M.; Piro, P. Solids Removal Efficiency of a Sedimentation Tank in a Peri-Urban Catchment. Sustainability 2020, 12, 7196. https://0-doi-org.brum.beds.ac.uk/10.3390/su12177196
AMA Style
Falco S, Brunetti G, Grossi G, Maiolo M, Turco M, Piro P. Solids Removal Efficiency of a Sedimentation Tank in a Peri-Urban Catchment. Sustainability. 2020; 12(17):7196. https://0-doi-org.brum.beds.ac.uk/10.3390/su12177196
Chicago/Turabian StyleFalco, Salvatore, Giuseppe Brunetti, Giovanna Grossi, Mario Maiolo, Michele Turco, and Patrizia Piro. 2020. "Solids Removal Efficiency of a Sedimentation Tank in a Peri-Urban Catchment" Sustainability 12, no. 17: 7196. https://0-doi-org.brum.beds.ac.uk/10.3390/su12177196
Note that from the first issue of 2016, this journal uses article numbers instead of page numbers. See further details here.