Article

Development of Analytical Procedures for Chemical Characterization of Substrates for the Production of TRISO Coated Particles as Nuclear Fuel in High Temperature Gas-Cooled Reactors

Laboratory of Nuclear Analytical Techniques, Institute of Nuclear Chemistry and Technology, 03-195 Warsaw, Poland
*
Authors to whom correspondence should be addressed.
Sustainability 2020, 12(17), 7221; https://0-doi-org.brum.beds.ac.uk/10.3390/su12177221
Submission received: 30 June 2020 / Revised: 28 August 2020 / Accepted: 31 August 2020 / Published: 3 September 2020

Abstract

:
High temperature gas-cooled reactors have recently gained importance as a source of electricity and process heat. Nuclear fuel used in these reactors consists of TRISO (TRiple coated ISOtropic) coated particles, where spherical grains of UO2 or UC2 or UCO kernel are covered with four successive layers consisting of pyrolytic carbon and silicon carbide. Of great importance is the chemical purity of reagents and substances used for the production of TRISO coated fuel particles. Analytical techniques ensuring the determination of elements at trace levels are inductively coupled plasma mass spectrometry (ICP-MS) and neutron activation analysis (NAA). They were applied in this work for the chemical characterization of substrates used for TRISO fuel production. Two analytical procedures were developed: the first, where materials are analyzed using ICP-MS, and the second with the aid of NAA. Successive stages of these procedures are described with details. Results of quantitative chemical analysis of examined substances are reported as well as detection limits for the investigated elements. Moreover, the expanded uncertainties estimated for the determined elements while employing the devised analytical procedures are presented.

1. Introduction

The high temperature gas-cooled reactor (HTGR) is an advanced type of nuclear reactor, the interest of which has been increasing for some time. In addition to its main purpose, i.e., generating electricity [1,2,3], it can also be used as a heat source in the production of hydrogen [1,2,4,5], coal gasification, oil extraction from oil shales and other chemical processes [1]. HTGR has other very valuable advantages, namely high thermal efficiency, increased safety level and economic competitiveness as well [1,2,6]. Therefore, these types of reactors can be seriously taken into account in countries that expect energy shortages in the near future and in those that plan to transform their energy management towards minimizing the use of fossil fuels, such as Poland.
Nuclear fuel used in modern HTGR reactors consists of spherical tristructural isotropic (TRISO) coated fuel particles. They are spherical grains of uranium dioxide or uranium carbide or uranium oxycarbide covered with four successive layers consisting of porous pyrolytic carbon (PyC), dense PyC, silicon carbide and the outer layer of dense PyC. TRISO coated fuel particles formed in this way ensure the retention of nuclear fission products and prevent their release into the environment [1,2]. Production of TRISO coated fuel particles consists of two main stages. First, spherical uranium kernel is formed employing the sol gel method, followed by deposition of PyC and SiC coatings at temperatures in the range 1250–1500 °C [1,2,7,8,9,10,11].
For over a year, the Institute of Nuclear Chemistry and Technology (Warsaw, Poland) has been implementing the project financed by the Polish government entitled “Research and analysis of selected chemical aspects of the production and use of TRISO fuel in the HTGR nuclear reactor”. An important part of this work is the development of a method for producing TRISO fuel precursors—spherical UO2 grains (Ø approx. 0.5 mm) as a result of the sol-gel process. Obtaining spherical nuclear fuel precursors with a controlled composition and shape has been the subject of research work carried out at the institute in recent years [12,13,14,15,16]. In all these works, the authors’ concept of modification of the standard sol-gel method, i.e., the Complex Sol-Gel Process (CSGP) was applied, where organometallic compounds and organic acid salts were used as substrates.
TRISO coated fuel particles must meet very rigorous conditions when it comes to the chemical composition of individual layers, especially with regard to the level of impurities. To a great extent, it depends on the purity of the materials and reagents used in the process. For this reason, it is necessary to possess reliable analytical procedures which enable the quantitative determination of elements present at trace concentration levels. The development of our own such methods for the chemical characterization of materials used to produce TRISO fuel is an important part of this project. Inductively Coupled Plasma Mass Spectrometry (ICP-MS) and Neutron Activation Analysis (NAA) are analytical techniques that occupy a high position in inorganic trace analysis. They are characterized by high sensitivity, accuracy and precision for many elements. Because of their unique advantages, ICP-MS and NAA are used in the chemical analysis of nuclear fuel to determine the level of impurities [17,18,19,20]. The analytical procedures developed in this paper are based on these techniques. Reagents used for manufacturing spherical UO2 grains by the sol-gel process were analyzed by ICP-MS, whereas uranyl nitrate, PyC and SiC, with the aid of NAA.

2. Materials and Methods

2.1. Reagents

Nitric acid (analytical grade, POCh, Poland) was additionally purified by a quartz sub-boiling distillation system. Hydrofluoric acid 40% suprapur grade (Merck) was applied. All other reagents used in this study: 30% H2O2 and H3BO3 (CHEMPUR, Poland) were of analytical grade. High purity water (18 MΩ cm resistivity) was obtained from the Milli-Q RG Ultra Pure Water System (Millipore Co. Burlington, MA, USA).

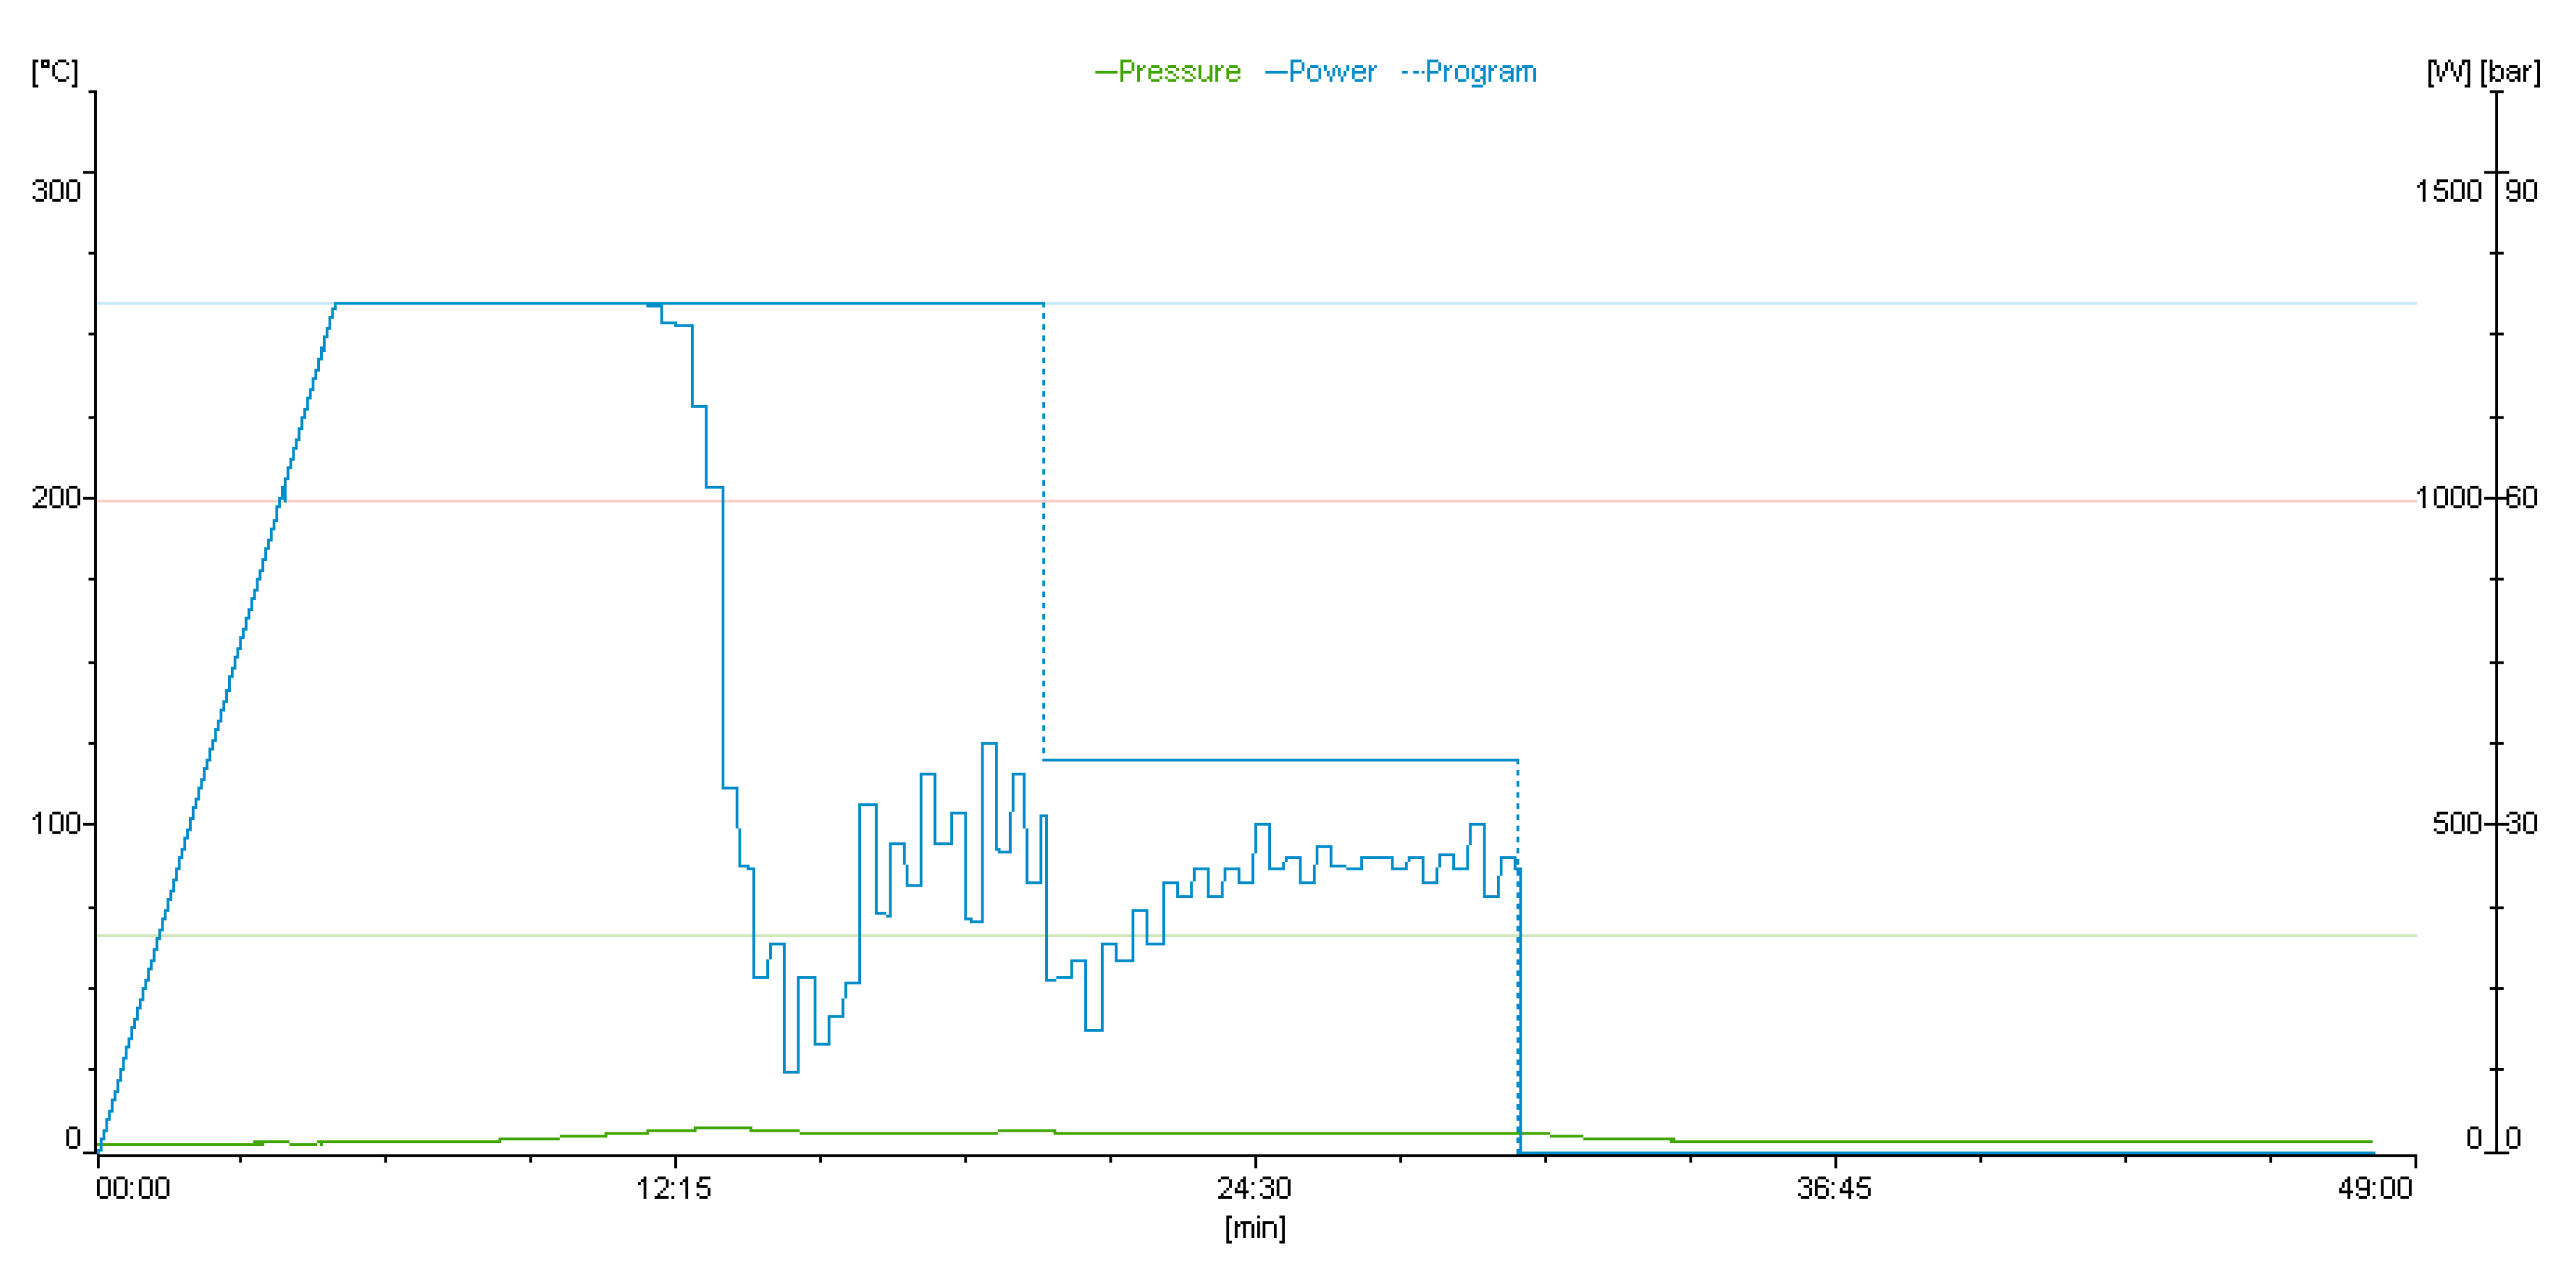
2.2. Sample Preparation for the Determination by ICP-MS

Samples of volatile reagents (3 mL) used for the TRISO production i.e., gasoline, extraction gasoline, ethanol and ammonia solution (30% NH3) were evaporated gently with conc. HNO3 in platinum evaporating dishes to a small volume. Microwave-assisted digestion was applied for the remaining reagents i.e., ascorbic acid, hexamethylenetetraamine (HMTA, C6H12N4) and silicone oil using the Multiwave 3000 high-pressure microwave system (Anton Paar GmbH). Known amounts of the materials were weighed into special Teflon vessels. Sample masses were ca. 500, 800 and 200 mg in the case of ascorbic acid, HMTA and silicone oil, respectively.
A single step process was realized for the digestion of ascorbic acid and HMTA using 6 mL conc. HNO3 and 6 mL conc. HNO3 + 1 mL of 30% H2O2, respectively. In order to decompose silicone oil, first, 5 mL conc. HNO3 + 1 mL of 30 % H2O2 + 3 mL of 40% HF were added. When decomposition was completed, the vessel was opened and 18 mL of 4% H3BO3 solution was introduced to the sample; then, the vessel was resealed and placed in the microwave oven to continue the process.
Solutions obtained as a result of evaporation of volatile substances were quantitatively transferred to 15 mL FALCON test tubes, whereas samples after microwave digestion were transferred to 50 mL FALCON test tubes. Preparation of a series of samples for chemical analysis by ICP-MS was carried out as follows. From the stock solutions, appropriate volumes were pippeted in to 15 mL FALCON test tubes and then diluted with 2% HNO3 + 5 ng/mL In-115 (internal standard) to a volume of 10 mL.

2.3. ICP-MS Measurements

The ELAN DRC II inductively coupled plasma quadrupole mass spectrometer (Perkin-Elmer) was used for ICP-MS measurements. Prior to the series of analyses, a daily performance check was executed aimed at the control and optimization of the instrument performance resulting in obtaining possibly maximal intensity of In+, Mg+, U+ and Th+ ions. Moreover, the oxides and double-charged ion formation was examined by measuring the ratio of CeO+/Ce+ and Ba2+/Ba+, respectively. Both ratios should be less than 3%, according to recommendations established by the ICP-MS manufacturer. Otherwise, the instrument optimization procedure was performed until the ratios had been attained the required values. The ICP-MS measurement was based on the following isotopes: 238U, 232Th, 66Zn, 59Co, 63Cu, 52Cr, 111Cd, 55Mn, 208Pb, 27Al, 51V, 60Ni, 57Fe, 121Sb. Indium was applied as an internal standard with the concentration of 5 ng mL−1. The applied instrument operation parameters were as follows: RF power 1050 W, lens voltage 6.25 V, detector mode—dual, plasma, auxiliary and nebulizer argon flow were 13.0 L, 1.2 L and 0.92 L min−1, respectively. A crossflow nebulizer with Scott double-pass spray chamber and Ni cones was employed.

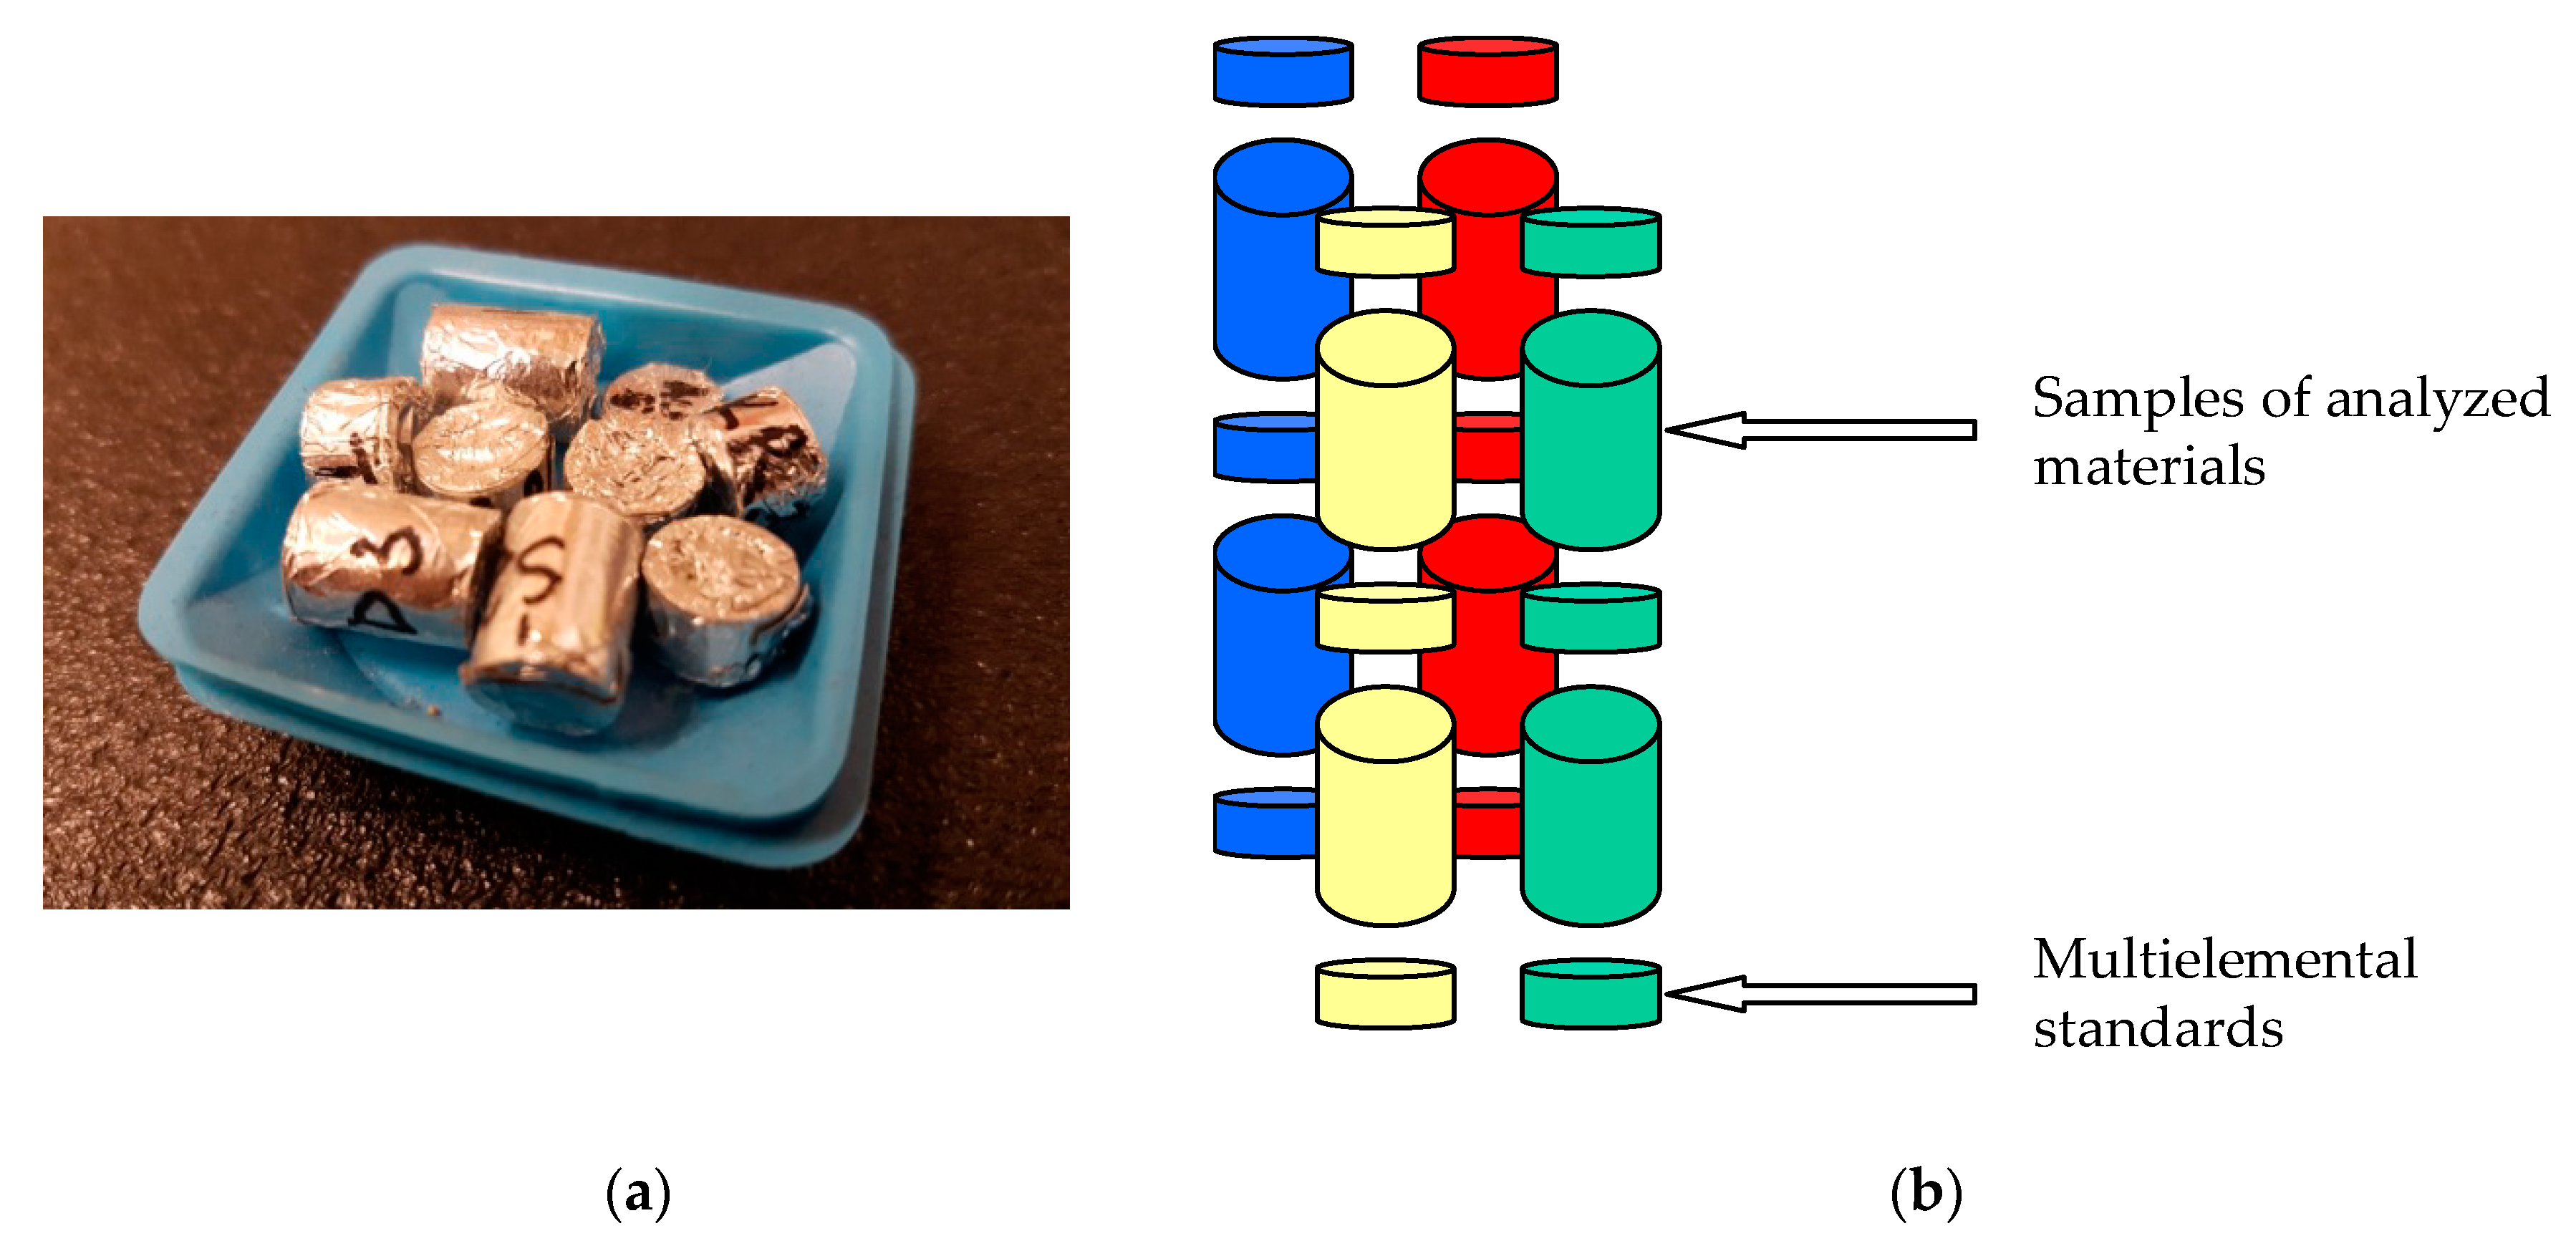
2.4. Sample Preparation for the Determination by NAA and Neutron Activation

The sample size varied from a few dozen micrograms (uranium oxides or salts) to a few hundred milligrams (silicon carbide, pyrolytic graphite and ascorbic acid). The materials were weighed into polyethylene (PE) capsules (Type “V”, Vrije Universiteit, Biologisch Laboratorium, the Netherlands) and firmly closed. The elemental standards (approximate masses: Hf—4 μg, Zn—35 μg, Co—5 μg, Sb—8 μg, Fe—500 μg, Rb—7.5 μg, Cr—5 μg, Se—5 μg, Sc—2 μg, Ce—5 μg, Eu—2 μg, Ag—5 μg) were prepared in a following manner. The appropriate volume (from several to several dozen μL) of a given element standard solution was pipetted onto a filter paper disc placed in a PE capsule. The capsule was immediately closed, weighed and then opened again, followed by evaporation to dryness in an oven. This operation was repeated for the next elements included in the given standard and as a result, the mass of each analyte is exactly known. Each capsule was wrapped in thin aluminum foil, and afterwards, the irradiation package consisting of samples, standards and an empty capsule (blank) was formed. The items were arranged in a fixed order (see Section 3.2) and wrapped together in thicker Al foil. Neutron activation was performed in the nuclear reactor MARIA (Świerk near Warsaw, Poland) at a thermal neutron flux of 9.7 × 10¹³ n cm−2 s−1 for 50 min. The cooling time was 3–7 days, depending on the activity of a given analyzed material.

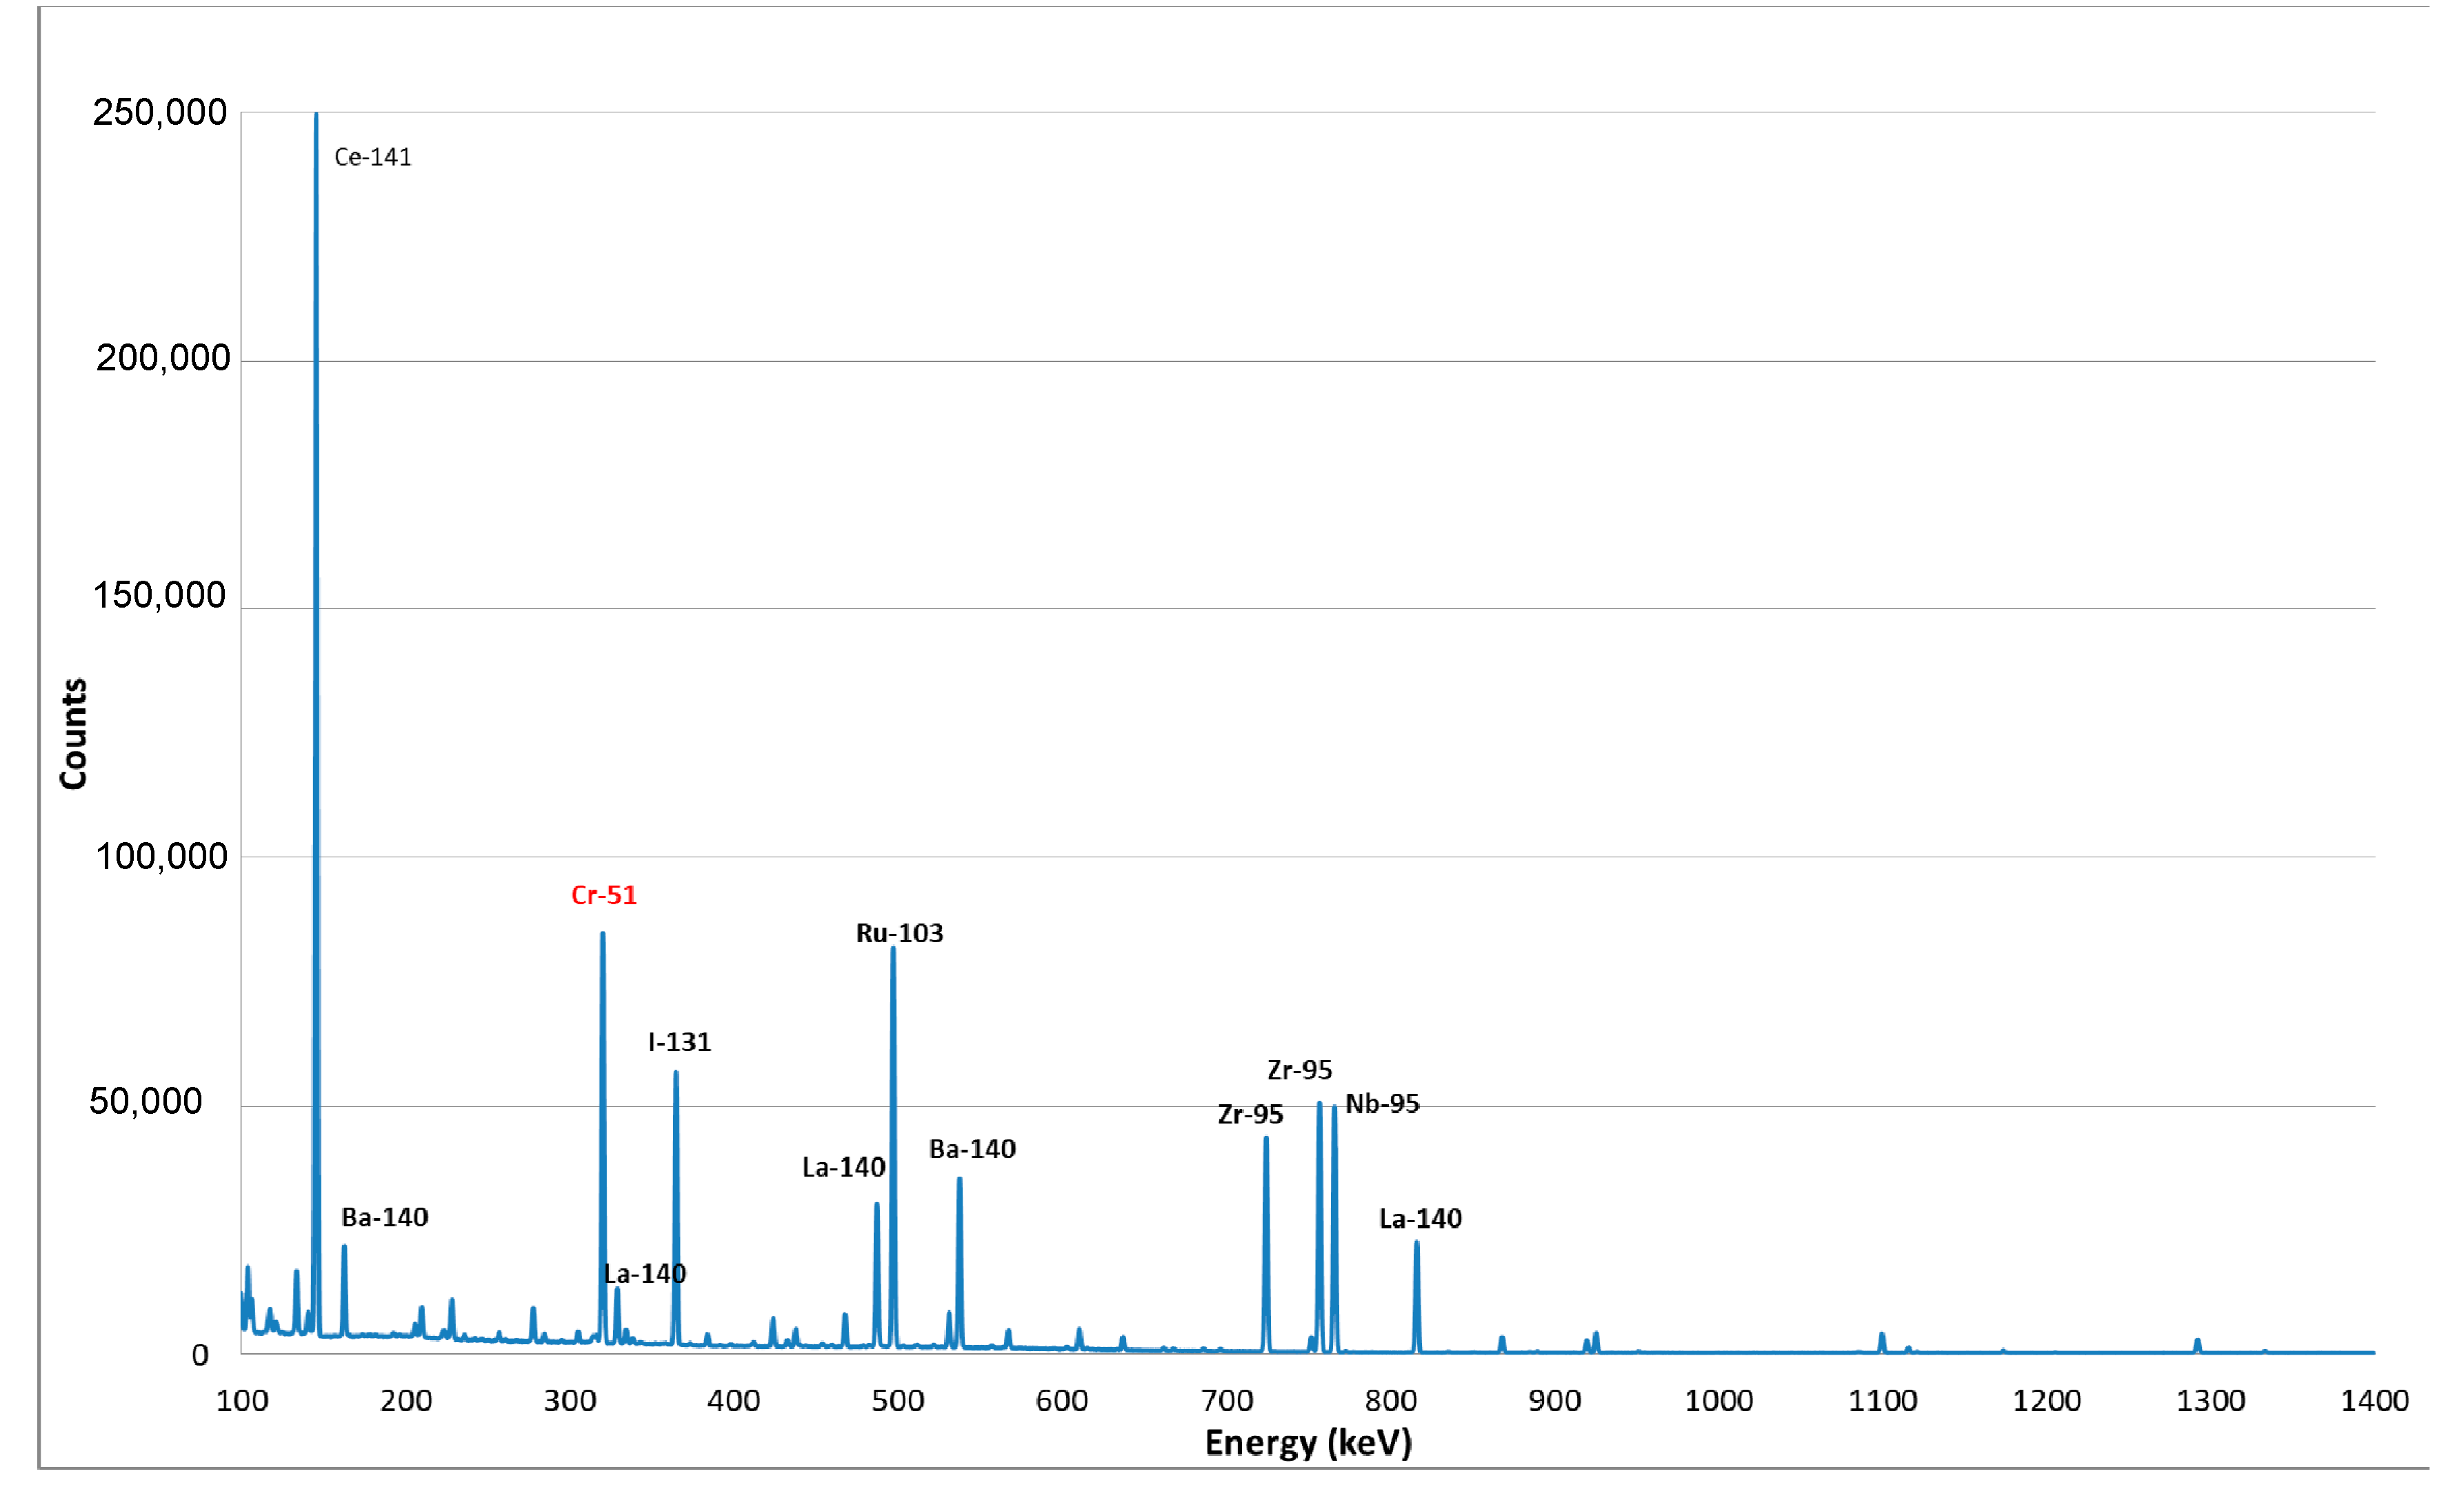
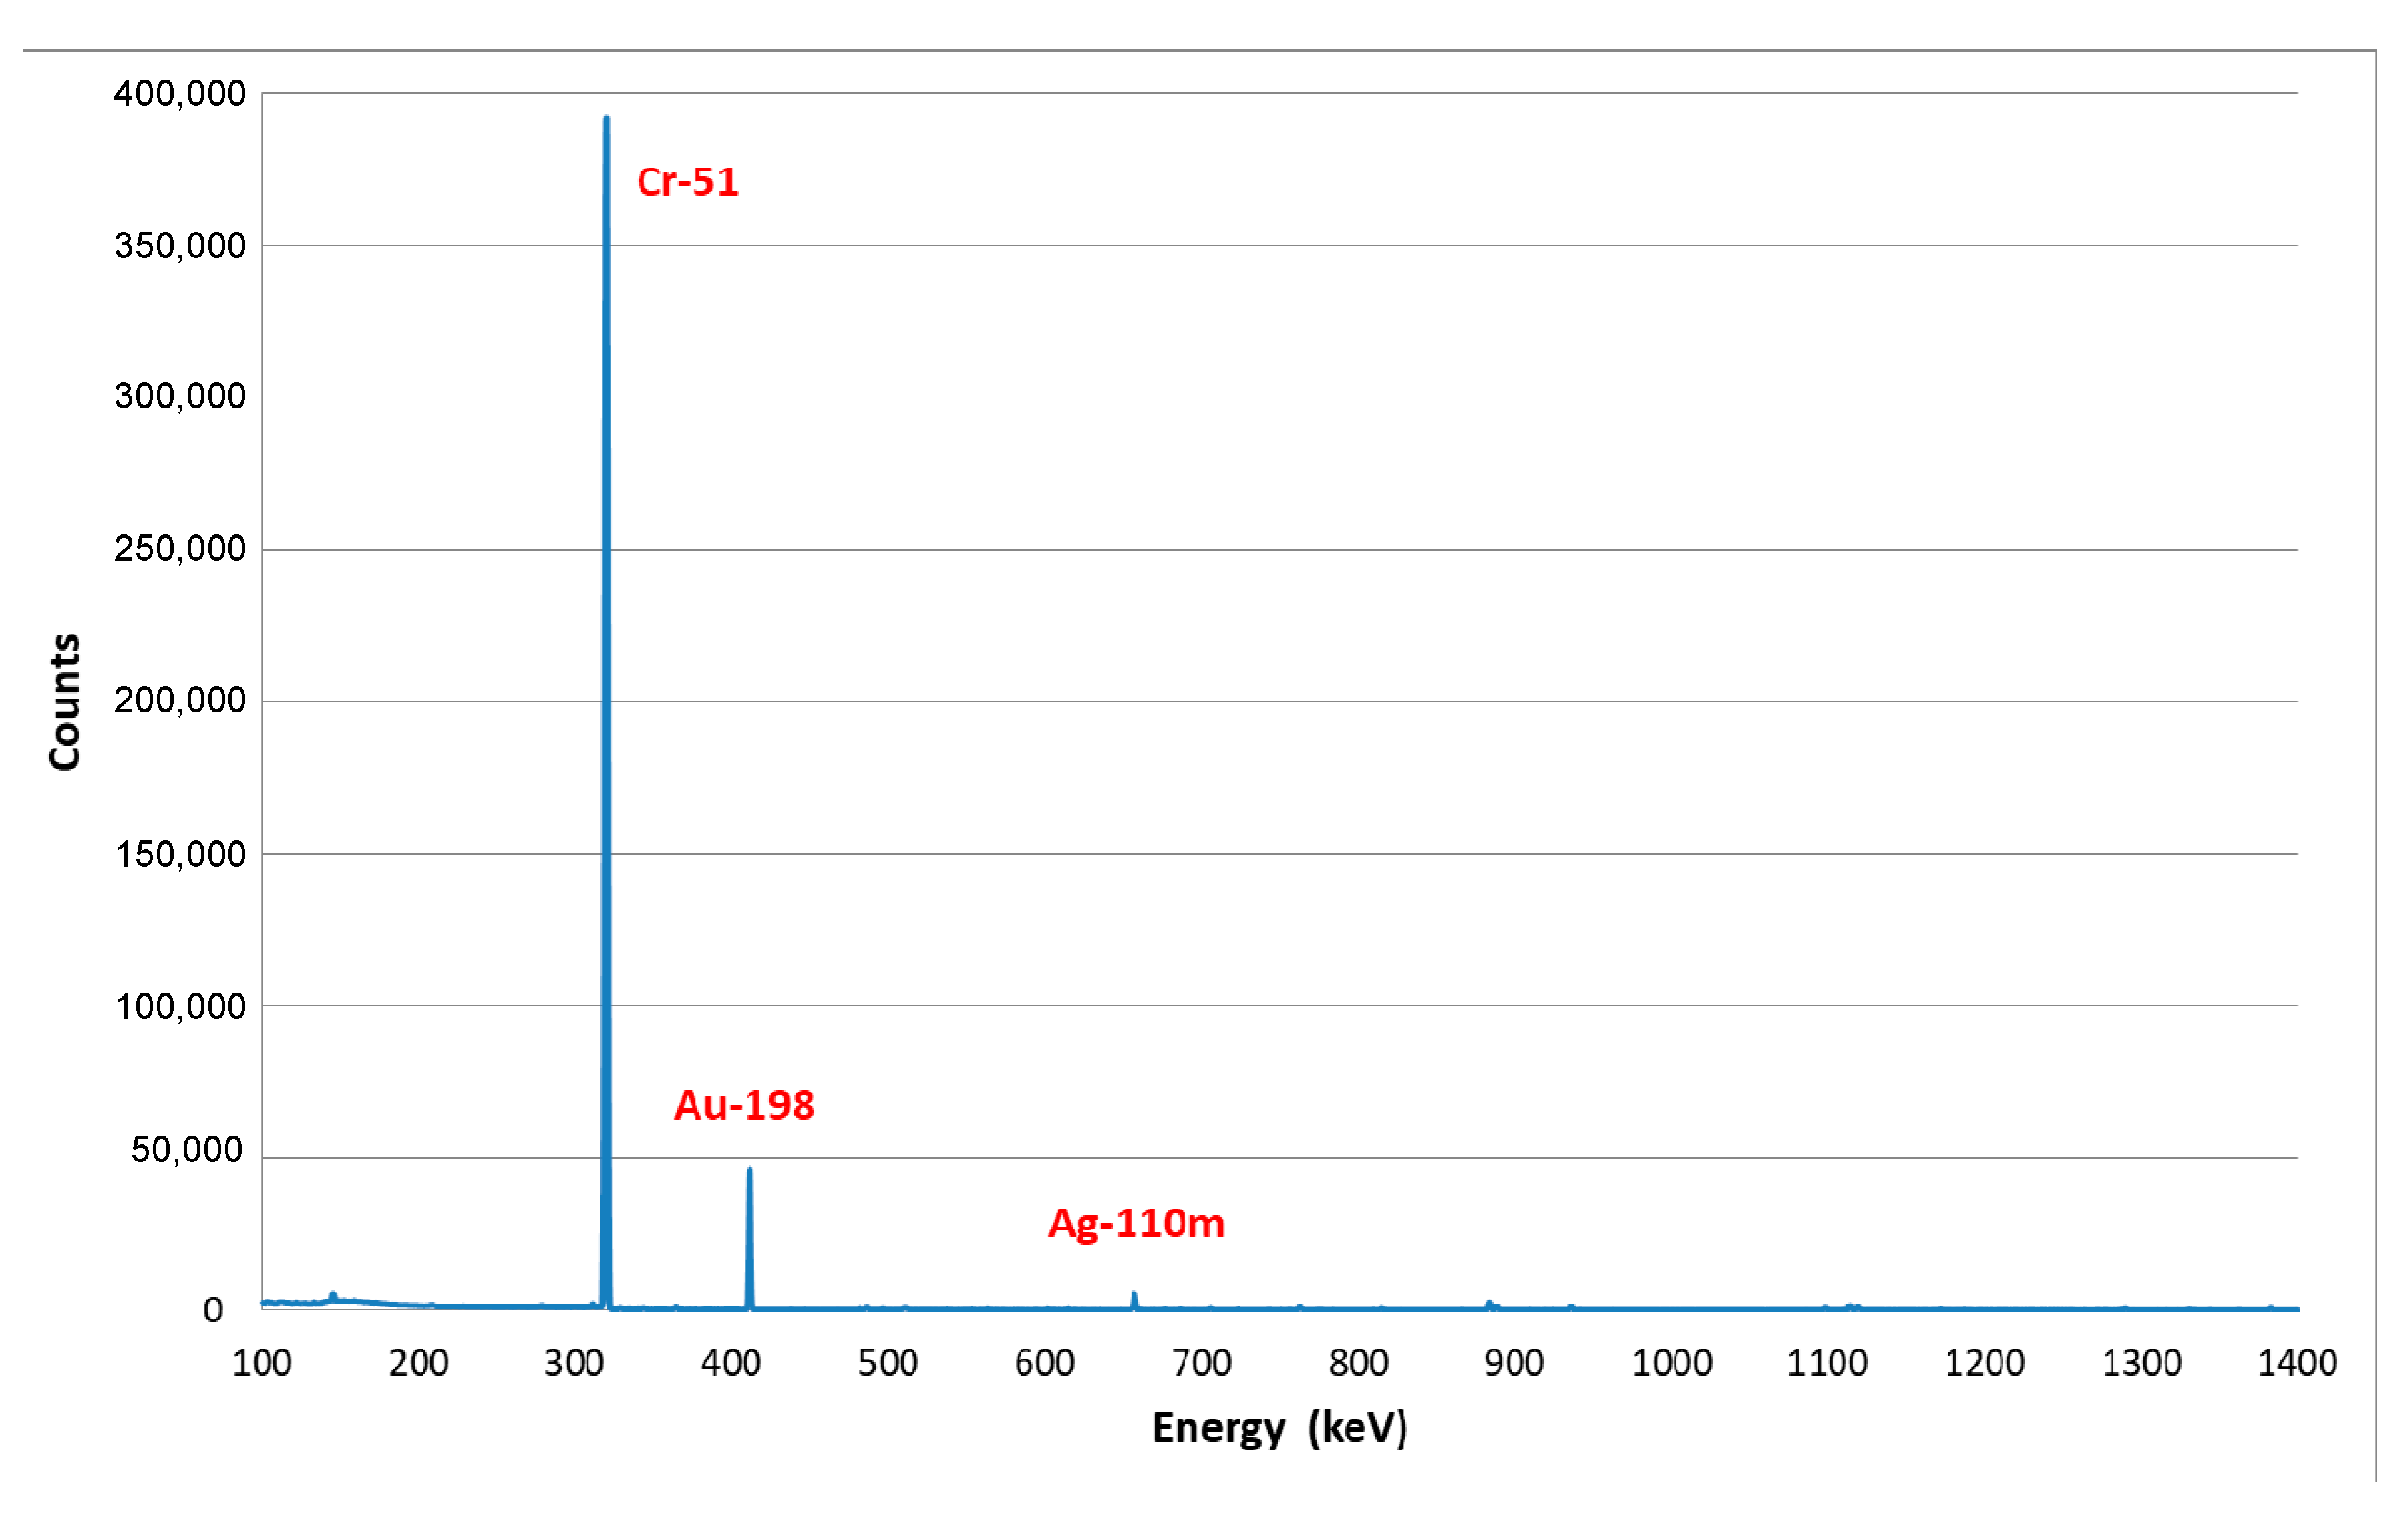
2.5. Gamma-Ray Spectrometric Measurements

Gamma-ray spectrometric measurements of neutron irradiated samples and standards were performed with the aid of a γ-ray spectrometer (GENIE 2000 Canberra Gamma Spectroscopy System). It consists of a well type HPGe (high purity germanium) detector coupled with a multichannel analyzer and control software. The detector active volume was 255 cm3, relative efficiency was 55%, well depth was 40 mm and well diameter was 16 mm. The resolution amounted to 2.15 keV for the 1332 keV peak of 60Co. Measurement time varied between 0.5 and 35 h. Count rates of the isotopes of interest in the samples were compared to those of the standards for calculation of concentrations. All count rates were corrected for radioactive decay. The concentration of an element Cx (mg/kg) was calculated from Equation (1):
C x ( mg kg 1 ) = { A s × m s t A s t × m s exp [ 0.693 × ( t s t s t ) T ] B L m s } × 10 6
where mst is the mass of an element in the standard (µg); ms is the mass of the dry sample (µg); BL is the value of the blank for a given element (µg) in a given series of determinations; T is the half-life of the the given radionuclide; tstst is the clock time difference between the beginning of the measurement of the sample and the standard, respectively; A s / s t is the count rate of the radionuclide corrected for decay during the measurement according to Equation (2):
A s / s t = N s / s t × 0.693 T × Δ t s / s t τ s / s t [ 1 exp ( 0.693 × Δ t s / s t T ) ]
where Ns/st is the net peak area (number of counts) corresponding to a given radionuclide, Δts/st is the time of duration of the measurement (clock time), τs/st is the live (effective) time of the measurement.

3. Results and Discussion

3.1. Chemical Characterization with the Use of Inductively Coupled Plasma Mass Spectrometry (ICP-MS)

Inductively Coupled Plasma Mass Spectrometry (ICP-MS) is an instrumental analytical technique offering very low detection limits for a great number of elements. It was commercially introduced in the early 1980s, and since then, its position among other analytical methods has systematically grown. Nowadays, ICP-MS plays a very important role in inorganic trace analysis due to high sensitivity, accuracy and precision.
Chemical purity is an essential parameter, which qualifies given materials as substrates for TRISO fuel production. In this study, ICP-MS was applied for analysis of the following reagents: gasoline, extraction gasoline, ethanol, ammonia solution, ascorbic acid, hexamethylenetetraamine (HMTA, C6H12N4) and silicone oil. Chemical analysis by this technique requires samples of examined materials in the form of solution. Depending on physical and chemical properties of a given substance, two essential digestion methods were elaborated. The first, intended for volatile materials (gasoline, extraction gasoline, ethanol, ammonia solution), involves the evaporation of the sample with conc. HNO3 to a small volume in platinum evaporating dishes. The second procedure, that is, microwave-assisted digestion with the aid of the high-pressure microwave system, was applied for other analyzed chemicals. In the case of ascorbic acid and hexamethylenetetraamine, only a single step process was performed employing conc. HNO3 or the mixture of conc. HNO3 and 30% H2O2, respectively. More complicated material i.e., silicone oil required the use of a two-stage decomposition. At first, the samples were dissolved with the mixture of conc. HNO3 and 40% HF. Then, 4% boric acid solution was added to reaction vessels in order to remove the excess of fluoride ions by complexation. The above described digestion methods resulted in clear solutions of samples of all analyzed substances in nitric acid. This medium, contrary to sulfuric acid and hydrochloric acid, is strongly recommended for further chemical analysis by the ICP-MS technique.
The temperature as well as pressure inside the closed vessels were monitored and controlled during the reaction. As an example, the recorded course of temperature and pressure change is illustrated in Figure 1.
Solutions of the analyzed materials after appropriate dilution with 2% HNO3 containing 5 ng/mL In-115 (internal standard) were measured by ICP-MS. The following elements were determined: U, Zn, Mn, Co, Cd, Th, Cu, Pb, Cr, Al, V, Ni, Fe and Sb. The element content obtained as a result of the realized analytical procedure described above is shown in Table 1.
As can be seen from Table 1, the greatest metal content was found in the silicone oil, whereas in other products, can be regarded as an acceptable level. It seems, that the aim of separate investigations should be an assessment whether and to what extent, impurities present in the silicone oil influence on the quality of TRISO fuel.
The newly developed analytical method should have an estimated uncertainty for the results obtained. The influence of particular contributions on the combined standard uncertainty of the determination of a given element by ICP-MS can be illustrated using the Ishikawa [21,22,23,24] diagram (so-called fishbone diagram) presented in Figure 2.
Sources of uncertainty in the elaborated analytical procedure based on ICP-MS can be divided into two general categories:
  • preparation of samples and standards (U1),
  • measurement by ICP-MS technique (U2).
Individual uncertainties were estimated experimentally (e.g., digestion, dilution, plasma stability, etc.) or based on manufacturers’ data (weight accuracy, purity of standard solutions). The combined standard uncertainty U1 and U2 was calculated as the root of the sum of squares of individual standard uncertainties ui (expressed as a percentage) [22,23,24,25] (Equation (3)):
U n = u i 2 ,
Finally, the expanded uncertainty (U) of the whole analytical procedure for a given analyte was calculated from Equation (4):
U = k U 1 2 + U 2 2 ,
where k is the coverage factor. Usually k = 2 is assumed to achieve the confidence level approximately 95% [22,23,24,25]. The values of the expanded uncertainties (k = 2) for the determined elements were as follows: 5% for Th and U; 10% for Cd, Co, Cu, Mn, Ni, Pb, Sb, V and Zn; 15% for Al, Cr and Fe.
Detection limits were estimated from the analysis of blank samples. The procedure detection limits (LOD) were calculated as three times the standard deviation (s) of the signal from reagent blanks. Their values obtained for the determined elements by ICP-MS are listed in Table 2.

3.2. Chemical Characterization with the Use of Neutron Activation Analysis (NAA)

Neutron Activation Analysis (NAA) is a method of detection and quantitative determination of elements based on the measurement of activity of artificial radioisotopes formed as a result of neutron irradiation. It has been developing since the end of World War II, most dynamically in the first thirty years. NAA still occupies a unique position in inorganic trace analysis due to its unique features, namely high sensitivity for numerous elements, significant reduction in blank, the possibility of performing multielemental nondestructive analyses of low-weight solid samples. The long history of this analytical technique means that its capabilities and limitations are well known, and sources of errors and methods of their elimination are well recognized.
Instrumental Neutron Activation Analysis (INAA) was applied in this work for the chemical purity assessment of substances forming TRISO coated fuel particle that is uranium dioxide fuel kernel, pyrolytic carbon (PyC) buffer layer, inner PyC layer, SiC layer and outer PyC layer. Specially designed for the needs of NAA, PE capsules were used for the neutron activation of analyzed materials and standards. The detailed procedure for their preparation is described in the Section 2.3. A way of creating of the irradiation package is illustrated in Figure 3. The longer capsules contain the samples, whereas the shorter ones the standards. In the irradiation package, there are four bars, and each of them consists of two samples and three standards. As can be seen, each of the samples is placed between two standards. Such an arrangement enables, later on, the estimation of the uncertainty related to the neutron flux inhomogeneity in the nuclear reactor. Thus, the standards are not only a base for quantitative determination of analytes, but they also play a role as neutron flux monitors.
Three days after neutron activation, all samples and standards were unpacked from Al foil and placed in plastic test tubes. Gamma-ray spectrometric measurements were conducted using a well type detector, coupled with a multichannel analyzer and control software. The ideally matched test tube diameter ensured stable and repeatable measurement geometry c.f. Figure 4.
The measurements were carried out in live time mode from 0.5 to 35 h depending on the activity of the sample, which also determined the cooling time varying between 3 and 7 days. The gamma-ray spectra of the neutron irradiated basic substrates for the production of TRISO fuel, i.e., uranyl nitrate, pyrolytic carbon and silicon carbide, are shown in Figure 5, Figure 6 and Figure 7.
The gamma radiation emitter is a radionuclide that emits gamma quanta of its characteristic energy. The gamma-ray spectrum obtained as a result of the γ-spectrometric measurement is in fact a dependence of counted pulses vs. energy, expressed in keV units. It is composed of Compton’s continuous background and the peaks belonging to the radionuclides present in the examined sample. The peak area is a measure of activity, while its location in the spectrum allows the identification of a given radioisotope. Thus, gamma-ray spectrometry is an analytical technique that enables both qualitative and quantitative multielemental chemical analysis. Numerical data regarding the location and surface of all detected peaks were generated as a result of mathematical processing of the recorded spectrum using γ-ray spectrometry control software.
One curiosity in all recorded spectra (Figure 5, Figure 6 and Figure 7) is the occurrence of peaks with 320 and 412 keV energies corresponding to 51Cr and 198Au, respectively. This does not mean that traces of these metals were present in the analyzed materials, because an identical image was obtained by studying the blank spectrum (empty PE capsule). This is probably the result of the technological process of polyethylene production from which the capsules were made. The spectrum presented in Figure 5 proves high chemical purity of uranyl nitrate, because one can only find the presence of isotopes that are products of 235U fission, such as 141Ce, 140Ba, 140La, 103Ru, 95Zr and 95Nb. In the case of pyrolytic graphite (Figure 6), apart from chromium and gold present in the blank, as mentioned above, only the ultratrace content of silver (320 ng/g) was determined. Slightly more impurities, however, still at a very low concentration, were found in the analyzed silicon carbide c.f. Figure 7. The identification of the peaks visible in the spectrum indicates that the material contained Co, Eu, Fe, Hf and Sc. The analytical results calculated while applying Equations (1) and (2) (see Section 2.4) are reported in Table 3.
The absence of other investigated elements in the analyzed materials means that their contents were below the relevant detection limits. These values are obviously dependent on such parameters as activation, cooling and measurement time, neutron flux and sample mass. The detection limits obtained in this study, calculated according to Rogers’ approach for the needs of NAA [26], are given in Table 4.
An estimate of the combined standard uncertainty was also performed for NAA determinations. The Ishikawa diagram for the entire analytical procedure using this technique is shown in Figure 8.
Sources of uncertainty can be divided into three general categories:
  • preparation of samples and standards (U1);
  • neutron irradiation in the nuclear reactor (U2);
  • gamma-ray spectrometric measurement (U3).
Analogously like in the case of ICP-MS, the expanded uncertainty (U) of the whole analytical procedure for a given analyte was calculated from Equation (5):
U = k U 1 2 + U 2 2 + U 3 2 ,
The values of the expanded uncertainties (k = 2) for the determined elements were in the range 3–6 %.

4. Conclusions

Two analytical procedures aimed at chemical purity assessment of reagents and substances used for the production of TRISO coated fuel particles have been developed. The first, based on inductively coupled plasma mass spectrometry (ICP-MS), was used for the chemical analysis of gasoline, extraction gasoline, ethanol, ammonia solution, ascorbic acid, hexamethylenetetramine and silicone oil. The second procedure, based on neutron activation analysis (NAA) was applied to assess the chemical purity of uranyl nitrate, pyrolytic carbon and silicon carbide. Both developed methods allowed the determination of elements at trace levels in the analyzed materials. Analytical results revealed that they are characterized by a high level of chemical purity. Most of the determined elements were below the detection limit, and the content of the remaining elements did not exceed several hundred ppb. A certain exception was the analyzed silicone oil, in which the level of impurities was significantly higher. The analytical procedures presented in the paper seem to be a solid basis for developing methods of chemical analysis of the produced TRISO fuel particles in the near future.

Author Contributions

Methodology, E.C., J.D., A.B.-C. and P.K.; investigation, E.C., P.K., J.D. and M.P.; writing—original draft preparation, Z.S.; writing—review and editing, E.C. and Z.S. All authors have read and agreed to the published version of the manuscript.

Funding

The work carried out under this project was financed by the National Center for Research and Development, contract number: GOSPOSTRATEG1/385872/22/NCBR/2019.

Acknowledgments

The authors thank Halina Polkowska-Motrenko for advice and help during realization of this study.

Conflicts of Interest

The authors declare no conflict of interest.

References

  1. International Atomic Energy Agency. High Temperature Gas Cooled Reactor Fuels and Materials; IAEA-TECHDOC-1645; International Atomic Energy Agency: Vienna, Austria, 2010. [Google Scholar]
  2. Nishihara, T.; Yan, X.; Tachibana, Y.; Shibata, T.; Ohashi, H.; Kubo, S.; Inaba, Y.; Nakagawa, S.; Goto, M.; Ueta, S.; et al. Excellent Feature of Japanese HTGR Technologies; JAEA-Technology 2018-004; Japan Atomic Energy Agency: Tokai, Japan, 2018. [Google Scholar] [CrossRef]
  3. Wang, J.; Gu, Y. Parametric studies on different gas turbine cycles for a high temperature gas-cooled reactor. Nucl. Eng. Des. 2005, 235, 1761–1772. [Google Scholar] [CrossRef]
  4. Quade, R.N.; McMain, A.T. Hydrogen production with a high-temperature gas-cooled reactor (HTGR). In Hydrogen Energy; Veziroglu, T.N., Ed.; Plenum Press: New York, NY, USA, 1975; pp. 137–154. [Google Scholar]
  5. Sakaba, N.; Kasahara, S.; Onuki, K.; Kunitomia, K. Conceptual design of hydrogen production system with thermochemical water-splitting iodine–sulphur process utilizing heat from the high-temperature gas-cooled reactor HTTR. Int. J. Hydrog. Energy 2007, 32, 4160–4169. [Google Scholar] [CrossRef]
  6. Chao Fang, C.; Morris, R.; Li, F. Safety features of high temperature gas cooled reactor. Sci. Technol. Nucl. Install. 2017, 2017, 9160971. [Google Scholar] [CrossRef]
  7. Verfondern, K.; Nabielek, H.; Kendall, J.M. Coated particle fuel for high temperature gas cooled reactors. Nucl. Eng. Technol. 2007, 39, 603–616. [Google Scholar] [CrossRef] [Green Version]
  8. Petti, D.A.; Buongiorno, J.; Maki, J.T.; Hobbins, R.R.; Miller, G.K. Key differences in the fabrication, irradiation and high temperature accident testing of US and German TRISO-coated particle fuel, and their implications on fuel performance. Nucl. Eng. Des. 2003, 222, 281–297. [Google Scholar] [CrossRef] [Green Version]
  9. Tang, C.; Tang, Y.; Zhu, J.; Qiu, X.; Li, J.; Xu, S. Research and development of fuel element for Chinese 10 MW high temperature gas-cooled reactor. J. Nucl. Sci. Technol. 2000, 37, 802–806. [Google Scholar] [CrossRef]
  10. Zhou, X.; Lu, Z.; Zhang, J.; Liu, B.; Zou, Y.; Tang, C.; Tang, Y. Preparation of spherical fuel elements for HTR-PM in INET. Nucl. Eng. Des. 2013, 263, 456–461. [Google Scholar]
  11. Fu, X.; Takahashi, M.; Ueta, S.; Sawa, K. Comparison of HTGR Fuel Design, Manufacture and Quality Control Methods between Japan and China; JAERI–Tech 2002-049; Japan Atomic Energy Research Institute: Tokai, Japan, 2002.
  12. Brykała, M.; Deptuła, A.; Rogowski, M.; Łada, W.; Olczak, T.; Wawszczak, D.; Smoliński, T.; Wójtowicz, P.; Modolo, G. Synthesis of microspheres of triuranium octaoxide by simultaneous water and nitrate extraction from ascorbate-uranyl sols. J. Radioanal. Nucl. Chem. 2014, 299, 651–655. [Google Scholar] [CrossRef] [PubMed] [Green Version]
  13. Brykała, M.; Deptuła, A.; Rogowski, M.; Łada, W. Modification of ICHTJ sol gel process for preparation of medium sized ceramic spheres (Ø < 100 µm). Ceram. Int. 2015, 41, 13025–13033. [Google Scholar]
  14. Brykała, M.; Rogowski, M.; Olczak, T. Carbonization of solid uranyl-ascorbate gel as an indirect step of uranium carbide synthesis. Nukleonika 2015, 60, 921–925. [Google Scholar] [CrossRef] [Green Version]
  15. Brykała, M.; Rogowski, M. Preparation of microspheres of carbon black dispersion in uranyl-ascorbate gels as precursors for uranium carbide. Prog. Nucl. Energy 2016, 89, 132–139. [Google Scholar] [CrossRef]
  16. Brykała, M.; Rogowski, M. Complex sol-gel process for producing small ThO2 microspheres. J. Nucl. Mater. 2016, 473, 249–255. [Google Scholar] [CrossRef]
  17. De Souza, A.L.; Cotrim, M.E.B.; Pires, M.A.F. An overview of spectrometric techniques and sample preparation for the determination of impurities in uranium nuclear fuel grade. Microchem. J. 2013, 106, 194–201. [Google Scholar] [CrossRef]
  18. Sadikov, I.I.; Rakhimov, A.V.; Salimov, M.I.; Zinov’ev, V.G.; Mukhamedshina, N.M.F.; Tashimova, A. Neutron activation analysis of pure uranium: Preconcentration of impurity elements. J. Radioanal. Nucl. Chem. 2009, 280, 489–493. [Google Scholar] [CrossRef]
  19. Oliveira Junior, O.P.; Sarkis, J.E.S. Determination of impurities in uranium oxide by inductively coupled plasma mass spectrometry (ICPMS) by the matrix matching method. J. Radioanal. Nucl. Chem. 2002, 254, 519–526. [Google Scholar] [CrossRef]
  20. Bürger, S.; Riciputi, L.R.; Bostick, D.A. Determination of impurities in uranium matrices by time-of-flight ICP-MS using matrix-matched method. J. Radioanal. Nucl. Chem. 2007, 274, 491–505. [Google Scholar] [CrossRef]
  21. Ishikawa, K. Introduction to Quality Control; Kluwer: Dordrecht, The Netherlands, 1991. [Google Scholar]
  22. International Organization for Standardization. ISO Guide to the Expression of Uncertainty in Measurement (GUM); International Organization for Standardization: Geneva, Switzerland, 1993. [Google Scholar]
  23. EUROLAB. Measurement Uncertainty Revisited: Alternative Approaches to Uncertainty Evaluation; Technical Report 1/2007; European Federation of National Associations of Measurement, Testing and Analytical Laboratories: Brussels, Belgium, 2007. [Google Scholar]
  24. Meyer, V.R. Measurement uncertainty. J. Chromatogr. A 2007, 1158, 15–24. [Google Scholar] [CrossRef] [PubMed]
  25. Konieczka, P.; Namieśnik, J. Quality Assurance and Quality Control in the Chemical Laboratory: A Practical Approach; CRC Press Inc–Taylor & Francis Ltd.: Boca Raton, FL, USA; London, UK, 2009. [Google Scholar]
  26. Rogers, V.C. Detection limits for gamma-ray spectral analysis. Anal. Chem. 1970, 42, 807–808. [Google Scholar] [CrossRef]
Figure 1. Parameters of the digestion process and the course of temperature and pressure change in the microwave system (Anton Paar GmbH).
Sustainability 12 07221 g001
Figure 2. The Ishikawa diagram for the analytical procedure applying the ICP-MS technique. Cx is the content of the given analyte in the analyzed material.
Sustainability 12 07221 g002
Figure 3. Creation of the irradiation package for neutron irradiation in the nuclear reactor. (a) polyethylene PE capsules with samples and standards wrapped individually in thin Al foil; (b) samples and standards arrangement in the irradiation package.
Sustainability 12 07221 g003
Figure 4. Spectrometric measurement of gamma radiation of a sample placed in the detector well.
Sustainability 12 07221 g004
Figure 5. Gamma-ray spectrum of analyzed uranyl nitrate. Thermal neutron flux 9.7 × 10¹³ n cm−2 s−1, irradiation time 50 min, cooling time 7 days, measurement time 35 h.
Sustainability 12 07221 g005
Figure 6. Gamma-ray spectrum of analyzed pyrolitic graphite. Thermal neutron flux 9.7 × 10¹³ n cm−2, s−1 irradiation time 50 min, cooling time 7 days, measurement time 35 h.
Sustainability 12 07221 g006
Figure 7. Gamma-ray spectrum of analyzed silicon carbide. Thermal neutron flux 9.7 × 10¹³ n cm−2 s−1, irradiation time 50 min, cooling time 7 days, measurement time 35 h.
Sustainability 12 07221 g007
Figure 8. The Ishikawa diagram for the analytical procedure applying the NAA technique. Cx is the content of the given analyte in the analyzed material.
Sustainability 12 07221 g008
Table 1. Mean element content in analyzed materials as determined by inductively coupled plasma mass spectrometry (ICP-MS).
Element
(Unit)
Content
Ethanol30 % NH3 SolutionExtraction GasolineGasolineAscorbic AcidSilicone OilHMTA 1
U (ppb)<LOD 25.4<LOD5.4<LOD152<LOD
Mn (ppb)<LOD<LOD39.5<LOD1891269926
Co (ppb)<LOD<LOD30.1<LOD<LOD<LOD<LOD
Cd (ppb)<LOD<LOD<LOD<LOD<LOD<LOD<LOD
Th (ppb)<LOD131182<LOD<LOD1899<LOD
Cu (ppb)<LOD<LOD<LOD<LOD<LOD1413524
Pb (ppb)<LOD<LOD<LOD<LOD9871015602
Cr (ppb)<LOD<LOD<LOD<LOD<LOD<LOD970
V (ppb)<LOD<LOD<LOD<LOD<LOD205<LOD
Sb (ppb)<LOD<LOD<LOD<LOD<LOD<LOD<LOD
Al (ppm)<LOD0.50.30.217.947.9<LOD
Ni (ppm)<LOD<LOD0.7<LOD<LOD2.5<LOD
Fe (ppm)0.30.61.4<LOD<LOD186153
Zn (ppm)<LOD<LOD<LOD<LOD0.25.0<LOD
1 hexamethylenetetraamine, 2 <LOD denotes below limit of detection.
Table 2. Estimated detection limits for elements as determined by inductively coupled plasma mass spectrometry (ICP-MS).
ElementLOD, mg/ kg (ppm)ElementLOD, mg/kg (ppm)
Al0.150Ni0.100
Cd0.006Pb0.030
Cr0.255Sb0.060
Co0.005Th0.003
Cu0.050U0.001
Fe0.090V0.054
Mn0.010Zn0.053
Table 3. Mean concentrations of elements as determined by neutron activation analysis (NAA) in the analyzed silica carbide.
ElementConcentration, ng/g (ppb)ElementConcentration, ng/g (ppb)
Co678Hf648
Eu42Sc140
Fe980
Table 4. The detection limits obtained for sample mass 100 mg, thermal neutron flux 9.7 × 10¹³ n cm−2 s−1, activation time 50 min, cooling time 7 days, measurement time 7 h.
ElementDetection Limit,
ng/g (ppb)
ElementDetection Limit,
ng/g (ppb)
Ag80Hf10
Ce850Rb200
Co100Sb150
Cr2500Sc10
Eu10Se150
Fe1500Zn750

