1. Introduction
According to the Oxford Handbook of Megaproject Management (2017), “Megaprojects are large scale, complex ventures that typically cost
$1 billion or more, take many years to develop and build, involve multiple public and private stakeholders, are transformational, and impact millions of people” [
1]. However, in some contexts, a much smaller project could constitute a megaproject (for example, in developing countries). Brooks et al. gave a more general definition: “Megaprojects are temporary endeavors (i.e., projects) characterized by large investment commitment, vast complexity (especially in organizational terms), and long–lasting impact on the economy, the environment, and society” [
2]. Locatelli et al. gave the definition that “Megaprojects are extremely large scale investment projects typically costing more than EUR 0.5 billion. They include power plants, infrastructural projects and even cultural events. Historical data show very poor performance for megaprojects” [
3].
In the development of these great and complex projects, there are notable differences between the employer and consultant [
4]. The law of supply and demand says that both parties will strike a balance when the price at which they are willing to enter into a business relationship and the limit of waiving their initial expectations match [
5,
6].
The theory of this balance begins to falter when the expectations and objectives of the professionals who have to develop the project, both from the contractor’s side and from the promoter’s side, do not coincide with those of the people who participated in the definition and negotiation of the project contract that regulates the project [
7].
As a consequence of the differing points of view, differences arise in the execution of the project. These differences are manifested in the quality of the product offered, and influence not only what is built and delivered, but also factors related to the operation of the infrastructure. Factors such as operating conditions and maintenance needs will determine future profitability, not just the price and the term of the project execution [
8].
The possible problems in the interpretation of the contracts that are carried out for the execution of megaprojects in the field of the energy industry develop, fundamentally, into delays and errors in the execution of the construction. This implies that resources are sometimes used inefficiently, which results in a loss of both economic and resources. Furthermore, the differences between project conception and execution are, in many cases, the cause for the increase in operating and maintenance costs once the plant is in operation.
Several authors have studied the relevance of the OPEX (operational expenditure) on the economic feasibility of electric power generation plants [
9,
10]. Ho et al. established that in some cases OPEX can reach 70–75% of operating costs, while CAPEX (capital expenditure) would represent the other 20–25% [
11]. Under these circumstances, it can be understood that the optimization of the operating costs would make profitable the project itself, or make it unsustainable if the expenses are not controlled and known.
By improving the way contracts are written, these costs can be minimized, leading to a more sustainable use of resources and, therefore, economic and energy savings. Previous papers published have established the importance of improving contracts for the execution of megaprojects, and the relationship of these improvements with the sustainability of the activity in question [
12,
13,
14].
To achieve this objective, previously published articles have been analyzed. Some of these studies evaluated the key success factors of projects [
15,
16,
17,
18,
19,
20], while others focused on the standard contracts currently used and the potential weaknesses that can disserve their execution [
21,
22,
23,
24,
25,
26,
27,
28].
The main objective of this research wass to present some of the operation and maintenance criteria considered in the global analysis, and identify the relevance and priority that owners and contractors assign to them [
29,
30]. Finally, a ranking ordered by relative preference of the criteria and comparing and analyzing the point of view of the different stakeholders that determine their position in the raking [
31] is presented.
In summary, the main objective of this research was separated into three points: (1) identify how the different agents involved in the development of the EPC contract [
32,
33,
34] are willing to consider the integration of the operation and maintenance criteria from the early stages of the project; (2) try to find the potential conflict between the will to implement the proposed criteria in the projects and the real limitations to perform such implementation; (3) find what could make the parties change their willingness to integrate the operation and maintenance criteria into their project requirements.
2. Methodology
The first step of the investigation was to identify the existing problems and establish what criteria could be included in the drafting of the contracts to minimize them. Sixteen initial points were established, which were those that were subject to evaluation to verify their interest and influence. To carry out this evaluation, a questionnaire was designed and sent to professionals in the sector. Once the responses of these professionals were obtained, the reliability and validity of the data obtained were evaluated. This was followed by a thorough analysis of these data. The following subsections detail the steps taken in the investigation.
2.1. Identification of the Main Operation and Maintenance Criteria Considered in the Study
The first step in achieving the objective propose in this work was to establish the aspects related to the operation and maintenance of the facilities once they are in operation that can improve the execution contract.
Although there are not many published papers detailing the potential conflicts that may exist between employers and consultants, some authors have published works evaluating the problems and consequences generated as the result of the conflict of interest between the parties [
35,
36,
37,
38]. Wu et al. [
39] proposed flexibility of contracts as a solution, while Anderson [
40] evaluated the introduction of conflict resolution techniques in its management.
So far, no one has proposed the integration of relevant operation and maintenance criteria in the contract drafting time, and no literature on this specific topic could be found. However, it has been possible to find some publications that evaluated the operative costs in energy infrastructure and their relevance in the operability of the facilities. Several authors analyzed the operating costs of different plants in the energy sector [
41,
42,
43], while others focused on evaluating the maintenance criteria to achieve a better operation of the facilities [
44,
45].
Based on the conclusions drawn by these authors and others already mentioned [
8,
12,
17], we could identify which problems appear frequently in this type of project. In addition, the opinion of different experts in the sector (operation and maintenance managers) has been tested. Informal interviews have been conducted with professionals with more than twenty years of experience in managing these types of projects. This helped us to propose and define a total of sixteen criteria related to operation and maintenance parameters, which, in the case that they are included in the initial phases of the project development or contract negotiation stages, may improve its future execution and operability and maintainability. The main operation and maintenance criteria considered were the following:
Operation manual
Step by step detailed instructions and procedures of operations
Operation cost optimization studies
Maintenance manuals
Maintenance procedures and instructions
Maintenance cost optimization studies
Fault tree and reliability analysis of critical elements and components
Identification analysis of critical components and elements that may affect its availability
Identification analysis of critical components and elements that may affect its reliability
RAM (reliability, availability, maintainability) studies
Maneuvering and lifting studies
Accessibility, evacuations routes, and ergonomic analysis for the future operation and maintenance phase
3D model
Optimization analysis of critical and normal spare parts
Maintenance management software
Document management software related with maintenance management software
Those criteria are related to OPEX optimization studies, the elaboration of the operation and maintenance manuals, or the development of 3D models to review accessibility, escape routes, or maintainability of the facilitates.
2.2. Questionnaire Design
The next step, once the criteria of interest for the study had been determined, was to design the questionnaire to gather the opinion of the experts. The questionnaire used to measure the level of integration of operation and maintenance criteria in EPC contracts was focused and designed considering the conditions of the potential receivers:
Multinationalities and locations, making the questionnaire in English and Spanish language, allowing the participants to select their preferred language. The web-based platform
www.surveymonkey.com was used to make its distribution easy and make it possible to reply the questionnaire using smartphones, tablets, or desk computers.
Professionally heterogeneric, so the questionnaire allowed the participants to select and reply only to the questions related with their own experience and background.
Confidentiality, in order to protect the identity of the participants and the particular data of each project.
For each of the operation and maintenance criteria considered in the questionnaire, a total of four questions were proposed. Those questions were designed to show the possible benefit that would be obtained if it were included in the contract and, on the other hand, what each respondent would be willing to sacrifice in return. In this way, these data would be used to evaluate the interest in each one and the possibility of implementing it. The questions were the following:
Question 1. Please confirm if you would include into your scope of supply of your proposal the next list of studies and works without increasing the price of the proposal, if they would increase your probability to be awarded with the project.
Question 2. Please confirm how much of the project cost you would assume for each of the next studies and works, if contractor include them in its proposal
Question 3. Please confirm if you would assume the cost of each of the next criteria and works if the contractor included them in their proposal, but they improved and optimized the project OPEX.
Question 4. Please confirm if in the technical evaluation of the proposals it could have any positive impact on the inclusion of the next list of studies and works by contractor.
For each question, the experts consulted were invited to choose from several predefined responses or to propose new ones. The value of the weights assigned to each potential response could be in the range of negative values (−10), for those opinions that tried to reflect the most negative perception, to the positive values (+10), for those responses that tried to show the most positive perception.
The design of the structure of the questionnaire [
46,
47], the questions prepared, and the weighting of the answers (including the possibility of nonresponse) were carried out in accordance with the usual practices included in the literature [
48,
49].
2.3. Summary of the Data Collected
Once the responses of the different experts were obtained, a specific analysis to check their reliability and accuracy was done. For this, the profile of the people who responded and whether the number of responses obtained was representative or not was studied.
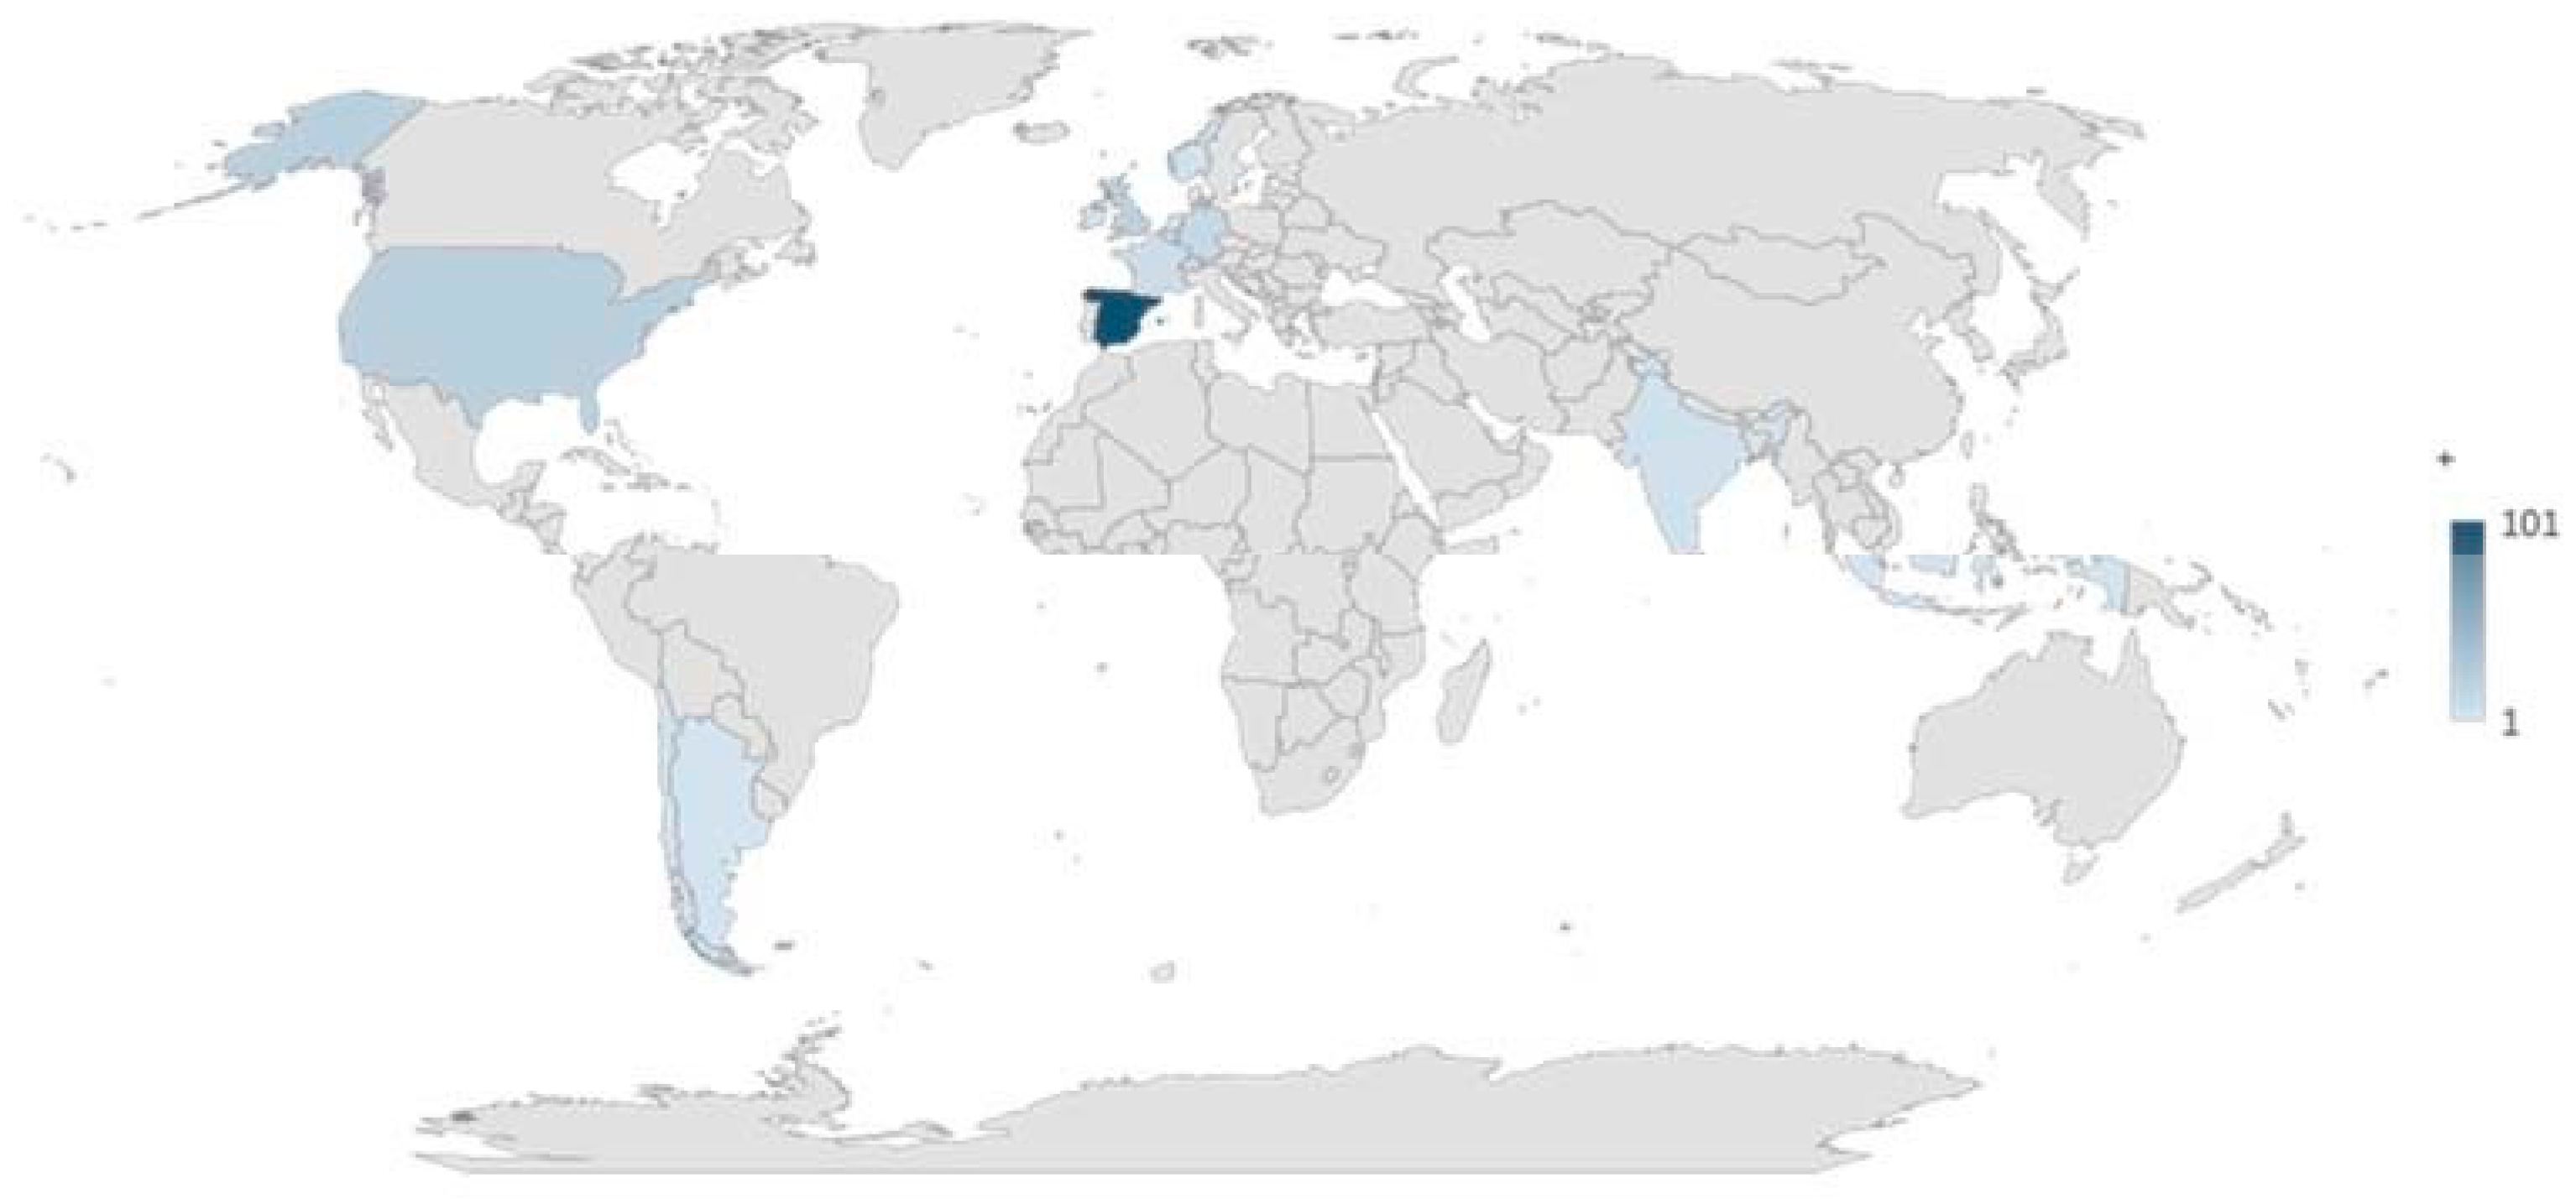
The questionnaire included the participation of specialists from companies that operate, maintain, and manage 100% of the regasification plants in Spain, as well as specialists who manage or have worked in at least 10 regasification plants in Europe, from a total of 21 that are currently in operation, including the 7 Spanish plants as is showed in
Figure 1. This ensured the integration of the most relevant facilities in the LNG sector in the current research.
The total number of questions and answers included in the questionnaire was
Number of questions: 118 (including the specific questions about the criteria and the rest of the questions: experience in the sector, type of projects…)
Number of potential replies: 252
The number of questionnaires sent to people with proven experience and with potential interest to participate was 704. The final number of questionnaires received back was 350, selecting 202 as valid, either by the level of detail used to reply to the questions, or the level and degree of experience and education of the participants.
To determine if the number of responses obtained by the total number of participants in the questionnaire was sufficient and representative, we then proceeded to calculate and the minimum sample size by applying the following formula, valid for finite populations [
50,
51]:
where:
p (negative variability, (recommended value by default = 0.5)): 0.5
q (positive variability, (recommended value by default = 0.5))): 0.5
z (95.5%) value (percentile) of the typified normal distribution: 1.96
N (size of the population): 350
e (sample error) (5%): 0.05
Obtaining a value of the sample size (n) of 183.39 = 184
Considering the size of the population that has been assessed through the questionnaire (
N = 350) and the size of the actual sample that has been obtained (
n = 202 (bigger than the minimum value calculated in the Formula (1))), the sampling error can be removed from Formula (1) and must be less than the maximum allowed value of 5%. For this, the following formula was applied:
The error obtained was 4.49%, lower than the maximum admissible of 5%, so the results obtained from the sample of the population to which access had been obtained could be considered as representative. Therefore, it can be concluded that the collected data were reliable and could be used as a basis for the research.
2.4. Graphical Representation
After establishing the reliability of the information collected, the data provided were analyzed. The complexity of working with a heterogenic group of participants and the intention to collect perceptions was analyzed to prepared simple and understandable questionnaires. Once the information was collected and analyzed, it was necessary to use a compressive graphical representation showing three weighted variables in the same figure.
To move forward in this analysis, a weighted analysis of the replies collected and the combined evaluation of each operation and maintenance criteria associated to each question with the rest of questions was used to develop what it is usually named as “materiality matrixes”. The methodology used is based in the same principles and guidelines that the Global Reporting Initiative (GRI) [
52] proposed to be used to develop the corporative sustainability reports. A three-variable graphical representation was used together with the formulation included in the reference:
X axis, represents, for each question, the prioritization of each criteria with the rest of criteria.
Y axis represents, for each question, the positive or negative weighted value that each participant in the questionnaire assigned to each criteria, but compared with the absolute addition of the weighted values of all the criteria and the willingness or acceptance of the sponsors to pay to include such criteria or, in the case of the contractors, their acceptation to reduce partially their benefits in case they incorporate such criteria without increasing their bid price.
The size (diameter) of the sphere represents, for each question, the absolute weighted value of each of the criteria, compared with the rest of the criteria.
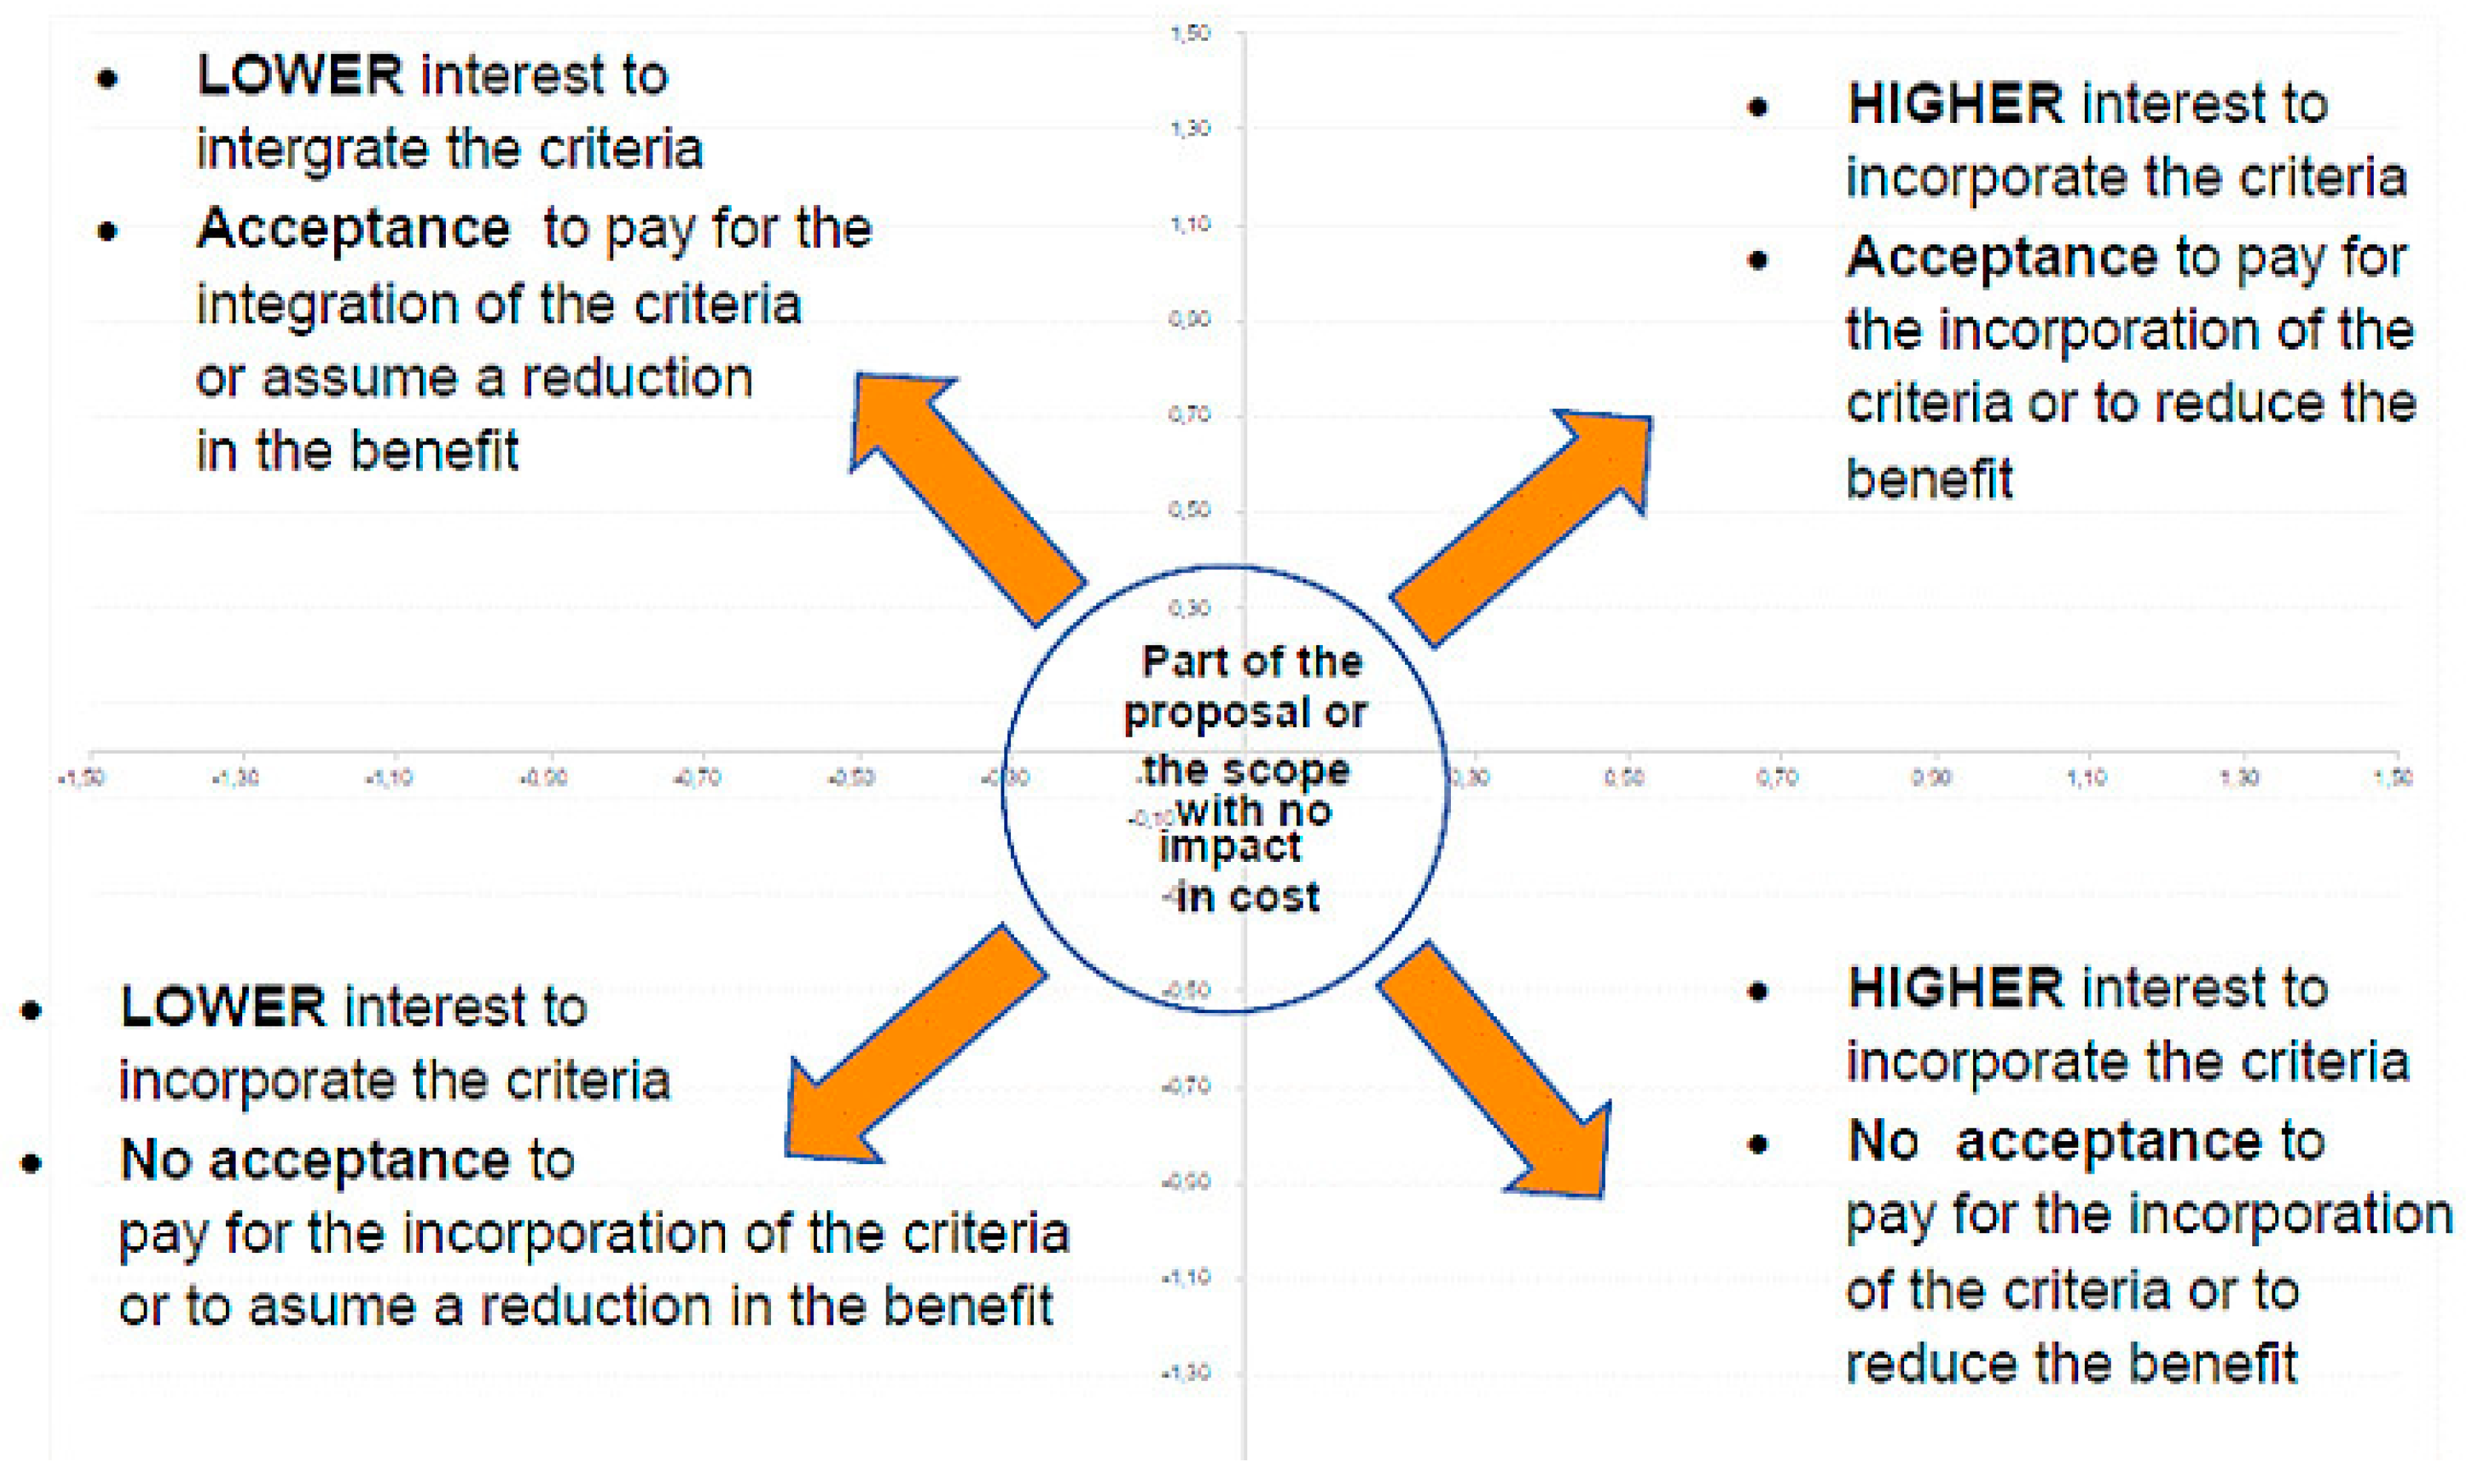
Figure 2 shows the way the figures should be read and analyzed. It shows a schematic example of the graph obtained for a general criterion. When the sphere is located on the left side of the graph, it means that the interest by the respondent to integrate such criterion in the contract is low, while the right side implies the opposite—a high interest in that criterion to be integrated in the contract (much higher the further to the right of the graph it is). Similarly, the upper side of the graph would mean that there is a willingness to pay for the integration of the criterion in the contract, as it will report a certain benefit or improvement. The lower we are on the graph, the less interest is shown in assuming the increase in the cost generated from such integration.
3. Results and Discussion
Since the analysis of the results was very complex, this section has been divided into four subsections. In the first, a summary of the number and profile of the responses obtained is made, in order to visualize the scope of the research carried out. Next, the analysis process followed for each of the evaluated criteria is explained, using one of them as an example. In the third part of this section, a comparative summary of the data extracted for all criteria is made, to finally establish, with the conclusions drawn from the study, the prioritized ranking of the sixteen criteria established initially.
3.1. Summary of the Key Data Collected in the Questionnaire
The most relevant data that summarize the information collected were:
A total of 39,816 datapoints and inputs were collected. In order to manage such a number of inputs and extract valuable information, advance data analysis tools, dynamic trends, and tables from Excel were used.
A total of 202 people participated—91% were male and the 9% were female.
The people that participated in the questionnaire worked in a total of 120 companies in a total of 42 industrial sectors
Sponsor companies from 23 different countries (65% from Europe and US) and construction companies from 25 countries (64% from Europe and US) participated in the questionnaire, adding the experience of developing projects in 36 different countries (55% from Europe and US)
The level of education that was most common among the participants was an engineering degree, reaching the 35% of the male participants and the 47% in the female case.
The mean average age of the participants is 47.2 years—in the case of the male responders 47.8 years and 41.7 years in case of the female participants.
The mean value of years of experience in the male participants was 21.52, reaching 14.3 years in case of the female participants. The total accumulated years of experience of all the participants in the questionnaire was 4166 years.
The mean value of years of experience in the management of industrial projects was 11.2, and the mean value of years of experience in the development of operation and maintenance management and works was 9.9 years.
It was possible to collect information from people with experience in the project management and operation and maintenance of LNG terminal and gas pipeline systems in the questionnaire, with the participation of representatives of 100% of the LNG terminals of Spain and representatives of 80% of the LNG terminals of Europe.
It was possible to engage people with professional experience in all the main engineering companies of Spain that develop and manage projects related with refineries and LNG terminals. Those companies belong to the top 20 leading engineering companies in Spain [
21].
The companies where the participants develop their work had an accumulated turnover value between 159.010 M€ and 198.920 M€ in 2015.
In total, 158 projects, which summarize the experience of the participants, have been analyzed
Dates of signature of the contracts between 1960 and 2015.
Start date of the construction between 1964 and 2015. Sixty-six projects (41% of the total) had a delay in the start date between one (1) year (60.6%) and seven (7) years (1.5%).
The execution duration value of the projects was between 1 month to 60 months.
The mean value of the warranty period of the projects was one (1) year (35.97%) or two (2) year (33.81%).
The most common type of projects were EPC or lumpsum (59.49%)
The readability level of the project documents was high (74%),
The accumulated total value of the contracts was in the range of 32.206 M$ and 39.370 M$
3.2. Sample of the Graphical Representation of the Questionnaire Results
Due to the large amount of information that was analyzed, this section shows the process carried out and the detailed results for one of the sixteen criteria evaluated. For the rest of the criteria the process followed was the same. The criteria that was selected for this paper is the one named as “maintenance cost optimization study”, as itself reflects the opposite approach and valuation for the owner and for the contractor.
From the contractor point of view, the information obtained from the question 1 is summarized in the next table. Each row of the
Table 1 corresponds to the answer options provided for question 1. For the other three questions detailed in the methodology section, the same representation criteria was selected. In total, 92% of the participants answered question 1, so the
Table 1 includes a row with the percentage of “No answer” (NA) (8%). In this example of question 1, the highest percentage (24%) corresponded to those who considered it would be interesting to incorporate it as long as it does not reduce their profit and also for those who considered that it should not be included because they consider that is already a owner’s obligation.
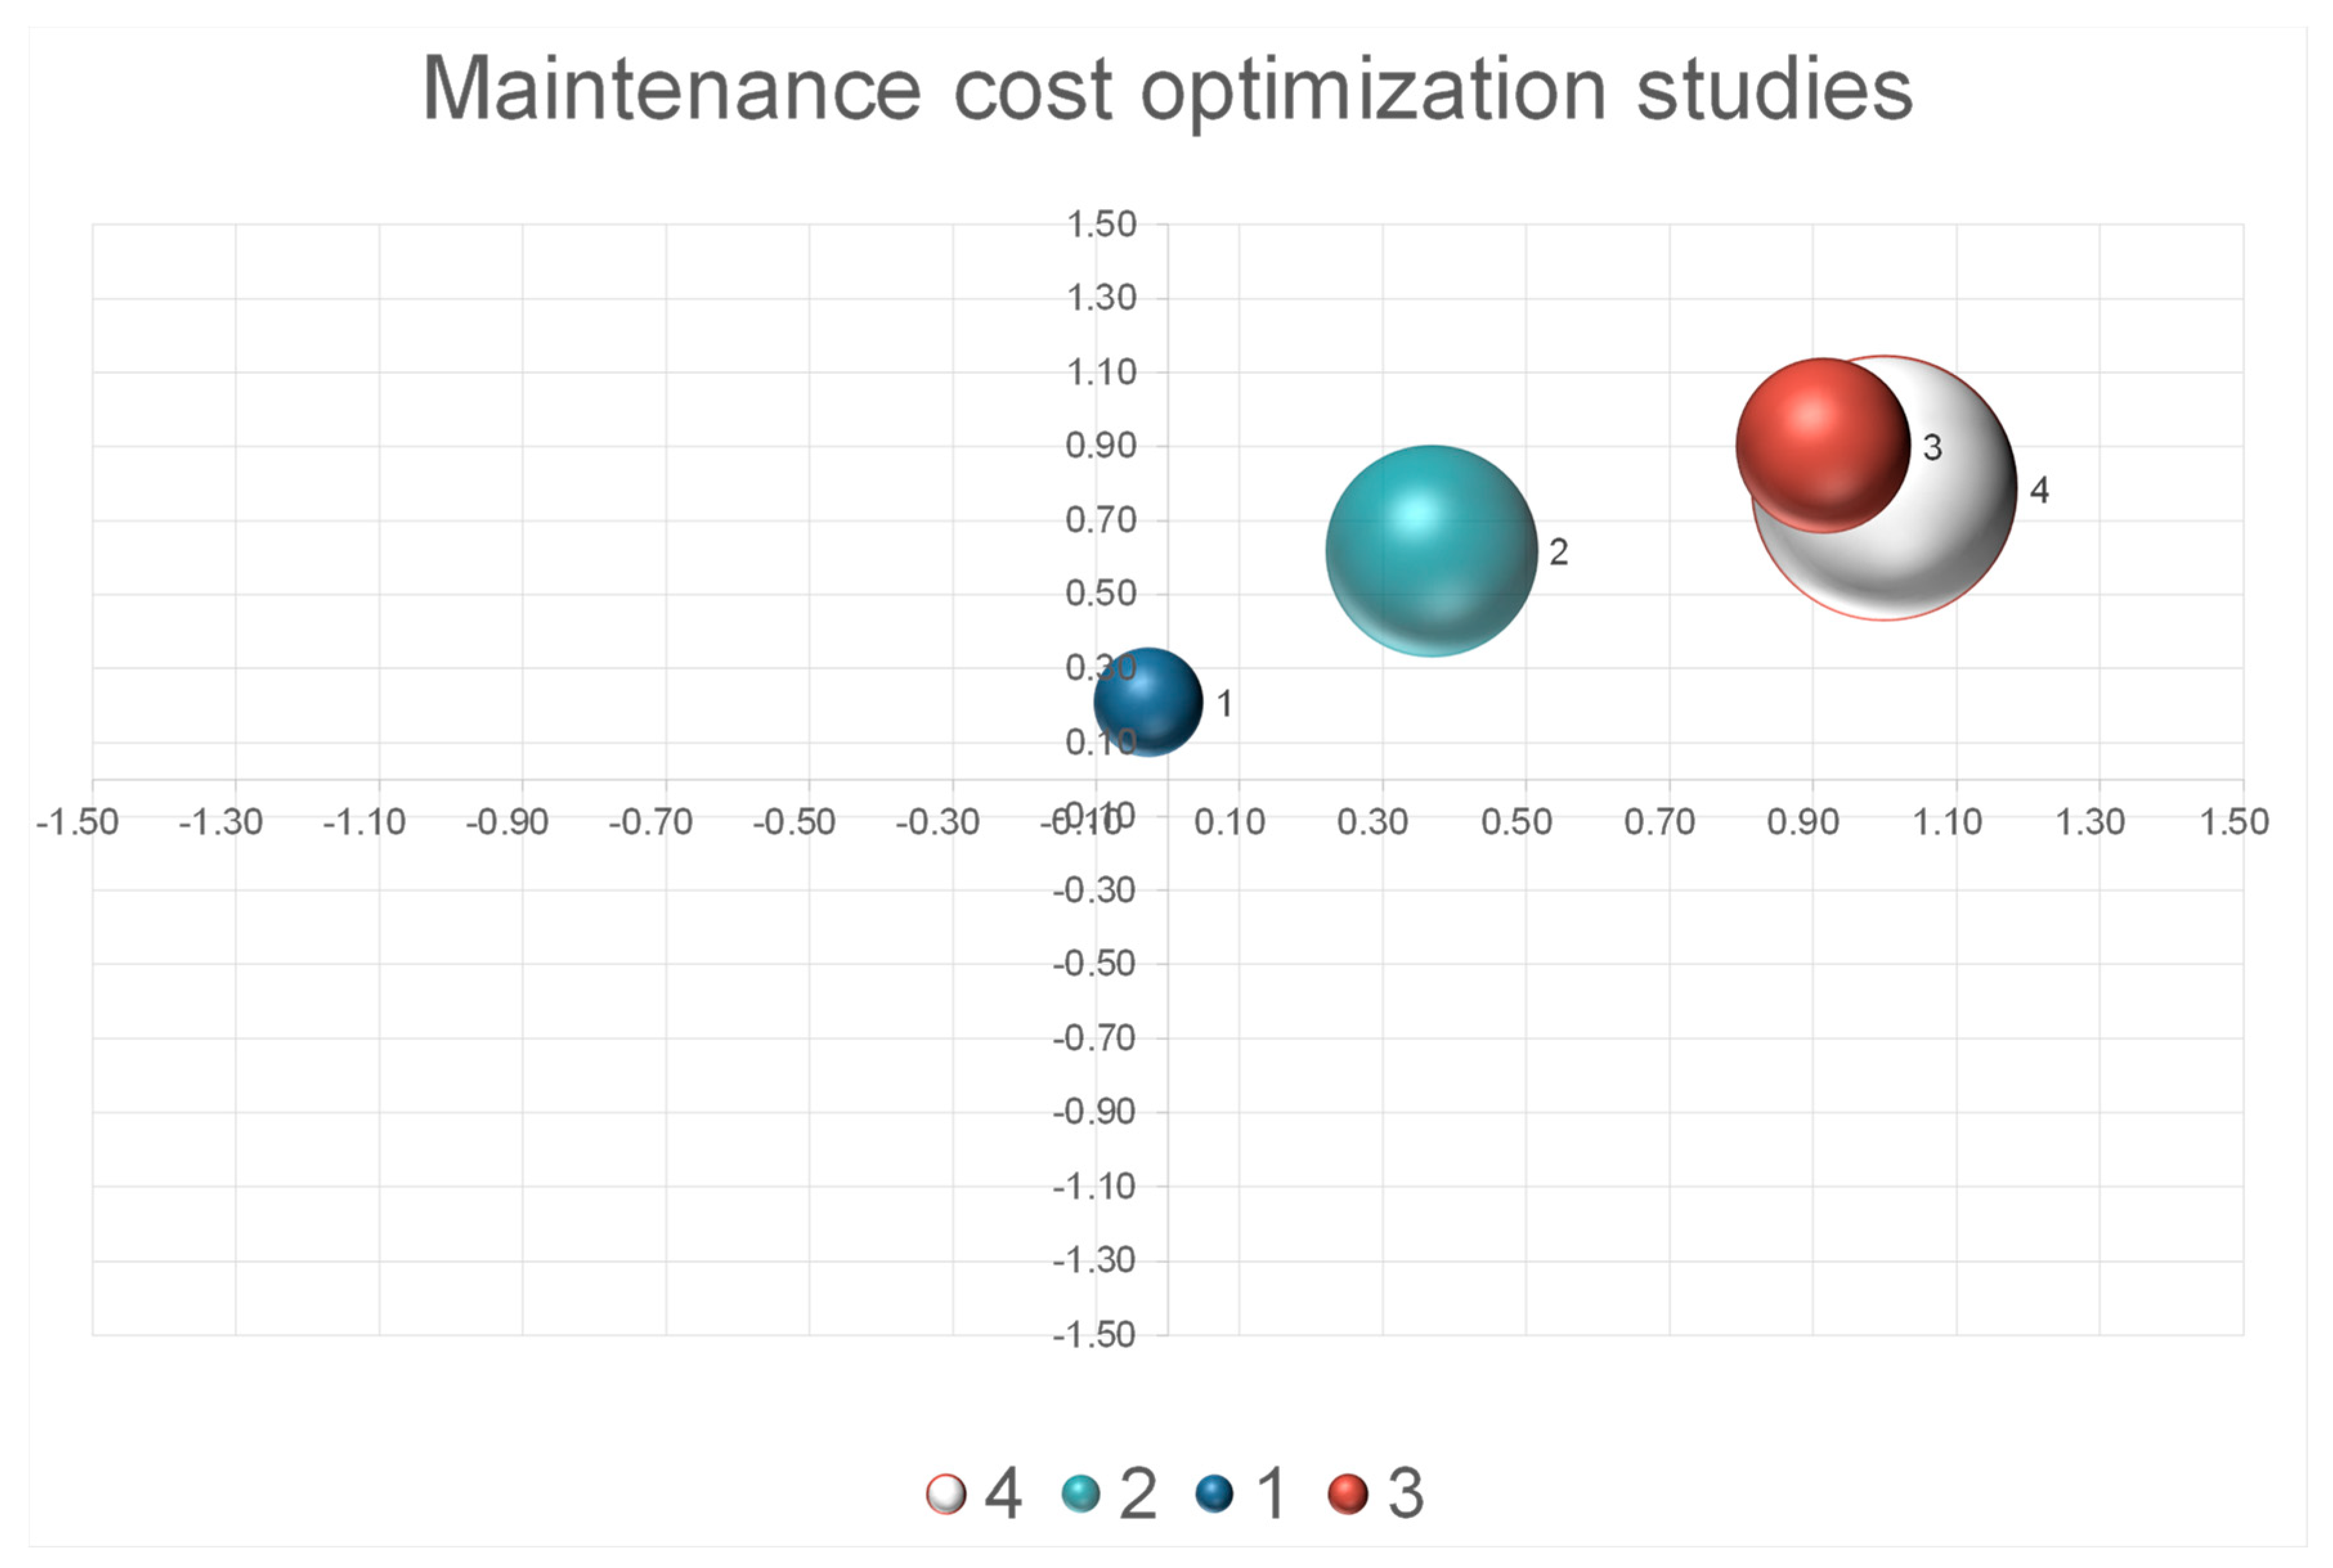
As explained in
Section 2, the graphical representation of the analysis of the four questions included for each criteria (numbered from 1 to 4), which collected the point of view of the owner and the contractor, is shown in the next image (
Figure 3).
Considering the location and size of the spheres included in the
Figure 3, and considering the total number and weight of the replies collected, together with the interpretation criteria explained in point 2.4 (
Figure 2) of this paper, the next lines summarize the results of the conclusions obtained in the questionnaire. The complete detail can be found in [
30]:
3.2.1. Contractor. Increase of Awarding Probability
For contractors, this criterion is not relevant. They consider that it might improve their probability to be awarded, but they are not willing to absorb the costs to develop such kind of studies, unless they are reimbursed or paid by the owner. In general, contractors do not have in their organizations the kind of expertise that could perform these studies in house at a minimum cost, making it necessary to subcontract this activity to specialized companies or to the vendors of the main equipment that they may buy, decreasing therefore their benefit margin for the project.
3.2.2. Owner. Accepting the Increment of the Cost
The approach shown by the contractor defers with the opinion of the property, that they are accepting to pay up to 2% more for the contract price, if this increment is justified by an optimization of the project OPEX. The maximum extra cost to be accepted by the owner is limited to the improvement of the OPEX and the general improvement of the profit of the project.
3.2.3. Owner. Accepting the Increase of the Cost by Optimizing the OPEX
From the ownership point of view, the studies to improve and optimize the cost of the maintenance activities could optimize the OPEX of the project in the range of the 1% to 5%, as the cost of the spare parts and the duration of the downtimes could be reduced, as well as other several factors, making this compatible with the replies obtained for the question 2.
3.2.4. Owner. Improvement of the Technical Evaluation of Contractor’s Proposals
In practically all the replies collected to this question, owners considered that contractors should include these kinds of studies without any extra cost to the contract. This is the typical approach from owners and sponsors (defined in the PMI Lexicon of Project Management Terms (PMBOK) [
53] as a “person or group who provides resources and support for the project, program or portfolio for enabling success”), who would like to have more than the expected, at zero cost, but forgetting the effort, resources, and the cost that those kinds of studies mean. This way of thinking normally deviates from standard commercial and engineering good practices. It should be the owner’s project team that should include a specific budget to develop such kind of studies under the contractor scope of work, and include such requirements in the technical specifications that should be included in the tendering documentation.
This also means and requires that the owner should know what he wants, and how much it will cost, and include this input in the project plan rather than expecting to obtain a “free wishes list”. In the special case of this criteria, its incorporation in the contractor proposal could increase the probability to improve the evaluation of the offer by the owner in a range of the 1% to the 3%, if it is demonstrated that the OPEX optimization can be achieved.
3.3. Global Evaluation of the Operation and Maintenance Criteria
Analyzing the remaining sixteen criteria in the same way as shown in
Section 3.2, global conclusions can be drawn. In this way, the level of interest in each criterion of each of the parties has been determined.
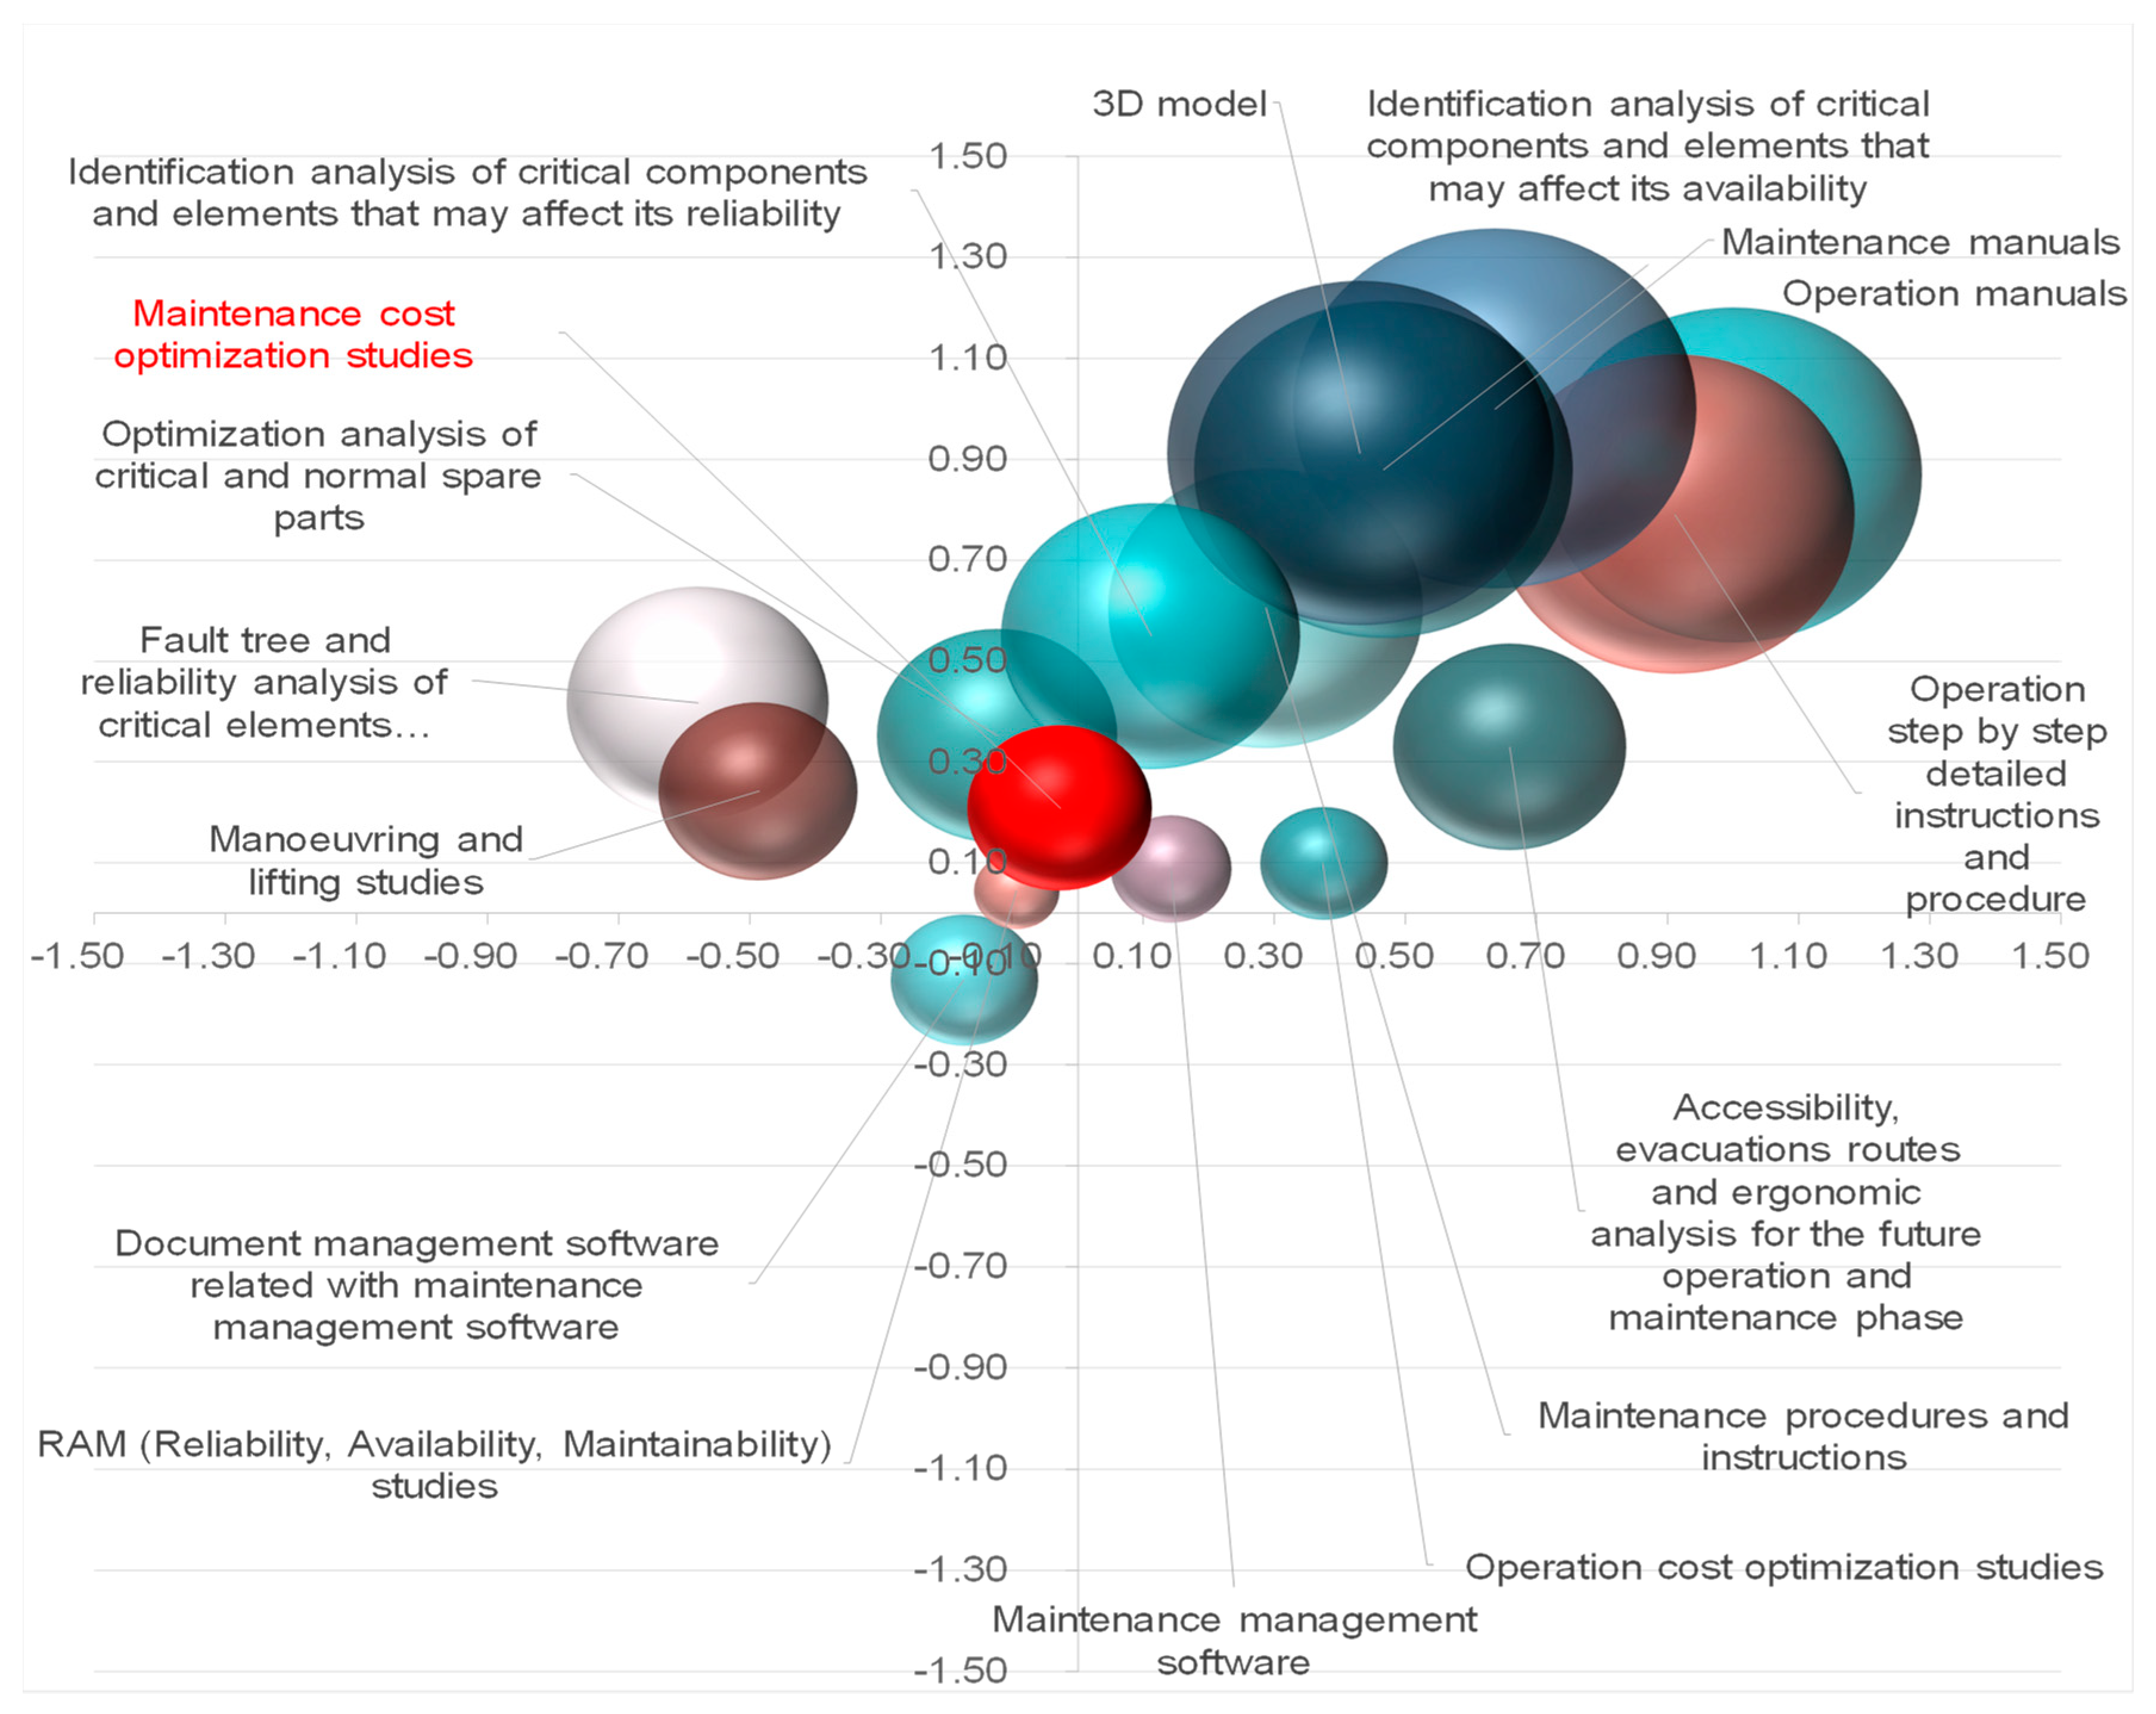
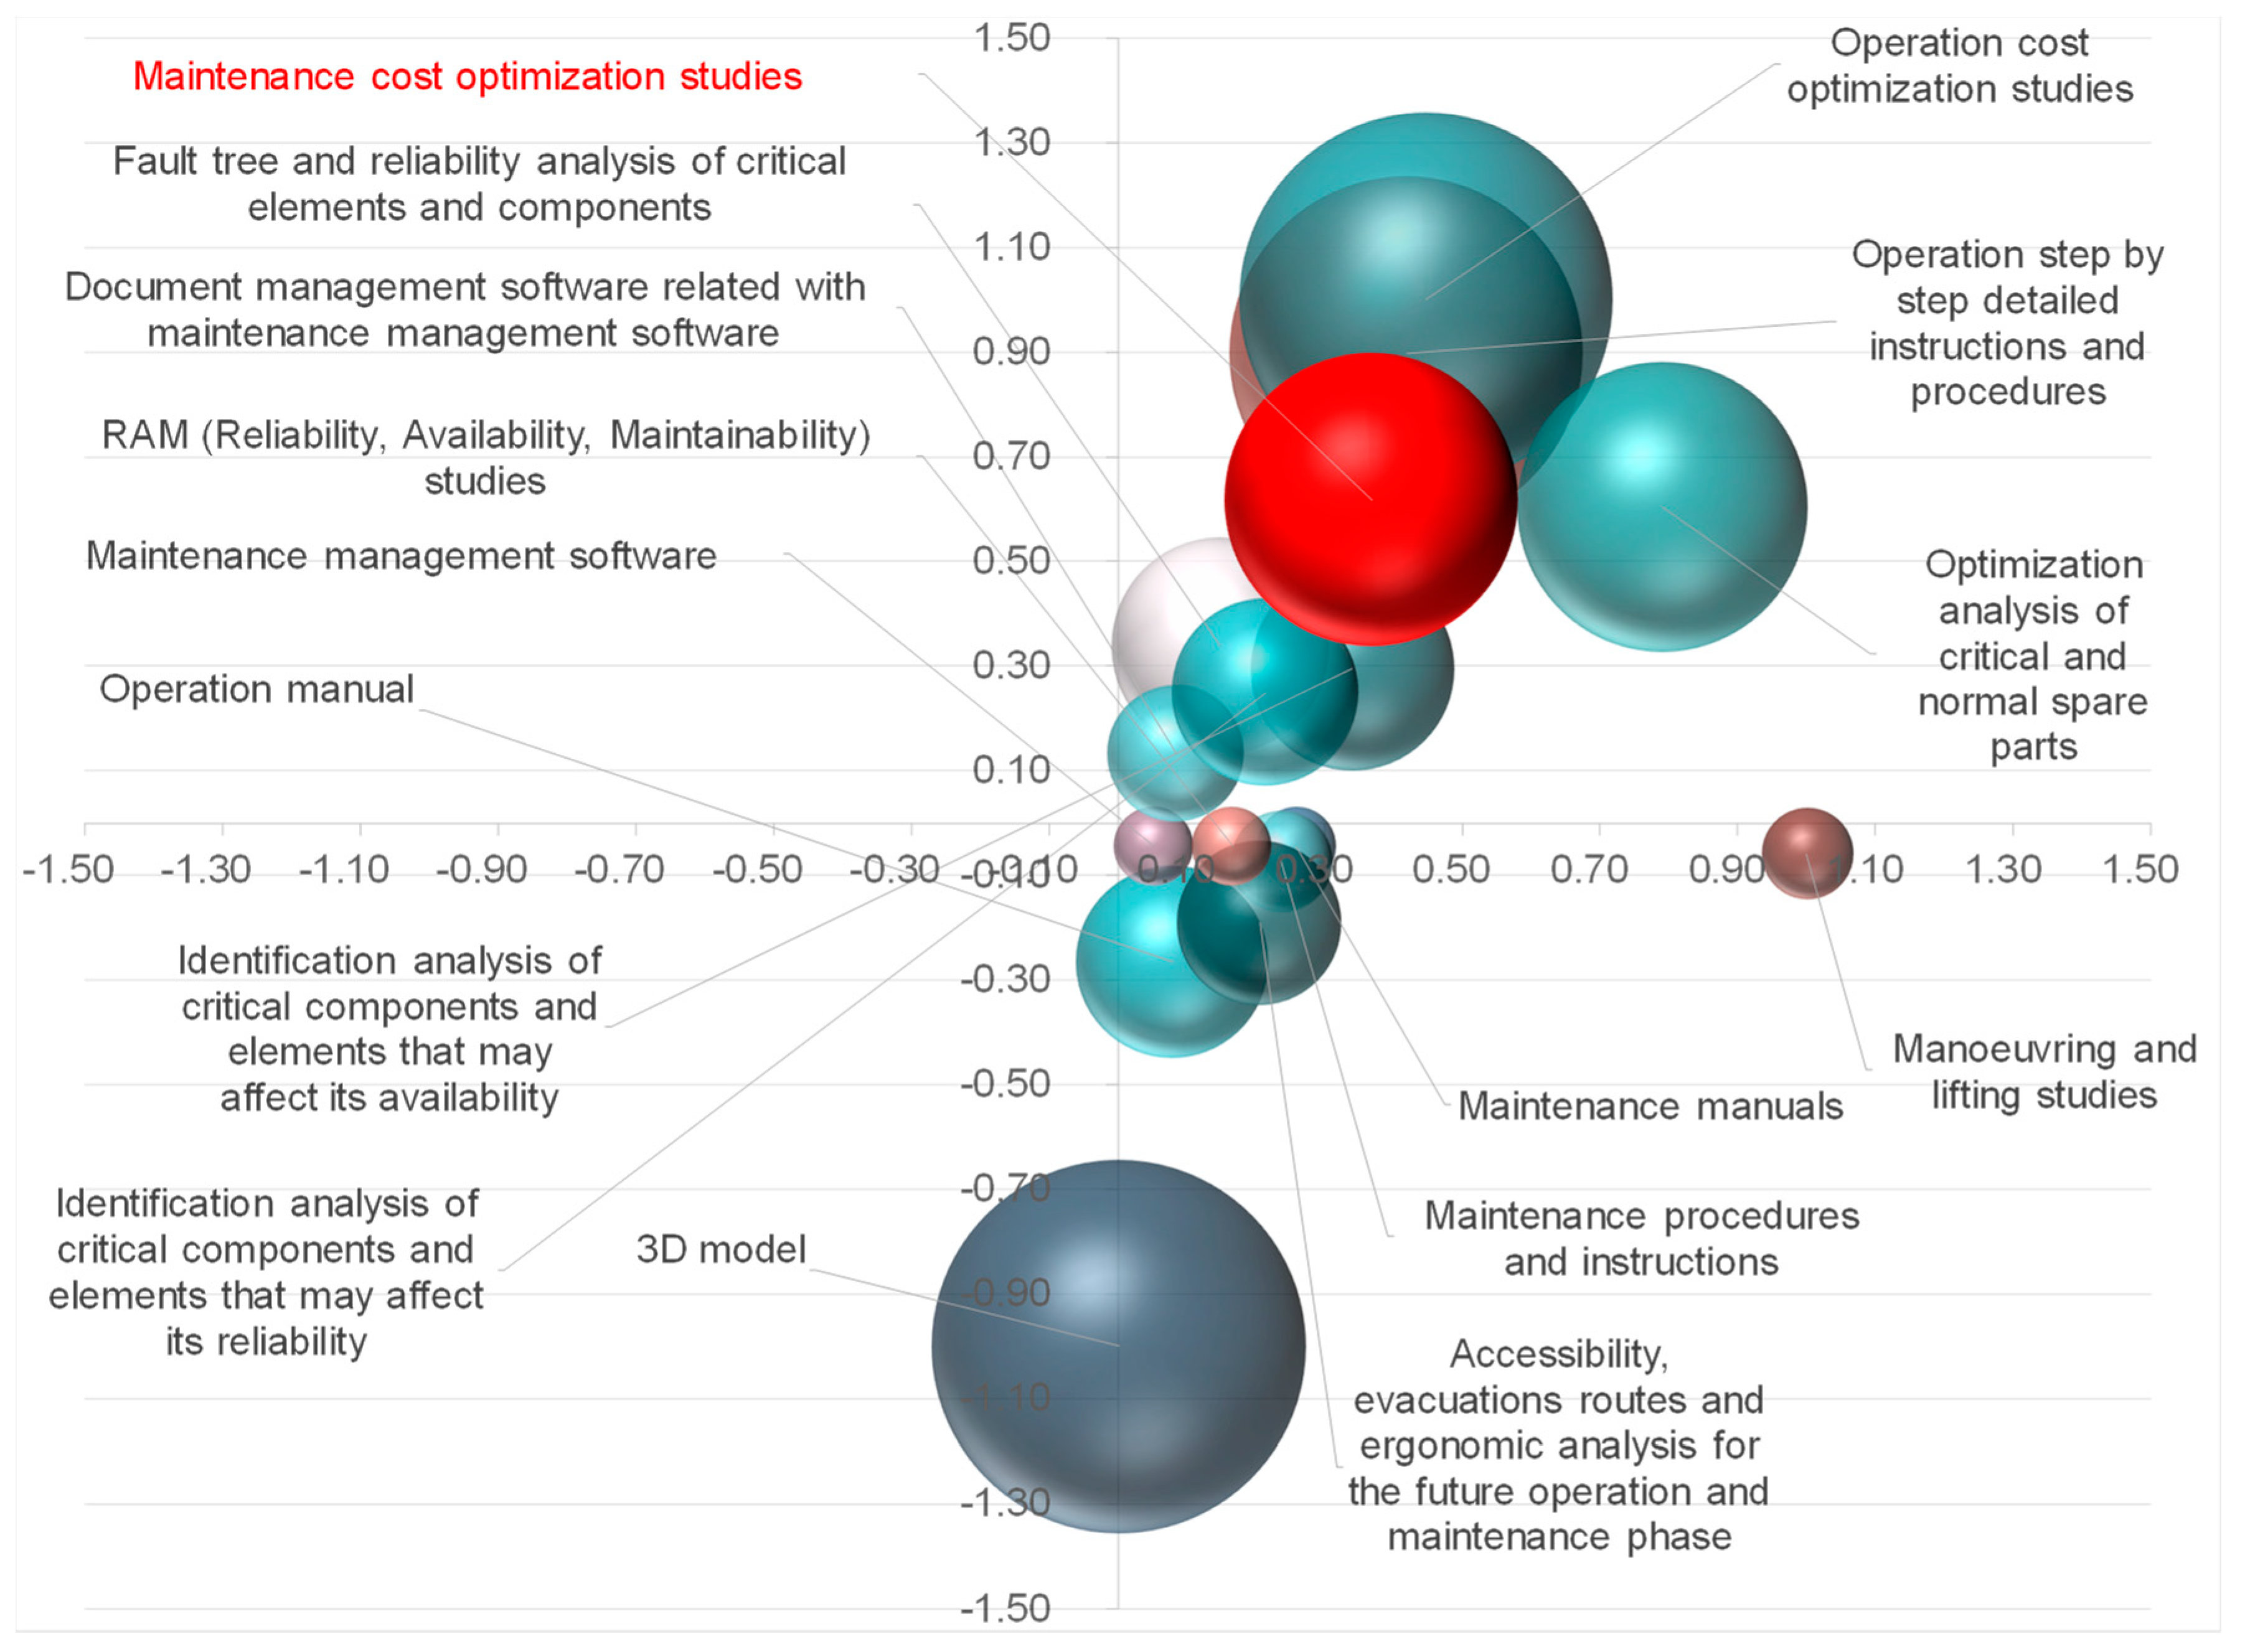
As an example,
Figure 4 represents the relative evaluation of the professionals that participated in the questionnaire under the “contractor” profile about the criteria “maintenance cost optimization studies” (in red), compared with the rest of the criteria analyzed. Each sphere of the graph represents each of the evaluated criterion, making it possible to compare the interest that each one generates on the contractor side. It can be observed that most of the criteria are located at the top of the graph, meaning that the contractor would be willing to assume some cost to implement them. Regarding the interest perceived, the answer was also mostly positive, as most of the spheres are located in the right side of the graph. Furthermore, considering the size (diameter) of the spheres, the most valued criteria were “3D Model”, “Identification analysis of critical components and elements that may affect its availability”, “Maintenance manuals”, “Operation manuals”, and “Operation step by step detailed instructions and procedure”.
From the
Figure 4, it could be observed that the contractor feels comfortable by delivering the operation and maintenance manuals of the facility or equipment that he will build, as this is his classical approach and he considers that it will not increase his costs or his level of risk. Moreover, the cost associated with the development of those documents would normally be assumed by the equipment suppliers and the contractor would normally act as an integrator, adapting and tuning similar documents from previous projects.
From the contractor point of view, any other study or analysis that could not be developed internally, making it necessary to subcontract it a third party, and therefore reducing the project benefit margin, will not be prioritized and will not be included for free in the proposal.
Figure 5 shows the relative evaluation about the previous criterion, “maintenance cost optimization studies” (in red) made by the professionals that participated in the survey under the profile of owner. Compared with
Figure 4, it can be seen how most of the spheres are located on the right side of the graph, so the owner’s interest in integrating such criteria was also high, but on the other hand, there was also a lower willingness to assume additional costs associated to such integration, as the some of the spheres are located in the lower side of the x axis.
For owners or sponsors, it becomes more attractive when the contractor includes under its scope of work the operation cost optimization studies and the critical analysis of the spare parts, which would minimize the cost and value of the stocked material and also minimize the time of unavailability, as when critical and insurance spares run out, they may not be available in the warehouse due to their high costs and delivery time, or maybe due to the lack of analysis in their interchangeability.
But opposite to the owners’ approach, the contractor considered, that the 3D model prepared with high-tech software that is used to design the whole facility and prepare the drawings and isometrics is very relevant and will not generate any increase in their proposal cost, as it will be part of his scope of work. For the owner, the 3D model is just a tool used by the contractor to develop the engineering documentation, that will no longer be useful after the finalization of the construction phase.
This approach is quite extreme as the 3D model is a very powerful tool to minimize potential problems or issues related with accessibility, maintainability, ergonomics, and operability. It will improve the design and availability of the facilities or the product to be delivered.
3.4. Raking of Relevance of the Operation and Maintenance Criteria
The last step to organize the results obtained was to prioritize the sixteen criteria analyzed based on the perception of the two parties involved.
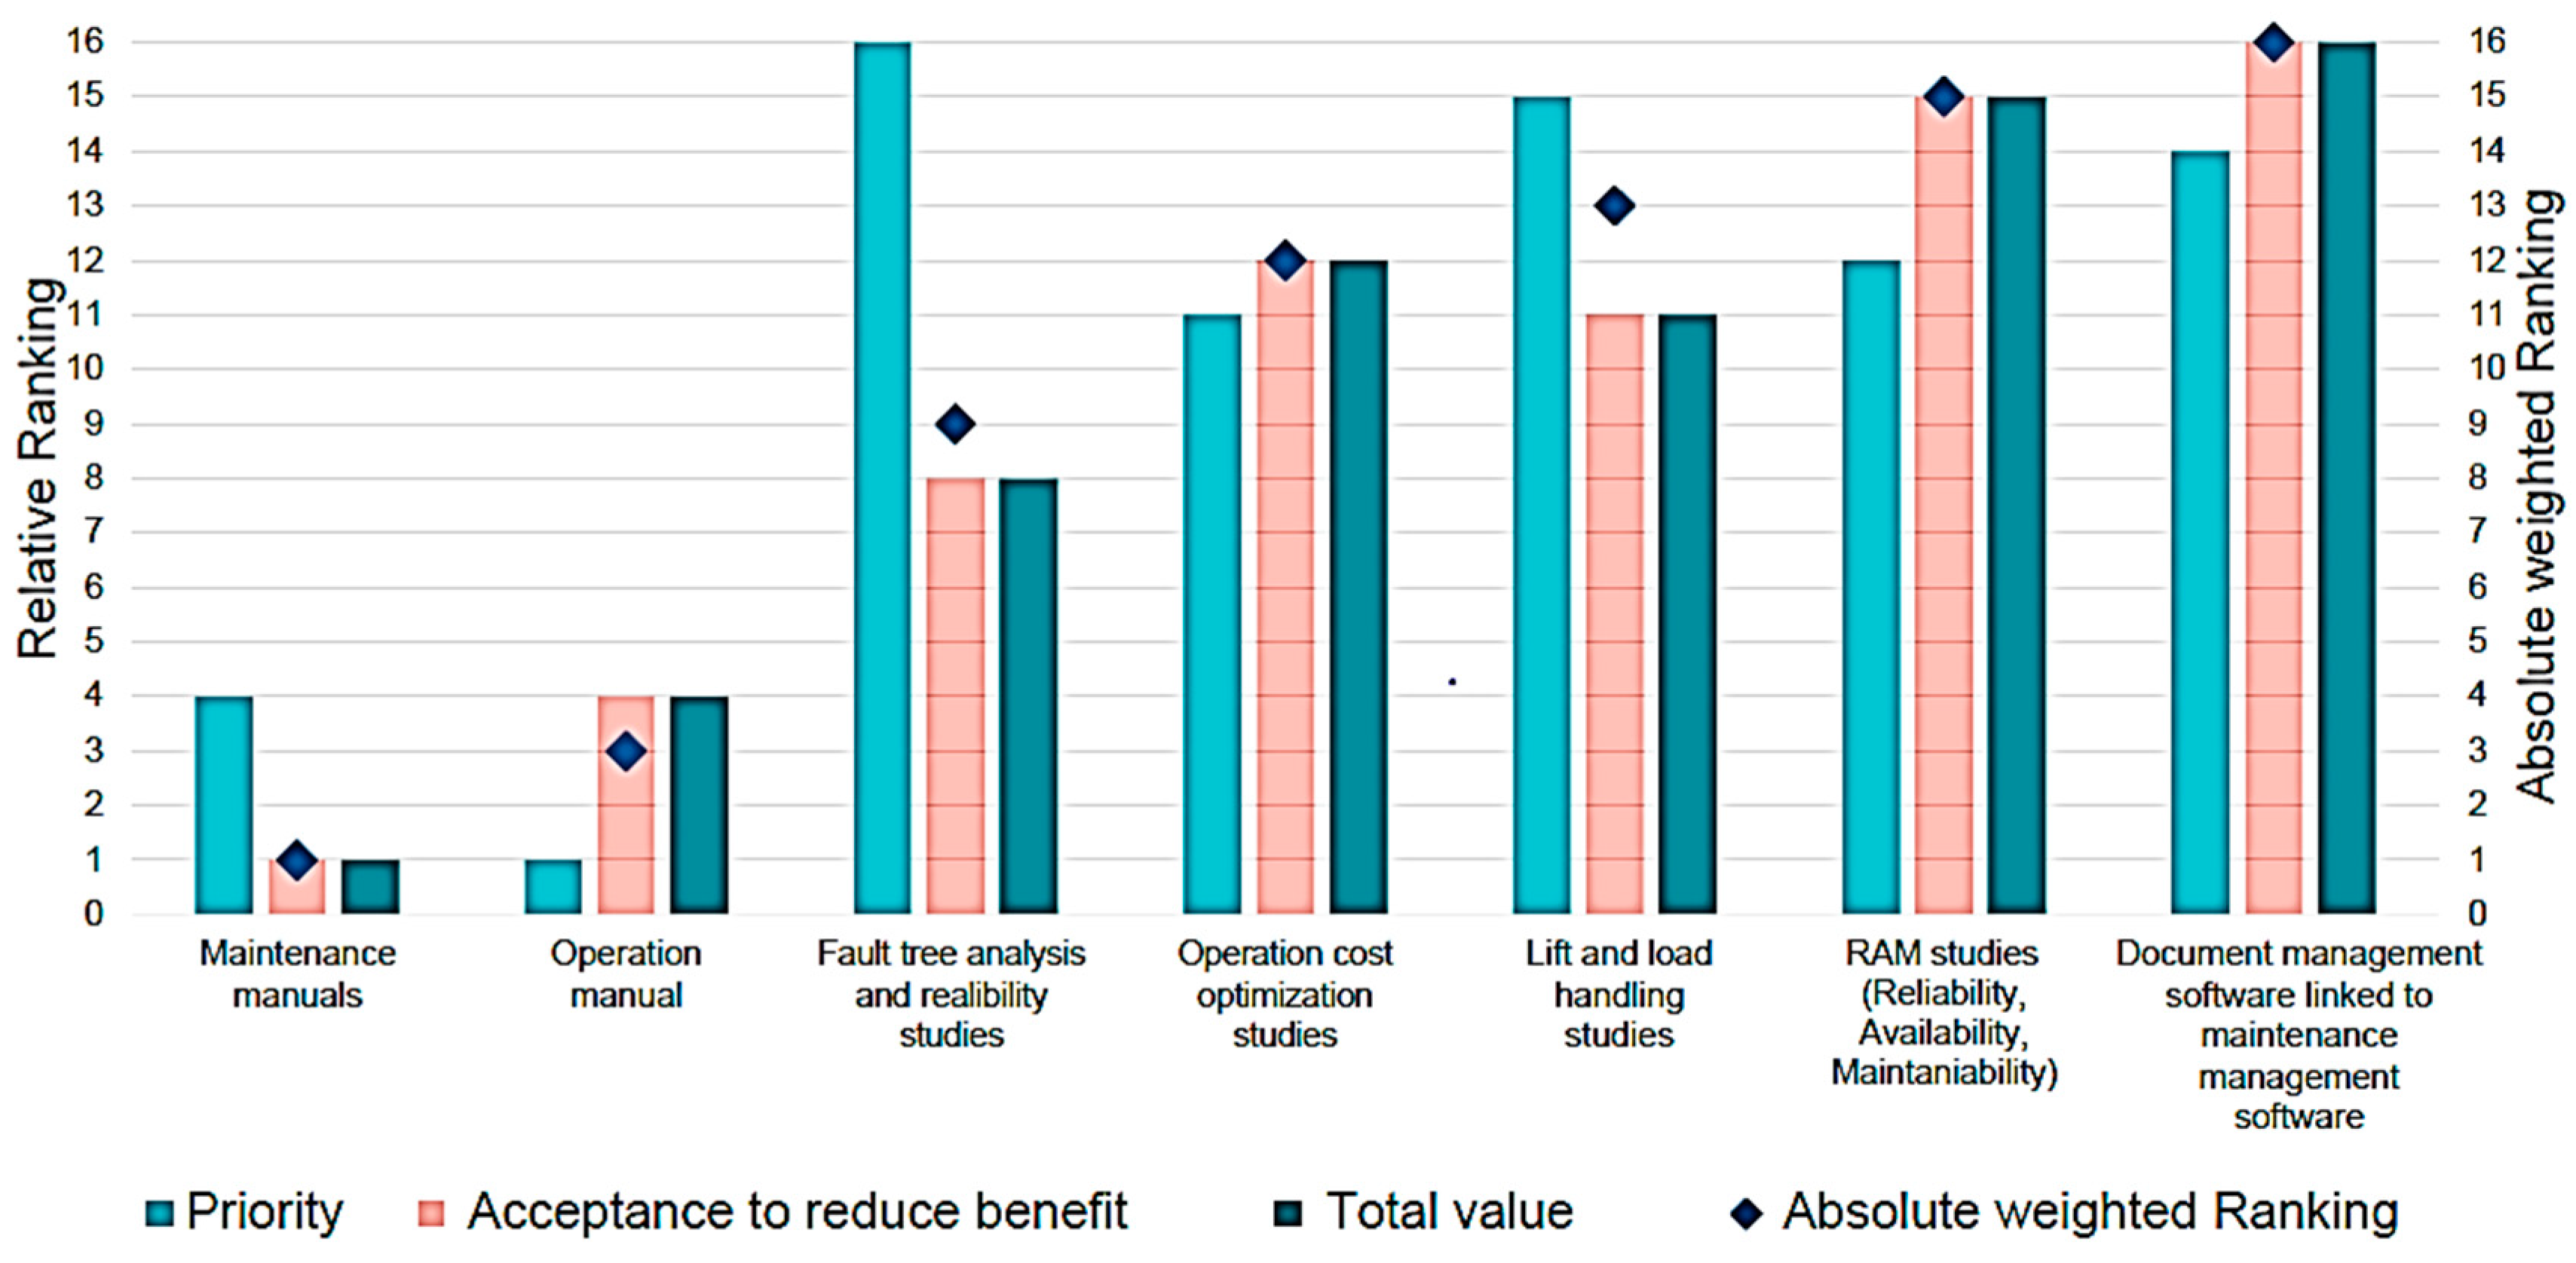
Figure 6 represents the relative and absolute weighted ranking of the criteria previously represented in
Figure 3, as per next weight assignation methodology:
- o
X (priority): 20%
- o
Y (acceptance of increasing the increment in the project cost or reducing the benefit margin): 40%
- o
Z (global evaluation): 40%
The values used in the weight assignment were based the experience of the authors and the comments and recommendations collected in several interviews with some of the participants in the questionnaire, in addition to the bibliographic references consulted [
46,
47,
48,
49].
In order to make it easier to read the trend, only some of the evaluated criteria have been represented. As an example on how to understand in the information shown, the criterion “Fault tree analysis and reliability studies” was the one that the contractor assigned the least priority (number 16 of 16), but the overall priority placed it in the 8th position of 16 criteria.
The next,
Table 2 represents the comparison of the relative ranking of the sixteen criteria under contractor and owner point of view. It can be seen that the criterion that was in a better position from contractor’s point of view was the “maintenance manual” (8th position for the owner), while for the owner it was the “Operation cost optimization studies” (11th position for the contractor). Overall, the best valued criterion (considering both the interest and the cost of its incorporation) were the “Identification analysis of critical components and elements that may affect its availability” and “Operation step by step detailed instructions and procedures”.
Finally, from the analysis of all the data collected, it can be concluded that the owner would be open to increasing the project cost in the range of 1 to 5%, if the OPEX optimizations result to be in the same range (1 to 5%). This fact would improve the contractor’s assessment in the bid evaluation phase in a range of 1 to 3%. Therefore, the probability of awarding the contract to the contractor who includes in his offer the operation and maintenance criteria will be increased and the owner would willing to pay for it.
4. Conclusions
A compilation of information has been carried out through some of the most relevant stakeholders involved in the construction of megaprojects within the energy sector, with the aim to improve the design and content of the contracts associated to such projects. Information was obtained from more than 200 people from 23 different countries, with a very high level of experience in the sector and representing 80% of the LNG terminals running in Europe.
The interest shown by the parties involved in the contracts (owner and contractor) related with the incorporation of new clauses in the contracts that would take into account the operation and maintenance costs once the project is under the operational phase has been established. Both the interest in each criterion and the willingness to assume, or not, an extra cost that may arise from its incorporation in the contract has also been established.
Owner’s will to integrate an operation and maintenance criterion into the contract increases if this means that the OPEX value will be optimized in a range of 1–5%, even if it implies an increase in the cost of the project in the same range. If the contractor includes one of those criteria in their offer, the evaluation result of the proposal made by the owner will be increased in a range of a 1–3%, and, therefore, the probability of being awarded will also be increased.
A ranking has been made, ordering the sixteen criteria evaluated in this work according to the interest/need of each of the parties, making possible to evaluate which criterion would be more interesting for each party and which would not provide any remarkable benefit. With this ranking, the criteria that combine the interest of both parties could be integrated in the contract, minimizing the potential differences in the interpretations or understanding on the purpose of the contract. Among the items evaluated, the one that was much more valued by both parties was the criterion “Operation step by step detailed instructions and procedures”.
Finally, it can be concluded that the integration of persons with experience in the operation and maintenance of the products or projects to be delivered since the very early development phases of the project may help to clarify and achieve agreements between contractors and owners. This will represent an opportunity to generate the differential position from other competitors in front of the owner. This new approach will allow the contractor to identify and deliver what customers expect and increase his chance to be awarded.
Author Contributions
Conceptualization, J.J.L.-M. and A.F.-V.; data curation, J.J.L.-M.; formal analysis, J.J.L.-M.; investigation, J.J.L.-M., M.Á.G.-L., L.C.-S., A.I.G.-D., and A.F.-V.; methodology, J.J.L.-M. and A.F.-V.; resources, J.J.L.-M., L.C.-S., M.A.G-L., A.I.G.-D., and A.F.-V.; supervision, A.F.-V.; validation, A.F.-V.; visualization J.J.L.-M.; writing—original draft, J.J.L.-M.; writing—review and editing, L.C.-S., M.A.G.-L., A.I.G.-D., and A.F.-V. All authors have read and agreed to the published version of the manuscript.
Funding
This research received no external funding.
Conflicts of Interest
The authors declare no conflict of interest.
References
- Flyvbjerg, B. The Oxford Handbook of Megaproyects Management; Oxford University Press: Oxford, UK, 2017. [Google Scholar]
- Brookes, N.J.; Locatelli, G. Power plants as megaprojects: Using empirics to shape policy, planning and construction management. Util. Policy 2015, 36, 57–66. [Google Scholar] [CrossRef]
- Locatelli, G.; Littau, P.; Brooke, N.J.; Mancini, M. Project characteristics enabling the success of megaprojects: An empirical investigation in the energy sector. Procedia Soc. Behav. Sci. 2014, 119, 625–634. [Google Scholar] [CrossRef] [Green Version]
- Nobelius, D.; Trygg, L. Stop chasing the Front End process—Management of the early phases in product development projects. Int. J. Proj. Manag. 2002, 20, 331–340. [Google Scholar] [CrossRef]
- Crawford, L. Competition, Comparison, Collaboration—Mapping a Pathway through Project Management Standards. Procedia Soc. Behav. Sci. 2013, 74, 1–9. [Google Scholar] [CrossRef] [Green Version]
- Williams, T. The need for new paradigms for complex projects. Int. J. Proj. Manag. 1999, 17, 269–273. [Google Scholar] [CrossRef] [Green Version]
- Rosandich, R.G. Development of a Holistic Contract for EPC Projects. In Proceedings of the National Conference of the American Society for Engineering Management, Huntsville, AL, USA, 11–13 October 2001; pp. 145–150. [Google Scholar]
- Zhang, P.; Hu, X.; Zhang, J. A Brief Discussion of EPCMM Mode Befitting the Improvement of General Contract Management–Perfecting Measures Based on EPC and EPCM. In Proceedings of the 2011 International Conference on Management and Service Science, Wuhan, China, 12–14 August 2011; pp. 1–4. [Google Scholar]
- Muñoz–Cerón, E.; Lomas, J.C.; Aguilera, J.; de la Casa, J. Influence of Operation and Maintenance expenditures in the feasibility of photovoltaic projects: The case of a tracking PV plant in Spain. Energy Policy 2018, 121, 506–518. [Google Scholar] [CrossRef]
- Ho, M.T.; Allinson, G.W.; Wiley, D.E. Factors affecting the cost of capture for Australian lignite coal fired power plants. Energy Procedia 2009, 1, 763–770. [Google Scholar] [CrossRef] [Green Version]
- Joseph, C.; Gunton, T.I.; Hoffele, J. Assessing the public interest in environmental assessment: Lessons from cost–benefit analysis of an energy megaproject. Impact Assess. Proj. Apprais. 2020. [Google Scholar] [CrossRef]
- Kim, M.-H.; Lee, E.-B.; Choi, H.-S. Detail Engineering Completion Rating Index System (DECRIS) for Optimal Initiation of Construction Works to Improve Contractors’ Schedule–Cost Performance for Offshore Oil and Gas EPC Projects. Sustainability 2018, 10, 2469. [Google Scholar] [CrossRef] [Green Version]
- Zhang, Q.; Tang, W.; Liu, J.; Duffiel, C.F.; Hui, F.K.P.; Zhang, L.; Zhang, X. Improving Design Performance by Alliance between Contractors and Designers in International Hydropower EPC Projects from the Perspective of Chinese Construction Companies. Sustainability 2018, 10, 1171. [Google Scholar] [CrossRef] [Green Version]
- Rose, C.M.; Stegemann, J.A. From Waste Management to Component Management in the Construction Industry. Sustainability 2018, 10, 229. [Google Scholar] [CrossRef] [Green Version]
- Wei, S.H.; Yusof, A.M.; Ismail, S. A case study approach to EPCM in light of construction project success in Malaysia. Engineering 2012, 2, 5. [Google Scholar]
- Bastias, A.; Molenaar, K.R. A learning model for design–build project selection in the public sector. Rev. Ing. Constr. 2010, 25. [Google Scholar] [CrossRef] [Green Version]
- Dias Bahia, F.; Rodrigues de Farias, J. Analysis of success criteria in engineering, procurement and construction (EPC) projects Fabi. Rev. Gest. Proj. J. Bus. Proj. 2010, 1. [Google Scholar] [CrossRef]
- Gordon, C.M. Choosing Appropriate Construction Contracting Method. J. Constr. Eng. Manag. 1994, 120. [Google Scholar] [CrossRef]
- Pimentel, C.; Costa, K. Contract Management for International EPC Projects. Bachelor’s Thesis, Worcester Polytechnic Institute, Worcester, MA, USA, 2009; 127p. [Google Scholar]
- Ding, J.; Chen, C.; An, X.; Wang, N.; Zhai, W.; Jin, C. Study on Added–Value Sharing Ratio of Large EPC Hydropower Project Based on Target Cost Contract: A Perspective from China. Sustainability 2018, 10, 3362. [Google Scholar] [CrossRef] [Green Version]
- Pícha, J.; Tomek, A.; Löwitt, H. Application of EPC Contracts in International Power Projects. Procedia Eng. 2015, 123, 397–404. [Google Scholar] [CrossRef] [Green Version]
- Hernandez, L.A.J. EPC firms expand their role. Indep. Energy 1989, 19, 7. [Google Scholar]
- Zhong, J.R. Study on cost management under epc general contracting model. Adv. Mater. Res. 2011, 181–182, 49–53. [Google Scholar] [CrossRef]
- Losada Maseda, J.J.; Filgueira Vizoso, A. An evaluation of the readability of EPC contracts drafted in Spanish and English for industrial projects. Rev. Lleng. Dret 2016. [Google Scholar] [CrossRef]
- Grynbaum, J. Alliance contracting eliminates the risks of EPC contracts. Power Eng. 2004, 108, 56–60. [Google Scholar]
- Guido, J.L.; Micheli, E.; Cagno, M.Z. Supply risk management vs supplier selection to manage the supply risk in the EPC supply chain. Manag. Res. News 2008, 31, 846–866. [Google Scholar]
- Kim, M.-H.; Lee, E.-B.; Choi, H.-S. A Forecast and Mitigation Model of Construction Performance by Assessing Detailed Engineering Maturity at Key Milestones for Offshore EPC Mega–Projects. Sustainability 2019, 11, 1256. [Google Scholar] [CrossRef] [Green Version]
- Rameezdeen, R.; Rajapakse, C. Contract interpretation: The impact of readability. Constr. Manag. Econ. 2007, 25, 729–737. [Google Scholar] [CrossRef]
- Bakr, A.F.; El Hagla, K.; Abo Rawash, A.N. Heuristic approach for risk assessment modeling: EPCCM application (Engineer Procure Construct Contract Management). Alex. Eng. J. 2012, 51, 305–323. [Google Scholar] [CrossRef] [Green Version]
- Anderson, S.; Oyetunji, A. Selection Procedure for Project Delivery and Contract Strategy. In Proceedings of the Construction Research Congress, Honolulu, HI, USA, 19–21 March 2003. [Google Scholar]
- Maseda, J.J.L. Incorporación de Criterios de Mantenibilidad y Operatividad en la Contratación de Proyectos de Construccion bajo la Modalidad EPC en Plantas Industriales Para la Optimización de costes en la Fase de Explotación. Aplicación a Plantas de Regasificación de G; University of A Coruña: La Coruna, Spain, 2017. [Google Scholar]
- Kabirifar, K.; Mojtahedi, M. The impact of Engineering, Procurement and Construction (EPC) Phases on Project Performance: A Case of Large–scale Residential Construction Project. Buildings 2019, 9, 15. [Google Scholar] [CrossRef] [Green Version]
- Langhe, A.D.; Minde, P.R. Comparison of EPC Contract and Item Rate Contract with Case Study. J. Sustain. Constr. Eng. Proj. Manag. 2018, 1, 3. [Google Scholar]
- Joshi, P.B.; Shah, R. Design management for EPC contract. J. Constr. Eng. Technol. Manag. 2019, 9, 1. [Google Scholar]
- Wu, G.; Liu, C.; Zhao, X.; Zuo, J.; Zheng, J. Effects of fairness perceptions on conflicts and project performance in Chinese megaprojects. Int. J. Constr. Manag. 2019. [Google Scholar] [CrossRef]
- Donnelly, R. The coalescence between synergies and conflicts of interest in a top consultancy firm: An analysis of the implications for consultants’ attitudes and behaviours. Hum. Resour. Manag. J. 2011, 21, 60–73. [Google Scholar] [CrossRef]
- Liao, X.; Lee, C.Y.; Chong, H.-Y. Contractual practices between the consultant and employer in Chinese BIM–enabled construction projects. Eng. Constr. Archit. Manag. 2019, 27, 227–244. [Google Scholar] [CrossRef] [Green Version]
- Chen, T.Q.; Zhang, Y.B.; Zhang, S. Impacts of Different Types of Owner–Contractor Conflict on Cost Performance in Construction Projects. J. Constr. Eng. Manag. 2014, 140. [Google Scholar] [CrossRef]
- Wu, G.; Zhao, X.; Zuo, J.; Zillante, G. Effects of contractual flexibility on conflict and project success in megaprojects. Int. J. Confl. Manag. 2018, 29, 253–278. [Google Scholar] [CrossRef]
- Anderson, L.L., Jr.; Polkinghorn, B. Managing conflict in construction megaprojects: Leadership and third-party principles. Confl. Resolut. Q. 2008, 26, 167–198. [Google Scholar] [CrossRef]
- Suresh, M.V.J.J.; Reddy, K.S.; Kolar, A.K. 4–E (Energy, Exergy, Environment, and Economic) analysis of solar thermal aided coal–fired power plants. Energy Sustain. Dev. 2010, 14, 267–279. [Google Scholar] [CrossRef]
- Carneiro, M.L.N.M.; Gomes, M.S.P. Energy, exergy, environmental and economic analysis of hybrid waste–to–energy plants. Energy Convers. Manag. 2019, 179, 397–417. [Google Scholar] [CrossRef]
- Mosaffa, A.H.; Mokarram, N.H.; Farshi, L.G. Thermo–economic analysis of combined different ORCs geothermal power plants and LNG cold energy. Geothermics 2017, 65, 113–125. [Google Scholar] [CrossRef]
- Melani, A.H.A.; Murad, C.A.; Netto, A.C.; de Souza, G.F.M.; Nabeta, S.I. Criticality–based maintenance of a coal–fired power plant. Energy 2018, 147, 767–781. [Google Scholar] [CrossRef]
- Özgür–Ünlüakın, D.; Türkali, B.; Karacaörenli, A.; Aksezer, S.C. A DBN based reactive maintenance model for a complex system in thermal power plants. Reliab. Eng. Syst. Saf. 2019, 190. [Google Scholar] [CrossRef]
- Palacios Gόmez, J.L. Estrategias de ponderaciόn de la respuesta en encuestas de satisfacción de usuarios de servicios. Metodol. Encuestas 2002, 4, 175–193. [Google Scholar]
- Heeringa, S.G.; West, B.T.; Berglund, P.A. Section 2.7 on Weighting in the Analysis of Survey Data. In Applied Survey Data Analysis; CRC Press: Boca Raton, FL, USA, 2010. [Google Scholar]
- Pike, G.R. Using Weighting Adjustments to Compensate for Survey Nonresponse. Res. High. Educ. 2008, 49, 153–171. [Google Scholar] [CrossRef]
- Bethlehem, J.G. Weighting Nonresponse Adjustments Based on Auxiliary Information. In Survey Nonresponse; Groves, R.M., Dillman, D.A., Eltinge, J.L., Little, R.J.A., Eds.; Wiley: New York, NY, USA, 2002; pp. 275–287. [Google Scholar]
- Walter, S.D.; Eliasziw, M.; Donner, A. Sample size and optimal designs for reliability studies. Statitstics Med. 1998, 17, 101–110. [Google Scholar] [CrossRef]
- Godambe, V.P. A Unified Theory of Sampling from Finite Populations. J. R. Stat. Soc. Ser. B 1955. [Google Scholar] [CrossRef]
- O’Neill, D.S. GRI403: OHS Reporting Standard; Global Reporting Initiative: Camberra, Australia, October 2018. [Google Scholar]
- Marchant Silva, A.F. Desarrollo de Guía de Recomendaciones Para la Gestión de Riesgo en Proyectos de Construcción, Utilizando la Metodología PMBOK; Univesidad de Chile–Facultad de Ciencias Físicas y Matemáticas: Santiago, Chile, 2012. [Google Scholar]
© 2020 by the authors. Licensee MDPI, Basel, Switzerland. This article is an open access article distributed under the terms and conditions of the Creative Commons Attribution (CC BY) license (http://creativecommons.org/licenses/by/4.0/).

 ,
, 


