Climatic Causes of Maize Production Loss under Global Warming in Northeast China


1
State Key Laboratory of Severe Weather, Chinese Academy of Meteorological Sciences, Beijing 100081, China
2
Faculty of Geoscience and Technology, Zhengzhou University, Zhengzhou 450001, China
3
Department of Earth Sciences, University of Gothenburg, 405 30 Gothenburg, Sweden
4
Department of Geography, University of Cambridge, Cambridge CB2 3EN, UK
5
Department of Rural Regional Development, Beijing University of Agriculture, Beijing 102206, China
6
Climate Center of Sichuan Province, China Meteorological Administration, Chengdu 610072, China
*
Author to whom correspondence should be addressed.
Sustainability 2020, 12(18), 7829; https://0-doi-org.brum.beds.ac.uk/10.3390/su12187829
Submission received: 19 August 2020
/
Revised: 9 September 2020
/
Accepted: 18 September 2020
/
Published: 22 September 2020
(This article belongs to the Section Air, Climate Change and Sustainability)
Abstract
:Maize (Zea mays L.) is one of the most important staple crops in Northeast China, and yield losses are mainly induced by climate anomalies, plant diseases and pests. To understand how maize yield loss is affected by global warming, daily precipitation and temperatures, together with provincial agricultural data sets, were analyzed. The results showed that the accumulated temperature, an important factor in agricultural productivity, increased by 5% in 1991–2017, compared to 1961–1990, and that the frequency of low temperatures decreased by 14.8% over the same time period. An increase in drought by 21.6% was observed from 1961–1990 to 1991–2017, caused by decreased growing-season precipitation by −4 mm/decade. In addition, days with heavy rain in August and September increased slightly in Northeast China. In general, maize growth responded positively to the increased thermal conditions; in 1961–1990, 22.7% of observed maize yield-loss cases were due to low temperatures, but only 10% in 1991–2017. However, during the same time, the number of drought-induced yield loss cases increased from 27.3% to 46.7%. Moreover, yield loss cases caused by heavy rainstorms increased from 4.5% to 13.3%, indicating that heavy rainstorms have become an increasing threat to agriculture in Northeast China over the last three decades. In total, at least 70% of cases of provincial yield losses in Northeast China over the last three decades could be attributed to climatic factors. The frequency of climate hazards has changed under global warming, resulting in new challenges for agriculture. While drought and low temperatures were the primary causes for climate-induced yield losses before the 1990s, negative impacts from extreme events, mainly drought but also heavy precipitation, have increased in the last three decades, associated with global change. Farmers, agricultural scientists, and government policy makers could use these results when planning for adaptation to climate change.
1. Introduction
Climate change has already had an observable impact on the global food production [1]. In this context, extreme climate and weather events can have significant negative impacts on agriculture, depending on their duration, intensity and distribution [2]. If several of the world’s breadbaskets are exposed simultaneously to extreme climatic conditions, it could have severe negative global impacts [3]. However, non-climatic factors, such as changing crop varieties, fertilizer use, plant diseases and insect pests, also affect productivity, making it important to estimate the contribution of climate variations on annual yields.
Agriculture is one of the main economic pillars in China, where the agricultural sector employs 564 million people and comprises about 8% of China’s GDP [4]. Maize (Zea mays L.) is one of China’s most important staple crops, occupying a total area of nearly 42 million hectares (ca. 25% of the total cultivated area in China), with a production exceeding 257 million tons in 2018, which was 22.4% of the total world maize production that year [5], making China the second largest maize producer in the world after the US. Maize is cultivated in 31 provinces throughout China, with Northeast China (NC) being the main maize region, accounting for 32.8% of the country’s total maize production [6]. In NC, climate related maize yield loss has mainly been associated with temperature (cold and heat stress), and hydroclimate (dry and wet stress) extremes [7,8,9,10]. For example, unusually low temperatures during the summer of 1969 resulted in accumulated growing season temperatures that were 200–300 °C·d below normal. This resulted in crops being unable to mature before the first frost, reducing the maize production by 6.55 × 10³ million kg over the entire region—e.g., decreasing the yield in Heilongjiang by 32% [10]. Another example relates to drought, which is one of the major climatological hazards that frequently influences crop growth in China. A serious drought in 2000, lasting from May to July in most parts of NC, had a profound impact on the maize production, which was reduced by 0.5 million tons in the Liaoning province, where the crop failed to mature at about 1 million hectares [10].
Along with a rise in global temperatures, associated with increasing concentrations of atmospheric greenhouse gases [11,12], temperatures have been warming in China [13,14]. The average annual temperature across China increased by 1.17 °C from 1901 to 2016 [15], and temperatures are projected to increase in the future [16]. Precipitation tends to differ regionally [17], where changes are mainly significant and positive in western China [18], and since the 1990s the occurrence of droughts has increased and they are becoming more severe [19]. Model studies suggest that droughts will become increasingly severe, have longer durations and appear more frequently over most of China in the near future [20]. The projected changes will result in climate hazards that will have pronounced impacts on society.
Climate hazards affecting agricultural production can occur in any climate regime of the world, even deserts and rainforests. Temperature is one key factor influencing agricultural production in NC, especially low temperatures, where, for instance, the accumulated temperature (AT), a measure that can be used as an indicator of thermal conditions needed for various crops [21], may be inadequate for crops to mature if low temperatures occur during spring or summer [22,23]. In association with increasing temperatures, the growing season (GS) has been extended during the 20th century for most of the Northern Hemisphere [24,25,26,27,28,29]. Because the accumulated GS temperatures have increased, improved thermal conditions have become more favorable for crop growth in northern China [13].
Droughts are one of the most costly climate hazards, and their impacts are significant and widespread. Several drought indices have been developed to monitor drought and to assess its impact [30,31,32,33,34,35,36,37,38,39,40,41,42]. Of these drought indices, the weighted average of precipitation index [37], which is based on the standardized precipitation index (SPI), has been shown to be more flexible and versatile when monitoring drought on daily timescales [43]. When drought occurs, soil moisture decreases, limiting the amount of soil water available to the maize root system. Especially during prolonged droughts, when maize is grown under water deficit conditions, yields will be significantly affected. It has been shown that relative soil moisture below 60% will have negative impacts on maize growth [10].
Maize is a tall crop, with an average stalk height generally being greater than 2 m, with the ears (the part of the plant containing the kernels) appearing at around 1.2–1.4 m. As a result, the weight of the upper part of the stalk is generally heavier than that of the lower part, and the maize plants can become unstable under wet conditions. During heavy rains and/or strong winds, maize is prone to lodging (breaking of the stalk), resulting in un-harvestable yield and crop failure [10]. Maize typically forms ears in August. Thus, an additional climate hazard affecting crop yields in NC is waterlogging caused by rainstorms associated with the East Asian summer monsoon [44].
There have been large efforts to describe and predict spatiotemporal changes in key agricultural factors, such as precipitation and temperature extremes, but less focus has been on how changes in various climate hazards related to global warming have impacted maize production. This information is needed when guiding the actions of government agencies and crop breeders to provide a more resilient agriculture sector that is better adapted to changing climate conditions. Therefore, the objective of this study is to assess the influence of key climate hazards, drought, low temperature and rainstorms, on maize yield loss in NC since the 1960s.
2. Material and Methods
2.1. Study Area and Data
Here, Northeast China (NC) is defined as consisting of the provinces Heilongjiang, Jilin, and Liaoning (38° N–55° N and 118° E–135° E). This part of China is cool due to its high-latitude location, and can be characterized as having a temperate monsoon climate. The annual mean surface air temperature of NC is only 5.4 °C (1981 to 2010), which is 7.8 °C lower than the average for China. The total annual precipitation ranges from 460 to 750 mm.
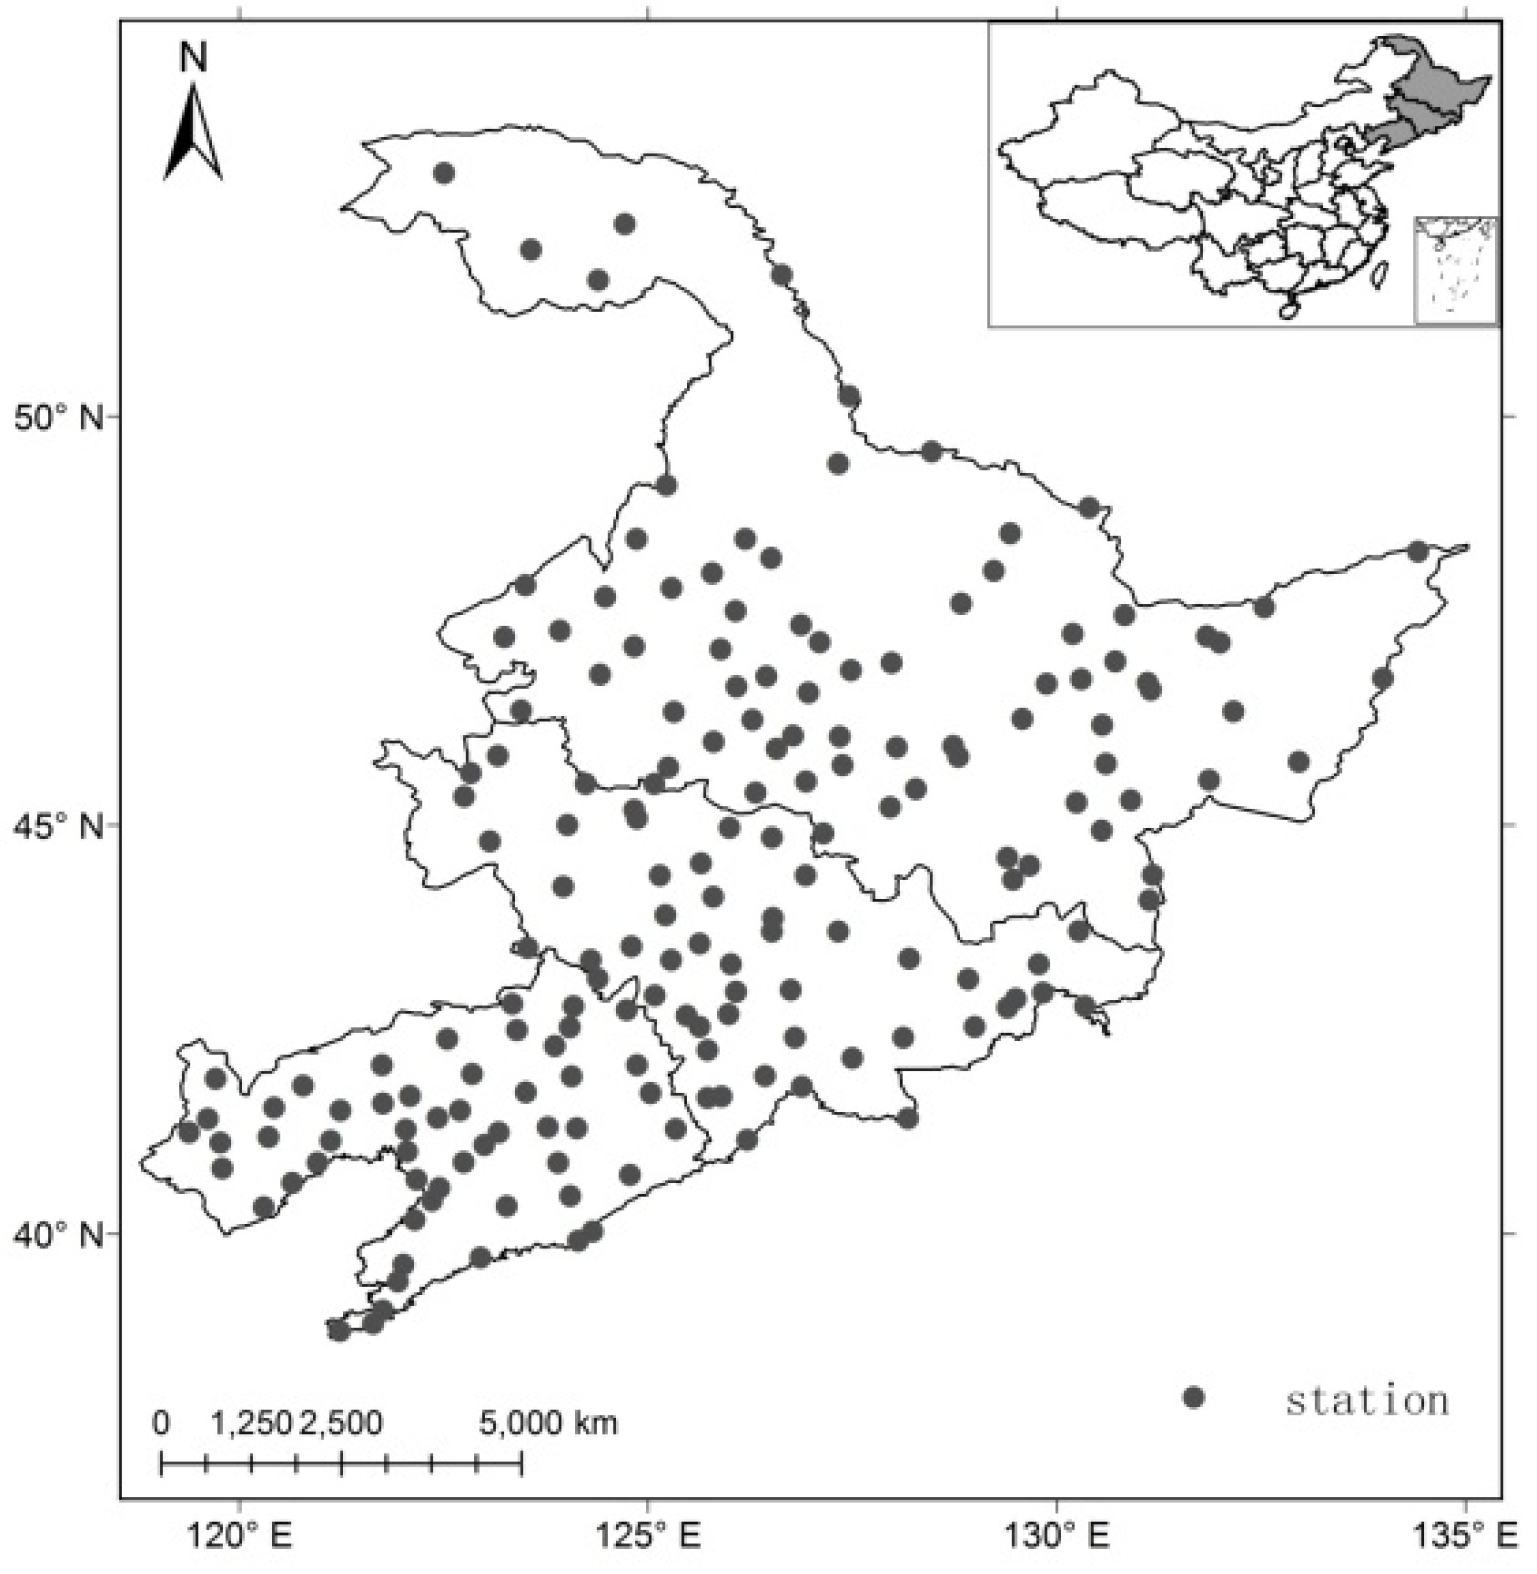
In order to investigate the influence of climate hazards on maize yield loss, daily precipitation and mean temperatures provided by the China Meteorological Administration, the period 1961–2017 were used. Only stations with data series covering more than 57 years with low rates of missing data (≤5%) were included in the analysis (Figure 1), resulting in a total of 169 stations for NC. Furthermore, relative soil moisture data from 10 cm depths, observed on the 8th, 18th, and 28th of every month from 1995 to 2010, were also used. Provincial-level maize yields were obtained from the Ministry of Agriculture of the People’s Republic of China for the period 1958 to 2017.
2.2. Methods
Temperature and precipitation during the GS are the main limiting factors of climate induced maize yields in NC [45]. If the AT during the growing season does not reach a certain threshold, it may have negative impacts on the yield, so we selected AT as an index which would identify low temperatures that could be harmful for maize growth. Further, maize yields are vulnerable to the extent and duration of drought, so in our analyses we used the accumulated drought index (AD), which is based on an index of the weighted average of precipitation [37], and is more flexible and versatile than the SPI when monitoring drought on daily timescales. Finally, another climate hazard affecting maize yields in NC is heavy precipitation events, so rainstorm days were chosen as an index in this paper.
2.2.1. Low Temperature
We used the 10-degree threshold for calculating the AT according to Yan et al. [46], where the AT is obtained from the sum of average daily temperatures that are equal to or above 10 °C from May to September. Because we were interested in low temperatures, we used the anomaly of AT as a low temperature, which was defined as:
where ATx represents the AT anomaly during May–Sep in year i, relative to the mean AT during the previous three years, and T represents daily temperatures equal to or greater than 10 °C. Low temperatures are defined when ATx is negative.
2.2.2. Droughts and Rainstorms
Drought conditions were characterized using the WAP (the Weighted Average of Precipitation) index. Drought variability can be described by a simplified physical model using only precipitation. The model is expressed as:
where t is the time, and f(t) is the drought intensity at time t, P(t) is the precipitation at time t, bf(t) is the effect of the decay of drought extent from the demands of runoff, evapotranspiration, groundwater flow, and percolation [37], where b represents the strength of the decay.
The WAP index is calculated as:
where represents the contribution of P1 of the previous day’s precipitation to the drought extent f0 of the present day. The SPI and precipitation of the present day can be considered as two extreme cases (in which a is changing from 0 and 1). When a approaches zero, the WAP will become P0. When a reaches 1, WAP will be equivalent to the simple average of precipitation. In this paper, WAP was standardized. Detailed information about the index can be found in Lu [37].
To relate maize yield loss to the duration of drought, we used accumulated drought index (AD) derived from the WAP:
Rainstorms in NC they are mainly induced by mesoscale convective systems (MSC) in summer and autumn [47]. A MSC generally has a spatial scale of 10–1000 km, lasting from about one hour to one or two days. The large-scale weather system that mainly affects the occurrence and development of MSCs is the northeast cold vortex. When a blocking high exists, the position of the northeast cold vortex becomes stable, often producing rainstorms, gale winds, hailstorms, etc. Maize is sown in May and will become a tall crop after July. After heavy rains and/or strong winds, maize is prone to lodging, either by the strong winds or by the soils becoming waterlogged (saturated), or by flooding due to changes in the water balance [48,49,50], then resulting in crop failure. Thus, we focused on heavy rainstorm days in August and September. We defined a heavy rainstorm day as one with precipitation greater than 50 mm for one day.
2.2.3. Yield Loss Rate
Maize yields are influenced by technological development and by climate. Maize yield losses are caused by weather events, as well as by plant diseases and insect pests. The increasing trend in yields has largely been driven by advances in agricultural technology, but the effects of these advances are quite short—for example a new variety usually increases yields for only around 3–5 years in China. The yield loss rate was defined using Equation (5), which expresses the yield for a given year relative to the yield averaged over the preceding three years according to Song et al. [10]:
where Yl is the yield loss rate caused mainly by climate hazards;
- Yi is the maize yield in a given year, i;
- Yt is the maize yield during the three years previous to the given year.
3. Results
3.1. Change of Climate Hazards
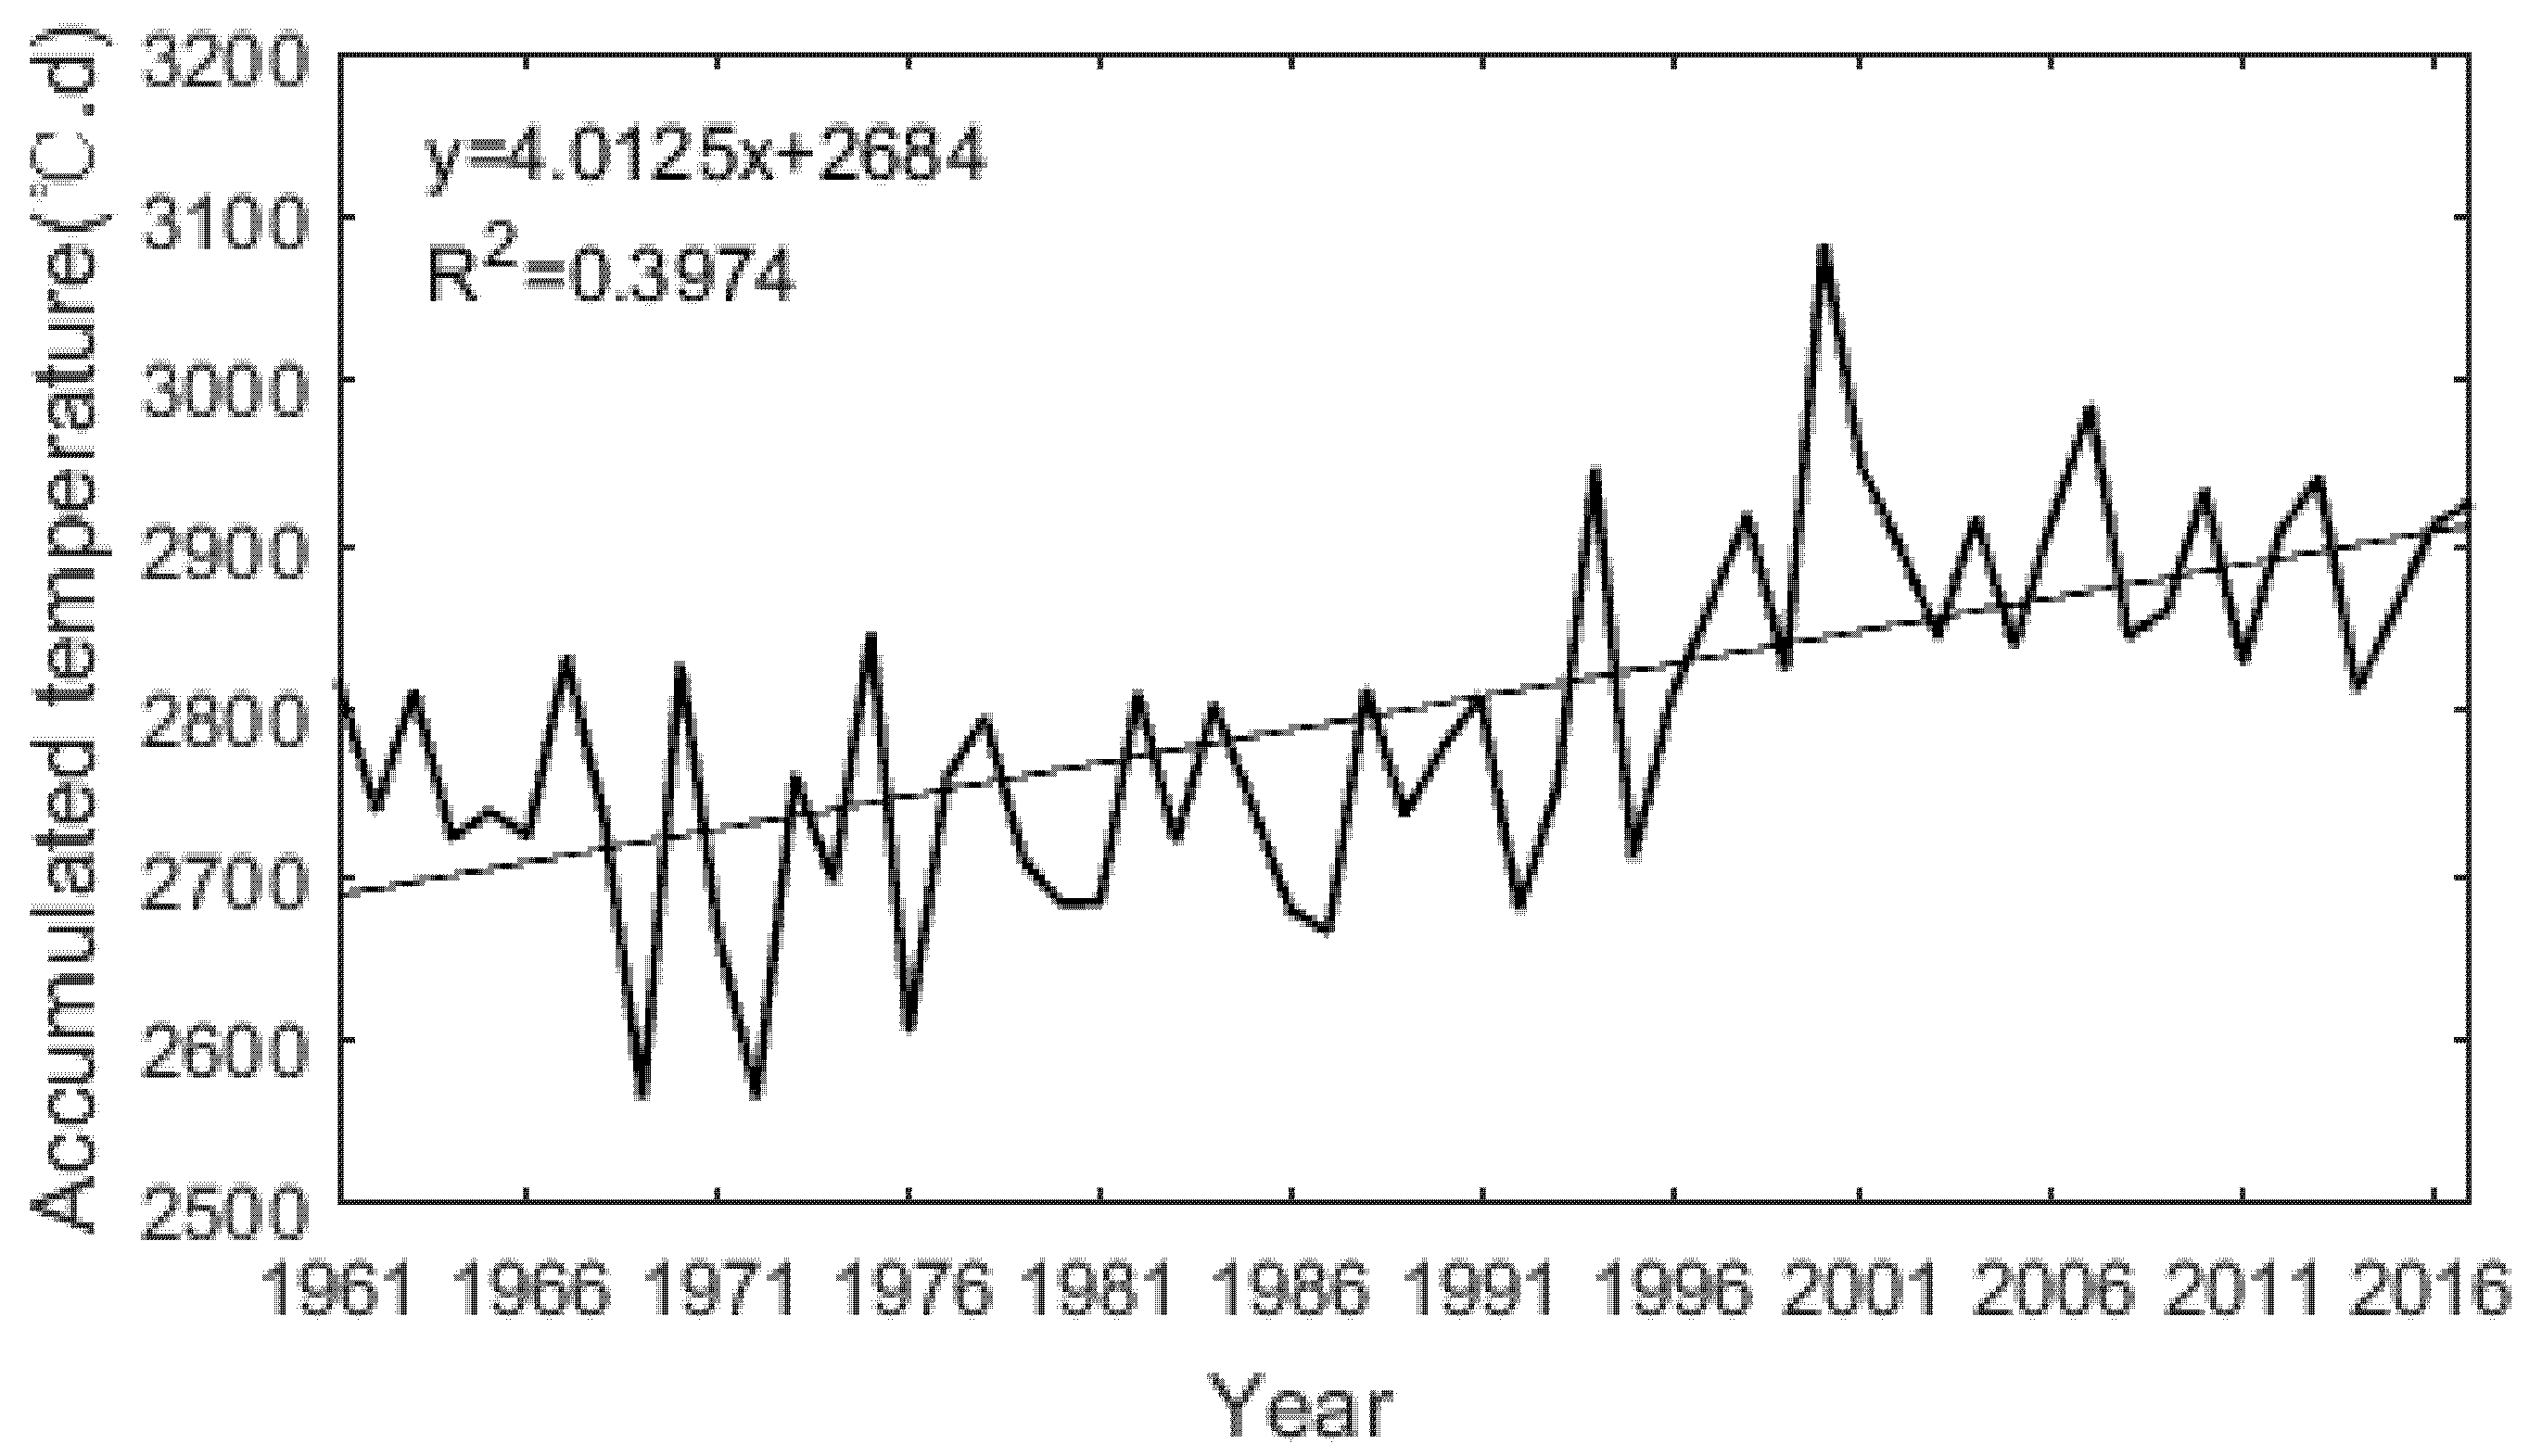
The growing season temperature in NC showed large inter-annual variability, but an overall increasing rate of 0.24 °C/decade from 1961 to 2017, increasing 0.9 °C during 2008–2017 relative to 1961–1970. Associated with this increase, the AT of the maize growing season (May–September) increased by 4.0 °C·d/decade. Average values of AT were 2752 °C·d in the 1960s, 2709 °C·d in the 1970s, 2744 °C·d in the 1980s, and then increased sharply to 2840 °C·d in the 1990s, 2900 °C·d in the 2000s, and 2885 °C·d from 2011 to 2017. Maize needs about 2000–3600 °C·d in Northeast China to develop well [51], so the AT seems to have become increasingly more suitable for maize over the last three decades. Because our results show a distinct change in thermal conditions from 1991, in the subsequent analyses we analyzed climate events and yield losses during those two intervals: 1961–1990 and 1991–2017. The AT increased by 5% during 1991–2017, relative to 1961–1990 (Figure 2). From the low temperature index (Equation (1)), it was found that the frequency of low temperature occurrences decreased by 14.8% in 1991–2017 relative to 1961–1990. For example, in 1969, which was a very cold year in NC, the AT was 2565 °C·d, lower by 199 °C·d than that in the previous three years. In 1976, another cold year, the AT was 2605 °C·d, lower by 163 °C·d than that in the previous three years in NC. The year with the coldest growing season temperature after 1991 was 2003, when the AT was 2845 °C·d, 132 °C·d lower than that in the previous three years.
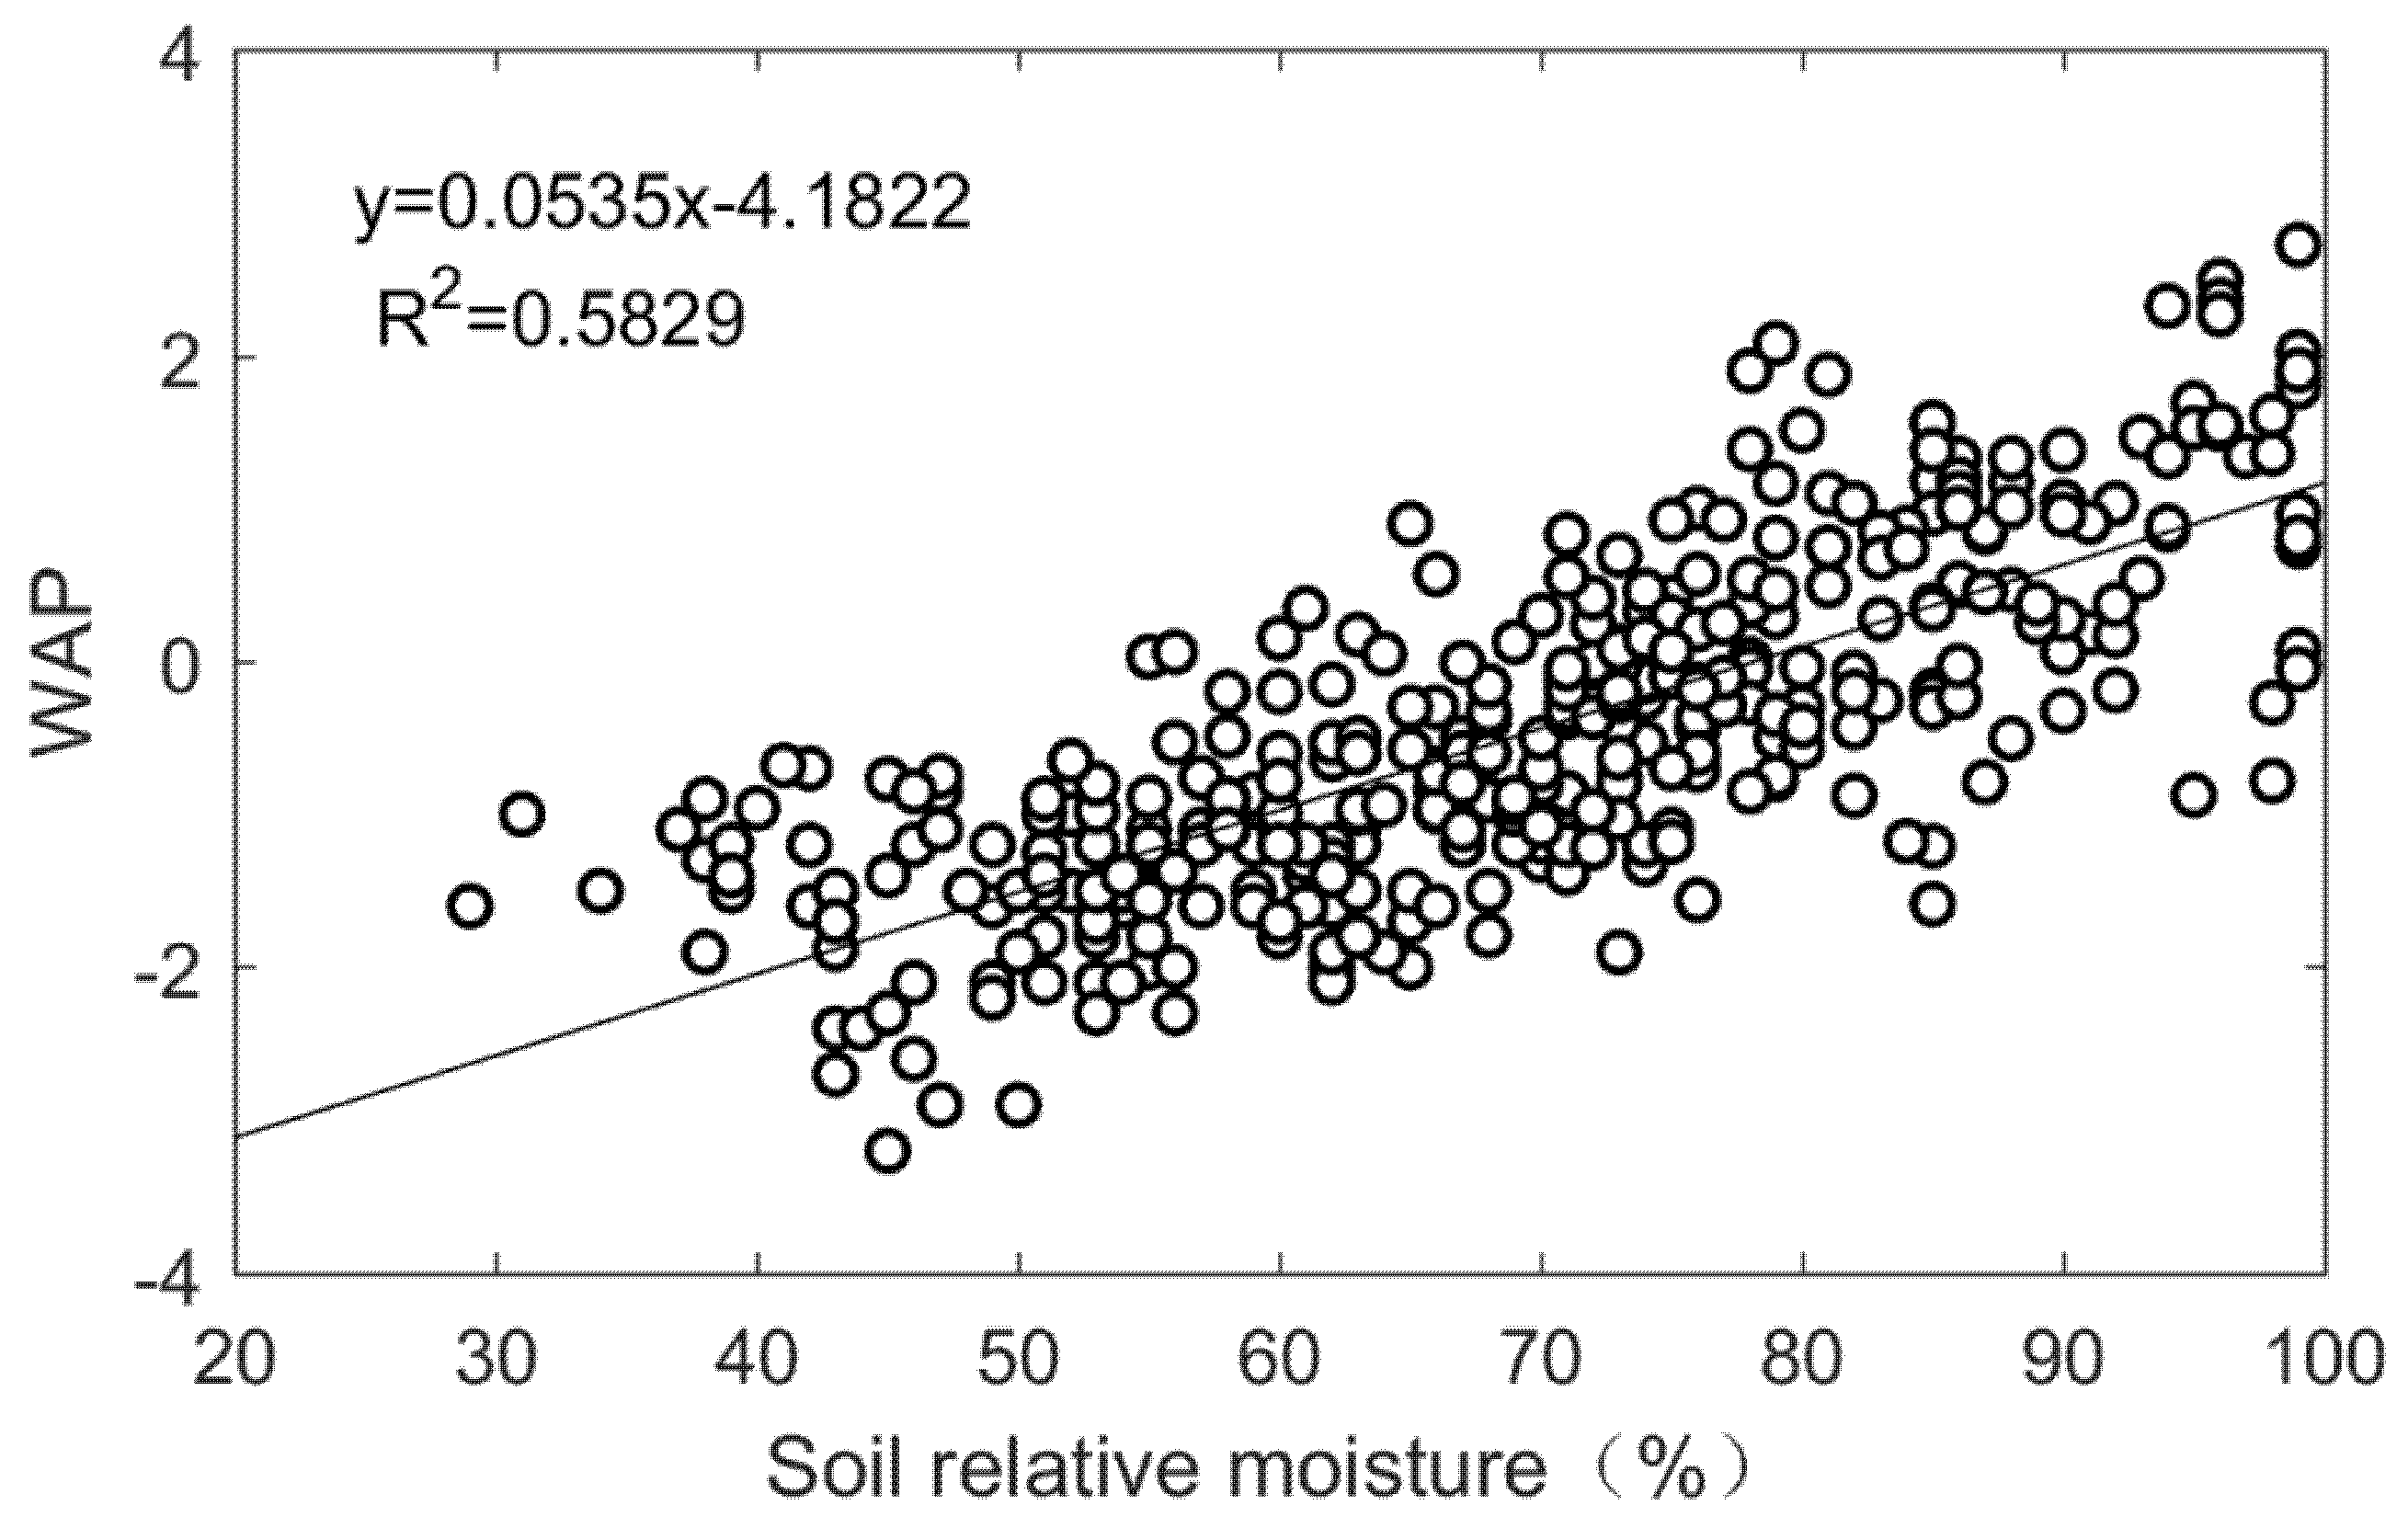
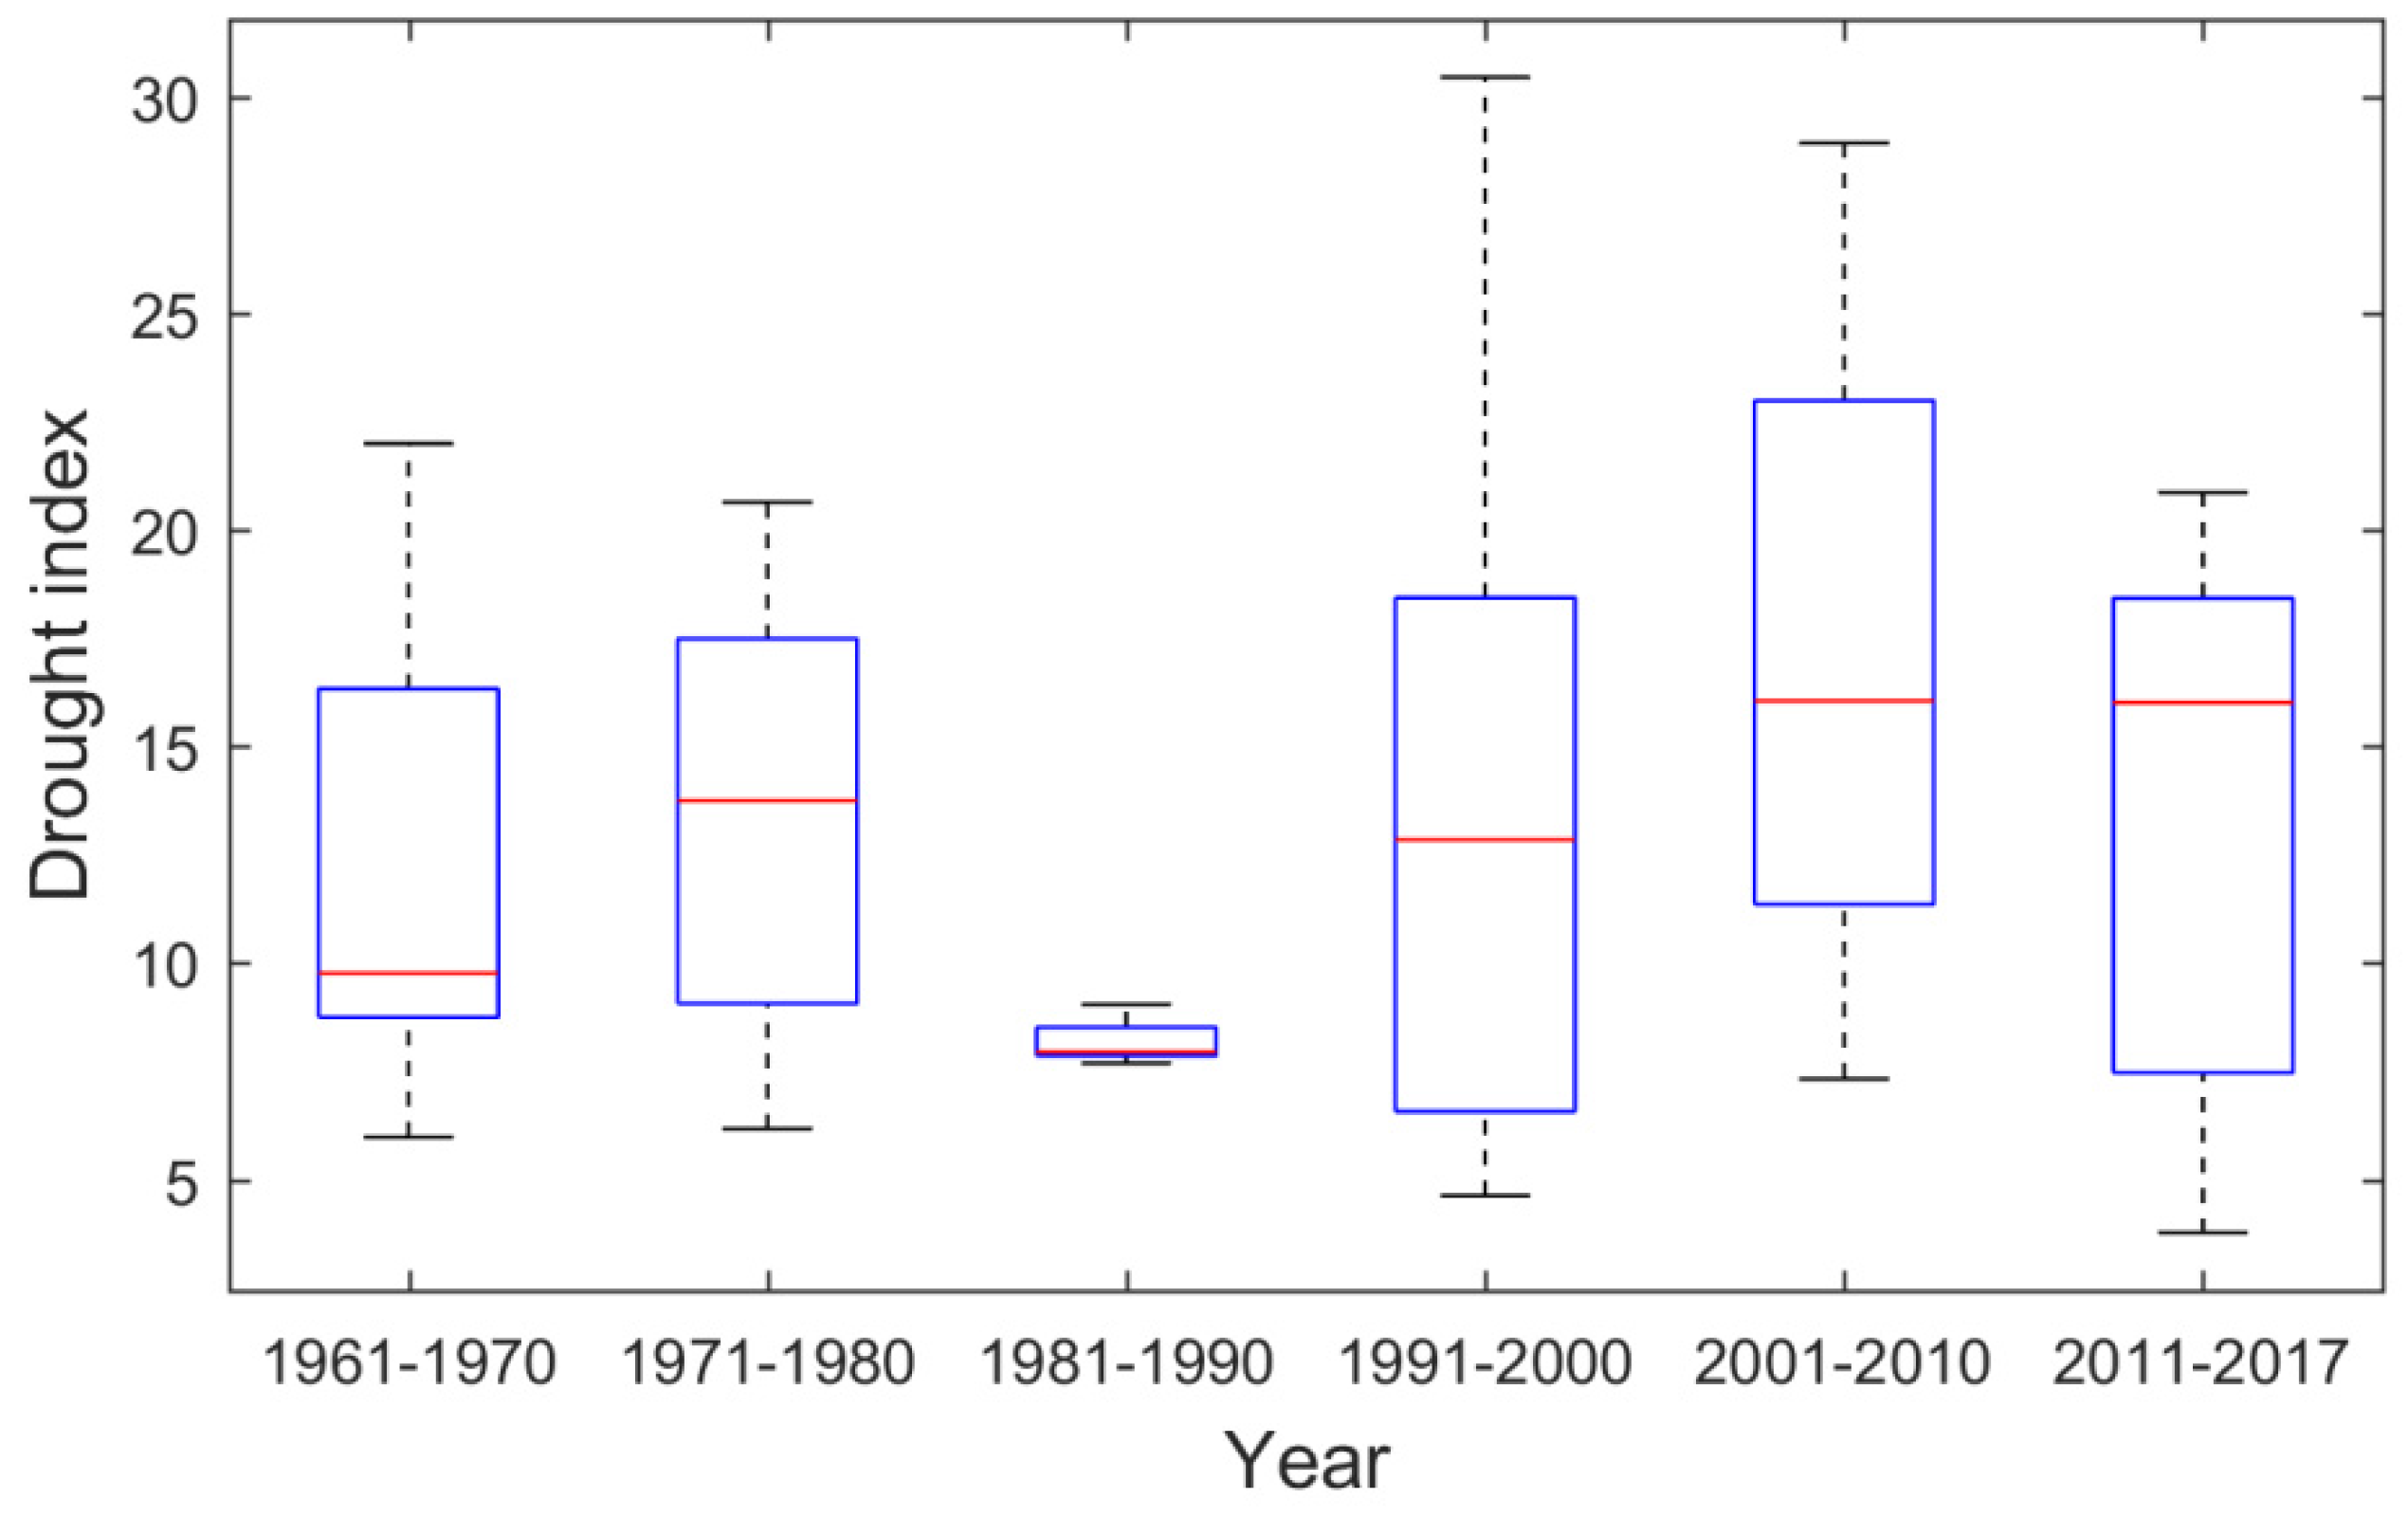
Determining a drought index threshold is important when characterizing the impact of drought on maize production. Using the observed values of relative soil moisture, the relationship between the WAP and relative soil moisture was investigated. The results showed significant correlations between the WAP and relative soil moisture (r = 0.76, p < 0.0001, N = 367). It was found that the relative soil moisture reached approximately 60% when the WAP0 was −1.0 (Figure 3), so based on earlier studies (see above), we chose this value as the limit for defining drought events. Next, the accumulated drought index (AD) for the maize growing season was calculated. The annual precipitation decreased slightly by −1.2 mm/decade from 1961 to 2017 in NC, which is line with the precipitation change over the whole of China [15]. Maize growing season precipitation, on the other hand, decreased by −4.0 mm/decade. Because of the decreasing precipitation, drought conditions during the maize growing season increased in NC, especially during the past two decades. Accumulated drought index (AD) values for the maize growing season showed decadal variability, being 12.0 in 1960s, 13.7 in 1970s, 11.4 in 1980s, 13.9 in 1990s, 17.4 in 2000s, and 13.4 from 2011 to 2017. In a multi-decadal perspective, the drought index increased by 21.6% in 1991 to 2017 relative to 1961 to 1990 (Figure 4).
The results of our analysis showed that the regional average number of rainstorm days in August–September increased slightly during the analyzed period by 7.8% during 1998–2017 compared to 1961–1980. Moreover, extreme rainstorm days also increased, especially in the Jilin and Liaoning provinces. For example, maximum rainstorm days in the Jilin province were in average 0.6 days in the 1970s, but increased to 1.0 days in the 1990s. In Liaoning province, the maximum rainstorm days was 1.9 days in the 1980s and increased to 2.4 and 2.3 days in the 1990s and 2000s, respectively (Table 1).
3.2. Climatic Reasons for Maize Production Loss
Climate variations from daily to inter-annual timescales affect a number of physical, chemical, and biological processes that drive the productivity of maize. The latitudinal distribution of maize is a function of several climate factors, such as temperature, precipitation, and daily solar radiation (photoperiod). Extreme weather events and hazards influence the production of maize. Depending on the development stage, maize growth may be negatively affected by short-duration events, but yields, especially on province level, may not decrease if there is a subsequent improvement in growth conditions. Weather events extending over longer time, such as drought, are more likely to have negative impacts on yields. Thus, it is important to investigate the limit of hazards that can affect the province-level yields.
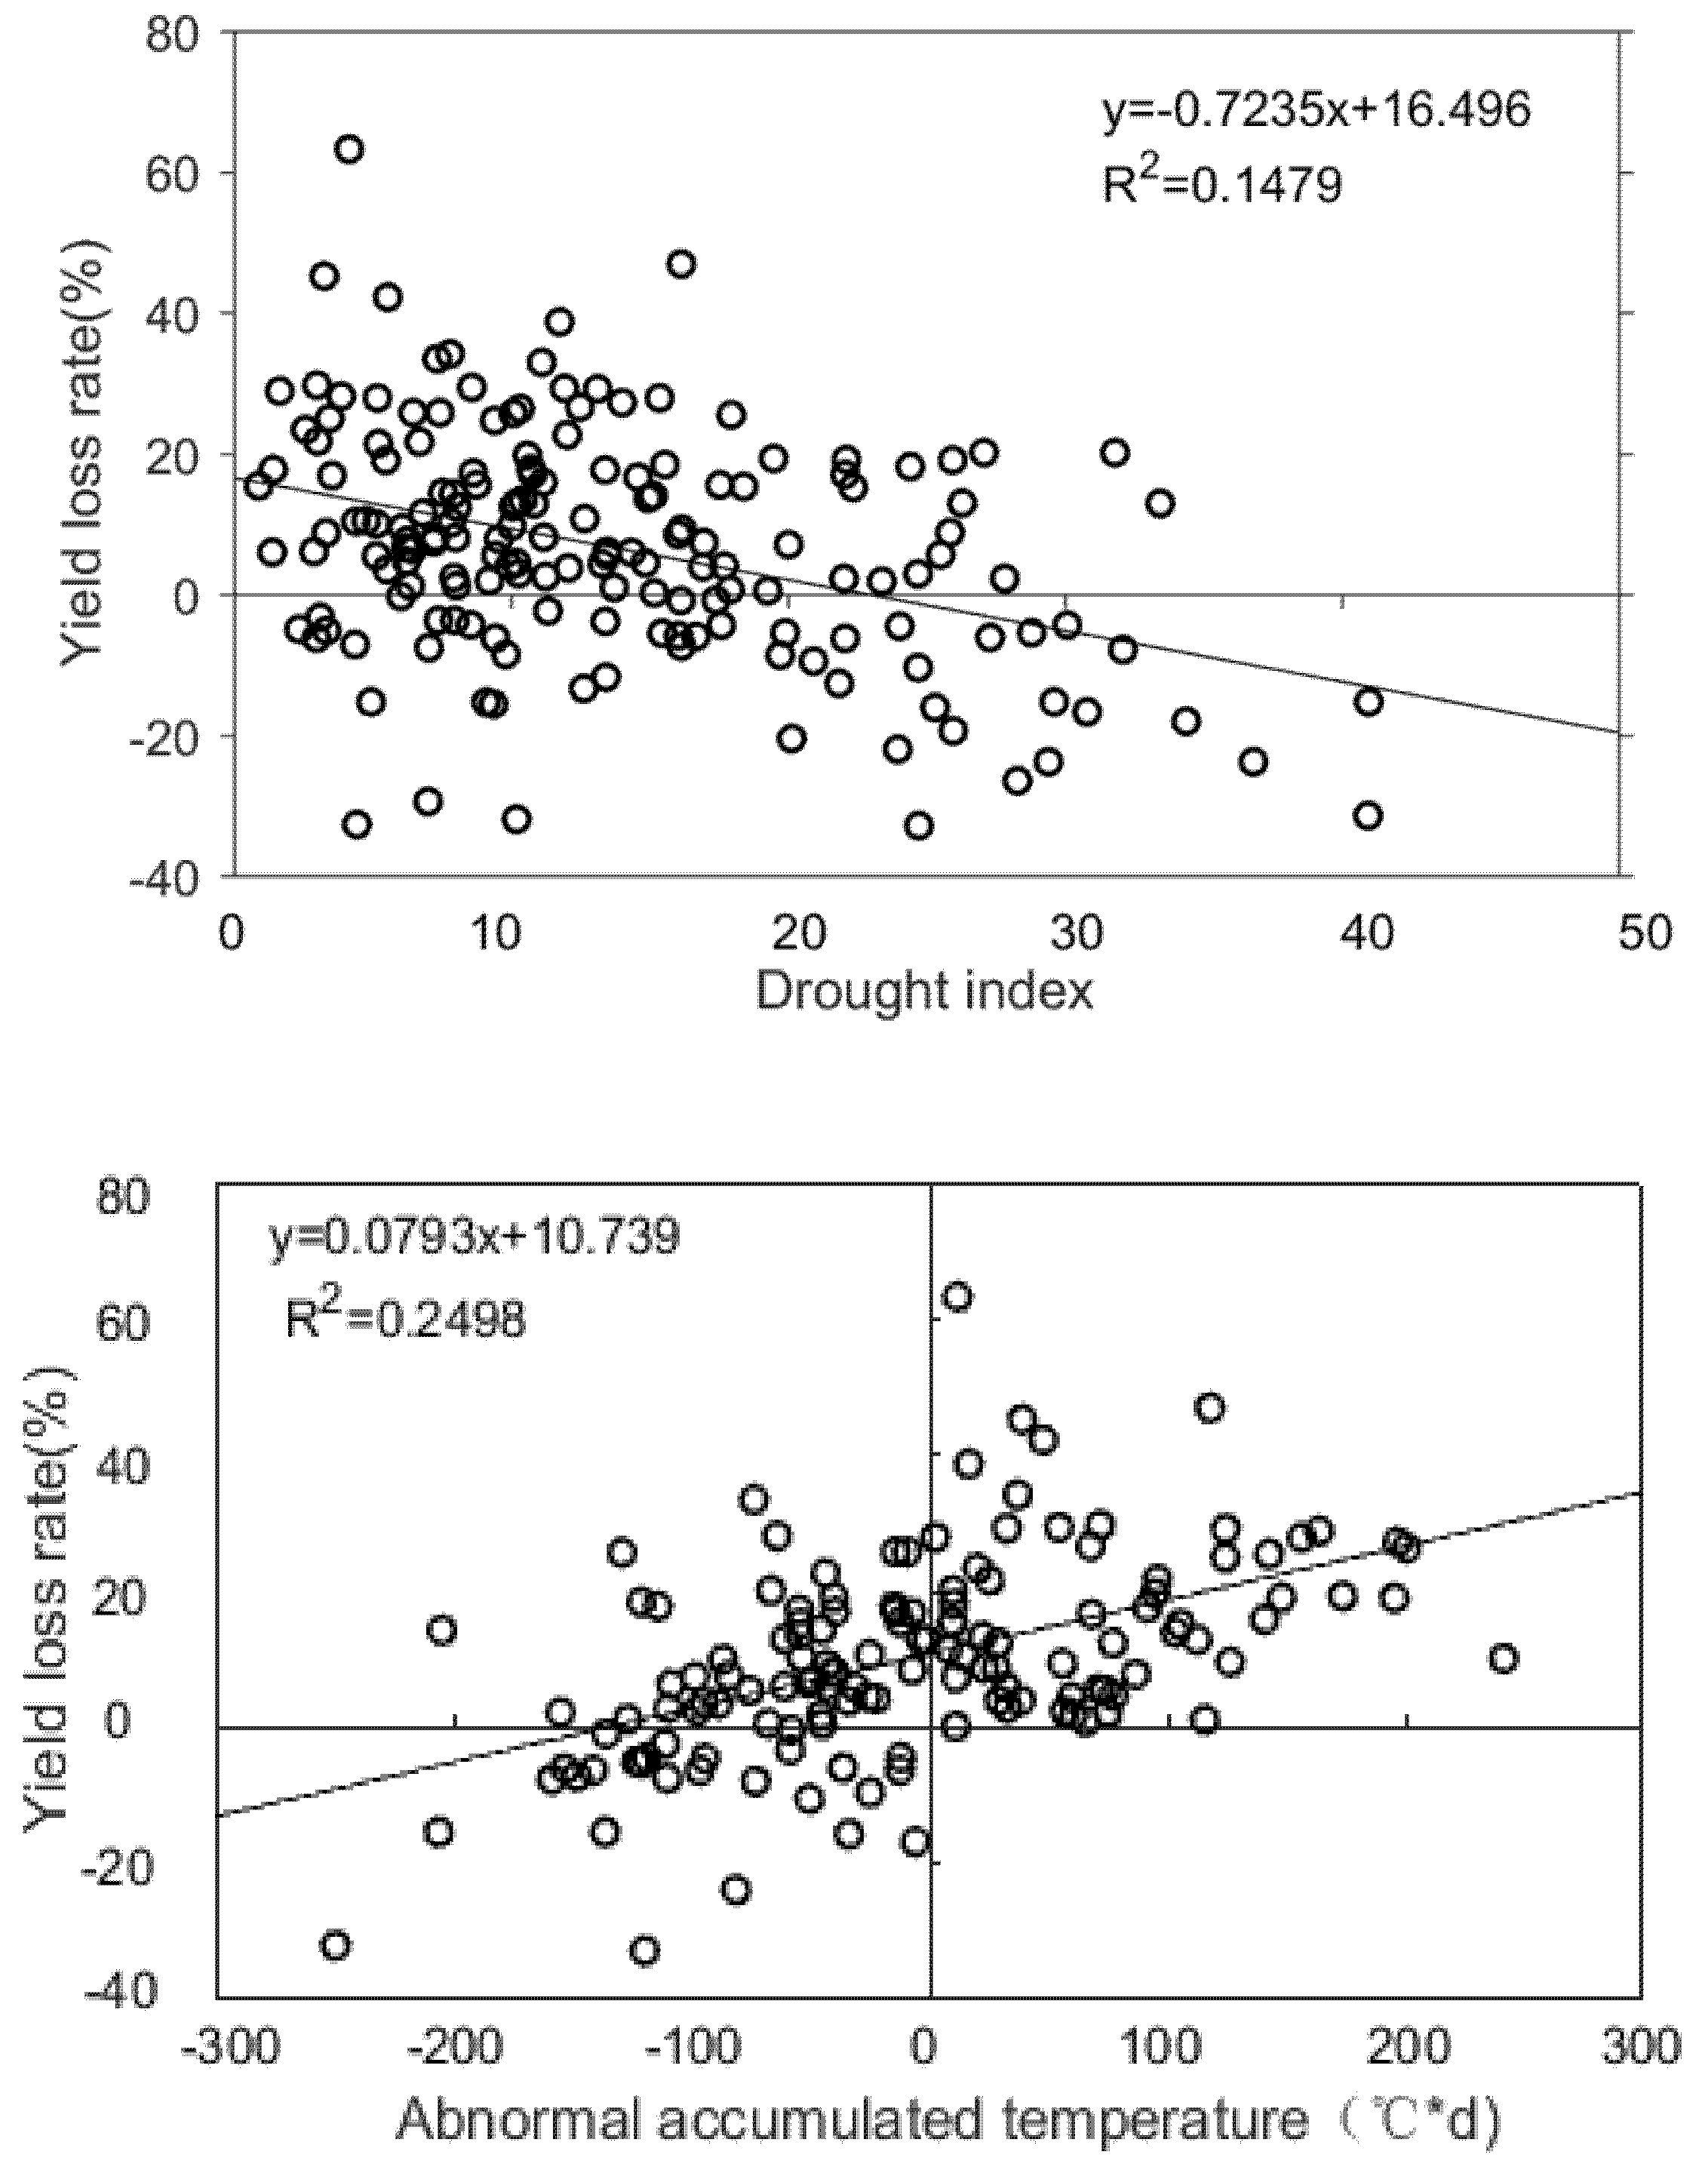
Overall, the increasing temperatures in the study area had a positive effect on maize growth [10]. In addition, given the new conditions, new maize varieties have been bred that are adapted to warmer conditions in NC, which can grow over an extended growing season. It is clear that warmer GS temperatures alone have had little negative impact on yield loss in NC. However, our analysis showed significant correlations between the yield loss rate and low ATx (r = 0.50, p < 0.0001). The temperature was cold during the growing season in 1969, and the low temperature index was −249.3 °C·d in Heilongjiang and −205 °C·d in the Jilin province, corresponding to decreased maize yields of 32.0% and 15.3% for these two provinces, respectively (Table 2). In general, our results suggest that maize yields decreased when the AT was 135 °C·d lower than those observed during the previous three years (Figure 5). Therefore, the low temperature limit for yield loss was set as −135 °C·d. However, it is clear that very low AT has decreased in recent years.
Our results showed that maize yield loss is associated with the extent and duration of drought. A significant correlation (r = 0.39, p < 0.0001) between yield loss rate and AD was found. As an example, drought was very serious in 2000 in NC. The maize growing season precipitation was only 347 mm, 35% less than in a normal year in the Liaoning province, and the AD was 40.9, leading to a decrease of 31.5% in the maize yield (Table 2). In the same year, precipitation was only 426 mm (−14%) in Jilin and 374 mm (−15%) in Heilongjiang provinces, the AD amounted to 24.7 and 27.3 for those two provinces, respectively, corresponding to decreases in maize yields by 32.9% for Jilin and 6.2% for Heilongjiang. In general, maize yields decreases when the AD exceeds 22.8 (Figure 5).
The correlation between yield loss rate and rainstorm days was −0.28, which is significant (p < 0.005). On a provincial level, maize yields were negatively affected when the average rainstorm days during August–September exceeded 1.5 (Figure 5). For example, rainstorms which occurred in the western and northern regions of the Liaoning province on August 6 in 1994, had precipitation amounts of 349, 309, and 344 mm in Yixian, Xinmin and Kaiyuan stations, respectively. Ten days later, an additional rainstorm affected eastern Liaoning, accompanied by winds of 20–25 m/s [52], and that year, the maize production decreased by 29.5% in Liaoning.
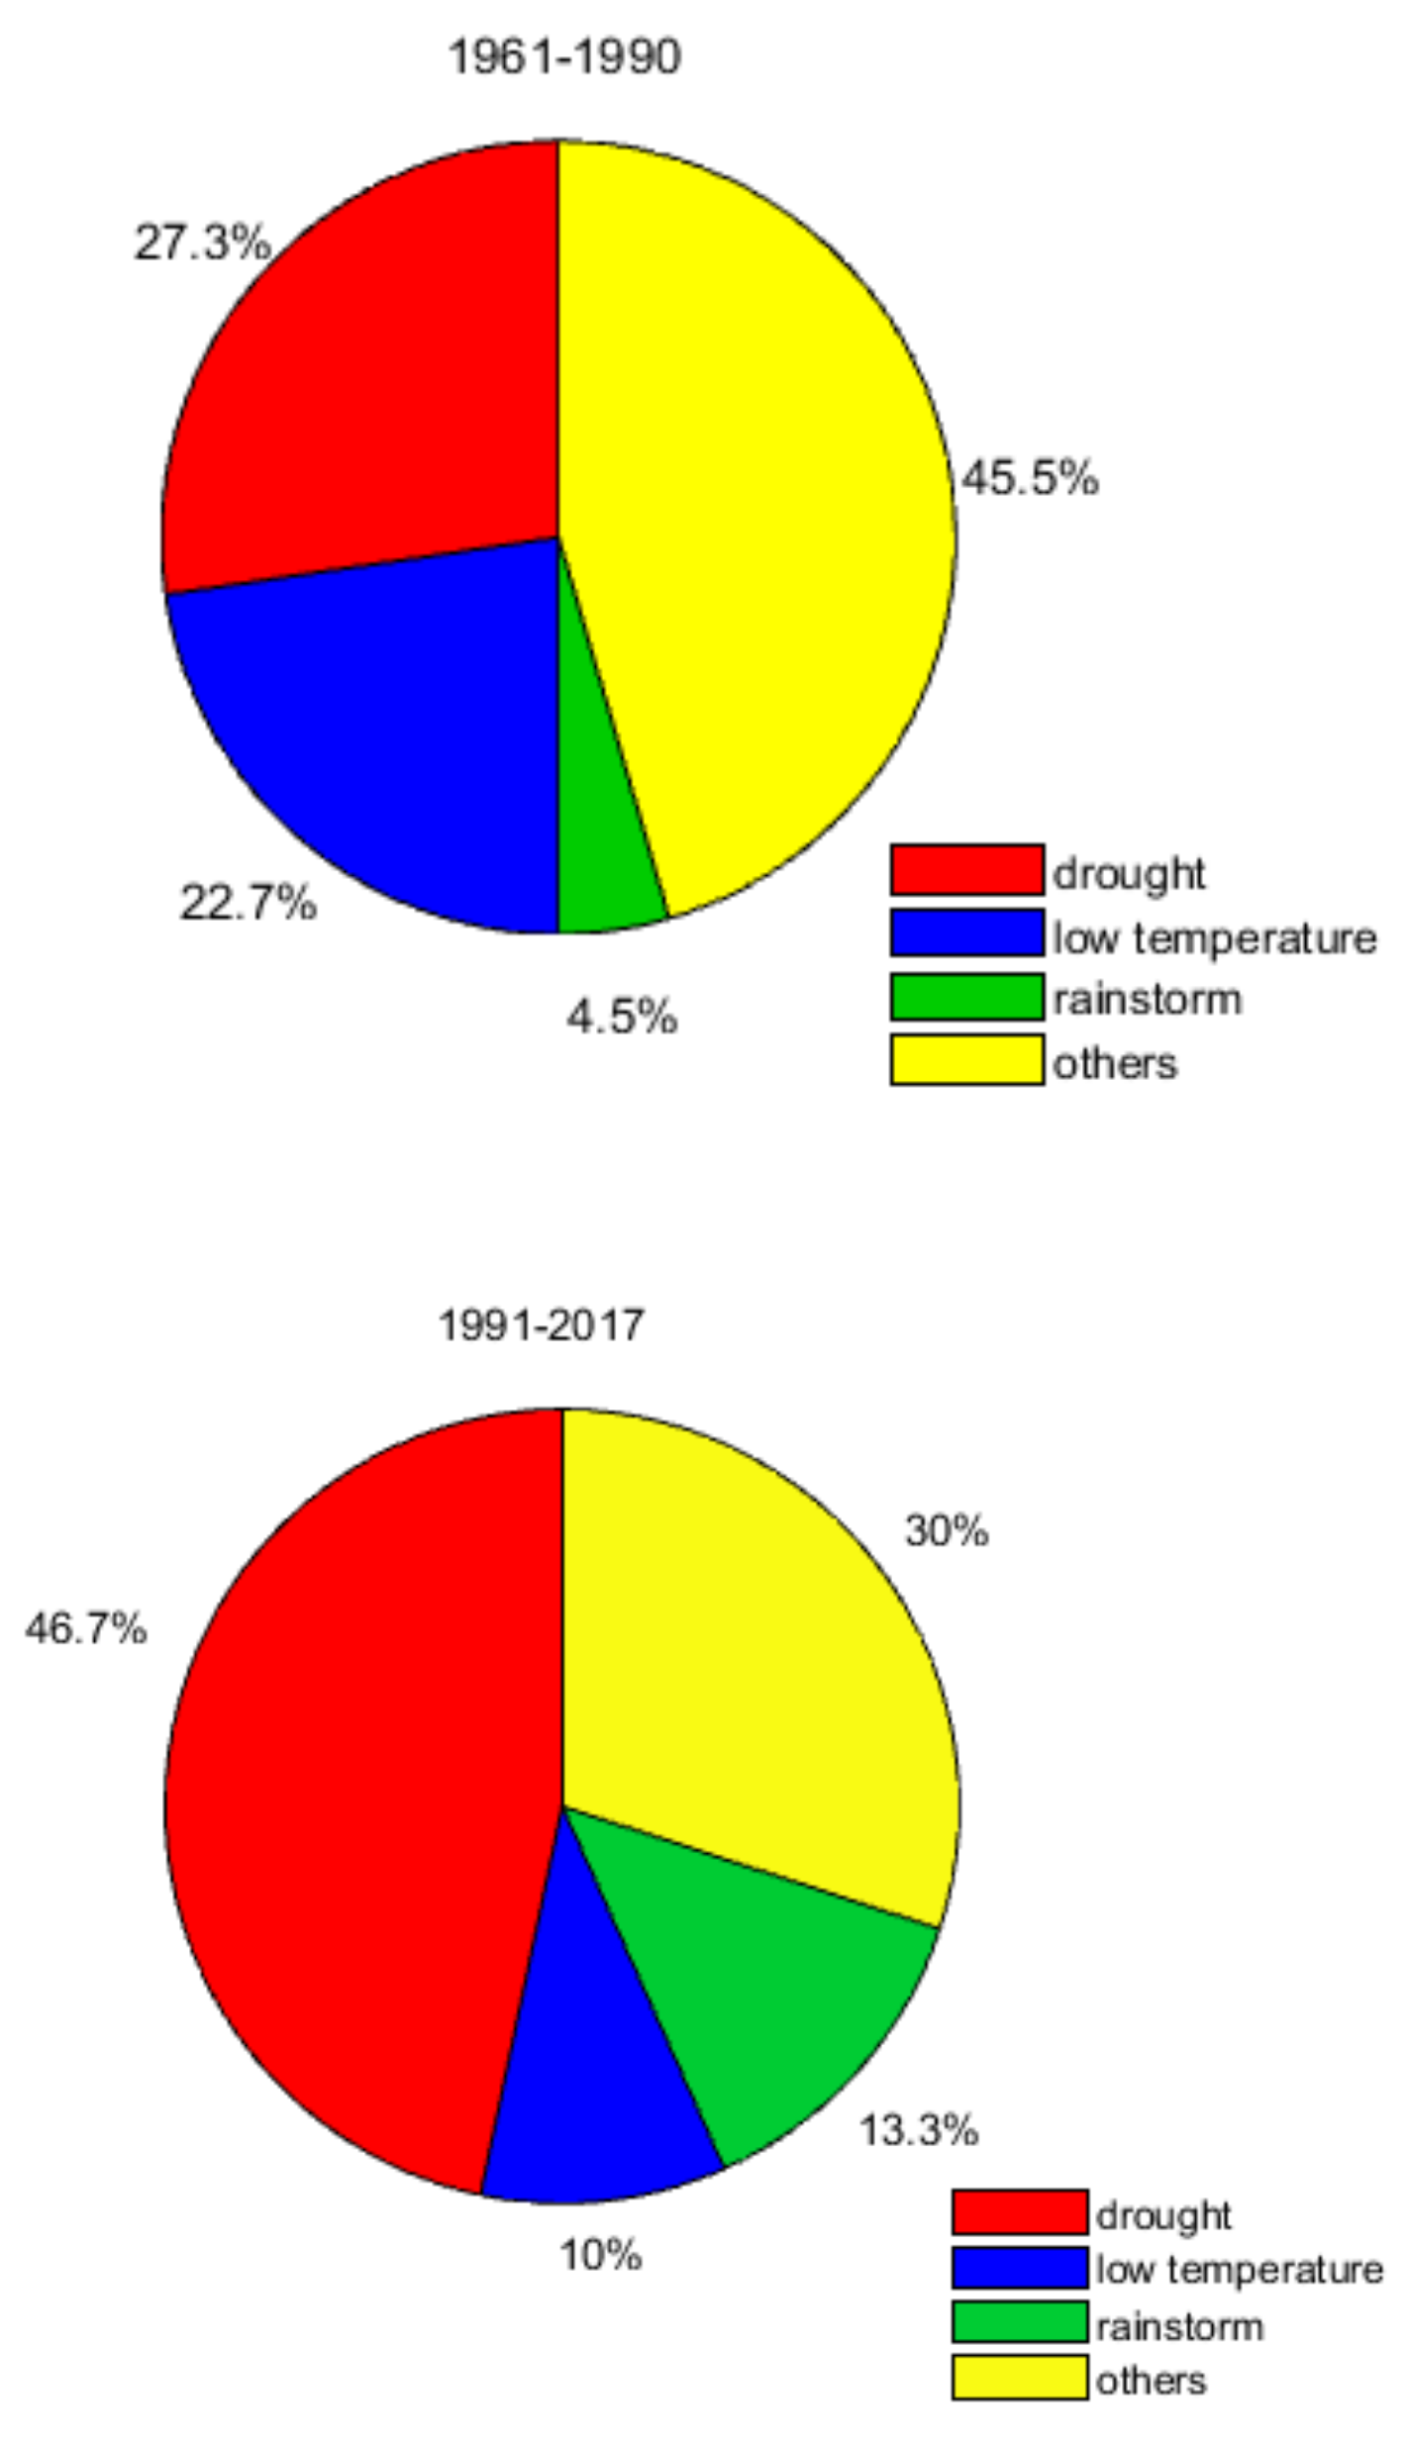
Associated with climate warming, the main reasons for maize yield losses changed during the analyses period. We found 53 cases of maize yield loss in the Heilongjiang, Jilin, and Liaoning provinces from 1961 to 2017 using equation 5. Between 1961 and 1990, 22.7% of the maize loss cases were caused by low temperatures, compared to 10% in 1991–2017 (Figure 6). Focusing on drought, 27.3% of maize yield loss cases could be attributed to drought in 1961–1990. This number increased to 46.7% in 1991–2017 (Figure 6). Only 4.5% of the maize yield loss cases were induced by heavy rainstorms during the 1961–1990 period, but this impact increased by almost three times to 13.3% in 1991–2017 (Figure 6).
4. Conclusions and Discussion
Using daily climate data and provincial agriculture data, the climatic factors related to provincial maize yield loss under global warming were investigated. The results showed that the GS temperature increased by 0.9 °C in 2008–2017 compared to 1961 to 1970 in Northeast China. This resulted in a reduced frequency of low temperature occurrences, leading to a decrease in maize yield loss caused by low temperatures by more than half from 1961–1990 (22.7%) to 1991–2017 (10%). However, associated with increasing temperatures and slight changes in precipitation, there was a 20% increase in GS drought, resulting in an almost doubling of maize loss cases attributed to this extreme (27.3% in 1961–1990 vs. 46.7% in 1991–2017). Despite a moderate decrease in annual as well as growing season precipitation, heavy rainstorm days during a sensitive time in the maize growth cycle (August and September) increased slightly. While lodging caused by rainstorms did not cause too much loss in the early period (4.5%), it increased by almost three times in the latter period (13.3%), clearly showing that the impact of this particular extreme has increased in the last few decades. It has been pointed out that mean climate changes have overall benefitted crop yields and increased consumable food calories in major crops in China [1], and Meng et al. [23] showed that increased temperatures represented 35% of the overall yield gains in Heilongjiang province of China through farmers’ adaptation. However, Song et al. [10] found that maize yield losses increased by 30% when drought increased by 100% in Northeast China. Global warming of 1.5 °C can lead to significant reductions in climatically suitable areas for summer maize cultivation in China [53].
Of the observed 53 cases of maize yield loss on provincial level from 1961 to 2017, at least 70% could be fully or partly attributed to climate hazards in NC, while the other 30% were due to plant diseases, insect pests, etc. Considering the three analyzed climate factors in this study, it is clear that their frequencies have changed as the climate has warmed. This means that the reasons for yield losses have also been changing. In the earlier three decades, drought and low temperature were the primary reasons for maize yield loss in NC, together accounting for almost 50% of the cases with equal contributions. However, in conjunction with global warming, the importance of drought increased so that it became the major maize-loss reason over the past three decades. Because irrigation infrastructure in NC is, in general, poor, and access to water was limited, maize growth is especially sensitive to drought in this region. Although maize is sensitive to drought throughout its development, yields are more severely affected during the filling stage (August–September), than in earlier development stages [54]. Moreover, due to global warming, there is a shift in the GS, so that the maturation occurs earlier [22]. The increased frequency of droughts in NC may be related to the weakening of the East Asian summer monsoon, but it is very likely that other factors, such as the Pacific Decadal Oscillation (PDO) also are of importance [55].
In addition to the impact of drought, it is evident that other extremes have to be taken into account when assessing the impact of global change on agricultural production. The almost threefold increase in yield loss to heavy rainstorms shows that this is an emerging risk. Regardless if wind felling or over-saturated soils cause the actual loss, this particular hazard needs more attention. The indirect impacts of climate change also need to be taken into consideration. Plant disease and/or insect pest outbreaks, both having severe negative impacts on yields, may also be related to adverse weather condition. For example, the plant disease (northern) leaf blight, which is caused by a fungus affecting the foliage, can have severe impacts on maize yields. Maize leaf blight usually appears when summers are wet [56]. Maize yield loss can be induced by the changes in weather events or the exogenous covariates (e.g., influence of insect pests). In this paper, we focused on those cases of maize yield loss when drought or low temperature or rainstorms happened at the same period, which indicated the yield loss was mainly or partly induced by climate events. For example, when maize yield loss happened, while no climate events happened at the same time, this indicated that the yield loss resulted from the exogenous covariates, and this case of yield loss was not studied in this paper. Of course, climate events could happen with the exogenous covariates (e.g., influence of insect pests) at the same time, and then the maize yield loss was induced by climate events and the exogenous covariates together.
In the future, if temperatures continue to increase, drought will likely become more serious in China [57], but there will also be more extreme precipitation events, such as heavy rainstorms [58]. It seems wise to breed maize varieties that are resistant to drought, rather than varieties resistant to low temperature, which has been chosen by farmers and governments in the past decades in NC. Moreover, it is important to make sure that the crops are planted in ways so that they are less sensitive to extreme winds and temperatures. Consequently, the results of this study are very important for farmers, plant breeders, and government policy makers in regard to developing strategies to adapt to climate change, producing more drought-resistant maize varieties, and taking measures to mitigate the negative impacts of drought on maize production in Northeast China under global warming.
Author Contributions
The contributions of Y.S., H.W.L. and G.Z. involved writing the manuscript; Y.L. and J.X. carried out data calculation. All authors have read and agreed to the published version of the manuscript.
Funding
This research received no external funding.
Acknowledgments
This work is supported by the National Key R&D Program of China (2018YFC1505605, 2018YFA0606103).
Conflicts of Interest
The authors declare no conflict of interest.
References
- Ray, D.K.; West, P.C.; Clark, M.; Gerber, J.S.; Prishchepov, A.V.; Chatterjee, S. Climate change has likely already affected global food production. PLoS ONE 2019, 14, e0217148. [Google Scholar] [CrossRef] [PubMed]
- Puma, M.J.; Bose, S.; Chon, S.Y.; Cook, B.I. Assessing the evolving fragility of the global food system. Environ. Res. Lett. 2015, 10, 24007. [Google Scholar] [CrossRef]
- Gaupp, F.; Hall, J.; Hochrainer-Stigler, S.; Dadson, S. Changing risks of simultaneous global breadbasket failure. Nat. Clim. Chang. 2019, 10, 54–57. [Google Scholar] [CrossRef]
- CSY (China Statistical Yearbook). China Statistical Yearbook, National Bureau of Statistics of China; China Statistics Press: Beijing, China, 2019. (In Chinese)
- FAO (Food and Agriculture Organization of the United Nations). 2020. Available online: http://www.fao.org/faostat/en/#data/QC (accessed on 14 September 2020).
- CSY (China Agriculture Yearbook). China Agriculture Yearbook; China Agriculture Press: Beijing, China, 2018. (In Chinese)
- Chen, C.; Wang, E.; Yu, Q.; Zhang, Y. Quantifying the effects of climate trends in the past 43 years (1961–2003) on crop growth and water demand in the North China Plain. Clim. Chang. 2009, 100, 559–578. [Google Scholar] [CrossRef]
- Zhao, J.; Yang, X.; Lv, S.; Liu, Z.; Wang, J. Variability of available climate resources and disaster risks for different maturity types of spring maize in Northeast China. Reg. Environ. Chang. 2013, 14, 17–26. [Google Scholar] [CrossRef]
- Liu, Z.; Yang, X. Maize yield gaps caused by non-controllable, agronomic, and socioeconomic factors in a changing climate of Northeast China. Sci. Total Environ. 2016, 541, 756–764. [Google Scholar] [CrossRef]
- Song, Y.L.; Wang, J.L. The Assessment of Influence of Agro-Meteorological Disasters on Agriculture under Climate Change in China; China Meteorological Press: Beijing, China, 2017. (In Chinese)
- IPCC (Intergovernmental Panel on Climate Change). Climate Change 2007: The Physical Science Basis. Contribution of Working Group I to the Fourth Assessment Report of the Intergovernmental Panel on Climate Change; Cambridge University Press: New York, NY, USA, 2007. [Google Scholar]
- IPCC (Intergovernmental Panel on Climate Change). Climate Change: Impacts, Adaptation and Vulnerability. Contribution of Working Group II to the Fourth Assessment Report of the Intergovernmental Panel on Climate Change; Cambridge University Press: Cambridge, UK, 2014. [Google Scholar]
- Song, Y.; Linderholm, H.W.; Chen, D.; Walther, A. Trends of the thermal growing season in China, 1951–2007. Int. J. Clim. 2009, 30, 33–43. [Google Scholar] [CrossRef]
- Ren, G.; Zhou, Y. Urbanization Effect on Trends of Extreme Temperature Indices of National Stations over Mainland China, 1961–2008. J. Clim. 2014, 27, 2340–2360. [Google Scholar] [CrossRef]
- NCC (National Climate Center). Monitoring Bulletin of Climate Change in China, National Climate Center of China Meteorological Administrator; Science Press: Beijing, China, 2016; p. 16. (In Chinese) [Google Scholar]
- Xu, Y.; Gao, X.; Giorgi, F.; Zhou, B.; Shi, Y.; Wu, J.; Zhang, Y. Projected Changes in Temperature and Precipitation Extremes over China as Measured by 50-yr Return Values and Periods Based on a CMIP5 Ensemble. Adv. Atmos. Sci. 2018, 35, 376–388. [Google Scholar] [CrossRef]
- Song, Y.L.; Achberger, C.; Linderholm, H.W. Rain-season trends in precipitation and their effect in different climate regions of China during 1961–2008. Environ. Res. Lett. 2011, 6, 034025. [Google Scholar] [CrossRef] [Green Version]
- Shi, J.; Cui, L.L.; Wang, J.B.; Du, H.Q.; Wen, K.M. Changes in the temperature and precipitation extremes in China during 1961–2015. Quatern. Int. 2019, 527, 64–78. [Google Scholar] [CrossRef]
- Chen, H.; Sun, J. Changes in Drought Characteristics over China Using the Standardized Precipitation Evapotranspiration Index. J. Clim. 2015, 28, 5430–5447. [Google Scholar] [CrossRef]
- Leng, G.; Tang, Q.; Rayburg, S. Climate change impacts on meteorological, agricultural and hydrological droughts in China. Glob. Planet. Chang. 2015, 126, 23–34. [Google Scholar] [CrossRef]
- Hallett, S.; Jones, R.J. Compilation of an accumulated temperature database for use in an environmental information system. Agric. For. Meteorol. 1993, 63, 21–34. [Google Scholar] [CrossRef]
- Chen, C.; Lei, C.; Deng, A.; Qian, C.; Hoogmoed, W.; Zhang, W. Will higher minimum temperatures increase corn production in Northeast China? An analysis of historical data over 1965–2008. Agric. For. Meteorol. 2011, 151, 1580–1588. [Google Scholar] [CrossRef]
- Meng, Q.; Hou, P.; Lobell, D.B.; Wang, H.; Cui, Z.; Zhang, F.; Chen, X. The benefits of recent warming for maize production in high latitude China. Clim. Chang. 2013, 122, 341–349. [Google Scholar] [CrossRef]
- Frich, P.; Alexander, L.; Della-Marta, P.; Gleason, B.; Haylock, M.; Tank, A.M.K.; Peterson, T. Observed coherent changes in climatic extremes during the second half of the twentieth century. Clim. Res. 2002, 19, 193–212. [Google Scholar] [CrossRef] [Green Version]
- Peñuelas, J.; Filella, I.; Comas, P. Changed plant and animal life cycles from 1952 to 2000 in the Mediterranean region. Glob. Chang. Boil. 2002, 8, 531–544. [Google Scholar] [CrossRef] [Green Version]
- Parmesan, C.; Yohe, G. A globally coherent fingerprint of climate change impacts across natural systems. Nature 2003, 421, 37–42. [Google Scholar] [CrossRef] [PubMed]
- Root, T.L.; Price, J.T.; Hall, K.R.; Schneider, S.H.; Rosenzweig, C.; Pounds, J.A. Fingerprints of global warming on wild animals and plants. Nature 2003, 421, 57–60. [Google Scholar] [CrossRef]
- Linderholm, H.W. Growing season changes in the last century. Agric. For. Meteorol. 2006, 137, 1–14. [Google Scholar] [CrossRef]
- Linderholm, H.W.; Walther, A.; Chen, D. Twentieth-century trends in the thermal growing season in the Greater Baltic Area. Clim. Chang. 2007, 87, 405–419. [Google Scholar] [CrossRef]
- Palmer. Meteorological Drought; Research Paper No. 45; US Weather Bureau: Washington, DC, USA, 1965.
- Tarpley, J.D.; Schneider, S.R.; Money, R.L. Global Vegetation Indices from the NOAA-7 Meteorological Satellite. J. Clim. Appl. Meteorol. 1984, 23, 491–494. [Google Scholar] [CrossRef]
- McKee, T.B.; Doesken, N.J.; Kleist, J. The relationship of drought frequency and duration to time scales. In Proceedings of the 8th Conference on Applied Climatology, American Meteorological Society, Boston, MA, USA, 17–22 January 1993; Volume 17, pp. 179–183. [Google Scholar]
- Wu, H.; Hayes, M.J.; Weiss, A.; Hu, Q. An evaluation of the Standardized Precipitation Index, the China-Z Index and the statistical Z-Score. Int. J. Clim. 2001, 21, 745–758. [Google Scholar] [CrossRef]
- Lyon, B. The strength of El Niño and the spatial extent of tropical drought. Geophys. Res. Lett. 2004, 31, 31. [Google Scholar] [CrossRef] [Green Version]
- Narasimhan, B.; Srinivasan, R. Development and evaluation of Soil Moisture Deficit Index (SMDI) and Evapotranspiration Deficit Index (ETDI) for agricultural drought monitoring. Agric. For. Meteorol. 2005, 133, 69–88. [Google Scholar] [CrossRef]
- Nalbantis, I.; Tsakiris, G. Assessment of Hydrological Drought Revisited. Water Resour. Manag. 2008, 23, 881–897. [Google Scholar] [CrossRef]
- Lu, E. Determining the start, duration, and strength of flood and drought with daily precipitation: Rationale. Geophys. Res. Lett. 2009, 36, L12707. [Google Scholar] [CrossRef]
- Vicente-Serrano, S.M.; Begueria, S.; Lopez-Moreno, J.I.; Angulo, M.; El Kenawy, A. A new global 0.5 degrees gridded dataset (1901–2006) of a multiscalar drought index: Comparison with current drought index datasets based on the palmer drought severity index. J. Hydrometeorol. 2010, 11, 1033–1043. [Google Scholar] [CrossRef] [Green Version]
- Anderson, M.C.; Hain, C.; Wardlow, B.; Pimstein, A.; Mecikalski, J.R.; Kustas, W. Evaluation of Drought Indices Based on Thermal Remote Sensing of Evapotranspiration over the Continental United States. J. Clim. 2011, 24, 2025–2044. [Google Scholar] [CrossRef]
- Woli, P.; Jones, J.W.; Ingram, K.T.; Fraisse, C.W. Agricultural Reference Index for Drought (ARID). Agron. J. 2012, 104, 287–300. [Google Scholar] [CrossRef]
- Hao, Z.; AghaKouchak, A. Multivariate Standardized Drought Index: A parametric multi-index model. Adv. Water Resour. 2013, 57, 12–18. [Google Scholar] [CrossRef] [Green Version]
- Beguería, S.; Vicente-Serrano, S.M.; Reig, F.; Latorre, B. Standardized precipitation evapotranspiration index (SPEI) revisited: Parameter fitting, evapotranspiration models, tools, datasets and drought monitoring. Int. J. Clim. 2013, 34, 3001–3023. [Google Scholar] [CrossRef] [Green Version]
- Lu, E.; Cai, W.; Jiang, Z.; Zhang, Q.; Zhang, C.; Higgins, R.W.; Halpert, M.S. The day-to-day monitoring of the 2011 severe drought in China. Clim. Dyn. 2013, 43, 1–9. [Google Scholar] [CrossRef]
- Wang, R.; Zhang, J.; Wang, C.; Guo, E. Characteristic Analysis of Droughts and Waterlogging Events for Maize Based on a New Comprehensive Index through Coupling of Multisource Data in Midwestern Jilin Province, China. Remote Sens. 2019, 12, 60. [Google Scholar] [CrossRef] [Green Version]
- Zhao, J.; Guo, J.; Mu, J. Exploring the relationships between climatic variables and climate-induced yield of spring maize in Northeast China. Agric. Ecosyst. Environ. 2015, 207, 79–90. [Google Scholar] [CrossRef]
- Yan, M.H.; Liu, X.T.; Zhang, W.; Li, X.J.; Liu, S. Spatio-temporal changes of ≥10 °C accumulated temperature in northeastern China since 1961. Chin. Geogr. Sci. 2011, 21, 17–26. [Google Scholar] [CrossRef]
- Yang, X.; Fei, J.; Huang, X.; Cheng, X.; Carvalho, L.M.V.; He, H. Characteristics of Mesoscale Convective Systems over China and Its Vicinity Using Geostationary Satellite FY2. J. Clim. 2015, 28, 4890–4907. [Google Scholar] [CrossRef]
- Diaz-Nieto, J.; Lerner, D.; Saul, A.J.; Blanksby, J. GIS Water-Balance Approach to Support Surface Water Flood-Risk Management. J. Hydrol. Eng. 2012, 17, 55–67. [Google Scholar] [CrossRef] [Green Version]
- Adnan, M.S.G.; Haque, A.; Hall, J.W. Have coastal embankments reduced flooding in Bangladesh? Sci. Total Environ. 2019, 682, 405–416. [Google Scholar] [CrossRef]
- Singh, R.K.; Prasad, V.H.; Bhatt, C.M. Remote sensing and GIS approach for assessment of the water balance of a watershed/Evaluation par télédétection et SIG du bilan hydrologique d’un bassin versant. Hydrol. Sci. J. 2004, 49, 131–141. [Google Scholar] [CrossRef]
- Yang, F.Y.; Zheng, Q.H.; Luo, J.M.; Li, W.K. Practical Agrometeorological Indicators; China Meteorological Press: Beijing, China, 2015.
- CCIA (China Climate Impact Assessment). China Climate Impact Assessment. National Climate Center; China Meteorological Press: Beijing, China, 1994. (In Chinese)
- He, Q.; Zhou, G.; Lü, X.; Zhou, M. Climatic suitability and spatial distribution for summer maize cultivation in China at 1.5 and 2.0 °C global warming. Sci. Bull. 2019, 64, 690–697. [Google Scholar] [CrossRef] [Green Version]
- Huang, Y.; Li, J.; Wang, Y.; Zhang, X.Y.; Li, Y.H.; Jiao, M.; Zhou, B.; Wang, H.R. Impact Simulation of Drought on Maize Growth and Yield in Different Growth Stages. J. Agric. Catastrophol. 2019, 9, 47–49. (In Chinese) [Google Scholar] [CrossRef]
- Sun, L.; Shen, B.; Sui, B.; Huang, B. The influences of East Asian Monsoon on summer precipitation in Northeast China. Clim. Dyn. 2016, 48, 1647–1659. [Google Scholar] [CrossRef]
- Yu, H.J. Prevention and control of common diseases in corn planting process. Jilin Agric. 2016, 8, 96. (In Chinese) [Google Scholar]
- Su, B.; Huang, J.; Fischer, T.; Wang, Y.; Kundzewicz, Z.W.; Zhai, J.; Sun, H.; Wang, A.; Zeng, X.; Wang, G.; et al. Drought losses in China might double between the 1.5 °C and 2.0 °C warming. Proc. Natl. Acad. Sci. USA 2018, 115, 10600–10605. [Google Scholar] [CrossRef] [PubMed] [Green Version]
- Zhang, W.; Zhou, T. Increasing impacts from extreme precipitation on population over China with global warming. Sci. Bull. 2020, 65, 243–252. [Google Scholar] [CrossRef] [Green Version]
Figure 1.
Map of Northeast China showing its three provinces (from south to north), Liaoning, Jilin and Heilongjiang, and the distribution of weather stations.
Figure 1.
Map of Northeast China showing its three provinces (from south to north), Liaoning, Jilin and Heilongjiang, and the distribution of weather stations.

Figure 2.
Change in accumulated temperature (>10 °C) over Northeast China from 1961 to 2017.

Figure 3.
Relationship between the WAP drought index and observed relative soil moisture.

Figure 4.
Change in drought index (AD) during the maize growing season (May–September) in Northeast China from 1961 to 2017.
Figure 4.
Change in drought index (AD) during the maize growing season (May–September) in Northeast China from 1961 to 2017.

Figure 5.
Relationship between maize yield loss rate and drought index (AD), low temperature, and rainstorm days in Heilongjiang, Jilin, and Liaoning provinces from 1961 to2017.
Figure 5.
Relationship between maize yield loss rate and drought index (AD), low temperature, and rainstorm days in Heilongjiang, Jilin, and Liaoning provinces from 1961 to2017.


Figure 6.
The percentage of study cases with maize yield loss attributable to drought, low temperature, heavy rainstorms, and other reasons during the 1961–1990 and 1991–2017 periods in Northeast China.
Figure 6.
The percentage of study cases with maize yield loss attributable to drought, low temperature, heavy rainstorms, and other reasons during the 1961–1990 and 1991–2017 periods in Northeast China.


Table 1.
The maximum rainstorm days (year in the parentheses) in August and September during different decade over Heilongjiang Jilin and Liaoning province.
Table 1.
The maximum rainstorm days (year in the parentheses) in August and September during different decade over Heilongjiang Jilin and Liaoning province.
| Province | 1961–1970 | 1971–1980 | 1981–1990 | 1991–2000 | 2001–2010 | 2011–2017 |
|---|---|---|---|---|---|---|
| Heilongjiang | 0.5 (1965) | 0.4 (1974) | 0.7 (1985) | 0.5 (1998) | 0.4 (2003) | 0.6 (2017) |
| Jilin | 0.8 (1961) | 0.6 (1973) | 0.7 (1986) | 1.0 (1994) | 0.9 (2010) | 0.8 (2012) |
| Liaoning | 1.8 (1969) | 1.4 (1974) | 1.9 (1985) | 2.4 (1994) | 2.3 (2010) | 1.4 (2012) |
Table 2.
The information on cases with largest maize yield loss and meteorological hazards over Northeast China from 1961 to 2017.
Table 2.
The information on cases with largest maize yield loss and meteorological hazards over Northeast China from 1961 to 2017.
| Province | Year | Yield Loss Rate (%) | Drought Index (AD) during May–September | Low Temperature Index during May–September | Rainstorm Days in August and September |
|---|---|---|---|---|---|
| Heilongjiang | 1969 | −32% | 10.2 | −249.3 | 0.3 |
| Heilongjiang | 2001 | −16.7% | 30.8 | 47 | 0 |
| Heilongjiang | 2007 | −18.1% | 34.4 | 90.5 | 0 |
| Jilin | 1969 | −15.3% | 4.9 | −205 | 0.6 |
| Jilin | 2000 | −32.9% | 24.7 | 229.4 | 0.8 |
| Jilin | 2001 | −22.1% | 24 | 99.8 | 0 |
| Liaoning | 1994 | −29.5% | 7 | 103.2 | 2.5 |
| Liaoning | 2000 | −31.5% | 40.9 | 175.8 | 0 |
| Liaoning | 2014 | −23.8% | 36.8 | −67.8 | 0 |
© 2020 by the authors. Licensee MDPI, Basel, Switzerland. This article is an open access article distributed under the terms and conditions of the Creative Commons Attribution (CC BY) license (http://creativecommons.org/licenses/by/4.0/).
Share and Cite
MDPI and ACS Style
Song, Y.; Linderholm, H.W.; Luo, Y.; Xu, J.; Zhou, G. Climatic Causes of Maize Production Loss under Global Warming in Northeast China. Sustainability 2020, 12, 7829. https://0-doi-org.brum.beds.ac.uk/10.3390/su12187829
AMA Style
Song Y, Linderholm HW, Luo Y, Xu J, Zhou G. Climatic Causes of Maize Production Loss under Global Warming in Northeast China. Sustainability. 2020; 12(18):7829. https://0-doi-org.brum.beds.ac.uk/10.3390/su12187829
Chicago/Turabian StyleSong, Yanling, Hans W. Linderholm, Yi Luo, Jinxia Xu, and Guangsheng Zhou. 2020. "Climatic Causes of Maize Production Loss under Global Warming in Northeast China" Sustainability 12, no. 18: 7829. https://0-doi-org.brum.beds.ac.uk/10.3390/su12187829
Note that from the first issue of 2016, this journal uses article numbers instead of page numbers. See further details here.