A Practical Methodology for the Design and Cost Estimation of Solar Tower Power Plants


1
Solar Energy Research Center (SERC-Chile), Av. Tupper 2007 Piso 4, Santiago 8370451, Chile
2
Faculty of Engineering, University of Concepcion, Víctor Lamas 1290, Concepción, Chile
*
Author to whom correspondence should be addressed.
Sustainability 2020, 12(20), 8708; https://0-doi-org.brum.beds.ac.uk/10.3390/su12208708
Submission received: 11 September 2020
/
Revised: 14 October 2020
/
Accepted: 15 October 2020
/
Published: 20 October 2020
(This article belongs to the Special Issue Advances in Solar Thermal Energy)
Abstract
:Concerns over the environmental influence of greenhouse gas (GHG) emissions have encouraged researchers to develop alternative power technologies. Among the most promising, environmentally friendly power technologies for large-scale applications are solar power tower plants. The implementation of this technology calls for practical modeling and simulation tools to both size the plant and investigate the scale effect on its economic indices. This paper proposes a methodology to design the main components of solar power tower plants and to estimate the specific investment costs and the economic indices. The design approach used in this study was successfully validated through a comparison with the design data of two operational commercial power tower plants; namely, Gemasolar (medium-scale plant of 19.9 MWe) and Crescent Dunes (large-scale plant of 110 MWe). The average uncertainty in the design of a fully operational power tower plant is 8.75%. A cost estimation showed the strong influence of the size of the plant on the investment costs, as well as on the economic indices, including payback period, internal rate of return, total life charge costs, and levelized cost of electricity. As an illustrative example, the methodology was applied to design six solar power tower plants in the range of 10–100 MWe for integration into mining processes in Chile. The results show that the levelized cost of electricity decreases from 156 USD/MWhe for the case of a 10-MWe plant to 131 USD/MWhe for the case of a 100-MWe plant. The internal rate of return of plants included in the analyses ranges from 0.77% (for the 10-MWe case) to 2.37% (for 100-MWe case). Consequently, the simple payback ranges from 16 years (for the 100-MWe case) to 19 years (for the 10-MWe case). The sensitivity analysis shows that the size of the solar receiver heavily depends on the allowable heat flux. The degradation rate and the discount rate have a strong influence on economic indices. In addition, both the operation and the deprecation period, as well as the price of electricity, have a crucial impact on the viability of a solar power tower plant. The proposed methodology has great potential to provide key information for prospective analyses for the implementation of power tower technologies to satisfy clean energy needs under a wide range of conditions.
1. Introduction
Fossil fuel reserves in the world are rapidly decreasing, and so it is important to tap the abundant solar energy source to both meet future energy demands and reduce greenhouse gas (GHG) emissions. Concentrating Solar Power (CSP) alternatives are among the most promising alternatives to fossil fuels because they rely on conventional technology and are relatively easy to scale up [1]. Of all CSP technologies available today, the solar power tower (PT) is expected to both significantly reduce its cost and improve its efficiency over time [2,3]. This technology has several potential advantages over other CSP technologies (parabolic trough, linear Fresnel, and solar dish), including higher operating temperatures, which allow for greater efficiency of the thermodynamic cycle, low water consumption, and high-energy-density storage [3]. The design of these power plants poses considerable challenges given the complexity of the mathematical models required in both optical and thermal analyses of their main components. To speed up the growth in the installed capacity of PT plants and the associated cost reductions, practical design procedures and reliable data on investment costs are required.
A typical PT plant consists of a solar field (SF), known as a heliostat field, a solar receiver (SR), a thermal energy storage (TES) unit, and a power block (PB). To simplify the analysis of the PT plants, Jebamalai [4] proposed a methodology to design SRs, including external and cavity receivers. Srilakshmi et al. [5,6] presented a procedure to determine the preliminary tower height and the reflective area of the SF. Khosravi et al. [7] proposed a design and optimization approach by combining adaptive neuro-fuzzy inference with a genetic algorithm and teaching–learning-based optimization algorithm. Yan Luo et al. proposed optimization techniques to find the optimum design of PT plants based on successive response surface methodology [8] and the “Sobol’-Simulated Annealing” algorithm [9]. Albarbar and Arar [10] proposed optimal designs for a medium-scale PT plant. The authors investigated the effects of the receiver’s geometric parameters on the performance of medium-scale PT plants.
Indeed, the most complex part in the design of PT plants is the heliostat field. Thus, several methods have been proposed to layout and estimate its optical performance. Siala and Elayeb [11] proposed a graphical method by dividing the field into certain groups of heliostats. Sanchez and Romero [12] proposed a method to layout the field based on the yearly direct solar radiation. Wei et al. [13] coupled Monte Carlo ray tracing with the parametric search algorithm to optimize the heliostat field layout. Noone et al. [14] proposed a discretization approach to layout the heliostat field. Pitz-Paal et al. [15] coupled a genetic algorithm with the Nelder–Mead algorithm to design the heliostat field. M. Besarati and Goswami [16] developed a quick method to design the SF based on minimum shadowing and blocking. Belhomme et al. [17] developed an approach to design the SF by processing highly resolved heliostat geometry data containing the local normal vectors of the mirror surface of a heliostat. Collado et al. [18] proposed the division of the SF into several regions to get an accurate heliostat field design.
To facilitate the design of the heliostat field, numerous codes have been developed. DELSOL3 [19], SOLTRACE [20], MUEEN [19], SENSOL [19], CAMPO [21], Solstice [22], SolarPILOT [23], HFLD, and CRS4-2 are widely used, among others. Some of these codes are useful to investigate the optical performance of the solar field, but they require the geometric design parameters of the receiver and the tower as input data. For instance, SolarPILOT requires the nominal thermal power of the SR, its geometric dimensions, and the tower height to design the heliostat field. In case the input data are just estimates, such as in [24], the design parameters of a PT plant may be highly uncertain, thus jeopardizing the viability of a given project. This is also true for the case of Campo and many other codes.
This paper aims to fill a gap in the design and cost estimation of PT plants because there is a lack of cost data accounting for the scale effect. In addition, to the best of the authors’ knowledge, there is no published method to calculate the design data required by some software, such as SolarPilot and Campo. The rapid growth in the installed capacity of PT technology and the associated cost reductions require practical tools to calculate design parameters, investment costs, and economic indices that take into account the influence of technical and financial parameters.
We propose a practical methodology to design and to estimate the costs of PT plants. The methodology is useful to estimate the input design data required by the codes cited above. The design approach used allows for calculation of the geometric parameters of the main parts of the PT plants from a minimum set of input data (nominal power production, geographical parameters of the site, and solar radiation data). The cost estimation approach takes into account the technical and financial parameters to estimate the investment costs and economic indices. The next section describes the proposed methodology. The validation of the methodology is described in Section 3. Section 4 presents a case study on the use of the methodology to design and to determine the economic indices of PT plants. Section 5 presents a sensitivity analysis to show the influence of the technical and financial parameters on the design and economic indices of PT plants. The last section summarizes the most important results.
2. Methodology and Modeling
2.1. Methodology
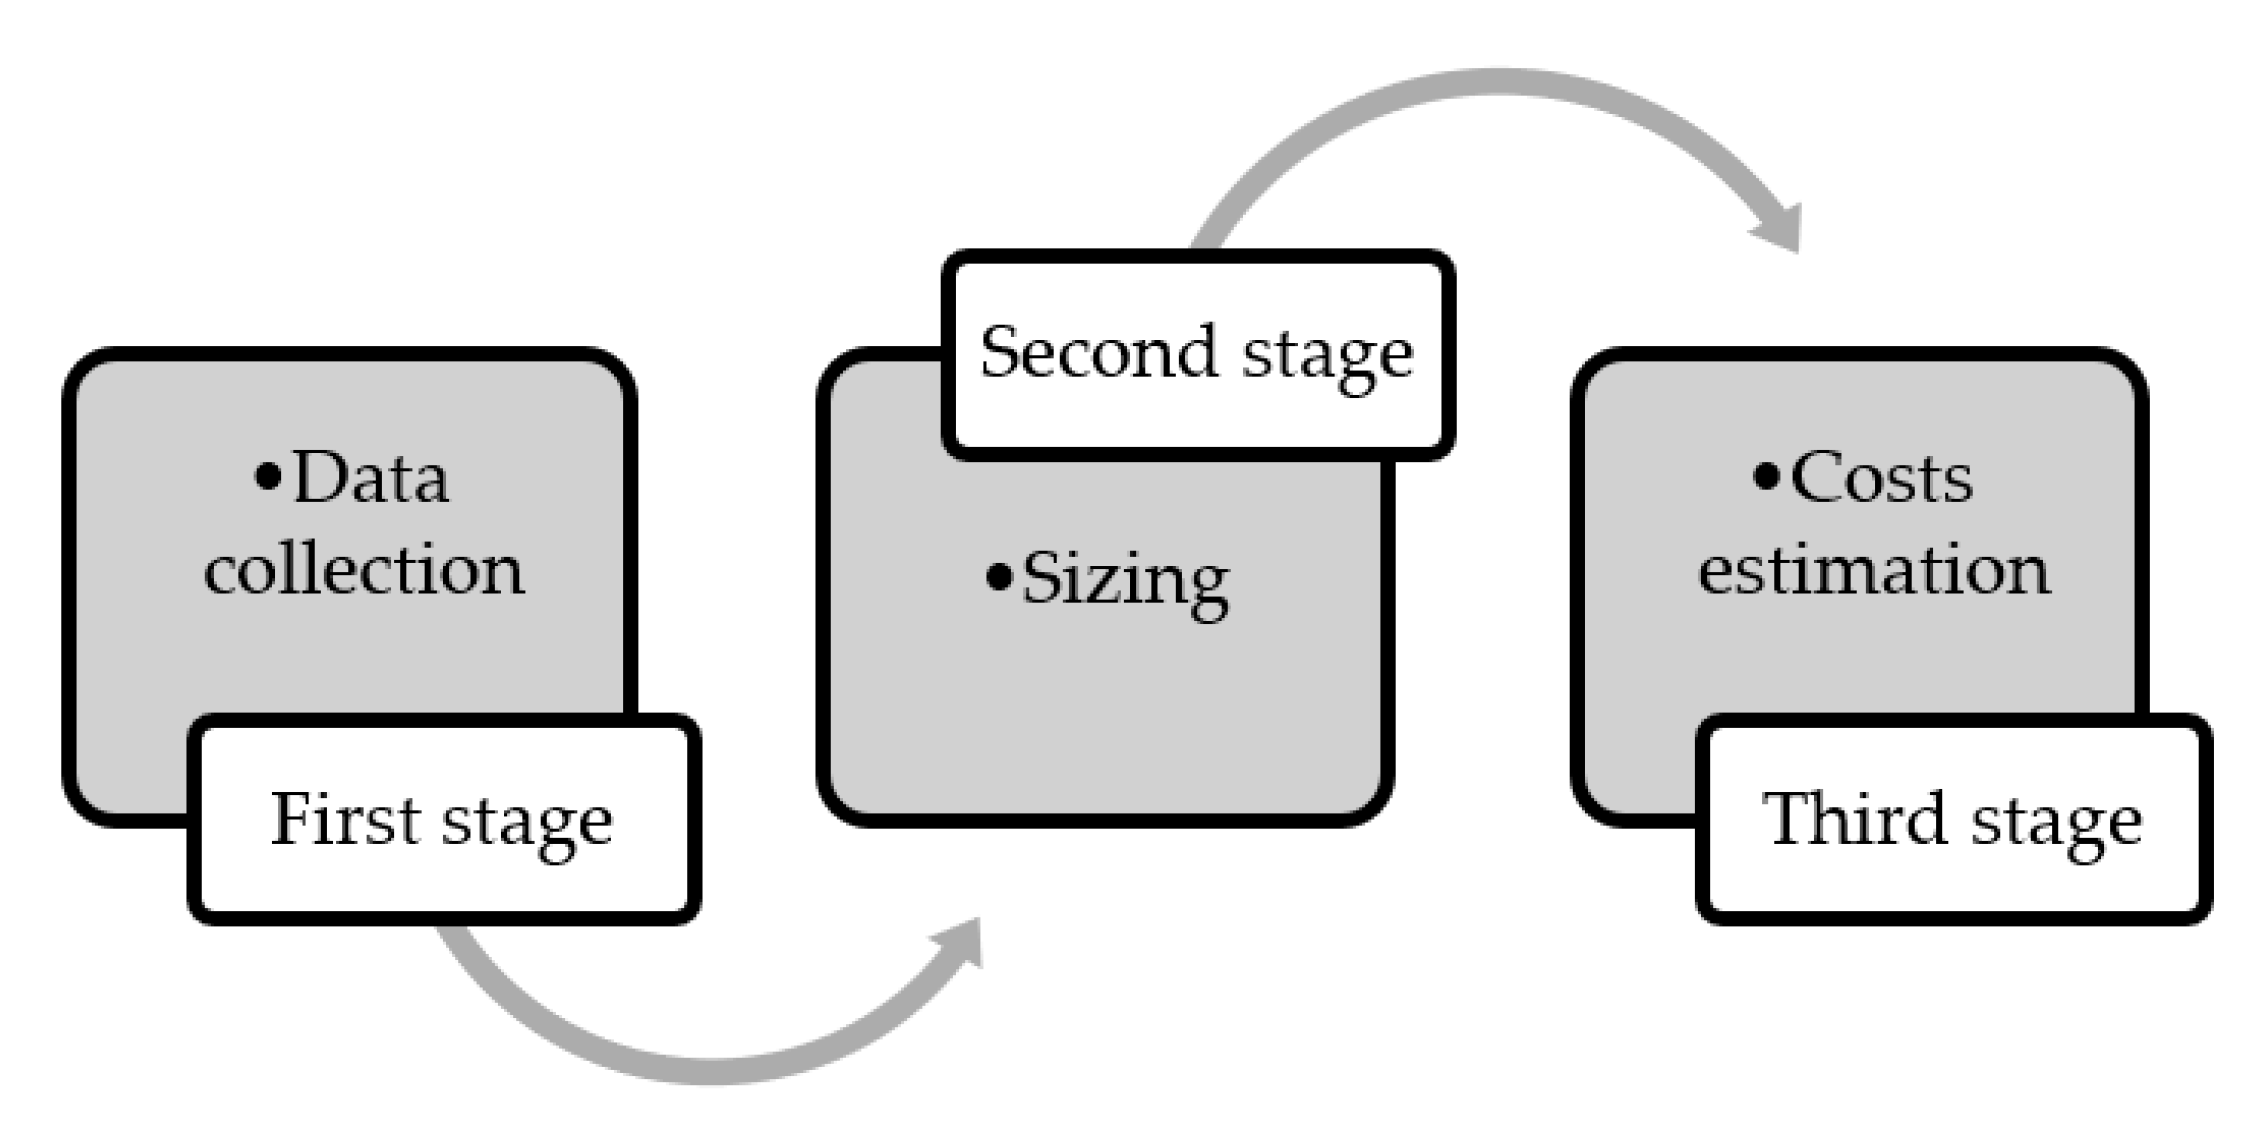
The proposed methodology for the design and cost estimation of PT plants is highlighted in Figure 1. It includes three main stages: pre-design, design, and cost estimation.
The purpose of the first stage is to select:
- nominal power of the PT plant,
- location, and
- design point parameters.
The second stage entails the calculation of the design parameters of the main parts of the PT plant, including:
- nominal power, height, and SR diameter,
- tower height,
- size of thermal energy storage, and
- SF reflective area.
The third stage entails:
- estimating investment costs considering the scale effect and
- calculating economic indices.
The next sub-sections describe the approaches used in the design and cost estimation.
2.2. Design Approach
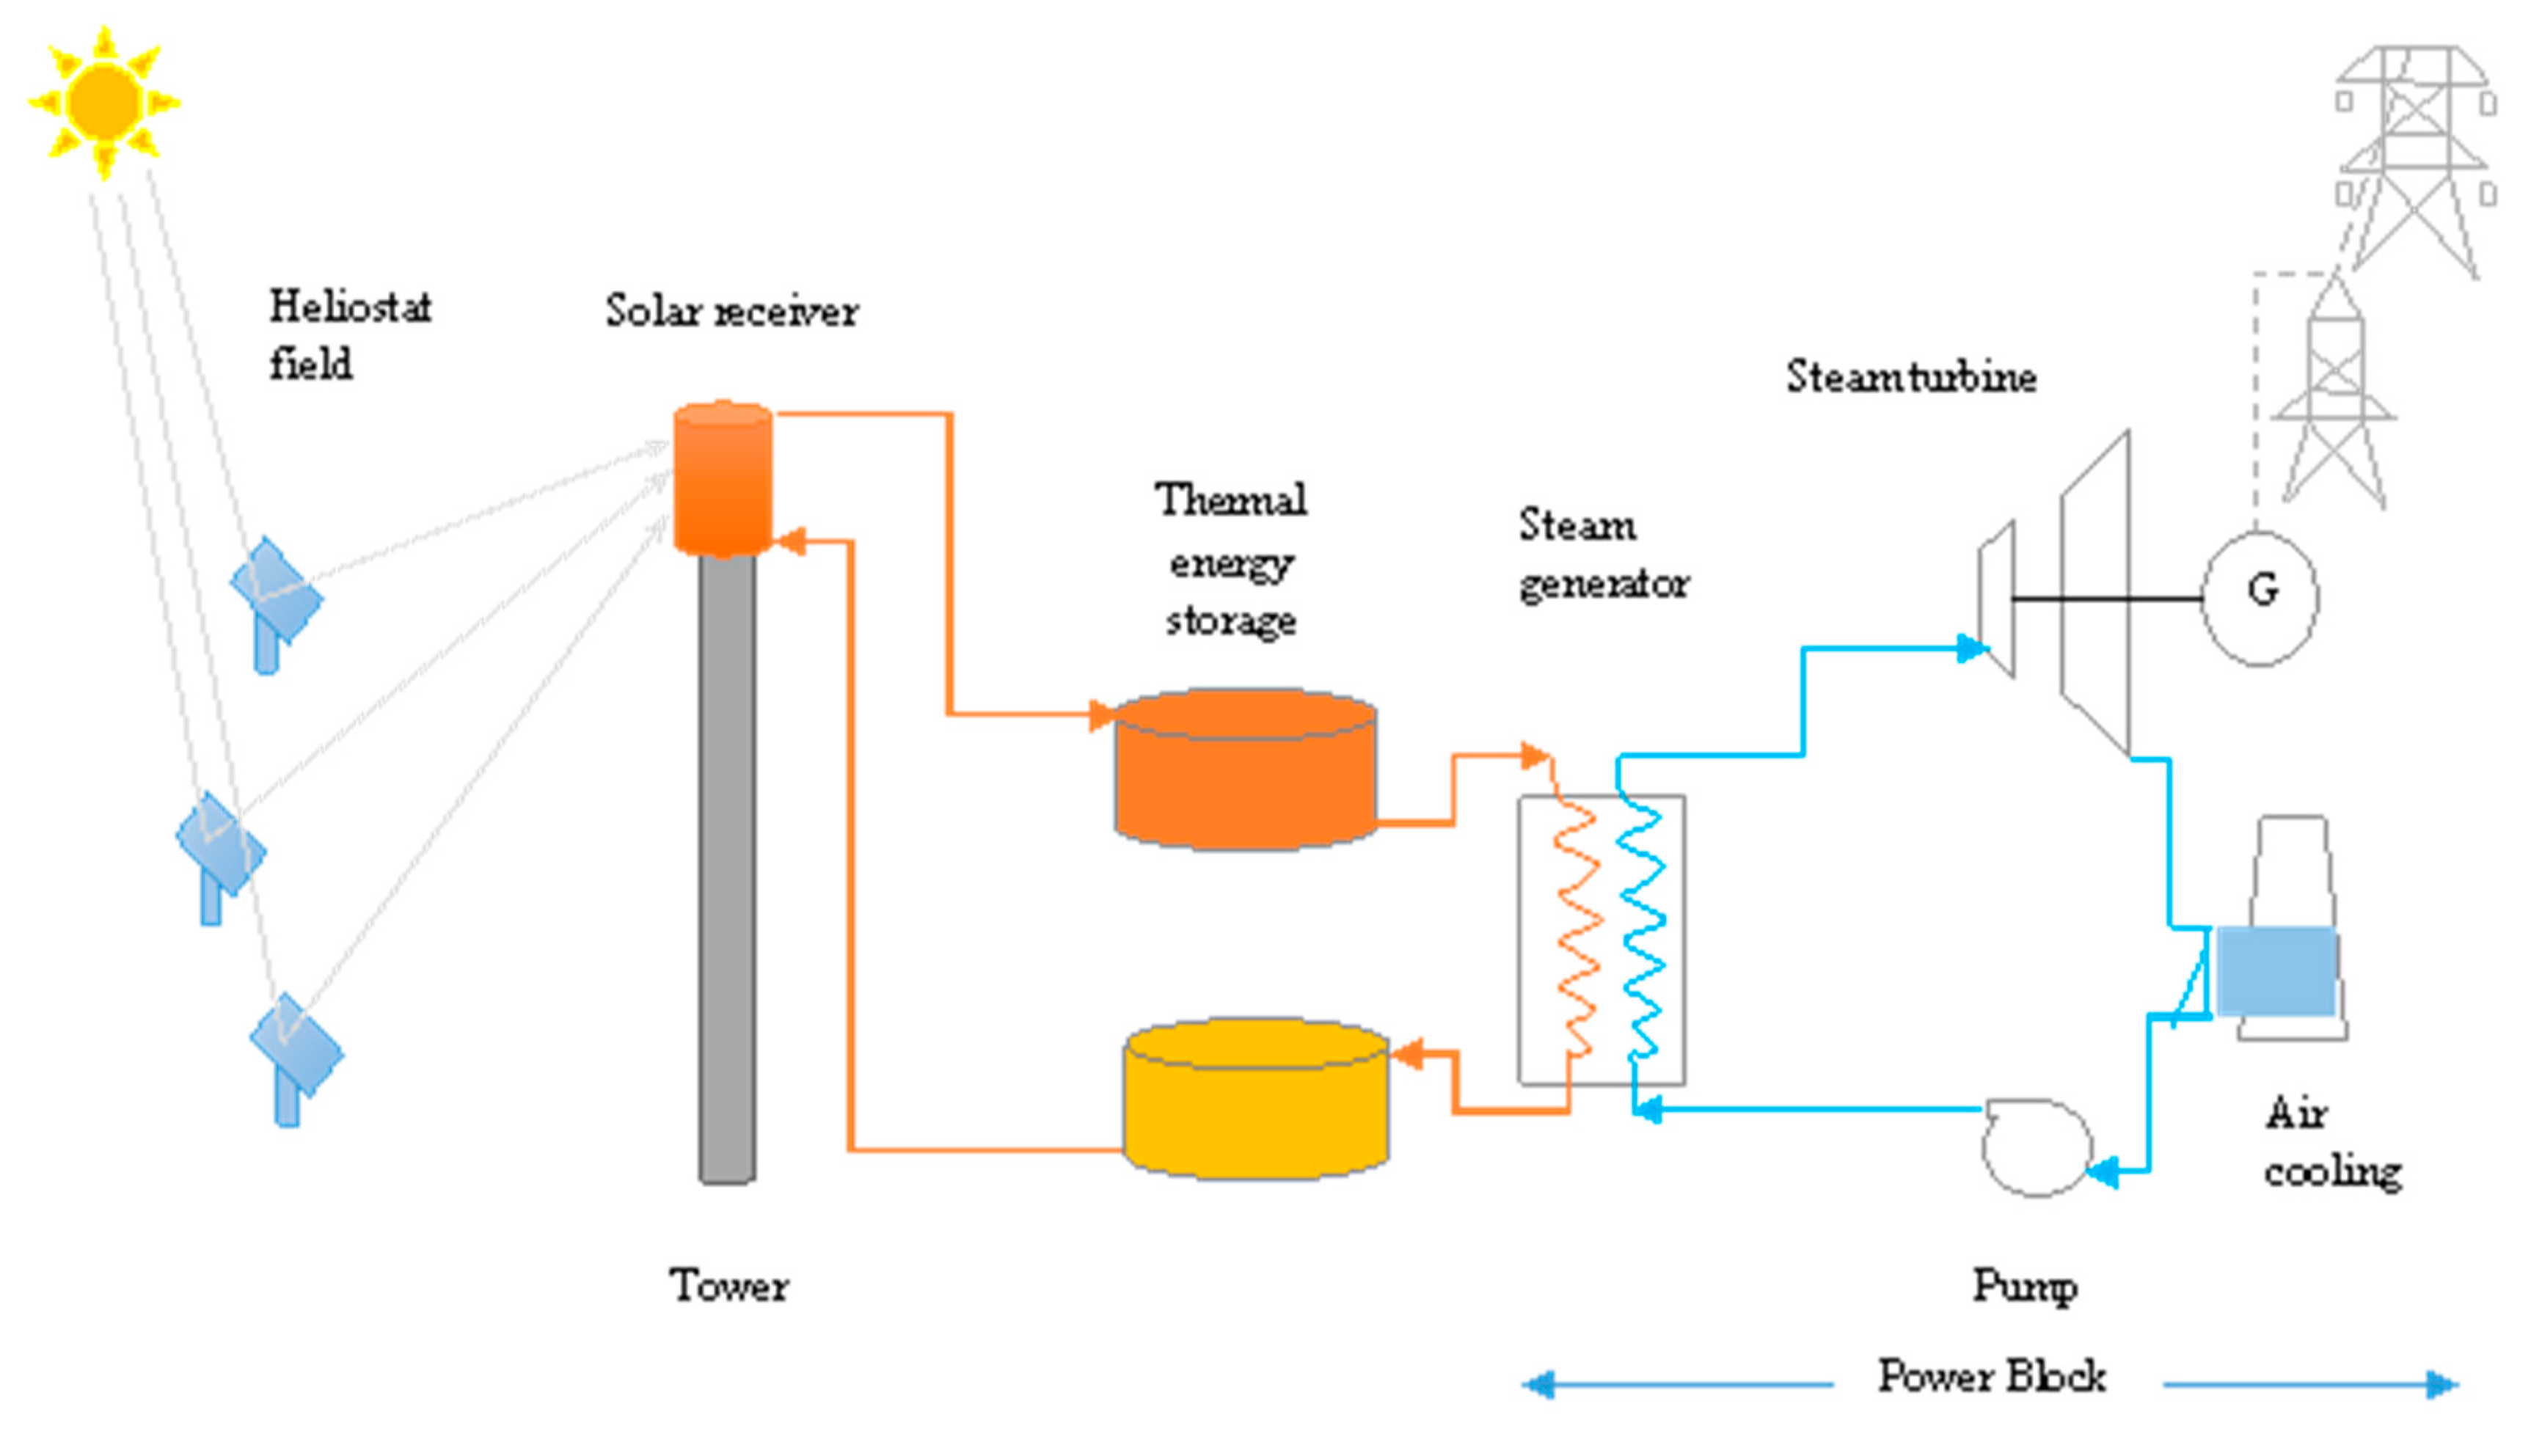
The configuration of a typical PT plant is depicted in Figure 2. It consists of a SF, a SR, a tower, a thermal energy storage (TES) unit, and a power block (PB). The reflective area of the SF collects direct normal irradiance (DNI) into the SR, which is located at the top of the tower. The SR absorbs the collected DNI and converts it into useful heat. A heat transfer fluid (HTF), typically molten salt, is used to transport the useful heat to the TES and then to the PB to produce electricity.
In this case, it is assumed that a PT plant is needed to produce an amount of energy EPB_nom during the nominal day. The nominal day is the day that includes the design point. The design point is commonly selected during the summer solstice to minimize energy losses (energy losses by devocalizing a part of the solar field when DNI is high or when the storage is full). One of the key design parameters is the nominal direct normal irradiance (DNInom). During the nominal day, the equivalent hours with DNI equal to DNInom can be expressed as follows:
where Ddaily_nom is the nominal daily direct insolation.
We define the ratio (Rh) as follows:
where Nhours_TES is the number of hours of storage. A typical value of Nhours_TES is the difference between the number of hours of the day and the number of equivalent hours. It can also be given input data to meet specific objectives.
The size of the TES that meets the nominal daily demand can be calculated as:
where ETES_nom is the capacity of the TES. ηTES_nom and ηPB_nom are the nominal efficiencies of the TES and the PB, respectively.
The nominal power of the receiver is a function of the solar multiple (SM) and the nominal thermal power of the PB [4].
where QPB_nom is the nominal thermal power of the PB.
The nominal thermal power of the PB is a function of its efficiency.
The incident thermal power on the SR is calculated as a function of its nominal efficiency:
where PSR_incident_nom and ηSR_nom are the nominal incident thermal power and the nominal efficiency of the receiver, respectively.
Current commercial PT plants commonly use molten salt external cylindrical SRs [25]. Among the most important design parameters of the PT plants are the geometry of the SR and the tower height. SR sizing must account for the technical limits associated with the allowable power flux of its material [4,26]. For stainless steel molten salt SRs, the allowable peak flux is 830 kW/m2 [26]. For safety purposes, the SRs are designed based on the average allowable flux, which depends on the peak-to-average flux ratio [26]. The peak-to-average flux ratio considered in this study is derived from the default example of the SolarPILOT software (1.622) [23]. The absorptive area of the SR is the ratio of the total incident thermal power and the average allowable flux [4]:
The geometry of the SR can be defined based on the height (HSR) to diameter (DSR) ratio, known as the aspect ratio (AR). For external SRs, the AR ranges from 1 to 2 [26].
The analysis of the data of commercial PT plants indicates no definite trend in the selection of tower height [4,5,6]. Thus, the present study considers a correlation derived from the data of commercial PT plants [4].
The area of the heliostat field (ASF) is obtained using the following expression:
where ηSF_nom is the nominal optical efficiency of the heliostat field.
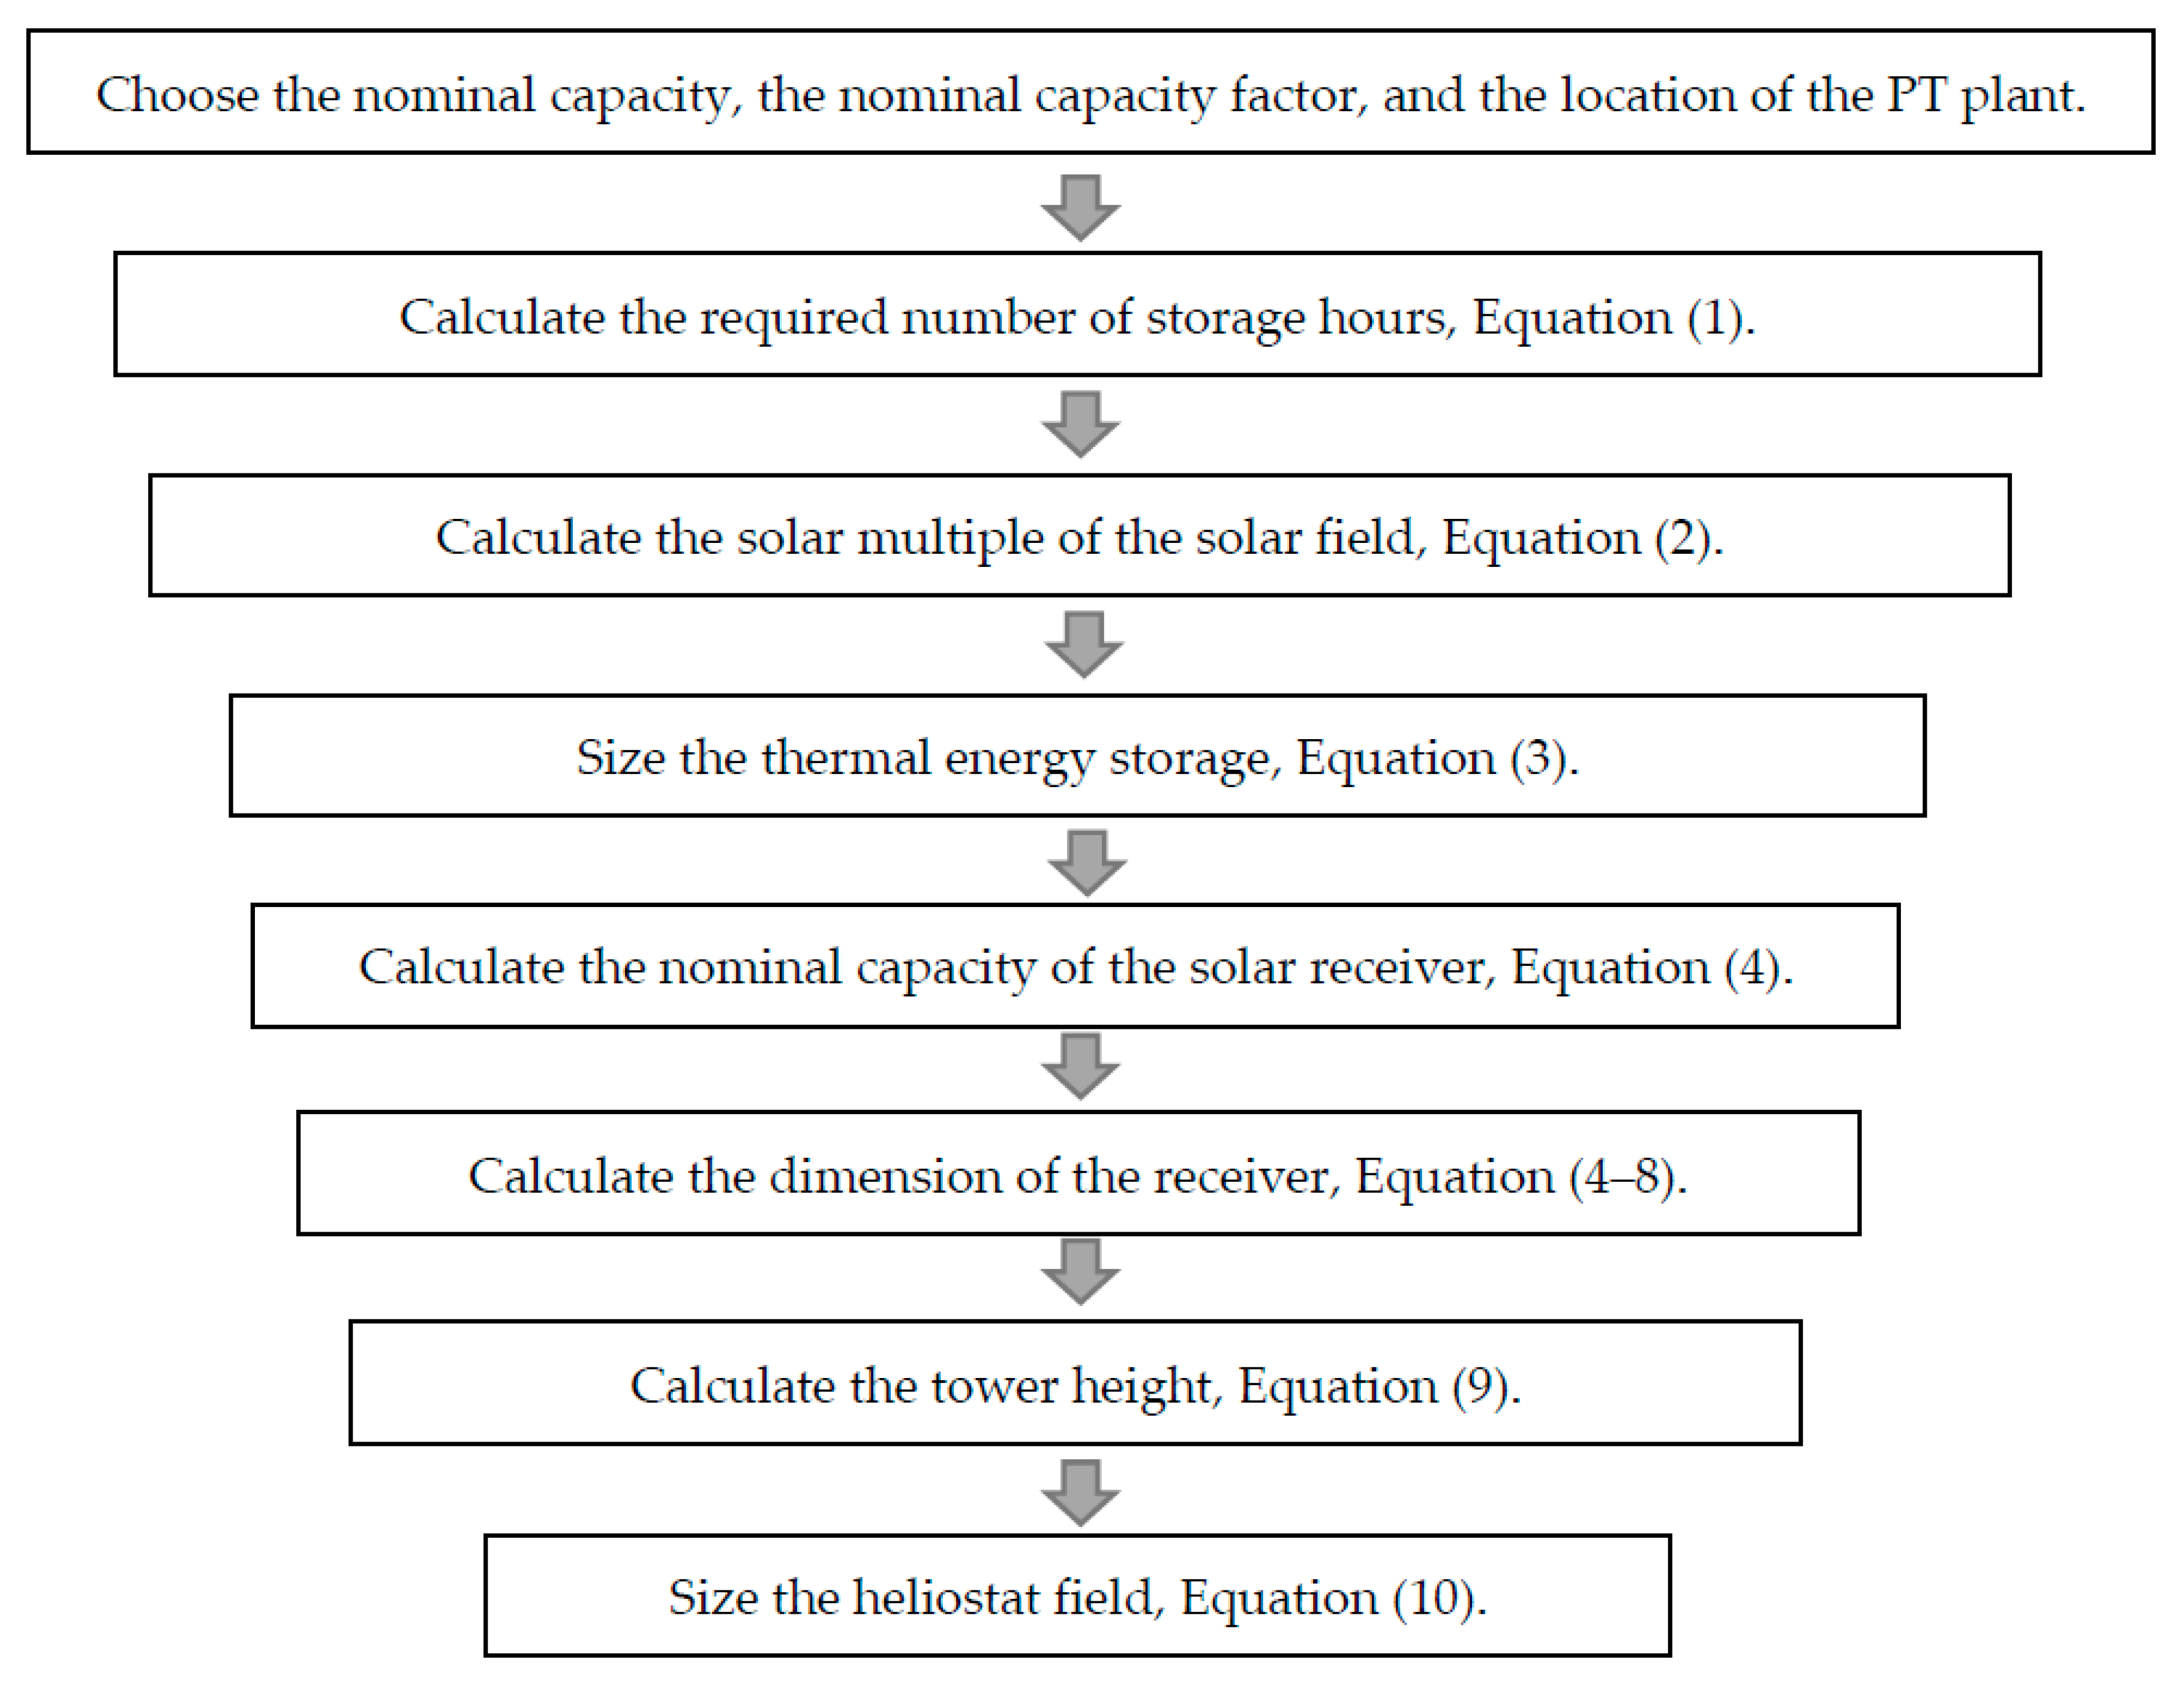
Figure 3 summarizes the proposed design approach in this study.
2.3. Cost Estimation
The cost estimation must consider the size of the PT plant. Indeed, the specific costs of a 5-MWe steam cycle are higher than the specific costs of a 100-MWe steam turbine (effect of scaling up) [27,28]. Similarly, the specific costs of 1000 heliostats are higher than the specific costs of 1,000,000 heliostats (effect of the production chain and project size). This is also true for the specific costs of the TES [29]. Thus, the present study gives particular attention to the influence of scale on the investment costs.
Because there are no recently published cost data for different sizes of PT plants, a practical approach is used to estimate the investment costs for a given size of the PT plant. The specific costs of a 100-MWe PT plant, shown in Table 1, are taken as a reference; then, the specific costs of a PT plant of a size different from 100 MWe are estimated based on a parameter named a cost scale factor (CSF). The CSF is a measure of the effect of the plant size on the specific investment costs. It is derived from the available cost data of utility-scale photovoltaic (PV) plants of 5 MWe, 10 MWe, 50 MWe, and 100 MWe [30]. This is because the heliostat field of the PT plant represents about 40% of the total costs (there are many similarities between the construction activities of the PV field and the solar field of the PT plant). In addition, there are many similarities between the civil engineering works, Engineering, Procurement and Construction (EPC) and owners costs, and contingency of the PV and PT technologies. As Table 1 shows, civil engineering works, EPC and owners costs, and contingency represent more than 20% of the total investment costs of a PT plant.
Figure 4 (left) depicts the CSF as well as the investment costs of typical utility-scale PV plants. The analysis shows that the specific investment costs of a 5 MWe PV plant are 128% of the specific investment costs of a 100-MWe PV plant [30], which confirms the fact that there is a strong impact of the plant’s size on the specific investment costs. This is also true for the case of all the commercial power technologies [28,29]. The calculated specific investment costs of PT plants are illustrated in Figure 4 (right). The plants are supposed to have a storage capacity of 13.56 h and are installed in the north of Chile. The investment costs are calculated considering the sales tax applied in Chile (19%) [33]. The sales tax is applied to 80% of the direct installation costs of the PT plant [30]. The results show that the specific investment costs of the reference 100-MWe plant are 5786 USD/MWe. For PT plants of 5 MWe, 10 MWe, and 50 MWe, the specific costs are 7393.9, 6804.5, and 6161.6 USD/MWe, respectively.
3. Validation of the Design Approach
Two operational PT plants of different sizes were selected to validate the proposed design methodology: Gemasolar (19.9 MWe) and Crescent Dunes (110 MWe). The former is located in Almeria, Spain while the latter is located in Nevada, USA. The two plants use SENER’s heliostat HE35 of 120 m2, 88% reflectivity [25], and a total error on the reflected ray of 2.9 mrad [34]. The geometry of the SR and the tower were calculated using the expressions given in Section 2. Then, they were introduced in SolarPILOT to estimate the optical efficiency of the SF. The estimated SF optical efficiencies of Gemasolar and Crescent Dunes are 55.1% and 42.1%, respectively. Table 2 illustrates the input data used in the validation of the proposed methodology.
A comparison between the predicted and the actual technical design parameters of Gemasolar and Crescent Dunes is shown in Table 3a,b, respectively. The mean bias error (MBE) is used to measure the accuracy of the proposed methodology. It is defined as:
where m and p are the actual value and the predicted value, respectively.
The average relative absolute MBE in the estimation of the design parameters of Gemasolar and Crescent Dunes is 8.2% and 9.3%, respectively. The proposed methodology has shown good agreement with SolarPILOT in the prediction of the power incident on the receiver.
Overall, the uncertainty of the proposed methodology in the estimation of the design parameters of the SR and the tower height is less than its uncertainty in the estimation of the design parameters of the storage and the solar field. The relative MBE in the estimation of the geometric design parameters (height and diameter) of Gemasolar’s receiver is 2.9%. The height of its tower is also estimated with good accuracy (relative MBE = 3.9%). For the case of Crescent Dunes, the relative MBE in the estimation of the geometric design parameters of the receiver is 6.5%. Due to the complexity of the optical modeling of the heliostat field, the methodology showed less accuracy in the estimation of its total reflective area. The relative MBE in the estimation of the reflective area of the solar field for the case of Gemasolar and Crescent Dunes is 15.9% and 12.4%, respectively.
4. Application of the Methodology to Design PT Plants for the Mining Industry in Chile
4.1. Data of the Selected Location
Recent studies reported that the cost of energy represents 20%–40% of the total costs of mining operations in Chile [40]. This is mainly due to the continuous decrease in the grade of ore [40]. Considering that the most important mining industries in Chile are situated in areas with high radiation levels, PT plants have the potential to be an attractive and sustainable source of electricity. For these reasons, a mining operation located in the Atacama region in the north of Chile was selected to show the potential of the proposed methodology in the design and cost estimation of PT plants. The idea is to design PT plants to produce electricity for mining facilities, including copper, iron, and lithium facilities. This section provides a general insight into the performance and the costs of the integration of PT plants into the mining industry.
In addition to a real case (a copper mining process that requires 43 MWe), four typical PT plants of 10 MWe, 20 MWe, 50 MWe, and 100 MWe were considered.
4.2. Design of the PT Plants
The complete design parameters of the designed PT plants are given in Table 5. The nominal and annual performance of the PB, the TES, and the SR, given in Table 6, were taken from Reference [38]. A peak solar flux of 830 kW/m2 [26], an aspect ratio of 1.22 [23], and a peak-to-average flux ratio of 1.622 [23] were considered. The geometry and the optical proprieties of the heliostat are those used by the National Renewable Energy Laboratory (NREL) [31,32] to estimate the costs given in Table 1. The heliostat is 12.2 × 12.2 m, and has a reflective surface ratio of 97% and a mirror reflectivity of 94% [23]. The optical efficiency of the SF depends strongly on the latitude of the site [42]. The nominal and annual optical efficiencies of the SF, shown in Table 7, were obtained using the same approach highlighted in Section 4.
To ensure a nominal capacity factor of 100%, a storage capacity of 13.56 h is required, which results in a solar multiple of 2.30. The nominal power of the SR ranges from 54.96 MWth for the case of 10-MWe plant to 549.60 MWth for the case of 100-MWe plant. The PT plant designed for the actual mining process requires an SR of 14.20 m height × 11.64 m diameter, a tower of 142.91 m, a TES of 5758.29 MWhth, and an SF of 374,621.8 m2 reflective area.
4.3. Economic Indices
A complete analysis of the design and cost estimation requires the calculation of the economic indices. Among the most important economic indices are the levelized cost of electricity (LCOE), the total life cycle charges (TLCC), the simple payback period (SPB), and the internal rate of return (IRR). To assess the feasibility of the PT plants, yearly analysis during the whole lifetime of the PT plant is the best approach [43]. The method used herein is based on yearly discounted cash flows, considers the degradation in the performance of the components, and accounts for the inflation in the Operation& Maintenance (O&M) costs [43].
The TLCC is commonly used to compare various power plants of different sizes, which is the case of the present study. The following expression is useful to calculate the TLCC:
where I is the initial investment, TC is the corporate income tax rate, PVDEP is the present value of depreciation, and PVOM is the present value of O&M costs. The O&M costs in year zero are inflating at a yearly inflation rate of services.
The LCOE is the ratio of the TLCC and the discounted produced energy.
where En is the energy generated in year n, d is the nominal discount rate, and L is the operation duration of the PT plant.
The nominal discount rate is a function of the inflation rate and the real discount rate.
where dr and i are the real discount rate and the inflation rate, respectively.
The energy produced each year (En) is calculated taking into consideration the average yearly degradation rate.
The degradation rate (dr) represents the annual reduction in the production of the PT plant due to the decrease in the optical proprieties of the reflective surface of the heliostat field, the accuracy of the tracking and control system, the selective coating of the solar receiver, the effectiveness of the heat exchangers, and the efficiency of the component of the steam cycle, among others.
The energy produced during the first year is calculated considering the annual solar resources (given in Table 4) as well as the annual performance of each component of the PT plant (given in Table 6 and Table 7).
Table 8 illustrates the main input data used to calculate the economic indices. The construction and the operation periods are two years and 25 years, respectively. The depreciation method used in this study is based on the approach recommended by the US Internal Revenue Service [43]. Both the straight line (SL) and double declining balances (DB) depreciation models are calculated. The annual depreciation switches from DB to SL in the year in which SL provides a larger allowance than that of DB. The real discount rate corresponds to the value recommended by the NREL for immerged technologies.
Table 9 summarizes the key economic indices. The total cost of the PT plant for the actual mining process is about 338.26 million USD, which represents 125% of the investment costs. Because of the high TLCC, the SPB ranges from 16 to 19 years. The PT plant that is designed for the actual mining process has an SPB of 17 years. This confirms that solar investors should be attracted by long-term power purchase contracts to reduce investment risks [30]. The IRR is commonly used by investors to assess the viability of the project by comparing the IRR of the project with a “hurdle rate”. The nominal discount rate in the present analysis is 4.86%. If this value is considered the hurdle rate and the electricity prices remain constant during the lifetime of the PT plant, then the investor will decide to invest his/her money in a 100-MWe plant.
5. Sensitivity Analysis
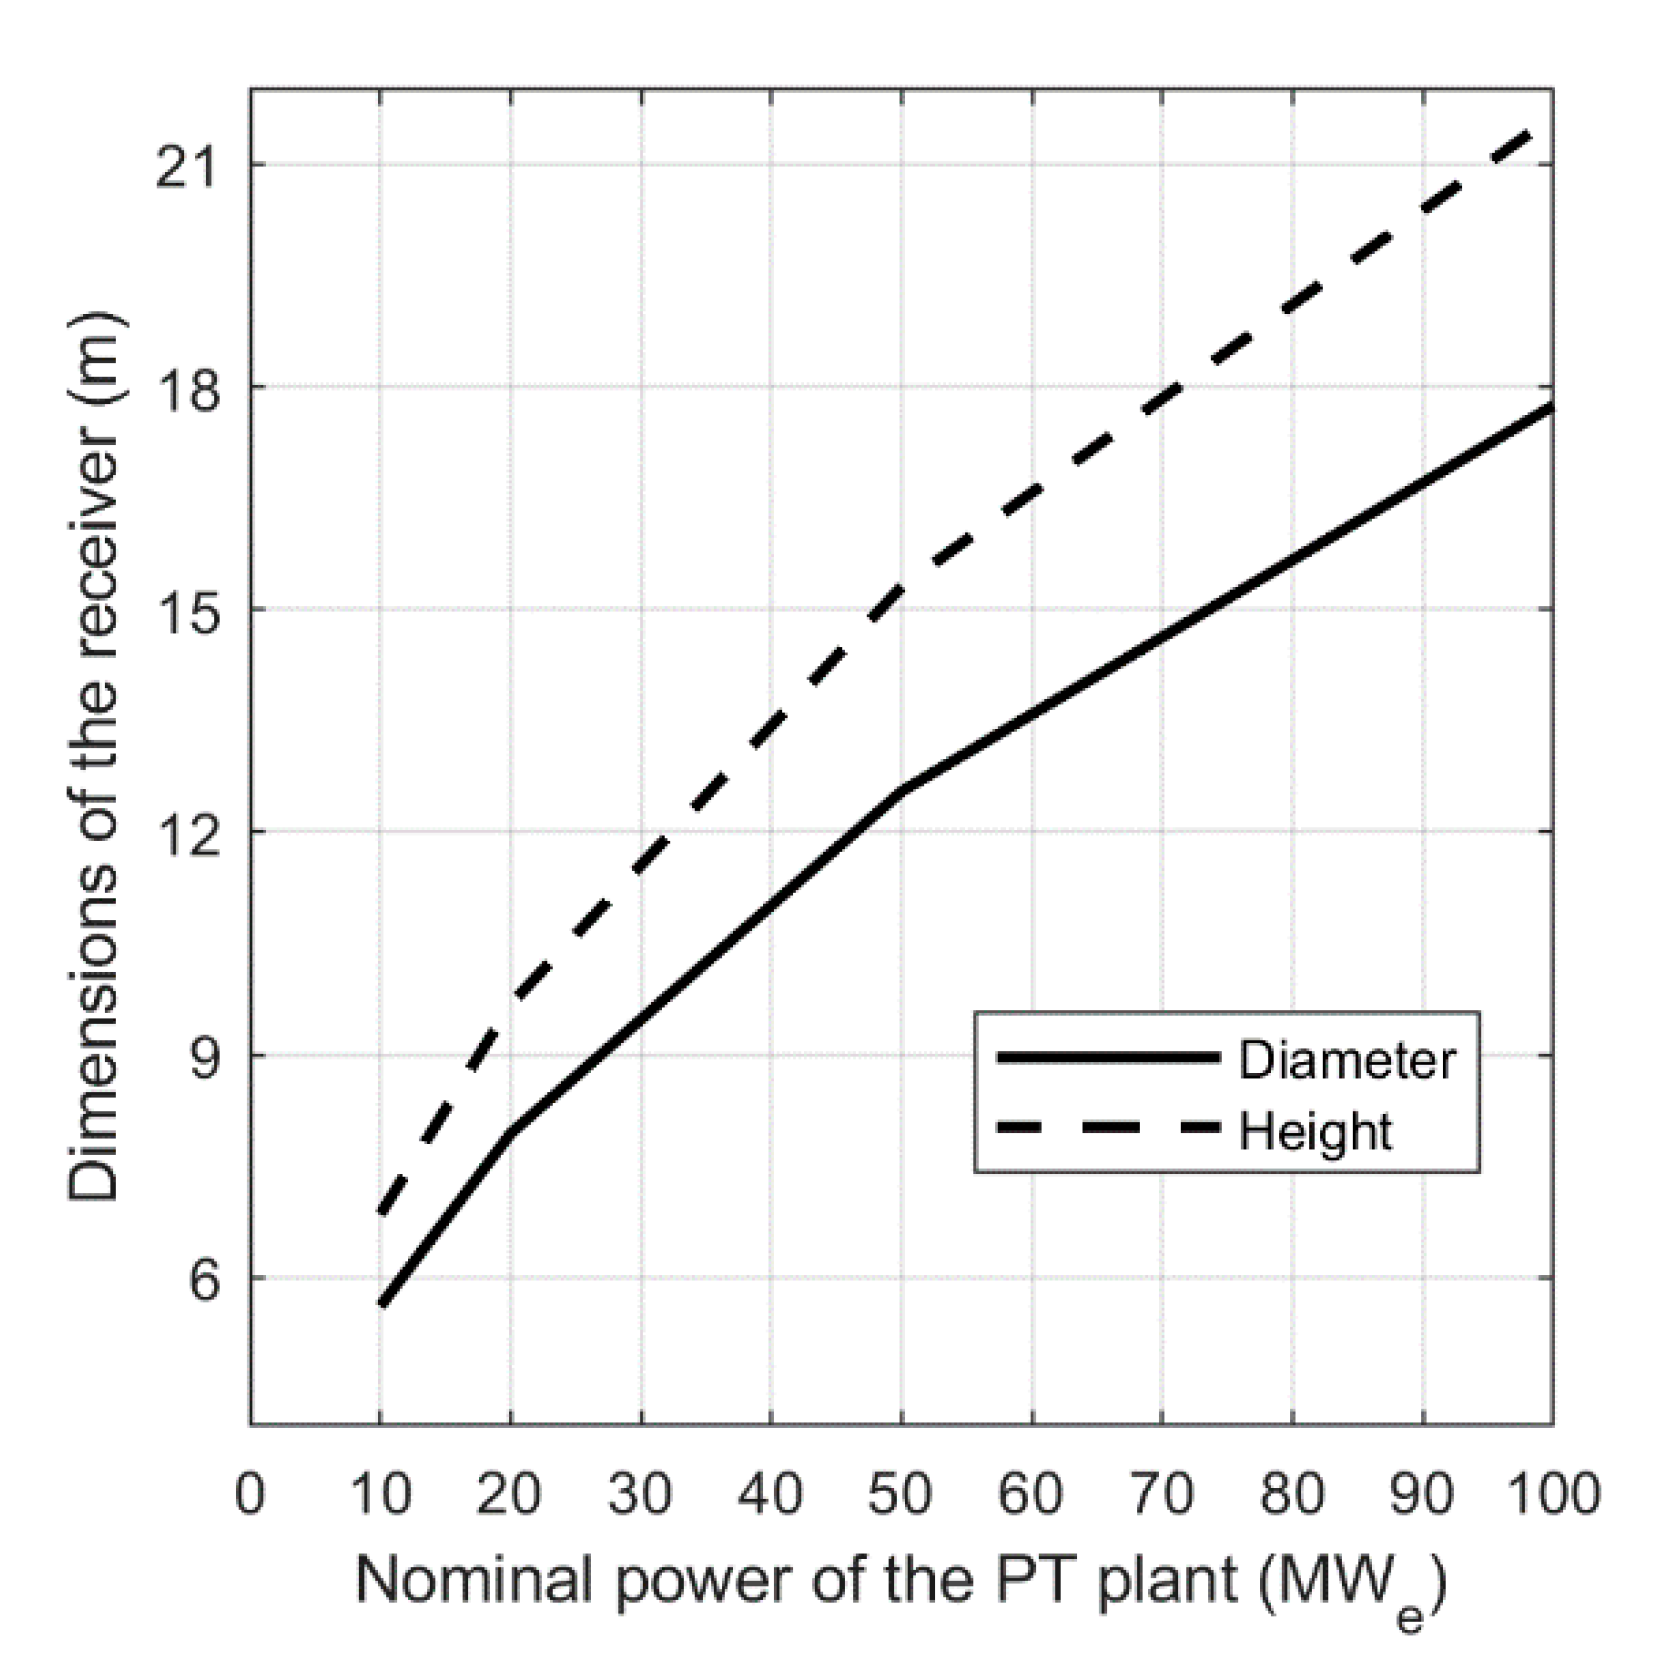
A sensitivity analysis was carried out to investigate the influence of the technical and financial parameters on the performance of the PT plants. Figure 5 shows the variation of the dimensions of the SR as a function of the nominal power of the PT plant. As can be seen, there is a logarithmic relation between the dimensions of the SR and the nominal power of the PT plant.
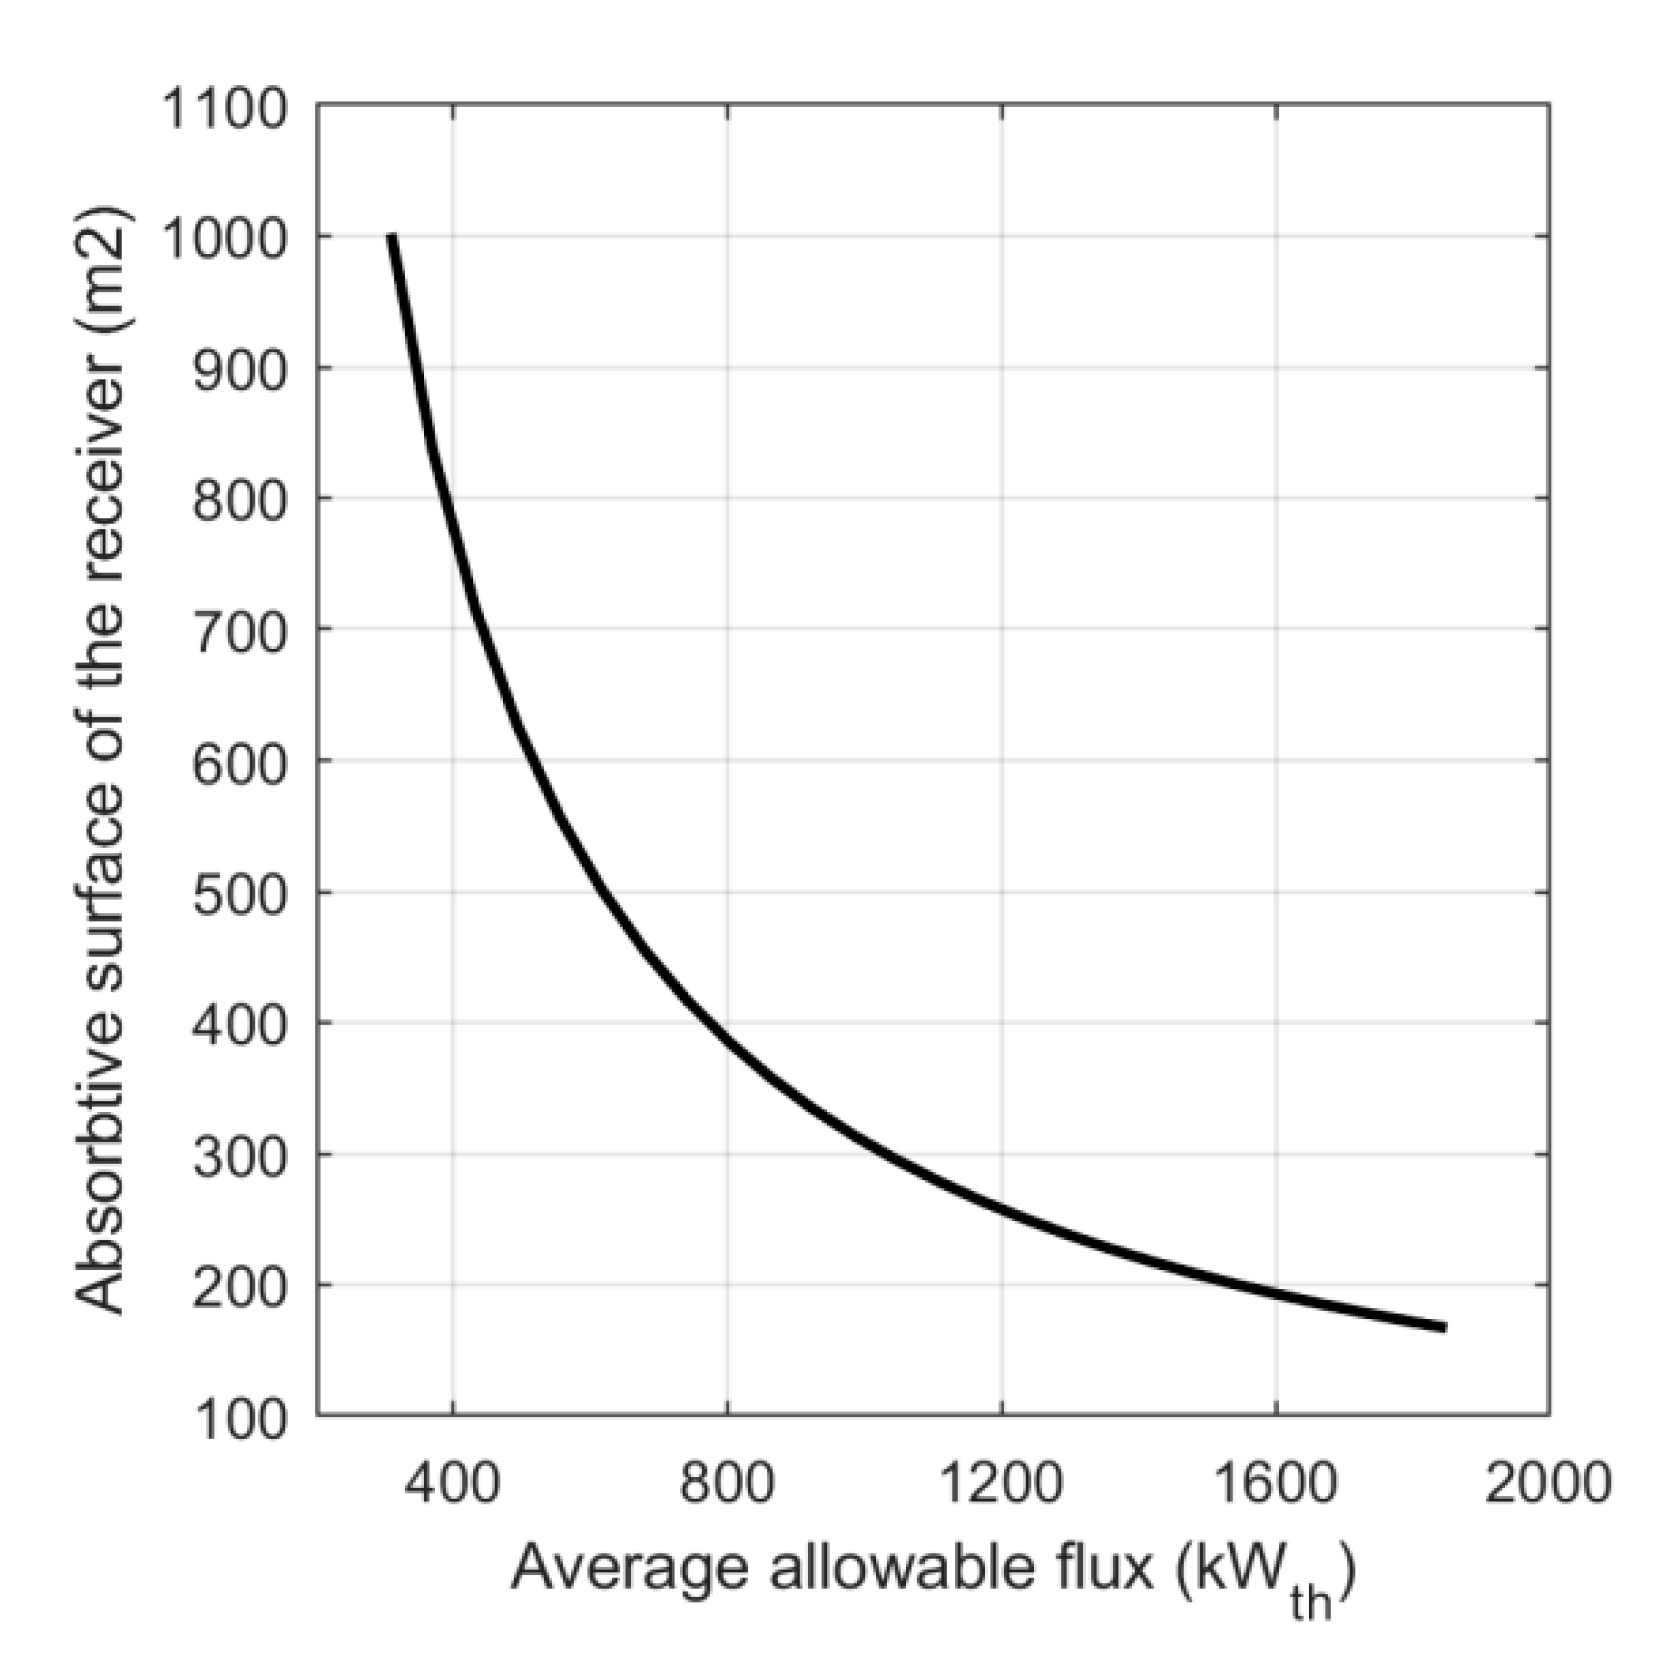
Figure 6 (left) shows the variation of the absorptive surface of the SR with the allowable heat flux. A 50-MWe plant is taken as an illustrative example (even for the results illustrated in Figure 7, Figure 8 and Figure 9). The allowable heat flux depends on the thermal and mechanical properties of the materials used to build the SR. The higher the allowable heat flux, the lower the SR’s absorptive surface and the higher its surface temperature. The SR’s absorptive surface could be decreased from 603.5 m2 to about 200 m2 by increasing the allowable heat flux of the current commercial PT plants to 1600 kW/m2. This could result in a significant cost reduction, but it requires the use of new materials that perform well under high heat flux.
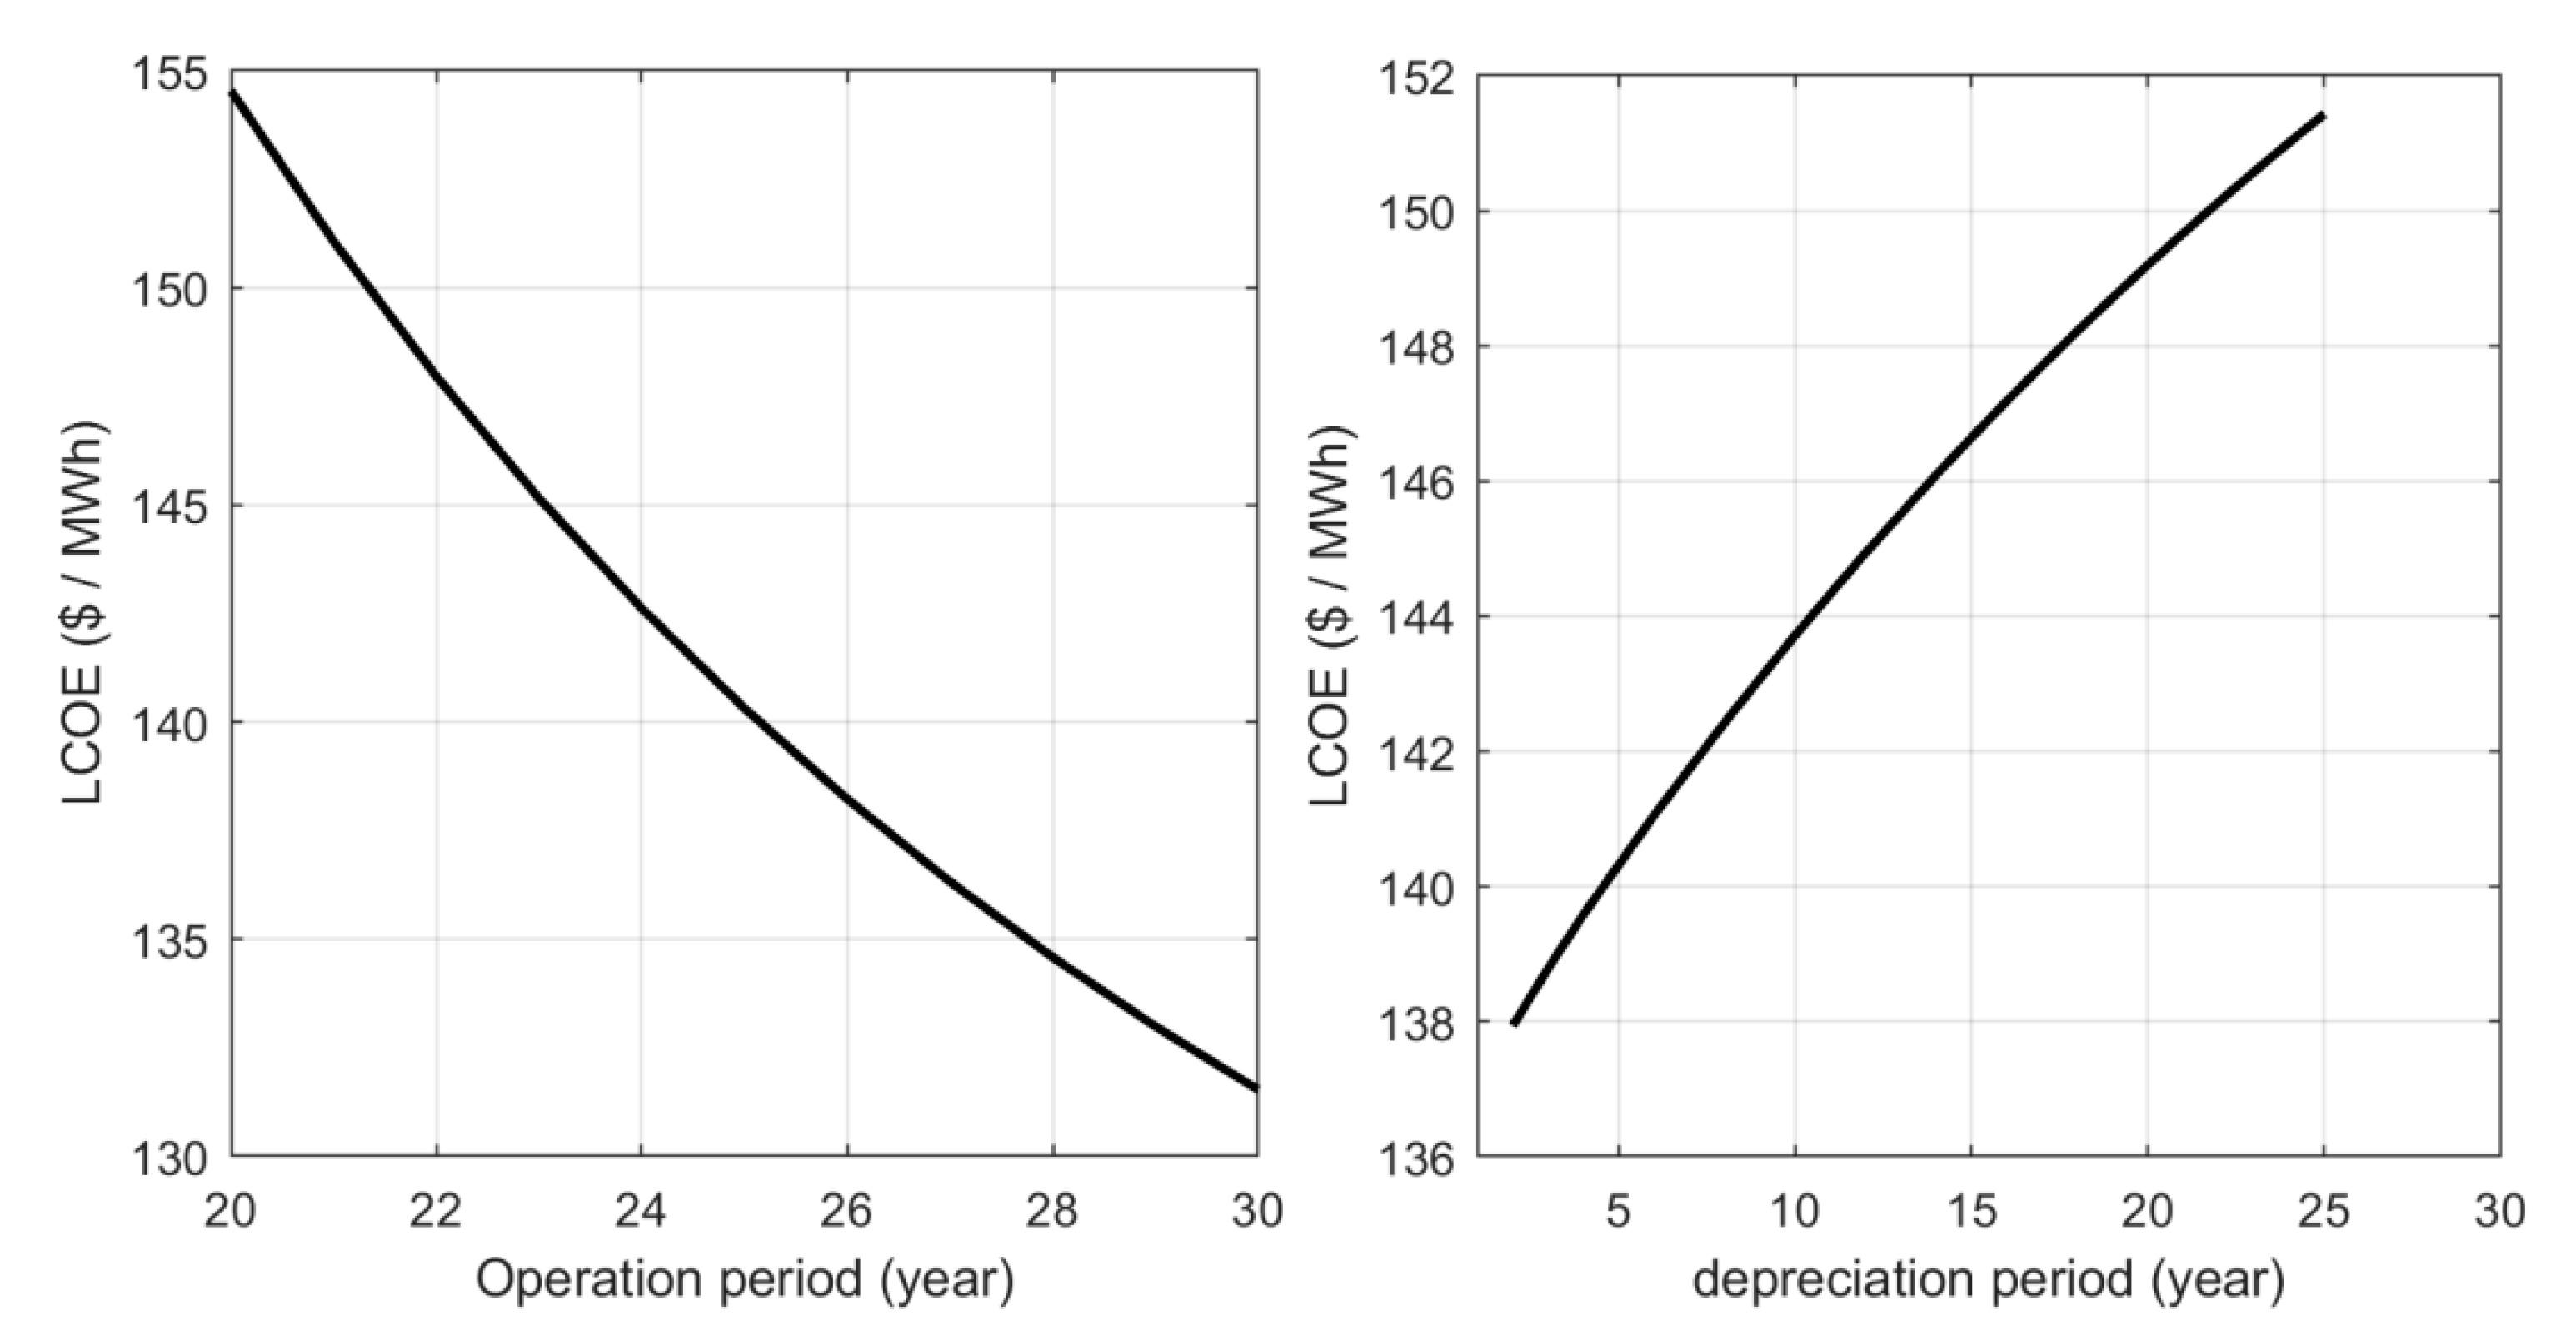
The influence of the operation period and the depreciation period on the LCOE is shown in Figure 7. If the operation period is increased from 25 to 30 years, the LCOE decreases from 140 to about 132 USD/MWh, which represents a cut of 5.7%. The depreciation period influences the LCOE. As Figure 7 (right) illustrates, the longer the depreciation period, the higher the LCOE. When the depreciation period is as long as the operation period, the LCOE increases to 151 USD/MWh. This value is 8% higher than the one obtained when the depreciation period is five years (140 USD/MWh).
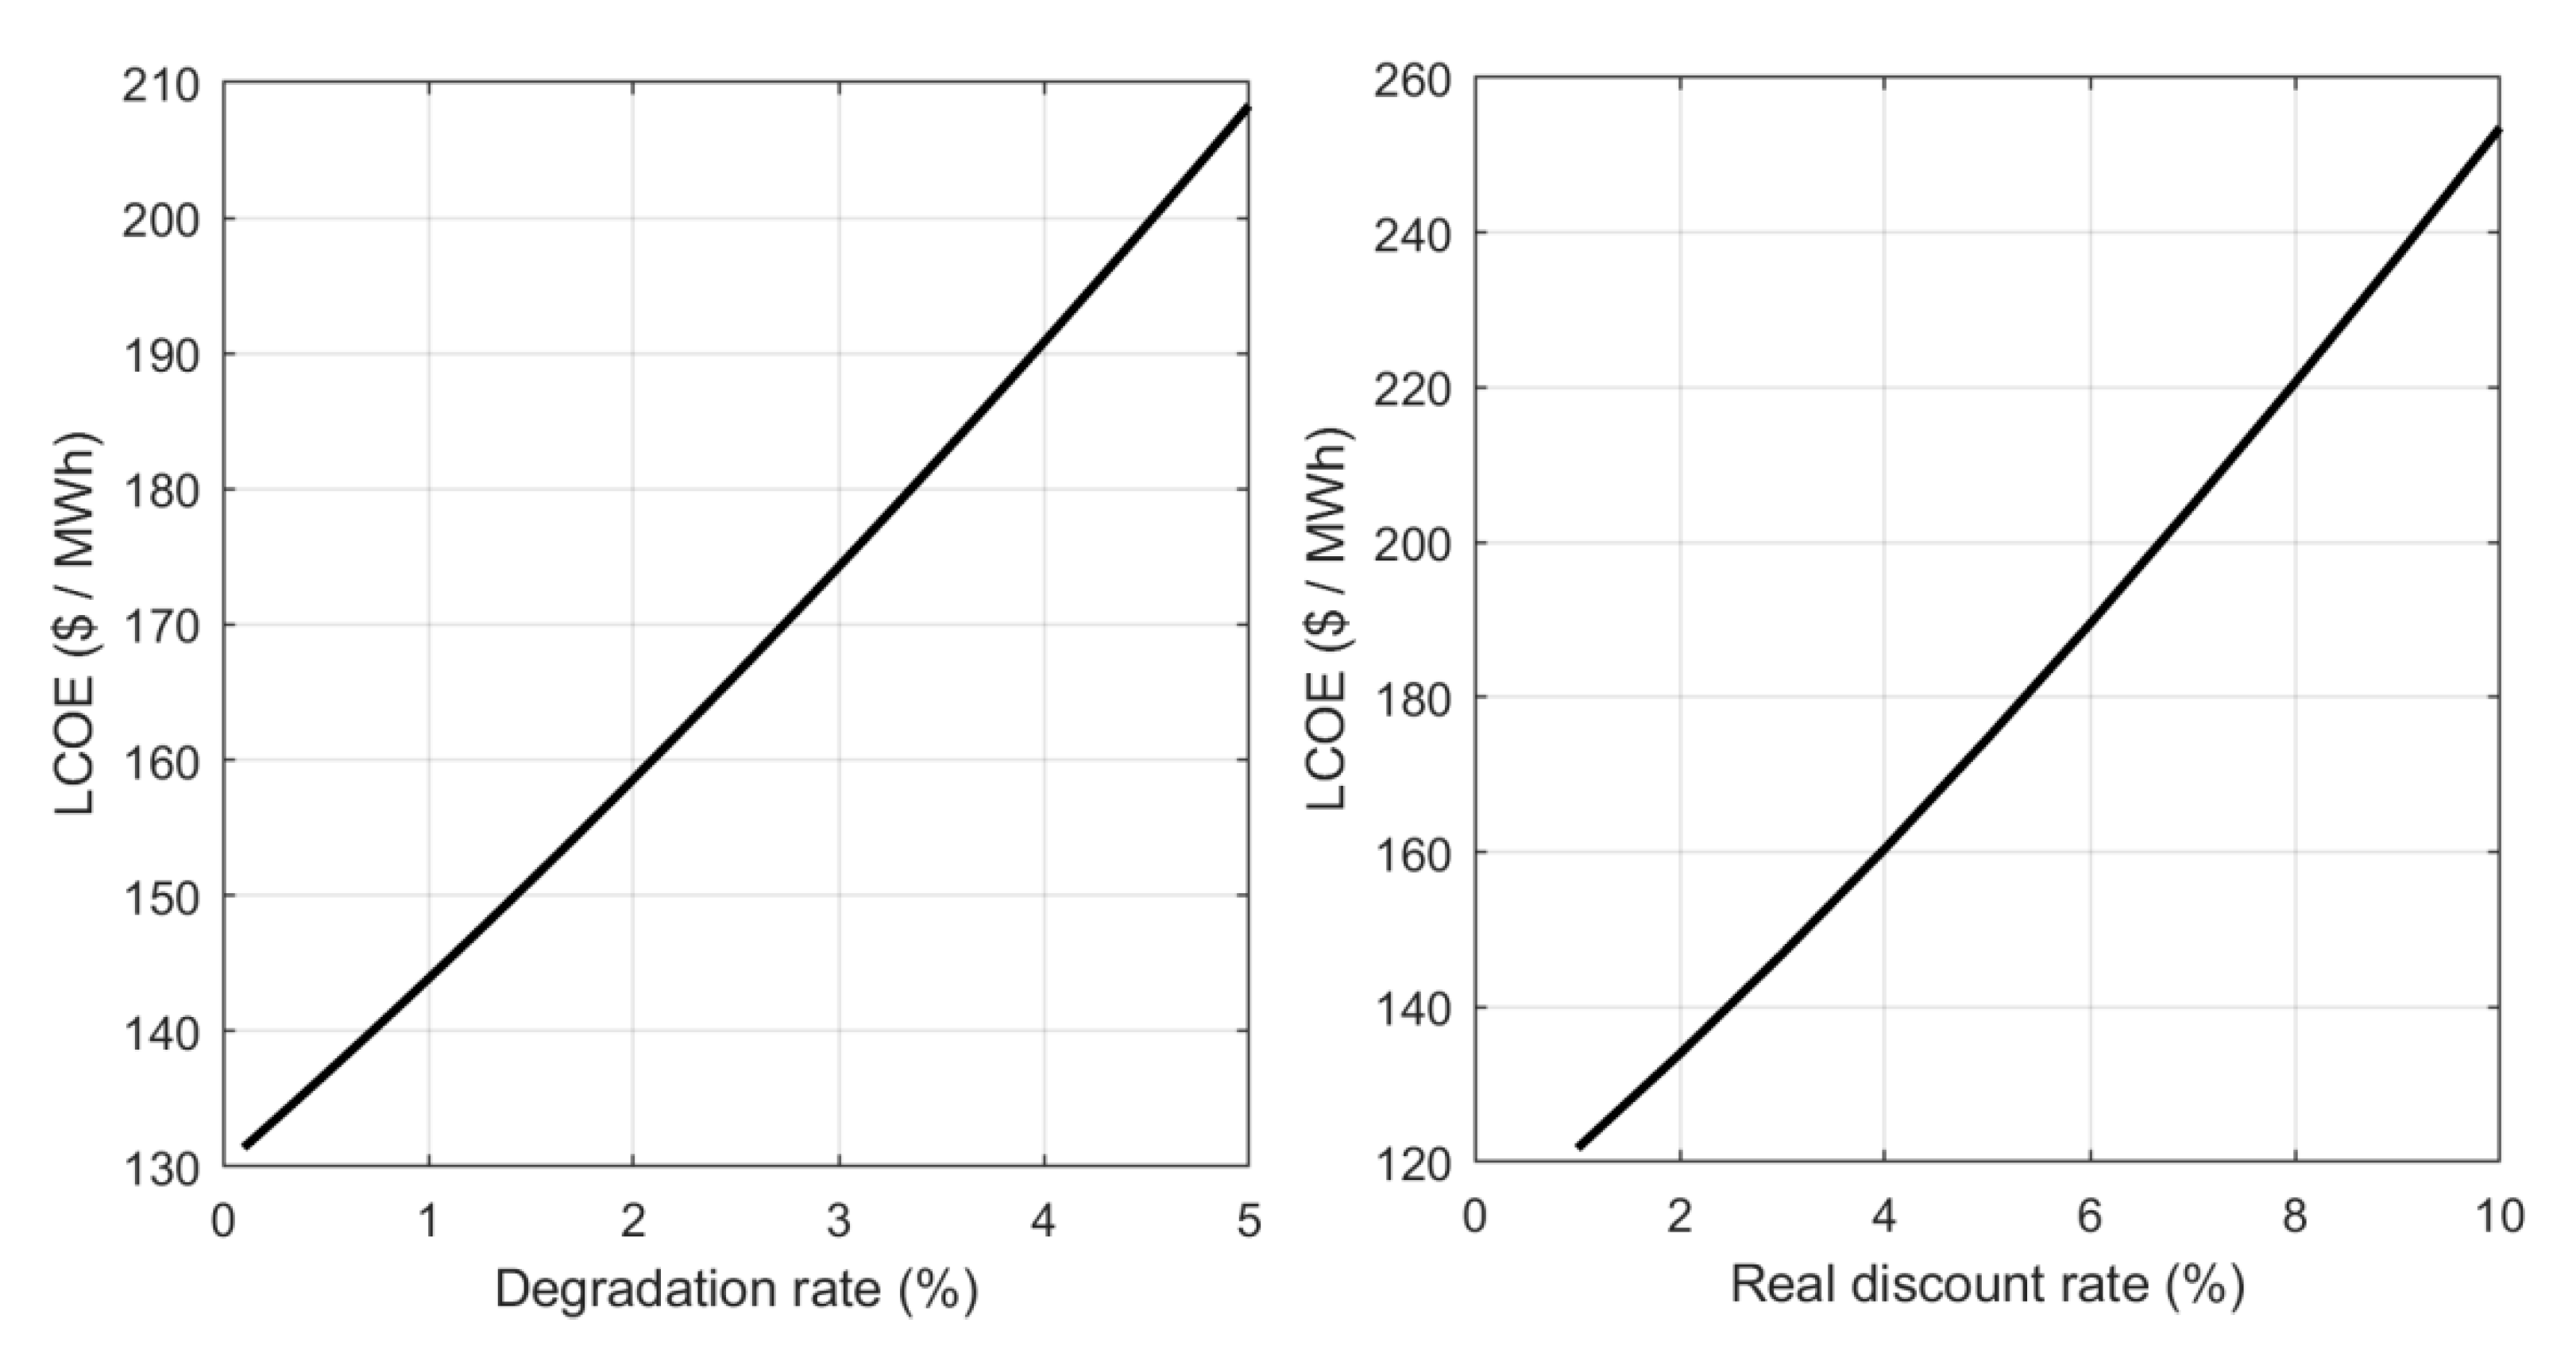
Figure 8 illustrates the influence of the degradation rate and the discount rate on the LCOE. The results show that the degradation rate has a critical influence on the LCOE. The considered average degradation rate in Section 4 is 0.75%, which corresponds to a LCOE of 140 USD/MWh. If this value is doubled (1.5%), the LCOE increases to reach more than 150 USD/MWh. High degradation rates could raise the LCOE and jeopardize the viability of the solar power project. Indeed, if the average degradation rate reaches 5%, the LCOE jumps to 208.3, which represents an increase of 49% compared with the reference case (degradation rate of 0.75%).
The real discount rate has also a strong influence on the LCOE. As Figure 8 (right) illustrates, if the real discount rate is 10%, the LCOE reaches 253.6 USD/MWh.
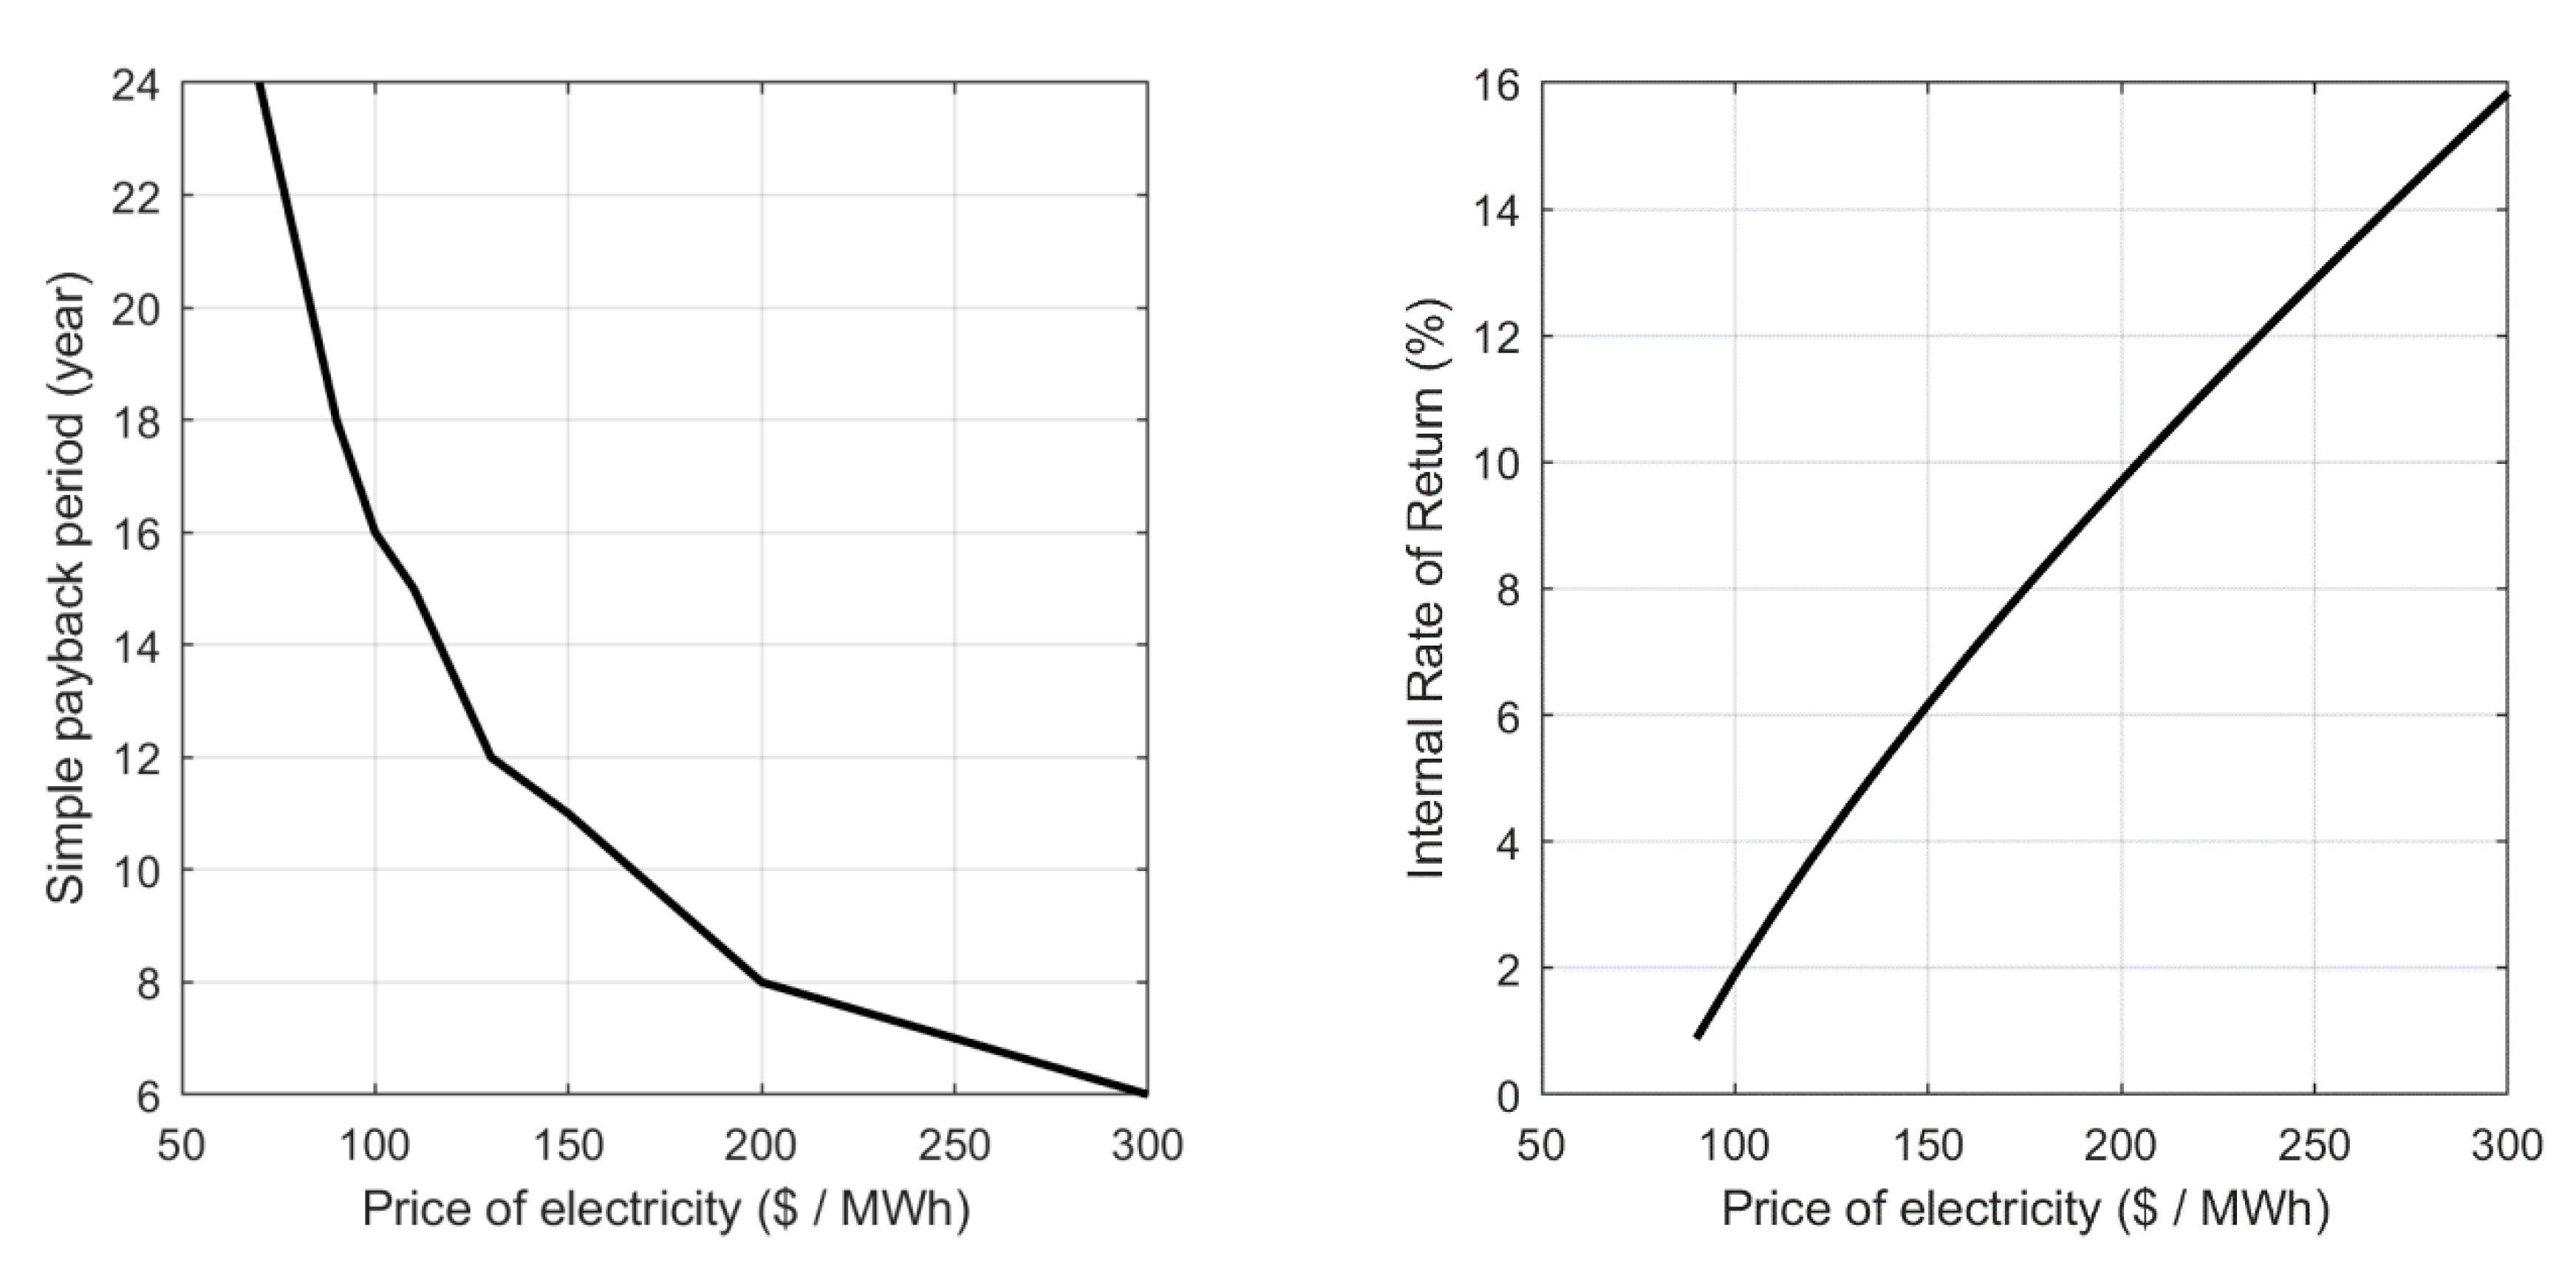
Figure 9 shows the influence of the price of electricity on the SPB and the IRR. The SPB decreases sharply with the increases of the electricity price. To reduce the SPB to eight years, it is necessary to raise the electricity price to 200 USD/MWh. In addition, an SPB shorter than five years requires electricity prices higher than 300 USD/MWh. This is mainly related to the high specific investment costs of the PT technology. The IRR increases with the increase in the electricity price. It is about 2% for electricity prices around 100 USD/MWh. To reach an IRR of 10%, the electricity prices should be around 200 USD/MWh.
6. Conclusions
A practical methodology has been proposed for the design and cost estimation of commercial PT plants. The design approach was validated through a comparison of the predicted design parameters with the actual technical data of two operational PT plants of medium- and large-scale sizes. The average absolute mean bias error in the prediction of the complete design of the PT plants is 8.75%.
The investment costs were estimated taking into account the scale effect. The results showed that the plant size has a strong influence on investment costs. The specific investment costs of 5, 10, 50, and 100 MWe are 7393.9, 6804.5, 6161.6, and 5786 USD/MWe, respectively.
The proposed methodology was applied to design and estimate the costs of six PT plants in the range of 10–100 MWe for integration into the mining industry. The economic assessment indicates that the TLCC of the PT plant represents 125% of the investment costs, which results in a long SPB. The SPB of the PT plants ranges from 16 years for a 100-MWe plant to 19 years for a 10-MWe plant. The LCOE decreases as the size of the PT increases, from 112.89 USD/MWh for a 10-MWe plant to 95.28 USD/MWh for a 100-MWe plant.
The sensitivity analysis showed that the allowable heat flux has a strong influence on the size of the solar receiver. In addition, the degradation rate and the real discount rate have a crucial impact on the viability of solar power projects.
The proposed methodology is universal, since it has the potential to provide the key information for prospective analysis of the implementation of any PT plants with cylindrical receivers.
Author Contributions
Methodology, O.B. and D.S.; software, O.B.; validation, O.B.; resources, D.S. and L.M.; writing—original draft preparation, O.B.; writing—review and editing, O.B., D.S. and L.M. All authors have read and agreed to the published version of the manuscript.
Funding
This work was supported by “Agencia Nacional de Investigación y Desarrollo de Chile (ANID)”, project number ANID/FONDAP/15110019, “Solar Energy Research Center”-SERC-Chile.
Acknowledgments
The authors gratefully acknowledge ANID for the financial support.
Conflicts of Interest
The authors declare no conflict of interest.
References
- Collado, F.J.; Guallar, J. A review of optimized design layouts for solar power tower plants with campo code. Renew. Sustain. Energy Rev. 2013, 20, 142–154. [Google Scholar] [CrossRef] [Green Version]
- Behar, O.; Khellaf, A.; Mohammedi, K. A review of studies on central receiver solar thermal power plants. Renew. Sustain. Energy Rev. 2013, 23, 12–39. [Google Scholar] [CrossRef]
- Gielen, D. Renewable Energy Technologies: Cost Analysis Series, Concentrating Solar Power. 2012. Available online: https://www.irena.org/documentdownloads/publications/re_technologies_cost_analysis-csp.pdf (accessed on 21 November 2019).
- Jebamalai, M. Receiver Design Methodology for Solar Tower Power Plants. Master’s Thesis, Department of Energy Technology, KTH School of Industrial Engineering and Management, Stockholm, Sweden, 2016. [Google Scholar]
- Srilakshmi, G.; Suresh, N.; Thirumalai, N.; Srilakshmi, R. Preliminary design of heliostat field and performance analysis of solartower plants with thermal storage and hybridisation. Sustain. Energy Technol. Assess. 2017, 19, 102–113. [Google Scholar] [CrossRef] [Green Version]
- Srilakshmi, G.; Suresh, N.; Thirumalai, N.; Srilakshmi, R. Design of Solar Field and Performance Estimation of Solar Tower Plants; Center for Study of Science, Technology and Policy: Bangalore, India, 2016. [Google Scholar]
- Malekan, K.; Pabon, J.; Zhao, X.; Assadet, M. Design parameter modelling of solar power tower system using adaptive neuro-fuzzy inference system optimized with a combination of genetic algorithm and teaching learning-based optimization algorithm. J. Clean. Prod. 2020, 244, 118904. [Google Scholar] [CrossRef]
- Luo, Y.; Hu, Y.; Lu, T. Efficient optimized design of solar power tower plants based on successive response surface methodology. Int. J. Low Carbon Technol. 2019, 14, 475–486. [Google Scholar] [CrossRef]
- Lu, Y.; Lu, T.; Du, X. Novel optimization design strategy for solar power tower plants. Energy Convers. Manag. 2018, 177, 682–692. [Google Scholar] [CrossRef]
- Albarbar, A.; Arar, A. Performance Assessment and Improvement of Central Receivers Used for Solar Thermal Plants. Energies 2019, 12, 3079. [Google Scholar] [CrossRef] [Green Version]
- Siala, F.M.F.; Elayeb, M.E. Mathematical formulation of a graphical method for a no-blocking heliostat field layout. Renew. Energy 2001, 23, 77–92. [Google Scholar] [CrossRef]
- Marcelino, S.; Manuel, R. Methodology for generation of heliostat field layout in central receiver systems based on yearly normalized energy surfaces. Sol. Energy 2006, 80, 861–874. [Google Scholar]
- Wei, X.; Lu, Z.; Lin, Z.; Hongxin, Z.; Ni, Z. Optimization procedure for design of heliostat field layout of a 1 MWe solar tower thermal power plant. Solid State Lighting Sol. Energy Technol. 2007, 6841, 684119. [Google Scholar]
- Noone, J.; Manuel, T.; Alexander, M. Heliostat field optimization: A new computationally efficient model and biomimetic layout. Sol. Energy 2012, 86, 792–803. [Google Scholar] [CrossRef]
- Pitz-Paal, R.; Bayer, B.N.; Aldo, S. Heliostat field layout optimization for high-temperature solar thermochemical processing. Sol. Energy 2011, 85, 334–343. [Google Scholar]
- Besarati, S.; Goswami, Y. A computationally efficient method for the design of the heliostat field for solar power tower plant. Renew. Energy 2014, 69, 226–232. [Google Scholar] [CrossRef]
- Belhomme, B.; Pitz-Paal, R.; Schwarzbözl, P.; Ulmer, S. A New Fast Ray Tracing Tool for High-Precision Simulation of Heliostat Fields. J. Sol. Energy Eng. 2009, 131, 031002. [Google Scholar] [CrossRef]
- Collado, F.J.; Guallar, J. Campo: Generation of regular heliostat fields. Renew. Energy 2012, 46, 49–59. [Google Scholar] [CrossRef]
- Ho, C. Software and Codes for Analysis of Concentrating Solar Power Technologies. Sandia National Laboratories. SAND2008-8053. December 2008. Available online: https://energy.sandia.gov/wp-content/gallery/uploads/SAND2008-8053.pdf (accessed on 21 November 2019).
- SolTrace Software. Available online: https://www.nrel.gov/csp/soltrace.html (accessed on 21 November 2019).
- Collado, F.; Guallar, J. Scaling Campo Code to Commercial Solar Tower Plants. SolarPACES 2017. AIP Conf. Proc. 2018, 2033, 210002-1–210002-7. [Google Scholar] [CrossRef]
- Solstice Software. Available online: https://www.labex-solstice.fr/solstice-software/ (accessed on 21 November 2019).
- Solar Power Tower Integrated Layout and Optimization Tool (SolarPILOT™). Available online: https://www.nrel.gov/csp/solarpilot.html (accessed on 21 November 2019).
- Praveen, R.P. Performance Analysis and Optimization of Central Receiver Solar Thermal Power Plants for Utility Scale Power Generation. Sustainability 2020, 12, 127. [Google Scholar] [CrossRef] [Green Version]
- Collado, F.; Guallar, J. Quick design of regular heliostat fields for commercial solar tower power plants. Energy 2019, 178, 115–125. [Google Scholar] [CrossRef]
- Clausing, A.; Waldvogel, J.; Lister, L. Natural convection from isothermal cubical cavities with a variety of side-facing apertures. J. Heat Transf. 1987, 109, 407–412. [Google Scholar] [CrossRef]
- Capital Cost Estimates for Utility Scale Electricity Generating Plants. US Energy Information Administration. November 2016. Available online: https://www.eia.gov/analysis/studies/powerplants/capitalcost/pdf/capcost_assumption.pdf (accessed on 21 November 2019).
- Platzer, W. Small-scale CSP and solar Process Heat Application: Case Studies. In Proceedings of the Conference on Small-Scale Concentrating Solar Power, Pula, Croatia, 25 September 2015; Available online: https://www.fraunhofer.cl/content/dam/chile/es/documents/csetdocument/presentaciones/platzer-150925-pula-small_scale_csp_solar_thermal_process_heat.pdf (accessed on 21 November 2019).
- Abraham, M. Encyclopedia of Sustainable Technologies; Elsevier: Amsterdam, The Netherlands, 2017. [Google Scholar]
- Fu, R.; Feldman, D.; Margolis, R. U.S. Solar Photovoltaic System Cost Benchmark: Q1 2018; Technical Report: NREL/TP-6A20-72399; NREL: Denver, CO, USA, 2018. [Google Scholar]
- Turchi, C.; Boyd, M.; Kesseli, D.; Kurup, P.; Mehos, M.; Neises, T.; Sharan, P.; Wagner, M.; Wendelin, T. CSP Systems Analysis—Final Project Report; Technical Report; NREL/TP-5500-72856; National Renewable Energy Lab (NREL): Golden, CO, USA, 2019. [Google Scholar]
- Mehos, M.; Turchi, C.; Vidal, J.; Wagner, M.; Ma, Z.; Ho, C.; Kolb, W.; Andraka, C.; Kruizenga, A. Concentrating Solar Power Gen3 Demonstration Roadmap; NREL/TP-5500-67464; NREL: Denver, CO, USA, 2017. [Google Scholar]
- Trading Economics. Available online: https://tradingeconomics.com/chile/ (accessed on 21 November 2019).
- Rinaldi, F.; Binotti, M.; Giostri, A.; Manzolini, G. Comparison of linear and point focus collectors in solar power plants. Energy Procedia 2014, 49, 1491–1500. [Google Scholar] [CrossRef] [Green Version]
- Gemasolar Solar Thermal Power Plant. SENER 2017. Available online: http://www.poweroilandgas.sener (accessed on 21 November 2019).
- Sánchez, M.; de los Reyes, M. On the Design of Solar External Receivers. Ph.D. Thesis, University of Carlos III, Madrid, Spain, 2015. Available online: https://core.ac.uk/download/pdf/44309378.pdf (accessed on 21 November 2019).
- Relloso, R.; Garcia, E. Tower technology cost reduction approach after Gemasolar experience. Energy Procedia 2015, 69, 1660–1666. [Google Scholar] [CrossRef] [Green Version]
- Ehrhart, B.; Gill, D. Evaluation of Annual Efficiencies of High Temperature Central Receiver Concentrated Solar Power Plants with Thermal Energy Storage; SANDIA REPORT: SAND2013-5493; Sandia National Laboratories: Albuquerque, NM, USA, 2013. [Google Scholar]
- Crescent Dunes Solar Energy Project. Available online: https://solarpaces.nrel.gov/crescent-dunes-solar-energy-project (accessed on 21 November 2019).
- Comisión Chilena del Cobre (COCHILCO). Available online: https://www.cochilco.cl (accessed on 3 December 2019).
- Solar Explorador. Available online: http://www.minenergia.cl/exploradorsolar/ (accessed on 21 November 2019).
- Kincaid, N.; Mungas, G.; Kramer, N.; Wagner, M.; Zhu, G. An optical performance comparison of three concentrating solar power collector designs in linear Fresnel, parabolic trough, and central receiver. Appl. Energy 2018, 231, 1109–1121. [Google Scholar] [CrossRef]
- Short, W.; Packey, D.; Holt, T. A Manual for the Economic Evaluation of Energy Efficiency and Renewable Energy Technologies; Technical report; NREL/TP-462-5173; National Renewable Energy Lab (NREL): Golden, CO, USA, 1995. [Google Scholar]
- Reuters Staff, Chile Seen Raising Electricity Price Due to Dollar. Available online: https://www.reuters.com/article/chile-energy-prices/chile-seen-raising-electricity-price-due-to-dollar-idUSN2445562420080924 (accessed on 21 November 2019).
- Xe.com Inc. Available online: https://www.xe.com/ (accessed on 21 November 2019).
Figure 1.
Schematic diagram of the methodology.

Figure 2.
A typical configuration of solar power tower plants.

Figure 3.
Flowchart of the proposed design approach.

Figure 4.
Specific investment costs of the photovoltaic (PV) technology and cost scale factor (left); specific investment costs of the PT technology (right).
Figure 4.
Specific investment costs of the photovoltaic (PV) technology and cost scale factor (left); specific investment costs of the PT technology (right).

Figure 5.
Variation of the geometric design parameters of the solar receiver as a function of the nominal power of the PT plant (left).
Figure 5.
Variation of the geometric design parameters of the solar receiver as a function of the nominal power of the PT plant (left).

Figure 6.
Variation of the solar receiver’s absorptive surface with the average allowable flux.

Figure 7.
Influence of the operation period (left) and the depreciation period (right) on the levelized cost of electricity (LCOE).
Figure 7.
Influence of the operation period (left) and the depreciation period (right) on the levelized cost of electricity (LCOE).

Figure 8.
Effect of the degradation rate (left) and the real discount rate (right) on the LCOE.

Figure 9.
Influence of the price of electricity on the SBP (left) and the IRR (right).


Table 1.
Specific costs for a 100-MWe power tower (PT) plant.
| Component | Unit | Value | Reference |
|---|---|---|---|
| Site improvement | USD/m2 | 16 | [31] |
| Solar field | USD/m2 | 140 | [31] |
| Tower structure and solar receiver | USD/Wth | 152 | [32] |
| Thermal energy storage | USD/kWhth | 22 | [31] |
| Power block | USD/kWe | 1040 | [31] |
| Balance of the PT plant | USD/MWe | 290 | [31] |
| EPC and Owners Cost | % | 13 | [31] |
| Contingency | % | 7 | [31] |
| Operation & Maintenance O&M fixed cost by capacity | USD/kWe-y | 66 | [31] |
| O&M variable cost by energy produced | USD/MWhe | 3,5 | [31] |
Source: Authors.
Table 2.
Input data to design Gemasolar and Crescent Dunes plants.
| Parameter | Unit | Value | |
|---|---|---|---|
| Gemasolar | Crescent Dunes | ||
| Nominal DNI | W/m2 | 900 | 950 |
| Nominal daily insolation | kWh/m2/day | 9.5 | 10 |
| Plant’s nominal capacity | MWe | 19.9 [35] | 110 [36] |
| Peak flux density | kW/m2 | 830 [26] | 830 [26] |
| SR aspect ratio | - | 1.3 [37] | 1.136 [4] |
| Heliostat reflective area | m2 | 115.7 [34] | 115.7 [34] |
| Total error of the heliostat | mrad | 2.9 [34] | 2.9 [34] |
| PB efficiency | % | 40 [36] | 41.8 [38] |
| TES efficiency | % | 98.5 [38] | 99 [39] |
| SR efficiency | % | 89 [38] | 89 [38] |
Source: Authors.
Table 3.
(a) Comparison between predicted and actual design parameters for the case of Gemasolar. (b) Comparison between predicted and actual design parameters for the case of Crescent Dunes.
Table 3.
(a) Comparison between predicted and actual design parameters for the case of Gemasolar. (b) Comparison between predicted and actual design parameters for the case of Crescent Dunes.
| (a) | |||||
| Parameter | Unit | Actual Data [34,35,37] | SolarPILOT | Present Study | MBE (%) |
| SR nominal power | MWth | 120 | (¤) | 113.1 | 5.7 |
| SR area | m2 | 269.7 | (¤) | 285.6 | −5.9 |
| SR height | m | 10.6 | (¤) | 10.9 | −2.6 |
| SR diameter | m | 8.1 | (¤) | 8.4 | −3.2 |
| Tower height | m | 116 | (¤) | 111.5 | 3.9 |
| TES capacity | kWhth | 670 | (*) | 535.9 | 20.0 |
| Power incident on the SR | MWth | (*) | 137.1 | 127.1 | |
| Reflective area of the SF | m2 | 304,750 | 240,600 | 256,294.4 | 15.9 |
| Average absolute MBE | 8.2 | ||||
| (¤) SolarPILOT requires this data as input by the user. (*) Not available. | |||||
| (b) | |||||
| Parameter | Unit | Actual Data [36,39] | SolarPILOT | Present Study | MBE (%) |
| SR nominal power | MWth | 540 | (¤) | 627.0 | −16.1 |
| SR area | m2 | 1105.28 | (¤) | 1254.0 | −13.5 |
| SR height | m | 20 | (¤) | 21.3 | −6.5 |
| SR diameter | m | 17.6 | (¤) | 18.7 | −6.5 |
| Tower height | m | 220 | (¤) | 242.6 | −10.3 |
| Reflective area of the SF | m2 | 1,197,148 | 126,920 | 1,345,867 | −12.4 |
| Average absolute MBE | 9.3 | ||||
| (¤) SolarPILOT requires this data as input by the user. (*) Not available | |||||
Source: Authors.
Table 4.
Data of the selected site (including information about the real studied case).
| Data | Unit | Value |
|---|---|---|
| Mining process’s nominal power | kWe | 43,000 |
| Operation | - | 24 h/7 days |
| Province, Region | - | Copiapó, Atacama |
| Latitude, Longitude, Elevation | °/°/m | −27.53/−70.31/698 |
| Peak measured DNI | W/m2 | 1047 |
| Daily average DNI during January | kWh/m2/day | 10.93 |
| Yearly DNI | kWh/m2 | 3296 |
Table 5.
Design data of the considered PT plants.
| Component | Unit | Mining Process | 10 MWe | 20 MWe | 50 MWe | 100 MWe |
|---|---|---|---|---|---|---|
| Nominal power of the PB | MWe | 43 | 10 | 20 | 50 | 100 |
| Number of storage hours | Hour | 13.56 | 13.56 | 13.56 | 13.56 | 13.56 |
| Solar multiple | - | 2.30 | 2.30 | 2.30 | 2.30 | 2.30 |
| SR nominal power | MWth | 236.33 | 54.96 | 109.92 | 274.80 | 549.60 |
| SR intercept power | MWth | 265.54 | 61.75 | 123.51 | 308.77 | 617.53 |
| SR absorptive surface | m2 | 519.01 | 120.70 | 241.40 | 603.50 | 1206.99 |
| SR diameter | m | 11.64 | 5.61 | 7.94 | 12.55 | 17.75 |
| SR height | m | 14.20 | 6.85 | 9.68 | 15.31 | 21.65 |
| Tower height | m | 142.91 | 96.63 | 110.65 | 152.73 | 222.86 |
| Capacity of the TES | MWhth | 5758.29 | 1339.14 | 2678.27 | 6695.68 | 13,391.37 |
| Reflective area of the SF | m2 | 374,621.8 | 81,578.35 | 167,322.4 | 430,519.3 | 871,213.4 |
Table 6.
Nominal and annual efficiencies (%) of the solar receiver (SR), the thermal energy storage (TES), and the power block (PB) of PT plants [38].
Table 6.
Nominal and annual efficiencies (%) of the solar receiver (SR), the thermal energy storage (TES), and the power block (PB) of PT plants [38].
| Receiver | Storage | PB | |||
|---|---|---|---|---|---|
| Nominal | Annual | Nominal | Annual | Nominal | Annual |
| 90 | 78.6 | 98.5 | 99.6 | 41.83 | 41.0 |
Table 7.
Nominal and annual optical efficiencies of the solar field (SF).
| PT Plant | Nominal | Annual |
|---|---|---|
| Mining process (43 MWe) | 67.7 | 61.6 |
| 10 MWe | 72.3 | 63.9 |
| 20 MWe | 70.5 | 64.0 |
| 50 MWe | 68.5 | 62.7 |
| 100 MWe | 67.7 | 62.2 |
Table 8.
The input data of the economic assessment.
| Parameter | Value | Unit |
|---|---|---|
| Construction period | 2 | Years |
| Operation period | 25 | Years |
| Depreciation period | 5 | Years |
| Inflation rate | 2.30 [32] | % |
| Inflation of services | 1.00 [32] | % |
| Real discount rate | 2.50 [42] | % |
| Sales tax | 19 [33] | % |
| Degradation rate | 0.75 [27] | % |
| Average costs of electricity (period 2019) | 98.29 [44] | USD/MWe |
| Average yearly inflation in the prices | 1 [45] | % |
Source: Authors.
Table 9.
Economic indices of PT plants.
| PT Plant | TLCC | SPB | IRR | LCOE |
|---|---|---|---|---|
| Unit | Million USD | Year | % | USD/MWe |
| Mining process | 459 | 17 | 1.55 | 143 |
| 10 MWe | 115 | 19 | 0.77 | 156 |
| 20 MWe | 225 | 18 | 0.94 | 153 |
| 50 MWe | 525 | 17 | 1.74 | 140 |
| 100 MWe | 994 | 16 | 2.37 | 131 |
Publisher’s Note: MDPI stays neutral with regard to jurisdictional claims in published maps and institutional affiliations. |
© 2020 by the authors. Licensee MDPI, Basel, Switzerland. This article is an open access article distributed under the terms and conditions of the Creative Commons Attribution (CC BY) license (http://creativecommons.org/licenses/by/4.0/).
Share and Cite
MDPI and ACS Style
Behar, O.; Sbarbaro, D.; Morán, L. A Practical Methodology for the Design and Cost Estimation of Solar Tower Power Plants. Sustainability 2020, 12, 8708. https://0-doi-org.brum.beds.ac.uk/10.3390/su12208708
AMA Style
Behar O, Sbarbaro D, Morán L. A Practical Methodology for the Design and Cost Estimation of Solar Tower Power Plants. Sustainability. 2020; 12(20):8708. https://0-doi-org.brum.beds.ac.uk/10.3390/su12208708
Chicago/Turabian StyleBehar, Omar, Daniel Sbarbaro, and Luis Morán. 2020. "A Practical Methodology for the Design and Cost Estimation of Solar Tower Power Plants" Sustainability 12, no. 20: 8708. https://0-doi-org.brum.beds.ac.uk/10.3390/su12208708
Note that from the first issue of 2016, this journal uses article numbers instead of page numbers. See further details here.