Identifying Value-Increasing Actions for Cultural Heritage Assets through Sensitivity Analysis of Multicriteria Evaluation Results


National Research Council of Italy, Institute of Information Science and Technologies, Via Moruzzi 1, 56124 Pisa, Italy
Sustainability 2020, 12(21), 9238; https://0-doi-org.brum.beds.ac.uk/10.3390/su12219238
Submission received: 21 September 2020
/
Revised: 28 October 2020
/
Accepted: 3 November 2020
/
Published: 6 November 2020
(This article belongs to the Collection Indicators, Assessment Tools, and Rating Systems for Mainstreaming Sustainability in Urban Planning and Development)
Abstract
:This paper presents a brief overview of multicriteria decision making (MCDM) as applied to the evaluation of adaptive reuse projects for cultural heritage assets and proposes a strategy to plan interventions to increase their value. The value of an object can be defined from its fitness to fulfil specified objectives, its significance to the people who own or use it, its potential to produce revenues, and a host of other criteria depending on its nature. These criteria are often subjective, relying on judgements issued by several experts, stakeholders and decision makers. This is why the MCDM methods need to formalize the problem so as to make it suitable to be treated quantitatively. Moreover, its sensitivity to variable opinions must be studied to check the stability of the result. We propose to leverage sensitivity analysis to identify the lines of intervention that promise to be the most effective to increase the value of the asset. A simulated example illustrates this strategy. This approach promises to be useful when assessing the sustainability of a reuse or redevelopment project in the cases where the final destination of the asset is still under examination.
1. Introduction
Maintenance, exploitation, reuse and redevelopment of heritage assets are becoming more and more popular in our days, as the concept of cultural heritage is being extended from the original meaning of a collection of individual artworks to all the material and non-material assets that mark the history, the traditions and the identity of a population, as well as everything having an aesthetic, artistic or environmental value [1,2]. Managing this boundless heritage would be too expensive if only based on conservation [3]. Many assets, especially the ones related to real estate, can lose their significance if they do not have their specific use and, despite their cultural value, are not maintained for the unsustainable costs implied and their inability to generate adequate incomes.
The two needs of safeguarding everything has a cultural importance and finding the resources to do so are thus often addressed by seeking ways to exploit an asset economically without making it lose or diminish its value as a part of cultural heritage [3,4,5,6,7]. Planning such a kind of actions is complex for the multiple consequences to be foreseen, and may also be constrained by specific regulations put in force by the cultural heritage authorities. This means that many, possibly conflicting criteria must be taken into account when making a decision. Furthermore, not all these criteria are related to objective and measurable quantities, as some of them could rely on personal opinions of experts, authorities, users and other stakeholders. Methods of multicriteria decision making (MCDM) have been developed mainly in economics and industry to allow the decision maker to systematize, structure and solve quantitatively a decision problem involving multiple criteria that can be both quantitative-objective and qualitative-subjective. These methods first build a hierarchy of criteria, sub-criteria and further components whose function is to specify with increasing detail the meaning and the rationale of the criteria and the target decision. Following diverse strategies, the alternative decisions are then ranked in order of relevance. The top-ranking alternative is the action to be performed. Similar approaches have also been adopted to decide, rather than the possible actions to be undertaken, the “value” of an asset, that is, its suitability to be used or managed in some particular way. In those cases, the alternatives are not actions but value levels [8,9]. For this reason, here we often refer to multicriteria evaluation rather than multicriteria decision making. Possible actions to be undertaken, however, can be devised on the basis of the final value level assigned [8]. As generally acknowledged [10,11,12,13,14,15,16,17], it is also important to validate the MCDM results through a sensitivity analysis. This is conducted by studying the stability of the result as a function of the internal consistency of the individual opinions gathered, the level of conflict between different opinions and the influence of small variations in the derived parameters [11,15,16,17,18,19,20]. In other words, it is important to see whether a little change in the judges’ opinions would reverse the final priorities of the alternatives considered. Condon et al. [21] suggest a method to cluster the different opinions and reveal possible outliers, thus discouraging the judges from trying to bias the final solution towards their personal preferences. Goepel [22] proposes a consensus indicator to check the overall conflict among the different judgements. On the other hand, a conflict in opinions is perfectly natural in human judgements, and is not always motivated by fraudulent intents. By pointing at the amount of variation that would be necessary to alter the final priorities, the robustness indices determined through sensitivity analysis can help the decision makers to assess how likely would be a rank reversal as the effect of outliers or internally inconsistent data. It is intuitively apparent that the more judges are involved in the decision problem, the less sensitive is the result to the inclusion or exclusion of possible outliers in the opinion pool.
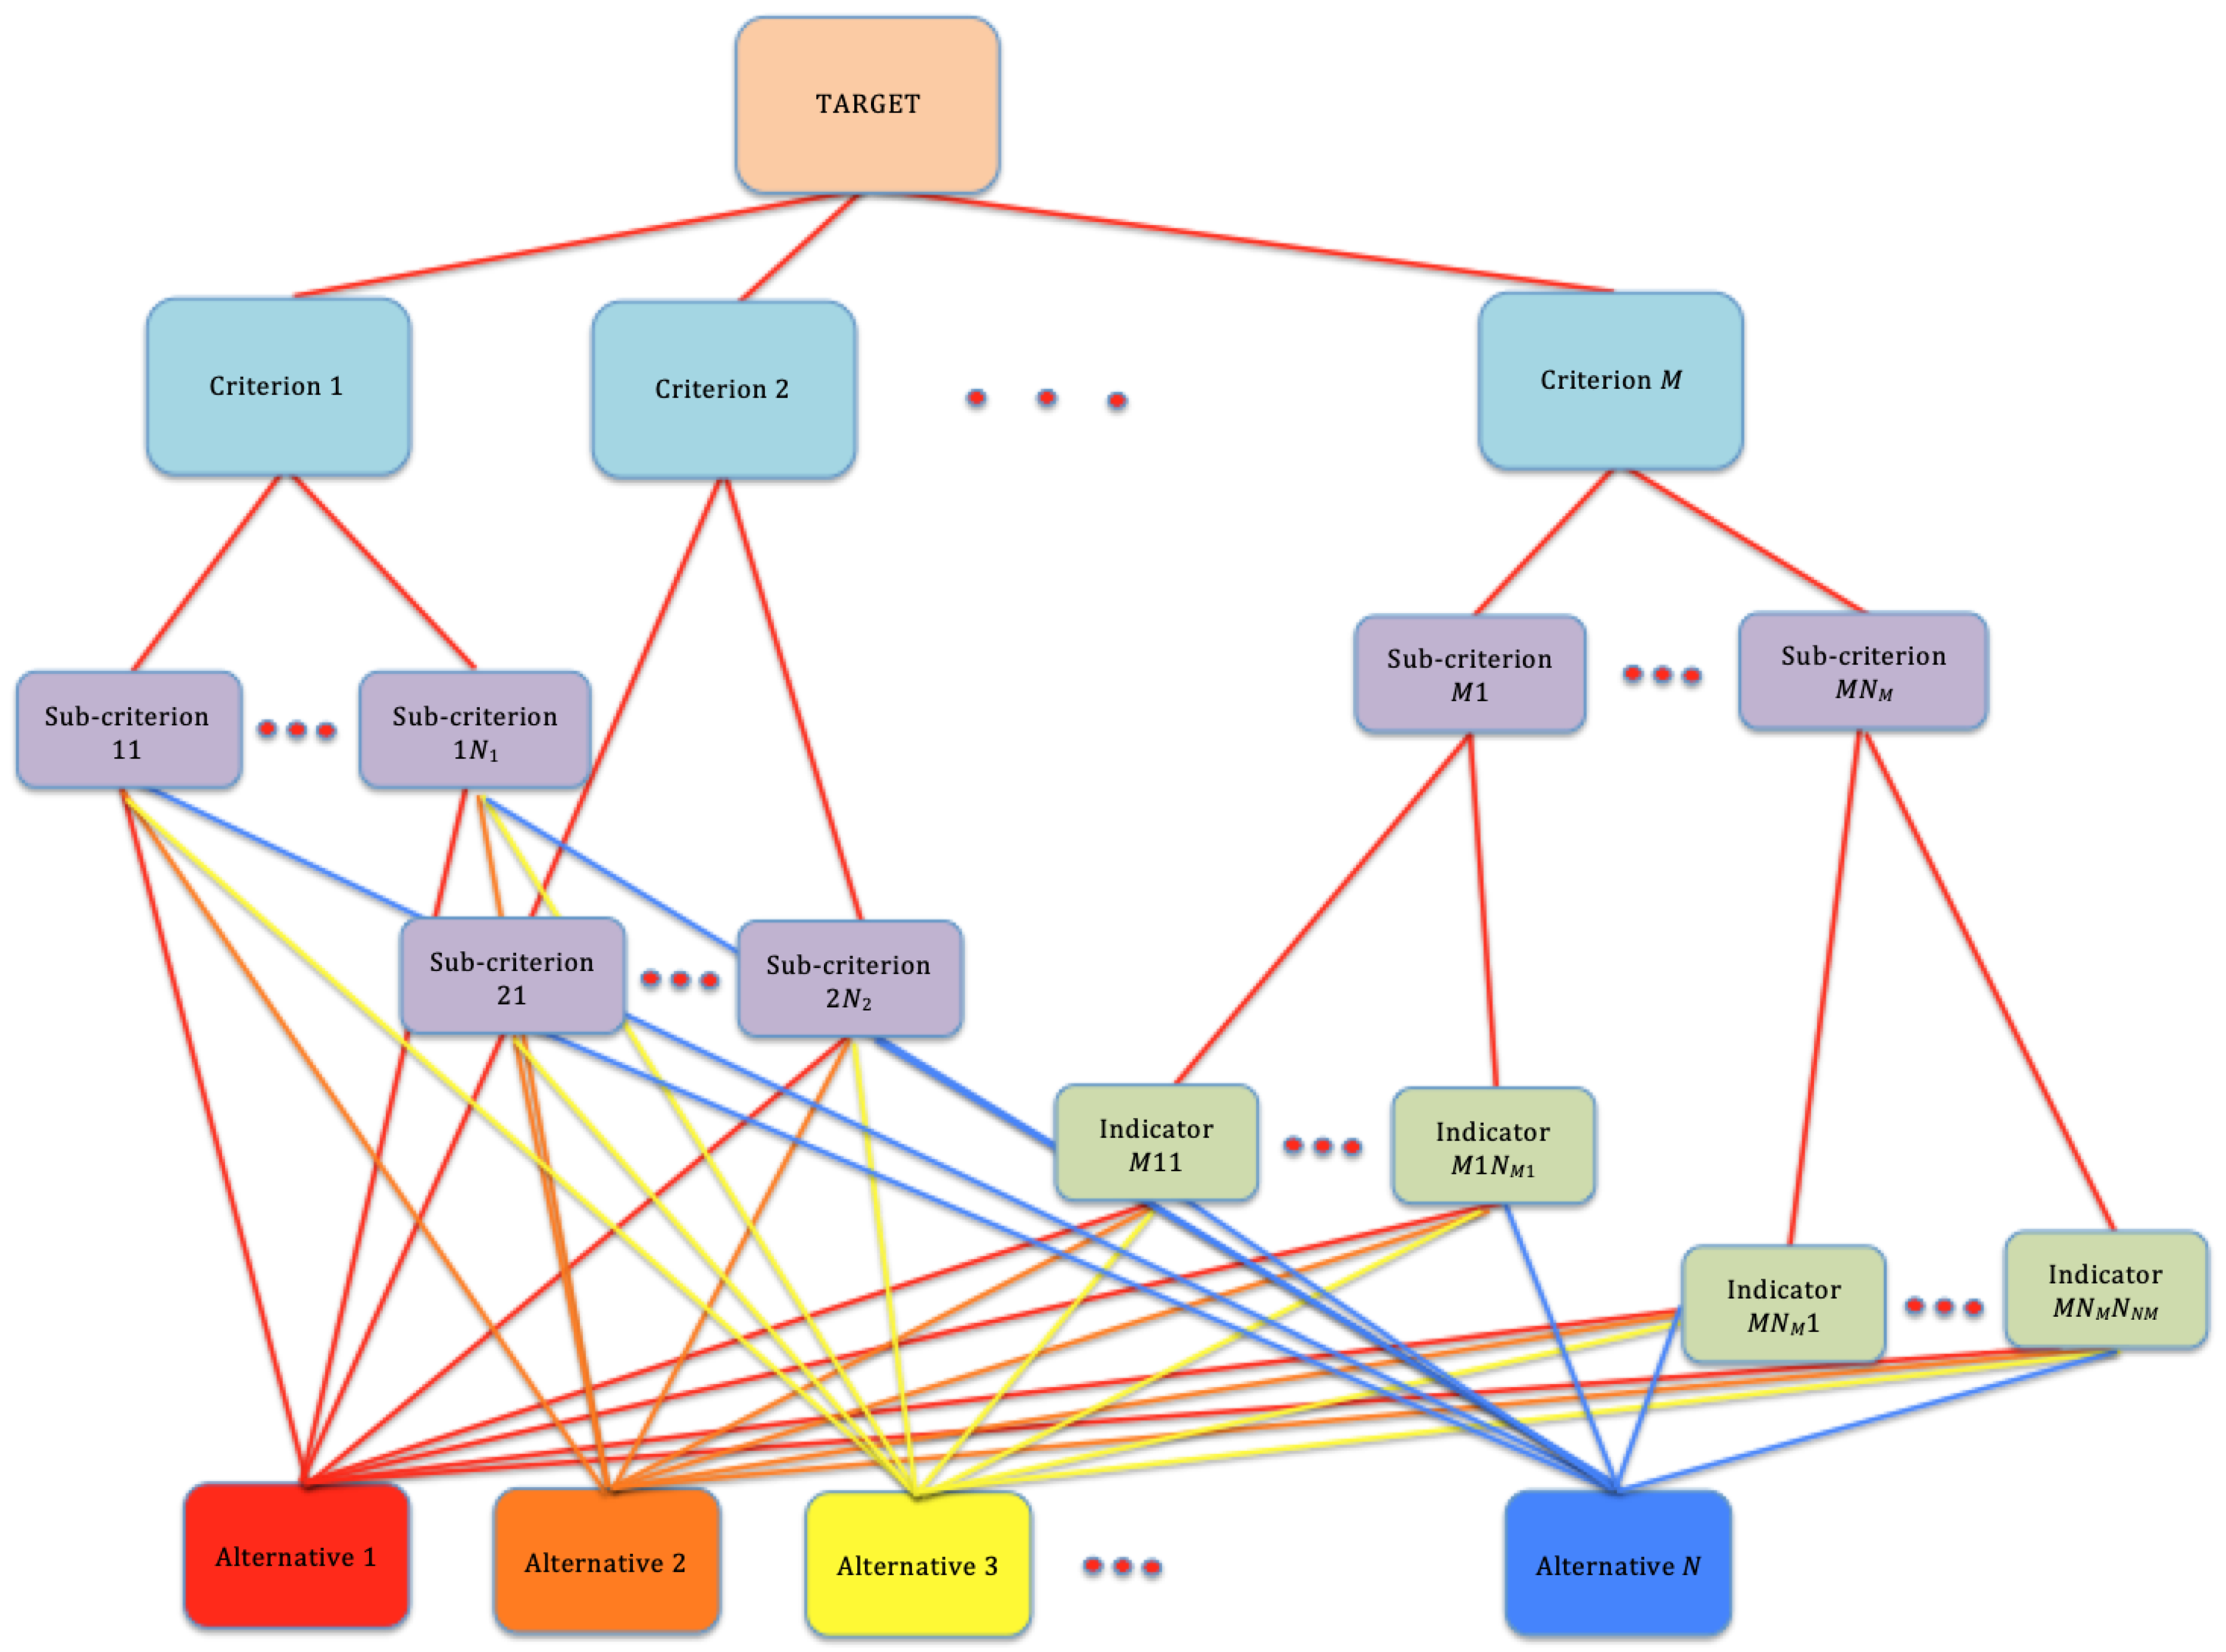
Any quantitative strategy to assess a decision-making problem must put it in a mathematically tractable form. Brugha [10] lists a number of desirable properties for these forms. Following the so-called hierarchical decision model (HDM) and starting from the target decision, one can group together subsets of requirements to obtain a few top-level judgement criteria, further specified by increasingly detailed elements, each equipped with a specific weight. Thus, a multilayered hierarchical tree is formed, whose leaves represent the alternative decisions to be made. These are ranked by assigning their relevances to the lowest-level components and propagating them up the hierarchy using the criteria weights. Finally, the alternatives are scored and sorted to form a global ranking. Figure 1 shows a graphical representation of a generic hierarchy with five layers. Note that not all the branches of the tree must have the same depth. In the case depicted, for example, the subtree descending from Criterion M has three layers, whereas the ones descending from Criteria 1 and 2 have two layers. Following [11], the nodes called “criteria”, “sub-criteria” and “indicators” in the figure are generically denoted here as “contributions”.
The MCDM methods differentiate in the strategies adopted to assign relative importances to all the contributions and to rank the alternatives for the target decision. Dozens of methods have been developed and proposed [23]. Several problems related to cultural heritage (especially regarding the reuse of buildings) have been addressed through MCDM methods. Even though the related papers are still a small part of the literature, their number has been steadily increasing in the last few years [24]. Della Spina [25], dealing with sustainable cultural heritage reuse in urban development, mentions 16 different methods, highlighting the most popular: the analytic hierarchy process (AHP [26]), the step-wise weight assessment ratio analysis (SWARA [27]), the best worst method (BWM [28]) and the full consistency Method (FUCOM [29]). The choice of the best suited methods depends upon the specific problem. Choosing an optimal method is not easy, whereas a number of criteria have been established to highlight the relative advantages offered by the different approaches. The most common proposals in cultural heritage studies favor hybrid methods, where different strategies are applied in the different phases of the ranking process. Liu et al. [8] propose an evaluation method for industrial heritage using an AHP framework, but assigning the basic relevances through the Dempster–Shafer mass-composition rule [30]. Claver et al. [31] address a similar problem, and propose AHP for the evaluation of industrial heritage, followed by another AHP application, adapted to the specific features of each asset, to choose among the possible uses. Giove et al. [32], dealing with a problem of reuse of historical buildings, rely on measuring the consensus within a group of experts to analyze the sustainability of the possible reuse scenarios. Zhu et al. [12] propose a new version of AHP for scoring the criteria to evaluate a design concept and an improved VIKOR method [33] to evaluate the related alternatives. Pinto et al. [34] propose to integrate AHP and EVAMIX [35] for the assessment of building reuse projects. The approach proposed by Giuliani et al. [36] to decide the best reuse of historical industrial buildings is similar to AHP in the composition of weights and scores, but the individual values are established directly by the expert evaluators. Xue et al. [9] deal with the communication of intangible cultural heritage, and apply AHP after consulting a selected group of experts through the Delphi method [37]. In the mentioned work by Della Spina [25], AHP is used to compute the weights and EVAMIX to rank the alternatives.
As far as sensitivity analysis is concerned, Triantaphyllou and Sánchez [16] and Chen and Kocaoglu [11] propose methods to compute indices of sensitivity for different MCDM strategies. Triantaphyllou and Sánchez propose a method suitable for AHP as well as for the weighted sum model (WSM [38]) and the weighted product model (WPM [39]). Addressing the problem parameters one by one, they define the “most critical criterion” and the “most critical performance index” (see Section 2), in terms of the minimum absolute or percent variations necessary to produce a rank reversal. A small minimum variation in a contribution denotes a high sensitivity of the final ranking to that contribution. Chen and Kocaoglu evaluate the sensitivity of an HDM strategy towards variations of multiple contributions, at any layer of the hierarchy. The result is a multidimensional “allowed region”, where the parameters can range without altering the final ranking. This region is independent of the comparison scale used, the judgement quantification and the group opinion combination.
This paper addresses a methodological issue: rather than seeking robustness, we propose to use the sensitivity analysis results to identify the components in the hierarchy on which we can most easily act to increase the value of the asset. Indeed, sensitivity analysis can help planning actions to increase the value of the asset under study, by either reconsidering the importance of the evaluation criteria or making the asset more fit to a fixed destination. In the first case, reconsidering the relevance of the criteria entails the choice of the asset’s best use; in the second case, the relevance of the criteria remains fixed and the possible actions should affect those local contributions to which the global value is most sensitive. Hereafter, we take AHP [26] as an example MCDM method, since it is the most popular in decisions related to cultural-heritage buildings, alone or in combination with others [24]. Whereas the concept of value depends on the use for which an object is intended, our results show that this strategy promises to be a viable and simple tool for assessing an evaluation problem based on many criteria, in view of possibly unidentified alternative uses, or specific interventions intended to increase the value for an already specified use. The theoretical background of this method is presented in Section 2, based on the stability analysis proposed in [16], as applied to AHP. In Section 3, an example is used to demonstrate how this method works. Some final remarks are reported in Section 4.
2. Methods
First of all, we report a brief description of AHP. For the sake of simplicity, we only refer to a three-level hierarchy, where the top level is in our case the value of a cultural heritage object. Many aspects and criteria concur to form the concept of value for cultural heritage (see for example [40]). The most relevant criteria, as chosen by the decision makers, constitute the second layer of the hierarchy. At the third and lowest level, there are the alternatives, here represented by a set of N value levels. The related hierarchical tree can be derived by just removing the purple and green layers from Figure 1. More complicated structures, including sub-criteria, sub-sub-criteria and further contributions and hierarchical layers, do not differ conceptually from the one described here.
As proposed in [14,26], each member of a group of expert “judges” is asked to compare all the possible pairs of criteria and all the possible pairs of alternatives per criterion, using a comparison scale with 9 integer values, ranging from 1, denoting equal importance, to 9, meaning that the contribution being examined (Contribution A) is extremely more important than the contribution being compared to it (Contribution B). The reciprocal of the appropriate value is used to characterize the comparison when Contribution A is less important than Contribution B; for example, the value 1/9 means that Contribution A is much less important than Contribution B. The result of each group of comparisons is a positive reciprocal square matrix [41], called judgement matrix, whose general form is
![Sustainability 12 09238 i001]() with . Each entry in R represents the comparison between the contribution denoting the row, considered as Contribution A, and the contribution denoting the column, considered as Contribution B. Thus, each results from the pairwise comparison between contribution i and contribution j, and assumes one of the integer values mentioned above or their reciprocals. Of course, the entries in the main diagonal are all equal to 1, each resulting from the comparison of a contribution with itself. With N alternatives and M criteria, each judge produces M judgement matrices , of order N, containing the mutual importances of the alternatives with respect to the criteria, and a judgement matrix W, of order M, containing the mutual importances of the criteria with respect to the target. A final set of judgement matrices is obtained through an element-by-element geometric mean of the corresponding matrices produced by all the judges. In the original AHP formulation by Saaty [26], the dominant eigenvector of one such matrix, scaled so as to make its elements sum up to 1, contains the scores attained by the contributions to be ranked. In a perfectly consistent positive reciprocal matrix of order N, that is, one that does not contain any contradictory judgement, the maximum eigenvalue is equal to N. Kułakowski [19] gives the definition of such a matrix, and provides a number of criteria to assess the consistency of a generic reciprocal matrix. Saaty uses the maximum eigenvalue (which is always ) to compute a consistency ratio depending on N, whose value should not exceed a threshold of 0.1.
with . Each entry in R represents the comparison between the contribution denoting the row, considered as Contribution A, and the contribution denoting the column, considered as Contribution B. Thus, each results from the pairwise comparison between contribution i and contribution j, and assumes one of the integer values mentioned above or their reciprocals. Of course, the entries in the main diagonal are all equal to 1, each resulting from the comparison of a contribution with itself. With N alternatives and M criteria, each judge produces M judgement matrices , of order N, containing the mutual importances of the alternatives with respect to the criteria, and a judgement matrix W, of order M, containing the mutual importances of the criteria with respect to the target. A final set of judgement matrices is obtained through an element-by-element geometric mean of the corresponding matrices produced by all the judges. In the original AHP formulation by Saaty [26], the dominant eigenvector of one such matrix, scaled so as to make its elements sum up to 1, contains the scores attained by the contributions to be ranked. In a perfectly consistent positive reciprocal matrix of order N, that is, one that does not contain any contradictory judgement, the maximum eigenvalue is equal to N. Kułakowski [19] gives the definition of such a matrix, and provides a number of criteria to assess the consistency of a generic reciprocal matrix. Saaty uses the maximum eigenvalue (which is always ) to compute a consistency ratio depending on N, whose value should not exceed a threshold of 0.1.

Denoting by the dominant eigenvector of the judgement matrix , its i-th element, , is called the local priority of Alternative i with respect to Criterion j. Analogously, if is the dominant eigenvector of the judgement matrix W, its j-th element, , is called the weight of Criterion j. All these values form the decision matrix, shown in Table 1. In AHP [26,42], the elements of the vector of the global priorities are computed from the elements of the decision matrix through the following formula:
is the final score assigned to the i-th alternative. The final ranking is made by sorting the ’s in descending order. If there exists an index such that for all , then the -th alternative is the preferred one.
In their sensitivity analysis, Triantaphyllou and Sánchez [16] determine which is the most critical criterion and the most critical local priority for the rank reversal of any two alternatives. For criterion k and for the pair of local priorities and , the threshold variation in such that the global priorities and are reversed in the final ranking is
In relative terms, this threshold becomes
The most critical criterion in absolute or relative terms, respectively, is the one corresponding to the minimum of or for all k, i and j. If we replace at least with , or , the global priorities and will be reversed. A criterion is said to be robust if or, alternatively, if , for all i and j, since the negative variation that should be applied to for rank reversal is larger than itself. This means that the priority between the alternatives i and j cannot be reversed by any variation in . In this case, the absolute or relative threshold computed through the above equation is said to be non-feasible. A second problem is to establish which is the most critical local priority (or “performance index”, in [16]) with respect to a criterion, that is, which is the that must be changed less among all the local priorities with respect to Criterion j so that the global priorities and are inverted. To this end, another threshold is established, again, in absolute terms:
or in relative terms:
Computing these thresholds is useful to assess the stability of our result against possible variations of the criterion weights or the local priorities caused by possible outliers in the judgement pool. Once a threshold has been computed, and depending on the number of judges, the analyst can decide the trust to entitle to a criterion or a local priority and, eventually, whether the structure assigned to the decision problem is effective or not.
Our proposal here is to use sensitivity analysis to foresee the effects of possible actions undertaken to increase the value of a cultural heritage asset. Indeed, rather than requiring low sensitivity, we can locate the most sensitive contributions able to increase the value of an asset by acting on either its present status or its context, that is, the ones that are most likely to rank-reverse the current value level and some higher level in the set of alternatives.
Once a specific use has been chosen for the asset under study, the value of the related project can be assessed through an MCDM procedure. The criteria weights do not change if the status of the asset is (planned to be) changed: they only depend on its expected use, and the expert group is not likely to change their judgements on criteria as a result of any action performed on the asset. Thus, trying to increase the value by acting on the criteria weights means evaluating the asset in view of a different use. If a low threshold is found for a criterion, the decision makers would be encouraged to explore the possibility of providing a different destination for the asset under study, so that the importance of that criterion can increase the final value when assessed against the new destination. In the presence of robust criteria, no alternative use can increase the asset value. Choosing the most appropriate destination is an important issue, widely considered in both the literature and the current cultural heritage regulations. The definition of the highest and best use (HBU) clarifies the criteria to be followed. Whereas dedicated MCDM methods have been developed to make this choice [3,7,8,36], the method proposed here evaluates the suitability of the asset to a specific use and helps to identify possibly more suitable destinations, even if these are not part of a pre-defined set. In this sense, the method proposed can be particularly useful in a preliminary assessment, when neither a specific destination nor a detailed plan have been defined.
Conversely, if a low threshold (5) or (6) is found for a local priority that can increase the final value, all the actions to change favorably the judges’ opinion on that contribution are likely to increase the value for the expected use. Acting on contributions with higher thresholds would be less likely to reach the desired result. These considerations can help the decision makers to identify a class of actions able to positively affect the selected local priorities, and then plan a set of specific interventions and submit again the evaluation problem to the experts to check their effect on the final result.
3. An Explanatory Example
To better describe the strategy outlined above, we rely on a simple example, with a decision matrix produced by an AHP evaluation of an architectural asset in view of a proposed adaptive reuse project (see also [43,44]). The value with the highest priority, , can be considered as a measure of desirability of the project to be implemented. Here, we use the judgement criteria and the related weights adopted in part of the case study considered in [25]: six abandoned defensive buildings near the Italian cities of Reggio Calabria and Messina were to be evaluated against a set of possible reuses in order to choose the best site for each different scenario. In our case, we assume that the reuse destination has been fixed and we want to increase the value of a single asset (Fort Beleno) in this context. All the criteria and indicators used, along with their weights, are reported in Table 2, but the sensitivity analysis in this example is made on the three top-layer criteria and the related local priorities. To build the AHP matrices, we adopt five value levels: Very high, High, Medium, Poor and Very poor. As explained, for each indicator, a matrix of the type (1) is constructed, based on the actual information provided in [25] for the asset chosen. Such matrices are not shown here for simplicity. Then, the dominant eigenvectors of these matrices, grouped by criterion, are composed through their weights by a formula of the type (2) to form the local priorities of the value levels against the criteria. In turn, these local priorities are composed through their weights by formula (2) to obtain the global priorities. Table 3 reports the resulting decision matrix for the Criterion layer and the derived global priorities.
As the maximum global priority is , the value of the asset is considered High. Note that the score obtained by the level Medium is significantly higher than the one obtained by Very High. To increase the value of the asset, we thus should try to reverse the rankings of Very High and High or Very High and Medium.
The sensitivity analysis with respect to the criteria has been carried out using the absolute thresholds in Equation (3). The values related to the two mentioned priority inversions are shown in Table 4, where means non-feasible (see Section 2).
As can be seen, no variation in the criterion weights would be capable of increasing the priority of Very High so as to prevail on the priorities of High or Medium. This means that, with fixed criteria, changing the expected reuse can change the final ranking among the value levels, but cannot move the top-ranking alternative from its current position. Having found all non-feasible thresholds, computing the relative thresholds by Equation (4) would bring us to the same conclusion.
Looking at the threshold variations in local priorities can allow for devising value-increasing interventions within the current reuse hypothesis. To do this, we use the relative thresholds of Equation (6), whose values are shown in Table 5, again, limited to the rows relevant to the rank inversions we are looking for. The ordering of the pairs is significant: the value reported in each cell represents the percent amount by which the local priority for the left-hand alternative must be changed to reverse its ranking with respect to the right-hand alternative. Reversing the ranking, however, does not mean that one of the two alternatives becomes dominant: this must be checked a posteriori, by explicitly computing the new ranking.
From rows “1-2” and “1-3” in the table, under Criterion 2, we see that increasing the value of of more than a 194% would bring the priority of Very High above the ones of High and Medium, thus reaching our goal. Looking at Criterion 3 instead, we see that increasing by more than 395% can make the score of Very High higher than the one of High, whereas increasing it by more than 288% makes the score of Very High higher than the one of Medium. Similar considerations could also be made for Criterion 1, probably requiring more challenging actions. Apparently, planning meliorative interventions under Project Sustainability could seem less demanding than under the other criteria, but the feasibility and the costs of the conceivable actions should also be taken into account. Here, we restrict ourselves to show the alterations in the final rankings as effects of the mentioned changes. After renormalization (see [16]), the second column of Table 3 obtained by increasing by 200% becomes
leading to the new final scores
that is, being the maximum score, establishing the new value to Very High. Acting on economic sustainability so as to increase by 400%, the new third column of Tab. Table 3 becomes
leading to
which shows that, also in this case, the final value level is increased. Would have only been increased by a 300%, the result would be
and
that is, the value level is still High, but in this case the score obtained by Very High is higher than that of Medium, and the cumulative score of the levels from Very High to Medium is 0.655, whereas, from Table 3, a cumulative score of 0.698 is obtained for the levels from High to Poor.
4. Discussion
We propose to use the sensitivity analysis of an HDM procedure to help planning actions to increase the value of an asset in the collective opinion of a pool of expert judges. In evaluating a cultural heritage asset in view of its reuse, acting on the most sensitive criteria and local priorities has the effect of maximizing the result (with minimum effort) in terms of the final value. The procedure outlined in Section 2 and Section 3 can be a useful tool to explore a multi-criteria evaluation result to find the contributions whose variations are most likely to increase the value of the asset of interest. In Section 3, we have shown how easily the most sensitive contributions able to increase the final value can be found. Identifying these contributions can help devising possible meliorative actions on the asset or its context. Following the sensitivity analysis proposed in [16], this can be done by considering one contribution at a time. Note that, once the local priority to act on is determined, the presence of further layers in the hierarchical model can be used to better devise the actions to be undertaken, by just adopting recursively the same procedure followed here. The indicators provided in Table 2, for example, can be the contributions whose values could be targeted to influence positively the values of the subtending criteria. Adopting the analysis proposed in [11], a more comprehensive vision could be achieved considering the allowable perturbation regions in the space spanned by all the contributions and identifying the groups of weights or local priorities that can most easily and advantageously go out of those regions. This option should be studied in the future, possibly examining its potential advantages when addressing an HBU or value-increase problem for a specific project.
Two further considerations are in order. First, from the viewpoint of a ruling/sponsoring authority, any possible meliorative action could not only be a direct intervention on the asset [45]: referring to Table 2, urban sustainability, for example, can be improved by modifying the general conditions of the neighborhood, such as “Quality of the urban landscape” or “Accessibility by private car”, whereas economic sustainability could be improved by acting on the “Financial appeal for private investors”, e.g., by introducing advantageous taxation conditions. The method proposed here could thus enable a public authority to allocate a budget and select suitable actions (see also [4]) to encourage private investors to undertake a redevelopment and reuse of a historical-architectural asset, which could not be possible with the available public funds. See, for example, [5,46,47] for the different combinations of public and private interventions and the different kinds of possible private stakeholders. To date, this is a popular topic of research and debate in architecture and urban development, as testified by the number of relevant papers published per year in the international literature [24]. Secondarily, as any planned intervention on an urban neighborhood normally raises diverse reactions and objections [48], exposing the results of this method to publicly motivate the project and the possible improvements sponsored by the public authority on the urban environment could be useful to alleviate the conflicts between decision makers, local inhabitants and other stakeholders.
Funding
This research received no external funding.
Conflicts of Interest
The author declare no conflict of interest.
Abbreviations
The following abbreviations are used in this manuscript:
| AHP | Analysis of the Hierarchical Process |
| BWM | Best Worst Method |
| EVAMIX | Evaluation of Mixed Data |
| FUCOM | Full Consistency Method |
| HBU | Highest and Best Use |
| HDM | Hierarchical Decision Model |
| MCDM | Multicriteria Decision Making |
| SWARA | Step-Wise Weight Assessment Ratio Analysis |
| VIKOR | Multicriteria Optimization and Compromise Solution |
| (Serbian, Visekriterijumska Optimizacija I Kompromisno Resenje) | |
| WPM | Weighted Product Model |
| WSM | Weighted Sum Model |
References
- Wikipedia Contributors. Cultural Heritage. Wikipedia, The Free Encyclopedia, last revision 15 July 2020. Available online: https://en.wikipedia.org/w/index.php?title=Cultural_heritage&oldid=967818316 (accessed on 5 November 2020).
- Valagussa, A.; Frattini, P.; Crosta, G.B.; Spizzichino, D.; Leoni, G.; Margottini, C. Hazard ranking of the UNESCO world heritage sites (WHSs) in Europe by multicriteria analysis. J. Cult. Herit. Manag. Sust. Devel. 2020. Ahead of print. [Google Scholar] [CrossRef]
- Ribera, F.; Nesticò, A.; Cucco, P.; Maselli, G. A multicriteria approach to identify the Highest and Best Use for historical buildings. J. Cult. Herit. 2020, 41, 166–177. [Google Scholar] [CrossRef]
- Nesticò, A.; Macchiaroli, M.; Pipolo, O. Costs and benefits in the recovery of historic buildings: The application of an economic model. Sustainability 2015, 7, 14661–14676. [Google Scholar] [CrossRef] [Green Version]
- Calabrò, F.; Della Spina, L. La fattibilità economica dei progetti. LaborEst 2018, 16. (In Italian) [Google Scholar] [CrossRef]
- D’Alpaos, C.; Valuzzi, M.R. Protection of cultural heritage buildings and artistic assets from seismic hazard: A hierarchical approach. Sustainability 2020, 12, 1608. [Google Scholar] [CrossRef] [Green Version]
- Morano, P.; Locurcio, M.; Tajani, F. Cultural heritage valorization: An application of AHP for the choice of the highest and best use. Procedia Soc. Behav. Sci. 2016, 223, 952–959. [Google Scholar] [CrossRef]
- Liu, F.; Zhao, Q.; Yang, Y. An approach to assess the value of industrial heritage based on Dempster-Shafer theory. J. Cult. Herit. 2018, 32, 210–220. [Google Scholar] [CrossRef]
- Xue, K.; Li, Y.; Meng, X. An evaluation model to assess the communication effects of intangible cultural heritage. J. Cult. Herit. 2019, 40, 124–132. [Google Scholar] [CrossRef]
- Brugha, C.M. Structure of multi-criteria decision-making. J. Oper. Res. Soc. 2004, 55, 1156–1168. [Google Scholar] [CrossRef]
- Chen, H.; Kocaoglu, D.F. A sensitivity analysis algorithm for hierarchical decision models. Eur. J. Oper. Res. 2008, 185, 266–288. [Google Scholar] [CrossRef]
- Zhu, G.-N.; Hu, J.; Qi, J.; Gu, C.C.; Peng, Y.H. An integrated AHP and VIKOR for design concept evaluation based on rough number. Adv. Eng. Inf. 2015, 29, 408–418. [Google Scholar] [CrossRef]
- Ishizaka, A.; Labib, A. Review of the main developments in the analytic hierarchy process. Exp. Syst. Appl. 2011, 38, 14336–14345. [Google Scholar] [CrossRef] [Green Version]
- Saaty, T.L. On the Measurement of Intangibles. A Principal Eigenvector Approach to Relative Measurement Derived from Paired Comparisons. Not. AMS 2013, 60, 192–208. [Google Scholar] [CrossRef]
- Apostolou, B.; Hassel, J.M. An empirical examination of the sensitivity of the analytic hierarchy process to departures from recommended consistency ratios. Math. Comput. Model. 1993, 17, 163–170. [Google Scholar] [CrossRef]
- Triantaphyllou, E.; Sánchez, A. A sensitivity analysis approach for some deterministic multi-criteria decision-making methods. Decis. Sci. 1997, 28, 151–194. [Google Scholar] [CrossRef]
- Bafahm, A.; Sun, M. Some conflicting results in the analytic hierarchy process. Int. J. Inf. Technol. Decis. Mak. 2019, 18, 465–486. [Google Scholar] [CrossRef]
- Saaty, T.L.; Vargas, L.G. Inconsistency and rank preservation. J. Math. Psycol. 1984, 28, 205–214. [Google Scholar] [CrossRef]
- Kułakowski, K. Notes on order preservation and consistency in AHP. Eur. J. Oper. Res. 2015, 245. [Google Scholar] [CrossRef] [Green Version]
- Karthikeyan, R.; Venkatesan, K.G.S.; Chandrasekar, A. A Comparison of Strengths and Weaknesses for Analytical Hierarchy Process. J. Chem. Phar. Sci. 2016, 9, S12–S15. [Google Scholar]
- Condon, E.; Golden, B.; Wasil, E. Visualizing group decisions in the analytic hierarchy process. Comp. Oper. Res. 2003, 30, 1435–1445. [Google Scholar] [CrossRef]
- Goepel, H.D. Implementing the Analytic Hierarchy Process as a Standard Method for Multi-Criteria Decision Making In Corporate Enterprises—A New AHP Excel Template with Multiple Inputs. In Proceedings of the International Symposium on the Analytic Hierarchy Process, Kuala Lumpur, Malaysia, 23–36 June 2013; pp. 1–10. [Google Scholar] [CrossRef] [Green Version]
- Mardani, A.; Jusoh, A.; Nor, K.; Khalifah, Z.; Zakwan, N.; Valipour, A. Multiple criteria decision-making techniques and their applications—A review of the literature from 2000 to 2014. Econ. Res. 2015, 28, 516–571. [Google Scholar] [CrossRef]
- Morkūnaitė, Z.; Kalibatas, D.; Kalibatenė, D. A bibliometric data analysis of multi-criteria decision making methods in heritage buildings. J. Civ. Eng. Manag. 2019, 25, 76–99. [Google Scholar] [CrossRef]
- Della Spina, L. Adaptive sustainable reuse for cultural heritage: A multiple criteria decision aiding approach supporting urban development processes. Sustainability 2020, 1363. [Google Scholar] [CrossRef] [Green Version]
- Saaty, T.L. The Analytic Hierarchy Process; McGraw-Hill: New York, NY, USA, 1980. [Google Scholar]
- Zolfani, S.H.; Yazdani, M.; Zavadskas, E.K. An extended stepwise weight assessment ratio analysis (SWARA) method for improving criteria prioritization process. Soft Comp. 2018, 22, 7399–7405. Available online: https://0-link-springer-com.brum.beds.ac.uk/article/10.1007/s00500-018-3092-2 (accessed on 3 November 2020). [CrossRef]
- Rezaei, J. Best-worst multi-criteria decision-making method. Omega 2015, 53, 49–57. [Google Scholar] [CrossRef]
- Pamučar, D.; Stević, Z.; Sremac, S. A new model for determining weight coefficients of criteria in MCDM models: Full consistency method (FUCOM). Symmetry 2018, 10, 393. [Google Scholar] [CrossRef] [Green Version]
- Beynon, M.; Curry, B.; Morgan, P. The Dempster-Shafer theory of evidence: An alternative approach to multicriteria decision modelling. Omega 2000, 28, 37–50. [Google Scholar] [CrossRef]
- Claver, J.; Sebastian, M.A.; Sanz-Lobera, A. Opportunities of the multicriteria methods in the study of immovable assets of the Spanish industrial heritage. Procedia Eng. 2015, 132, 175–182. [Google Scholar] [CrossRef] [Green Version]
- Giove, S.; Rosato, P.; Breil, M. An application of multicriteria decision making to built heritage. The redevelopment of Venice Arsenale. J. Multi-Crit. Decis. Anal. 2011, 17, 85–99. [Google Scholar] [CrossRef]
- Opricovic, S.; Tzeng, G.-H. The Compromise solution by MCDM methods: A comparative analysis of VIKOR and TOPSIS. Eur. J. Oper. Res. 2004, 156, 445–455. [Google Scholar] [CrossRef]
- Pinto, M.R.; De Medici, S.; Senia, C.; Fabbricatti, K.; De Toro, P. Building reuse: Multi-criteria assessment for compatible design. Int. J. Des. Sci. Technol. 2017, 22, 165–193. [Google Scholar]
- Voogd, H. Multicriteria Evaluation for Urban and Regional Planning; Pion: London, UK, 1984. [Google Scholar]
- Giuliani, F.; De Falco, A.; Landi, S.; Bevilacqua, M.G.; Santini, L.; Pecori, S. Reusing grain silos from the 1930s in Italy. A multi-criteria decision analysis for the case of Arezzo. J. Cult. Herit. 2018, 29, 145–159. [Google Scholar] [CrossRef]
- Linstone, H.A.; Turoff, M. The Delphi Method: Techniques and Applications; Addison-Wesley: Reading, MA, USA, 1975. [Google Scholar]
- Fishburn, P.C. Additive Utilities with Incomplete Product Set: Applications to Priorities and Assignments; ORSA Publication: Baltimore, MD, USA, 1967. [Google Scholar]
- Chen, S.J.; Hwang, C.L. Fuzzy Multiple Decision Making; LNEMS 375; Springer: Berlin, Germany, 1992. [Google Scholar]
- De la Torre, M. (Ed.) Assessing the Values of Cultural Heritage; Research Report; The Getty Conservation Institute: Los Angeles, CA, USA, 2002. [Google Scholar]
- Bebiano, N.; Fernandes, R.; Furtado, S. Reciprocal matrices: Properties and approximation by a transitive matrix. Comput. Appl. Math. 2020, 39, 50. [Google Scholar] [CrossRef]
- Barzilai, J.; Lootsma, F.A. Power relations and group aggregation in the multiplicative AHP and SMART. J. Multi-Crit. Decis. Anal. 1997, 6, 155–165. [Google Scholar] [CrossRef]
- Aigwi, I.E.; Ingham, J.; Phipps, R.; Filippova, O. Identifying parameters for a performance-based framework: Towards prioritising underutilised historical buildings for adaptive reuse in New Zealand. Cities 2020, 102, 102756. [Google Scholar] [CrossRef]
- Radziejowska, A.; Sobotka, A.; Sagan, J. Support of decision in buildings refurbishment with a change of utility. Tech. J. 2020, 14, 162–167. [Google Scholar] [CrossRef]
- Della Spina, L. A multi-level integrated approach to designing complex urban scenarios in support of strategic planning and urban regeneration. In New Metropolitan Perspectives; Calabrò, F., Della Spina, L., Bevilacqua, C., Eds.; Springer Nature: Cham, Switzerland, 2019; Volume 1, pp. 226–237. [Google Scholar] [CrossRef]
- Aas, C.; Ladkin, A.; Fletcher, J. Stakeholder collaboration and heritage management. Ann. Tour. Res. 2005, 32, 28–48. [Google Scholar] [CrossRef] [Green Version]
- Perée, E.; Välilä, T. A Primer on Public Investment in Europe. In Public Investment and Public-Private Partnerships. Procyclicality of Financial Systems in Asia; Schwartz, G., Corbacho, A., Funke, K.K., Eds.; Palgrave Macmillan: London, UK, 2008; p. 21. [Google Scholar]
- Mualam, N.; Alterman, R. Architecture is not everything: A multi-faceted conceptual framework for evaluating heritage protection policies and disputes. Int. J. Cult. Pol. 2020, 26, 291–311. [Google Scholar] [CrossRef]
Figure 1.
A generic hierarchy for a problem structured by a hierarchical decision model (HDM). There are five hierarchical layers: the top layer (pink) includes the target decision; immediately below, there is the criterion layer (light blue), then the sub-criterion layer (purple) and the indicator layer (light green). At the bottom of the hierarchy, there are the alternative decisions, marked with different colors, which must be assigned relative scores with respect to all the elements of the lowest hierarchical layers.


Table 1.
Decision matrix.
| Criteria | Criterion 1 | Criterion 2 | Criterion 3 | … | Criterion M |
| Weights | ... | ||||
| Alternatives | Local priorities | ||||
| Alternative 1 | ... | ||||
| Alternative 2 | ... | ||||
| . | . | . | . | ... | . |
| . | . | . | . | ... | . |
| . | . | . | . | ... | . |
| Alternative N | ... | ||||
| Criteria (Weights) | Indicators | Weight |
|---|---|---|
| Urban Sustainability () | Presence of historical-cultural places within 1 km | |
| Quality of the urban landscape | ||
| Accessibility by private car | ||
| Presence of commercial activities nearby | ||
| Presence of accommodation and hospitality services | ||
| Project Sustainability () | Total property availability | |
| Flexibility of spaces to new functions | ||
| Degradation level | ||
| Economic Sustainability () | Investment costs | |
| Payback period | ||
| Financial appeal for private investors |
Table 3.
Decision matrix and global priorities for the example in Section 3.
Table 3.
Decision matrix and global priorities for the example in Section 3.
| Value | Global Priorities | ||
|---|---|---|---|
| 1 Very high | |||
| 2 High | |||
| 3 Medium | |||
| 4 Poor | |||
| 5 Very poor | |||
| Criteria | 1 Urban Sust. | 2 Project Sust. | 3 Economic Sust. |
| Weights | |||
| Value | Local Priorities | ||
| 1 Very high | |||
| 2 High | |||
| 3 Medium | |||
| 4 Poor | |||
| 5 Very poor | |||
Table 4.
Minimum absolute variations in criteria weights to reverse the rankings of the alternative pairs.
Table 4.
Minimum absolute variations in criteria weights to reverse the rankings of the alternative pairs.
| Criteria | |||
|---|---|---|---|
| 1 Urban Sust. | 2 Project Sust. | 3 Economic Sust. | |
| Pairs of alternatives | |||
| 1-2: Very high–High | |||
| 1-3: Very high–Medium | |||
Table 5.
Minimum percent variations () in local priorities to reverse the rankings of the alternative pairs.
Table 5.
Minimum percent variations () in local priorities to reverse the rankings of the alternative pairs.
| Criteria | |||
|---|---|---|---|
| 1 Urban Sust. | 2 Project Sust. | 3 Economic Sust. | |
| Pairs of alternatives | |||
| 1-2: Very high–High | |||
| 1-3: Very high–Medium | |||
| 2-1: High–Very high | |||
| 3-1: Medium–Very high | |||
Publisher’s Note: MDPI stays neutral with regard to jurisdictional claims in published maps and institutional affiliations. |
© 2020 by the author. Licensee MDPI, Basel, Switzerland. This article is an open access article distributed under the terms and conditions of the Creative Commons Attribution (CC BY) license (http://creativecommons.org/licenses/by/4.0/).
Share and Cite
MDPI and ACS Style
Salerno, E. Identifying Value-Increasing Actions for Cultural Heritage Assets through Sensitivity Analysis of Multicriteria Evaluation Results. Sustainability 2020, 12, 9238. https://0-doi-org.brum.beds.ac.uk/10.3390/su12219238
AMA Style
Salerno E. Identifying Value-Increasing Actions for Cultural Heritage Assets through Sensitivity Analysis of Multicriteria Evaluation Results. Sustainability. 2020; 12(21):9238. https://0-doi-org.brum.beds.ac.uk/10.3390/su12219238
Chicago/Turabian StyleSalerno, Emanuele. 2020. "Identifying Value-Increasing Actions for Cultural Heritage Assets through Sensitivity Analysis of Multicriteria Evaluation Results" Sustainability 12, no. 21: 9238. https://0-doi-org.brum.beds.ac.uk/10.3390/su12219238
Note that from the first issue of 2016, this journal uses article numbers instead of page numbers. See further details here.