Article

Identification of the Proper Criteria Set for Neighborhood Walkability Using the Fuzzy Analytic Hierarchy Process Model: A Case Study in Jeddah, Saudi Arabia

by
Faisal AlShareef
* and
Mohammed Aljoufie
Department of Urban and Regional Planning, Faculty of Architecture and Planning, King Abdulaziz University, P.O. Box 80200, Jeddah 21589, Saudi Arabia
*
Author to whom correspondence should be addressed.
Sustainability 2020, 12(21), 9286; https://0-doi-org.brum.beds.ac.uk/10.3390/su12219286
Submission received: 17 September 2020 / Revised: 30 October 2020 / Accepted: 5 November 2020 / Published: 9 November 2020
(This article belongs to the Special Issue Walkable living environments)

Abstract

:
Identifying the appropriate criteria for neighborhood walkability is crucial to improve walkability. This paper aims to identify the proper criteria set for neighborhood walkability using the fuzzy analytic hierarchy process model (FAHP) for the case of Jeddah city, a fast-growing city in Saudi Arabia. This paper strives to highlight the criteria and factors that influence Jeddah’s walkability with its populations’ help. A survey questionnaire was used first to gather data regarding people’s reasons for walking and the elements that encourage them to walk. Then the criteria were derived using the fuzzy analytic hierarchy process (FAHP) method. Results indicate that mosques were the most visited destinations, with over a 30% rate. Eighty-six percent of the criteria that determine a walkable neighborhood in Jeddah were physical environments alone. It was also revealed that the residents regarded walking as a leisure activity rather than a utilitarian. The results show the proposed method’s capability in providing proper neighborhood walkability criteria related to Jeddah’s context. The FAHP proves its use in various urban studies fields in transportation and validation of the walkability index; this paper proves it can also help develop new criteria for walkability measures.

1. Introduction

It has been projected that, by 2030, over 56% of the world’s population will live in urban areas, which indicates that the world is currently experiencing rapid growth in its urban population [1]. This trend means residents of such areas are experiencing issues relating to their living conditions (e.g., high use of unsustainable transportation, high energy consumption, and insufficient green areas). That trend is also affecting the environment in general, as it is associated with high environmental impacts and exacerbation of climate change [2]. Such issues are particularly notable in fast-growing and car-dependent cities [2]. Furthermore, developing solutions to these issues takes time, and their implementation requires large sums of money [3]. As a result, one approach produces relatively practical, effective, and cheap solutions for these crucial problems. Walkability represents the degree to which an area is suitable for pedestrian use. The benefits of implementing walkability in cities have been reported in many studies [3]. Walkability reduces air and noise pollution and promotes green areas; thus, contributing to creating healthier, more livable communities [3,4,5,6]. Moreover, it increases interactions with people while reducing cars on the streets, making it safer for people; thus, walkability improves the cities’ sociability [7,8,9,10]. Additionally, as mentioned above, developing the foundations for pedestrian areas is much cheaper than developing public transit networks, as the space required for pedestrians is smaller than that required for cars [3].
Nevertheless, measuring walkability is not as simple as it seems. For instance, walkability definitions differ depending on the given built environment under analysis [10]. Elements such as the existence of alternative modes of transportation and the landscape in question have been proven to have a strong influence on walking behavior, which demonstrates that walking and built environments have a complicated relationship; further, lifestyle also plays an influencing role in this regard [4,11,12,13]. Still, even when considering these elements, it is not easy to develop a universal tool for measuring walkability [14]. For instance, there are several variables relating to the pedestrians themselves. For example, each person has a different reason for walking, such as exercising, going shopping, or spending time with friends.
Further, the level of physical ability differs across people, from children to seniors, and different factors must be considered to accommodate all individuals. The scale of the area in question can also impact analysis results—street segments have different factors and criteria than those of a neighborhood [15,16]. Finally, the physical characteristics of urban areas and their contexts differ across cities, much fewer countries.
Jeddah is an example of such a city. It is considered one of the fastest-growing cities in Saudi Arabia and, with a population of over 3.4 million, is the most populous city in the country after Riyadh [17]. However, despite Jeddah’s rapid growth, its populace still relies heavily on private transportation, which creates traffic congestion, accidents, pollution, and increased travel times. Walkability can offer solutions to those problems. However, measuring walkability requires to consider the type of data (quantitative and qualitative data), the scale of the analysis (segment, neighborhood), the method used for the analysis (audit instruments, checklists), and the chosen variables and criteria for the index [16].
There is a lack of data and literature that determine the criteria associated with walkability in Jeddah. There is a need to identify what factors influence walkability in Jeddah because the current situation needs to improve walkability [18] and identify the criteria that facilitate the development of an appropriate measuring tool for walkability. However, several conditions must initially be met to achieve this, such as identifying the various reasons that encourage people to walk, determining the analysis scale, and gathering pedestrian groups’ opinions for reference.
This paper strives to identify the proper criteria set for neighborhood walkability using the fuzzy analytic hierarchy process model (FAHP) for the case of Jeddah city, a fast-growing city in Saudi Arabia. It attempts to offer a new approach to find out the criteria factor of neighborhood walkability by engaging the population to set up the criteria. In Section 2, the research background and previous studies are presented. Then, in Section 3, the data and method used in this study are described. Section 4 contains the results, and Section 4 discusses the main findings from this study.

2. Literature Review

Walkability itself is a complex field, even for the experts of the subject [18]. Selecting criteria is considered one of the most important processes when developing any measuring tool [19]. The decision-maker must analyze a comprehensive collection of data and rank them based on their significance. Multi-decision analysis methods are tools used to identify any elements, criteria, and factors related to the issues at hand and weight them accordingly [20]. One of the well-known methods is the analytical hierarchy process (AHP). The AHP is a Multi Criteria Decision Making (MCDM) tool used a lot in scientific and engineer studies [21]. The reason for the AHP popularity is the simplicities of its computing method and the ability to check the variables’ consistency each time [22]. However, one flaw of the AHP is its inability to deal with ambiguous data [23].
Having the public participate in the decision-making would bring positive results on attracting more people to walk since they chose the criteria. However, when engaging the populations who are not experts on walkability, one is bound to face uncertainty. Each answer given by the responder may not have the same meaning due to its subjective perception or merely not knowing what to say given their lack of expertise. That is where the fuzzy theory comes to present each of those variables appropriately in the numerical form [24]. With abstruse estimations of the answers, the standard multicriteria decision does not fit this ambiguous situation—that is why a fuzzy linguistic model is needed. Most decision-makers rely on fuzzy theory as it deals with vague information within the data [25], which makes them more suited for this study.
In this paper, a fuzzy MCDM called the fuzzy analytical hierarchy process (FAHP) is used to evaluate the survey answers. It is considered a fuzzy version of the typical analytical hierarchy process (AHP), where it evaluates subjective data objectively and checks its consistency from the uncertain respondents [26,27,28,29]. According to Mardani et al. [24], the FAHP model alone scored the third-highest usage after a hybrid fuzzy MCDM and AHP with 199 applications in various studies from improving business management [30] and developments of the supply chain [31] to even urban studies such as transport developments [32] and driver behaviors [33]. From the literature, most MCDM papers discuss utilizing the MCDM tool itself for evaluation and analysis [24,34,35,36,37]; they integrate different types of MCDM tools for better results [30,31,38], and most of the MCDM papers fall into four main fields: engineering, business and management, science, and technology [39,40,41,42]. However, there are two shortages of literature in applying the FAHP method. First, despite the extensive research on utilizing the FAHP in urban area studies [25,27,39,40,41,42], there are no studies related to establishing new criteria for walkability measures using the FAHP. Second, the FAHP is mostly used to analyze the researchers’ criteria rather than the participants themselves.
This paper attempts to bridge this knowledge gap by using the FAHP to evaluate and identify Jeddah’s walkability criteria, one of the fastest-growing and car-dependent cities in Saudi Arabia. This study was implemented in four neighborhoods in Jeddah (Al-Samer, Al-Naseem, Al-Naeem, and Al-Salamh). The data were obtained from the residents through a survey questionnaire. Once the data were gathered, the FAHP method was used to analyze the answers and weight the criteria accordingly. The detailed process is described in the following Section 3.

3. Materials and Methods

3.1. Jeddah

Jeddah is located on the western coast of the Kingdom of Saudi Arabia, in the center of the country’s Red Sea coastline. Jeddah is known as the “Pride of the Red Sea” [17] and is the largest city overlooking that sea. It is considered one of the most important cities in the Kingdom of Saudi Arabia and the country’s commercial gateway, meaning it is of great importance for international trade with foreign markets. Since ancient times, the city has represented the Kingdom’s external outlet [43]. As a result, it has been the site of a great industrial revolution and development in all commercial and service fields, making it one of the most attractive cities for businesses. It is also becoming an important center for finance [17]. Jeddah has also gained importance as a tourist destination, becoming one of the most progressive Saudi cities in its embracing of tourism facilities; over 21% of the total markets and commercial centers in the Kingdom are based in Jeddah [44]. Jeddah is also recognized as the gateway to the Two Holy Mosques and the first stop for pilgrims coming to the Holy Land (Makkah and Madinah).
As a result of these traits, attractions, and amenities, Jeddah receives many visitors each year. Almost five million international travelers arrive in Jeddah annually for Umrah, Hajj, work, tourism, and/or leisure. Regarding land trips between Jeddah, Makkah, and Madinah, the Road Services Department at the Ministry of Transportation estimates that, over a year, between 40,000 and 60,000 cars make this journey each day [44]. Additionally, Jeddah is home to 14% of Saudi Arabia’s population and shows a population growth rate of 3.5% per annum [45]. These figures underline the too-high volume of people living in and passing through the city. Despite this, however, there is a lack of infrastructure in the city relating to public transportation and pedestrian streets, facilitating smoother population movement. Therefore, to solve this problem, this paper considers walkability-related issues in the context of Jeddah.
An analytical-assessment-based measurement tool for walkability in Jeddah must satisfy the following conditions:
  • The criteria/indicators must be suited to the conditions of Saudi Arabian cities in general.
  • The criteria/indicators must apply to all neighborhoods.
  • The criteria/indicators must cover most of the issues residents have with walkability.
  • The criteria/indicators must be measurable.
To satisfy these conditions and create a suitable analytical tool for measuring walkability in Jeddah, the criteria and indicators of walkability measures must be identified and gathered in a single table, and sites for collecting the data must then be chosen. Then, a questionnaire survey must be developed to gather additional possible indicators from the residents of Jeddah. The different sites’ results must then be combined to determine each category’s overall weights and values.

3.2. Developing and Administering the Questionnaire Survey

The questionnaire represented a crucial part of this research because, while reviewing literature helps identify and gather general classes and indicators, a survey can help evaluate and weigh these indicators. A survey also helps gather exclusive insights from the residents regarding walkability-related issues in the analysis areas. Through this, we could determine the factors that impact walkability and their respective levels of influence.
When developing any walkable path or pedestrian area, the primary aim is to make it accessible for all potential users [46]. Following this goal, the questionnaire’s purpose was to eliminate unnecessary or unusable indicators while also identifying important indicators that the research may not have identified. To obtain information on a large scale while reducing the risk of bias during the collection process, the respondents were approached using a cluster sampling method. This method also helped ensure that conclusions obtained could be applied to other areas that feature similar characteristics. 
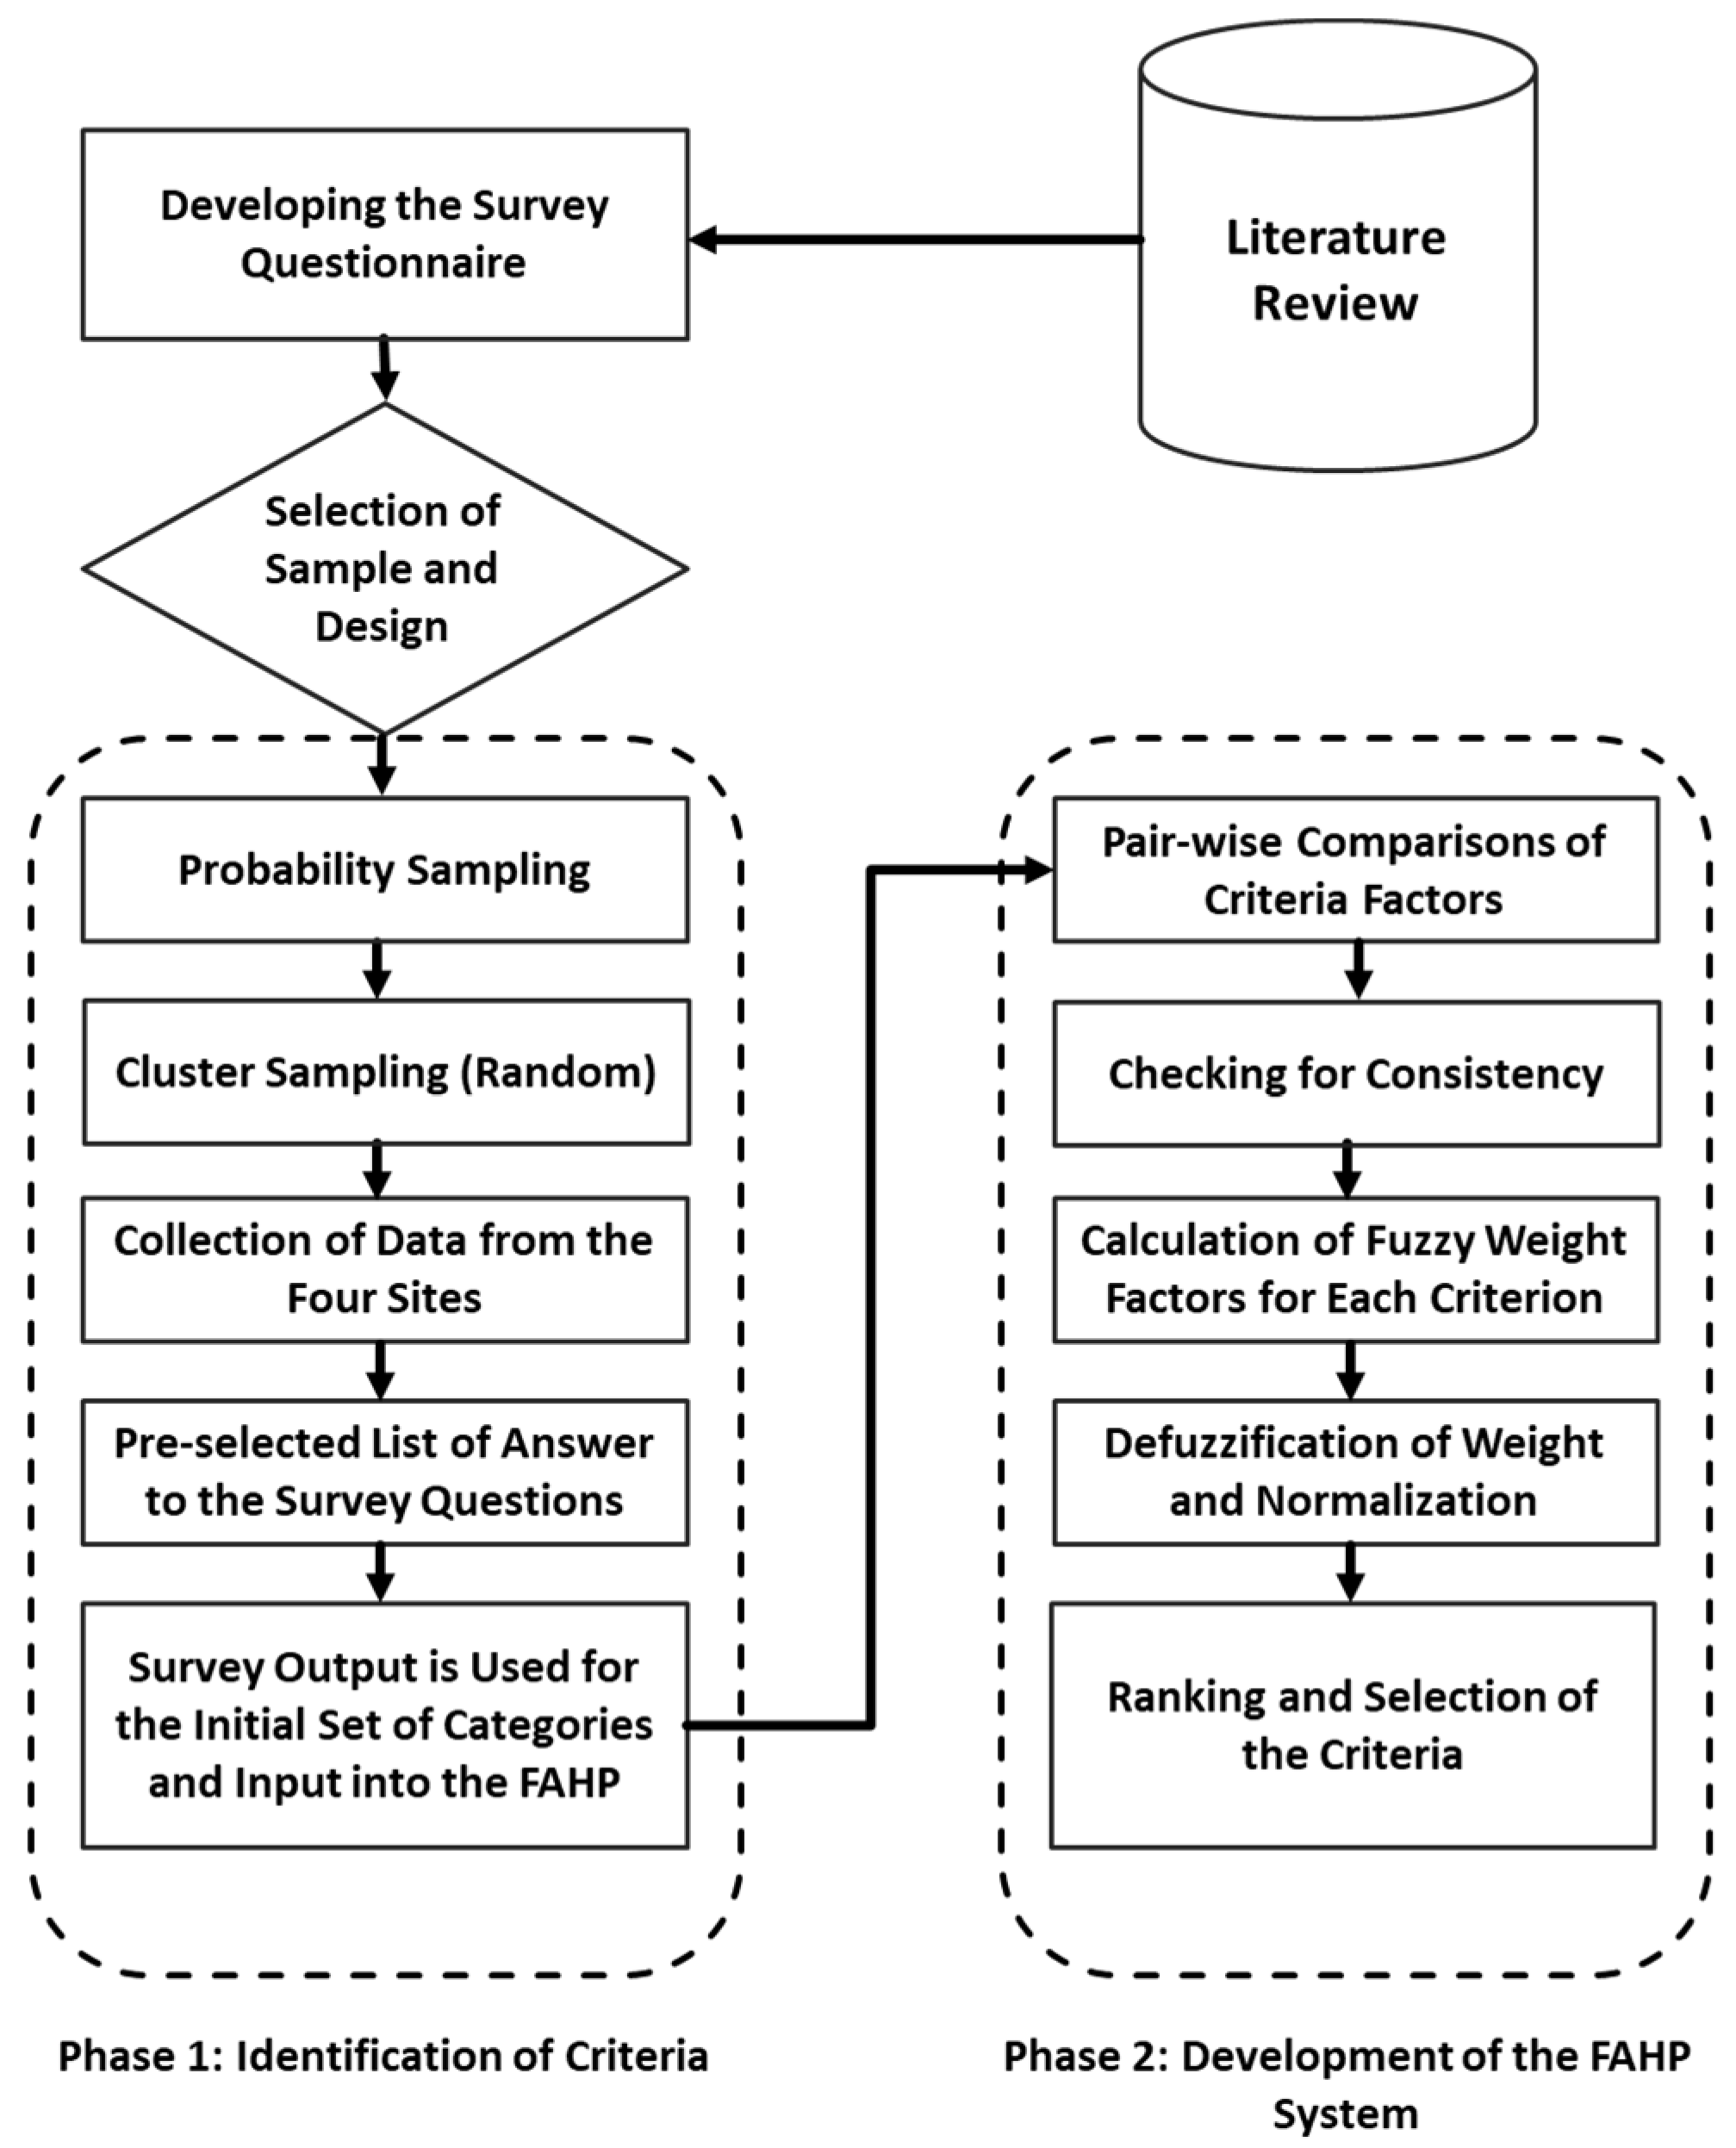
Figure 1 shows the research process. The detailed characteristics of the conducted survey are as follows:
  • At each site, 100 respondents returned completed questionnaires. As four sites were included in the case study, the total number of respondents was 400.
  • At this survey, only the residents of those neighborhoods were asked.
  • The responders were asked to return the completed forms to the researchers.
  • The respondents were selected from various locations (mosques, supermarkets, parks) in different districts of each neighborhood. Such variation in sampling meant the analysis would obtain an in-depth insight into the survey area.
  • Two of the sites represented low-density neighborhoods, while the other two represented high-density neighborhoods; this guaranteed that the survey would clarify the impact of density.
  • The survey was conducted between September and December 2019, and analysis was conducted in March 2020.
  • Data calculation was conducted using Excel software.

3.3. Defining the Criteria for Comparisons

For this paper, the survey had open questions, in which the respondents were asked to describe factors that discouraged them from walking and factors that may encourage them to walk more. These questions were open to ensure that the respondents’ answers would not be affected by the researchers’ preconceptions and to allow the respondents to highlight issues that the researchers had not considered.
The respondents were asked to give the top five answers they could think of for each question. Then the answers were arranged using the Borda count. The Borda count is a social choice function method that uses a ranking of preference to count the votes of the candidates’ answers [47,48]. In this method, the ranking order is done using this equation:
1st place = n
2nd place = n − 1
Nth place = n − (N − 1)
where n is the number of candidates (e.g., if there are ten candidates, then n = 10), after adding the points’ sum, the candidate with the highest points wins. Even though this method helps set the orders, it does not estimate the candidates’ weight like the FAHP.

3.4. Study Boundaries

To create a practical tool for measuring walkability, choosing appropriate sites for conducting case studies is essential. These sites are used to gather data from residents through questionnaires (details regarding the questionnaire used in this research are provided in Section 3.2). They will also be used later on for testing the chosen walkability-associated criteria and indicators. To ensure that the tool could be applied to all cities in Saudi Arabia, it was necessary that, while preserving their individuality, the target neighborhoods possessed similar traits to cities’ general traits across the country.
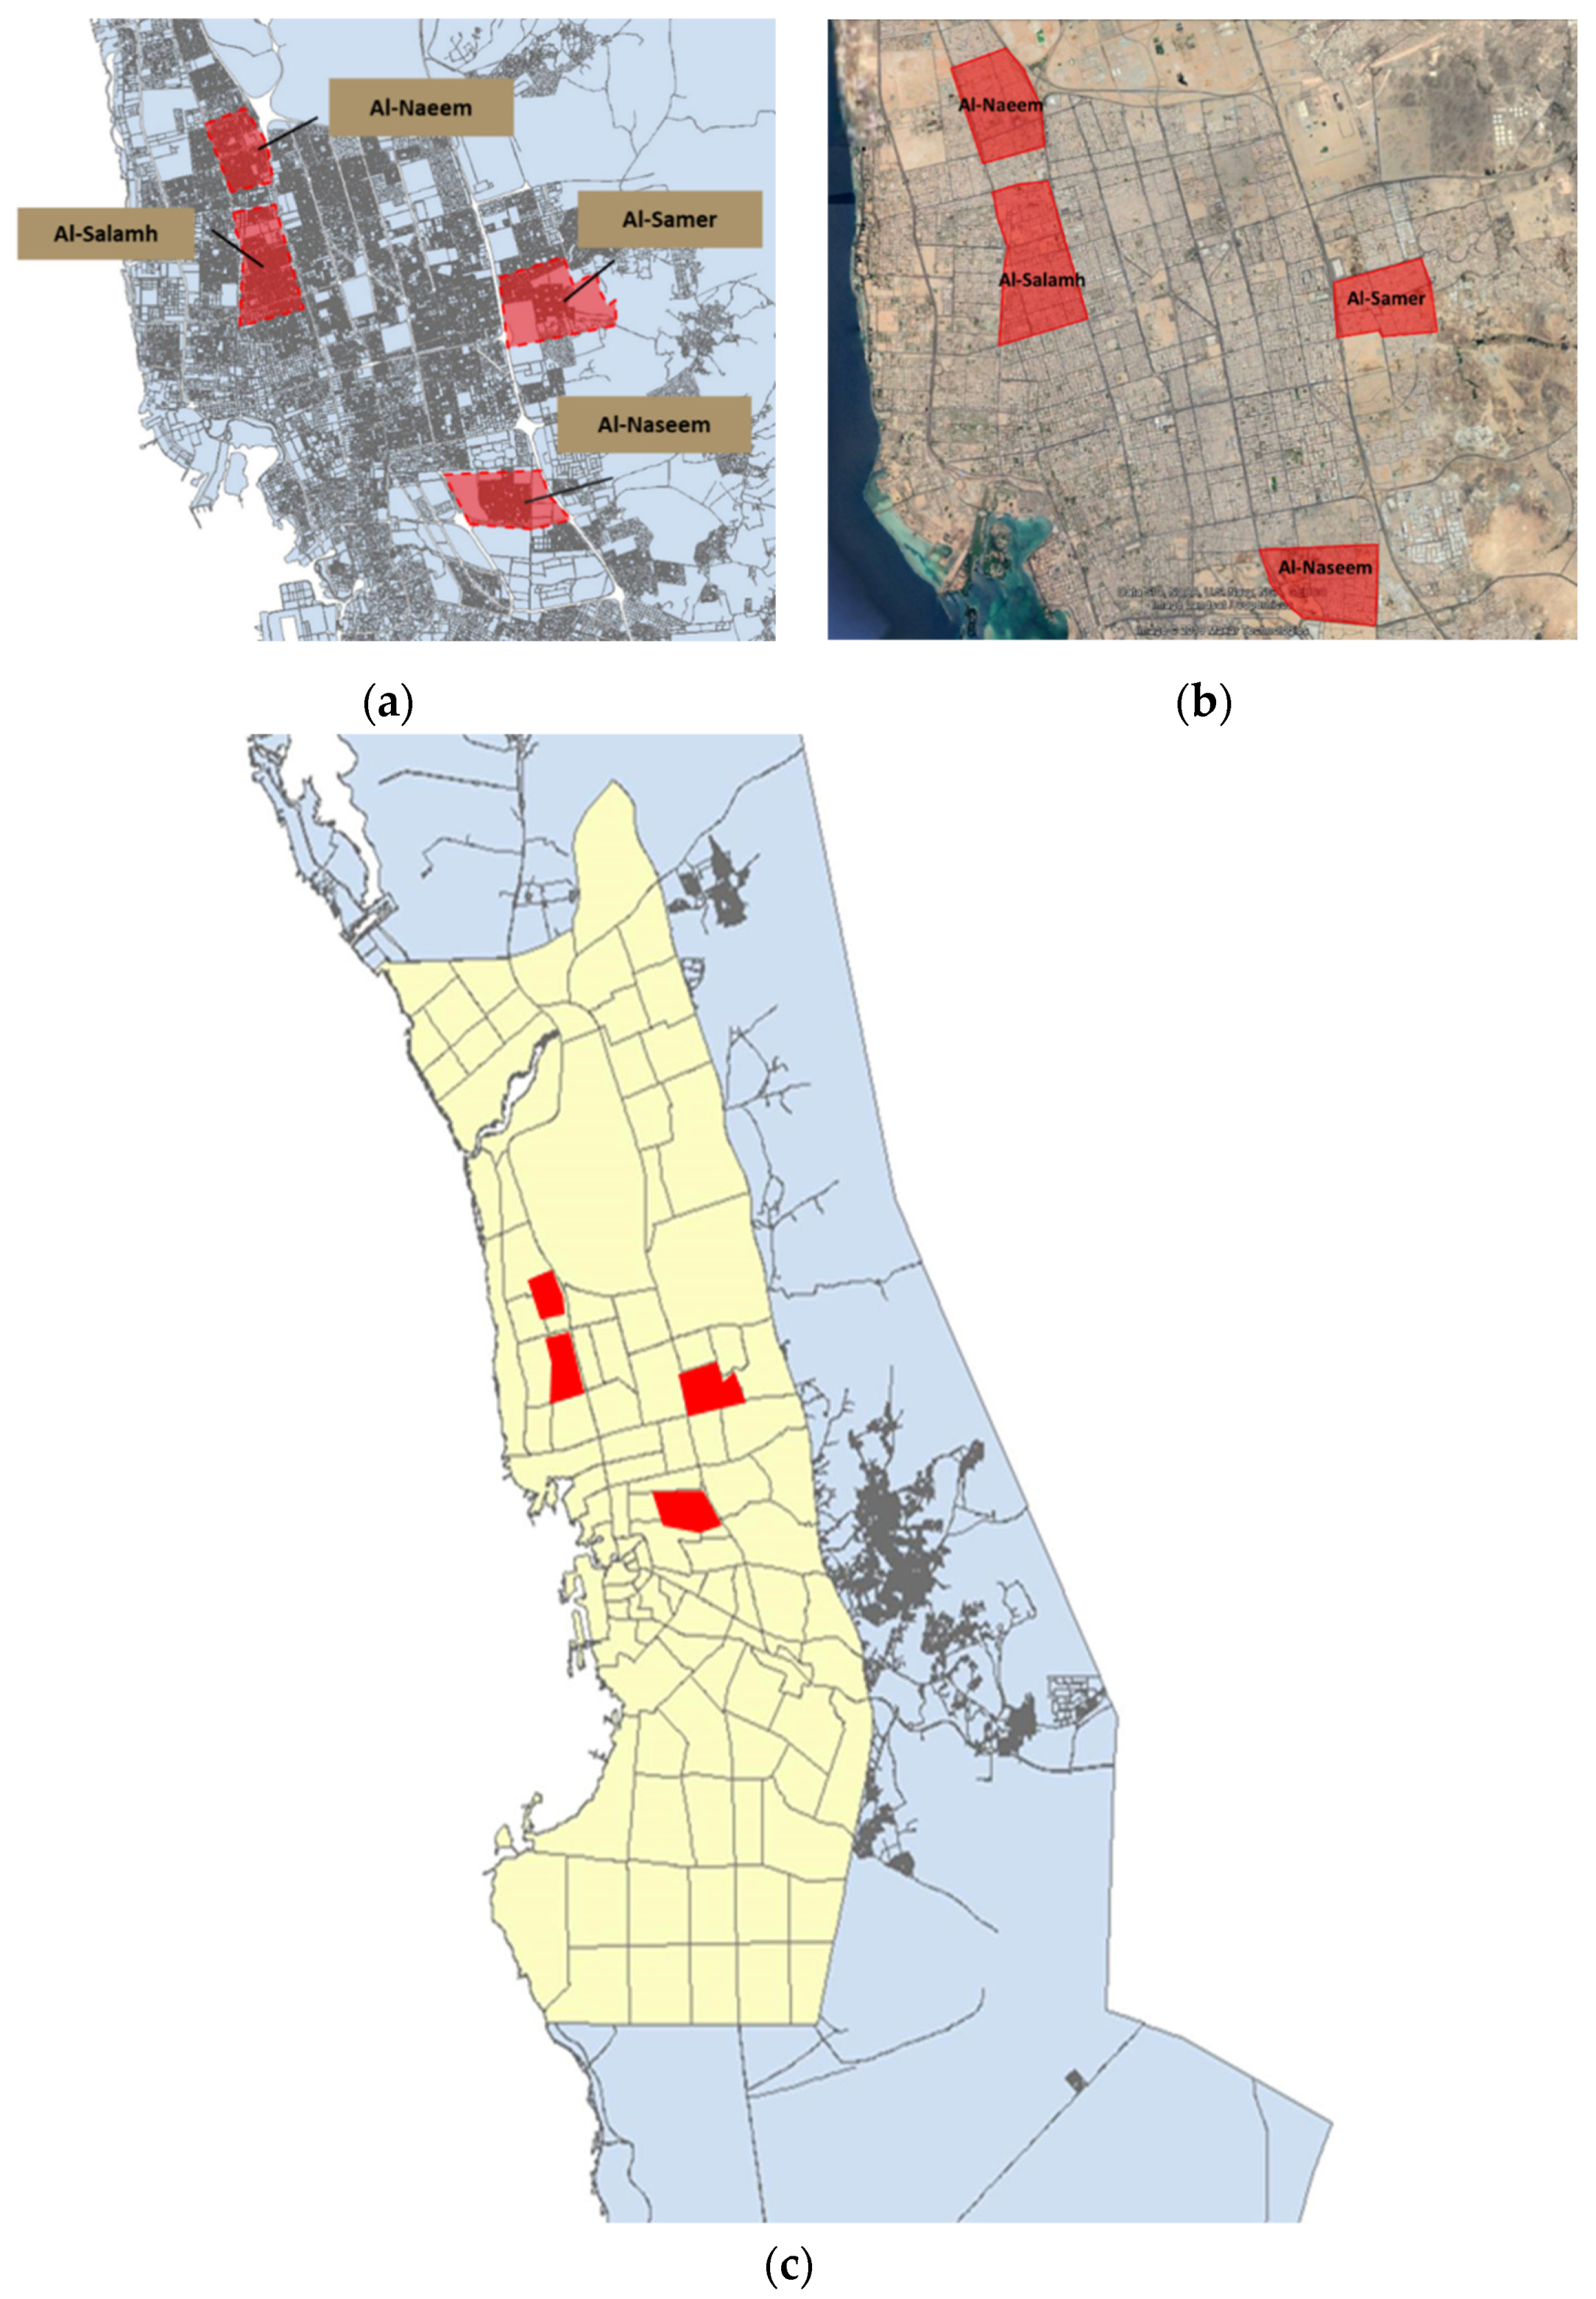
Thus, we applied the following trait-related criteria when searching for suitable sites: the districts must possess common physical characteristics so that the resultant data may be applicable for use in almost every Saudi Arabian city; the neighborhoods must be built by Jeddah municipality regulations, which would mean that the neighborhoods were representative of the majority of Jeddah’s built environment; and finally, the sample must include neighborhoods with differing population densities (i.e., low, high) in order to check whether density affects walkability. Based on these criteria, four districts were chosen for this research: Al-Samer, Al-Naseem, Al-Naeem, and Al-Salamh. Table 1 presents a summary of these districts’ respective walkability-related characteristics. Figure 2 Shows the locations of the study boundaries.

3.5. Fuzzy Analytic Hierarchy Process

To evaluate these data, a multicriteria evaluation method called the FAHP was adopted. The FAHP is an upgraded representation of the AHP method and is used to solve issues when analyzing vague data. This method, developed by Saaty [49,50], is commenced by creating a structure of the criteria and elements and arranging them into a hierarchy system. Once the criteria are set, the method implements comparisons between different pairs of criteria to create a ratio for each pair; the weighting process is performed by implementing a pair-wise comparison matrix [46,47,48] of the AHP model with the conversion of fuzzy numbers. This method helps to deconstruct vast layers into smaller elements and classify them in terms of their importance. For comparison, each class is evaluated in terms of each category by awarding values between 1 and 9. Table 2 shows the scale and their respective fuzzy value descriptions [42].
To implement the FAHP method in this study, three analysis steps were necessary: first, setting the analysis; second, checking whether the analysis was consistent; and third, calculating the weights.

3.5.1. Pair-Wise Comparison between the Criteria

Before setting the matrix for the analysis, it is necessary to set the criteria and their values. The chosen criteria needed to be present in at least three samples; criteria that appeared in two or fewer were rejected. Further, to facilitate the neighborhoods’ measurement based on the criteria, we determined that the chosen criteria must be related to the built environment. Once this filtering was applied, the ten highest-scoring criteria were chosen.
Once the criteria were set, we commenced a pair-wise comparison matrix [A] using the scale shown in Table 2. The factors for each level and their weights are A1, A2, …, An and W1, W2, …, Wn. The importance value of ai and aj is shown as aij. The pair-wise comparison matrix of factors A1, A2, …, An as A = [aij] is presented as:
A   =   { a i j } n n   =   ( 1 a 12 a 1 n a n 1 a n 2 1 ) = ( 1 w 1 w 2 w 1 w n w 2 w 1 1 w 2 w n w n w 1 w n w 2 1 ) .
In the matrix, the element aij = 1/aji and, thus, when i = j, aij = 1. The matrix was normalized using the equation:
a i j   =   a i j i = 1 n a i j i j =   1 , 2 , 3 ,   n .
Lastly, we computed the weights of the factors using the following formula:
W i   =   ( 1 n )   i = 1 n a i j .
where Wi is the total weight of the factors. In the matrix, if the horizontal axis factor’s value exceeded that of the vertical axis factor, it ranged from 1 to 9. If the former value was less than the latter, it ranged between the reciprocals, from 1/2 to 1/9 (Table 3). The matrix’s diagonal values, however, always remained at 1. In terms of the equation, the element aij = 1/aji and, thus, when I = j, aij = 1.

3.5.2. Checking the Consistency

One of the merits of the AHP is its ability to check whether the scaling and comparison of criteria are consistent each time. In the AHP, this checking of consistency is conducted using the consistency ratio (CR). CR is performed by comparing the consistency index (CI) with an average random consistency index (RI). The consistency ratio and the CI are defined using Equations (5) and (6) below:
C R   =   C I R I .
C I =   λ m a x n n 1 .
here CI represents the consistency index, λmax is the primary or principal eigenvalue of the matrix (and is calculated from the matrix), and n is the matrix’s number of factors. The average random consistency index (RI) [49] is also derived from these factors. Table 4 shows the value of RI based on the number of factors (N).
In the AHP, the CR is accepted if the result is less than 0.1; otherwise, it is rejected [49]. In this paper, the CR for all of the comparisons was below 0.1, meaning it was acceptable for the AHP analysis.

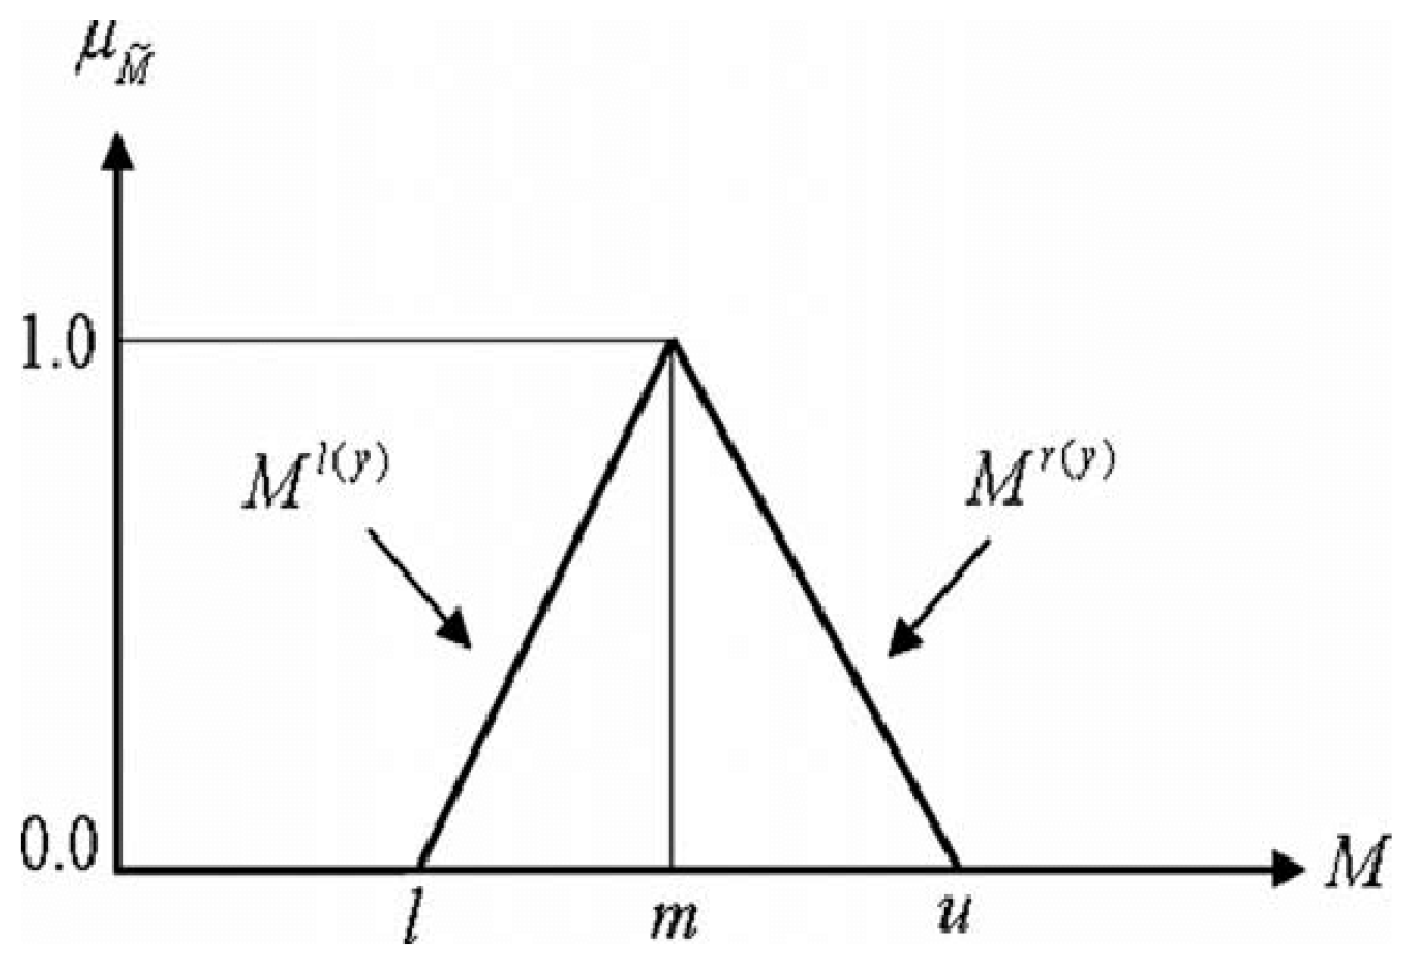
3.5.3. Weighting of the Fuzzy and Non-fuzzy Numbers for the Criteria

Once the criteria’s consistency was proven, the scale was converted to a fuzzy triangular scale: lower (l), medium (m), and upper scale (u) (see Figure 3) [51,52,53,54]:
An = (ln, mn, un).
A n     1 =   ( l n ,   m n ,   u n )     1 =   ( 1 l n ,   1 m n   ,   1 u n ) .
After converting the fuzzy numbers, calculating the respective weights of the criteria was commenced to determine their order. For the present research, Buckley’s geometric mean method [55] was adopted. The calculation formula was:
w ˜ i = r ˜ i ( r ˜ 1   r ˜ 2 r ˜ n ) 1 .
where the w ˜ i is the fuzzy weight, and r ˜ i is value of the criteria. To determine the value of two fuzzy numbers, the following methods were applied:
Addition of a fuzzy number ⊕:
A1 ⊕ A2 = (l1, m1, u1) ⊕ (l2, m2, u2) = (l1 + l2, m1 + m2, u1 + u2).
Multiplication of a fuzzy number ⊗:
A1 ⊗ A2 = (l1, m1, u1) ⊗ (l2, m2, u2) = (l1l2, m1m2, u1u2).
Division of a fuzzy number ∅:
A 1     A 2   =   ( l 1 ,   m 1 ,   u 1 )     ( l 2 ,   m 2 ,   u 2 )   =   ( l 1 l 2 ,   m 1 m 2 ,   u 1 u 2 ) .
Defuzzification of these weights was based on the graded mean integration representation [37], which uses the following equation:
DF   ( w ˜ i ) = w i =   l i + 4 m i + u i 6 .
However, once the defuzzification was conducted, if the total result exceeded 1, it was necessary to normalize the total weight by using the following formula:
w i =   DF   w ˜ i   DF   w ˜ i .

4. Results and Discussion

4.1. FAHP Results

The survey featured four open questions related to walkability. These questions helped to determine the categories and criteria for measuring walkability. To organize and refine the answers, a sorting technique was implemented. This technique helped develop a clear database, gathering all answers that contained the same meaning, and eliminate any answers that did not apply to the measure. Finally, the criteria that could be converted into indicators were selected. The walkable neighborhood criteria orders in terms of priority for each context are presented in Table 5, Table 6, Table 7, Table 8 and Table 9 using the FAHP method.

4.1.1. Destinations

Walking is a form of transportation. People can walk to visit the park or go shopping; improving the walkability of an area may depend on people’s reasons for walking, increasing the likelihood that people will walk to their destinations instead of using other modes of transportation. Some indicators, such as Walk Score [4,56], evaluate neighborhood walkability by counting the number of possible walking destinations and accurately measuring their respective weights. However, since the values Walk Score attributes to such destinations are based on analysis of another country (i.e., the United States), their respective values may not match those attributed by Jeddah’s residents. For this reason, the survey conducted in the present research asked the respondents about their destinations; the destinations could then be ranked in terms of their respective values for Jeddah residents, and these values could also be used for future reference. Once the destination criteria were set, we analyzed the criteria using the FAHP method.
The analysis showed that the mosque was the most significant destination for the residents because they prayed five times a day and always attended the mosque for Friday prayer. Ranks two to four varied between the grocery store, pedestrian area, and supermarket; however, the overall analysis (Table 9) showed that the grocery store was ranked second, followed by the supermarket and pedestrian area, respectively. This result emphasizes the importance of shopping areas for residents. Surprisingly, the seafront was ranked fifth in all case studies. Table 5 shows the weights of destination criteria for each neighborhood.

4.1.2. The Criteria of a Walkable Neighborhood

The recognition level of pedestrian streets (i.e., how easily a street can be recognized as pedestrianized) and their visibility to potential users is essential assessment aspects. Ewing and Hardy [15] believed that transparency regarding how a street facilitates pedestrian activities is a critical part of that street’s walkability. In other assessments, such as the “5 Cs” (or “7 Cs”) [57,58], “conspicuous” is included as an indicator, while “design” is included in the “3 Ds” (or 5 “Ds”) [59,60]. Clarifying that a street is pedestrianized informs pedestrians and drivers that this area prioritizes pedestrians, making it safer and friendlier for such users. The present study’s questionnaire featured a question regarding the aspects that make a neighborhood walkable; this was designed to determine the features that make an area walking-friendly from Jeddah residents’ perspective.
Based on the survey results (Table 6; overall results are shown in Table 9), for all case studies, the presence of a pedestrian sidewalk is the primary sign that an area is walking-friendly. Having parks is ranked second, followed by infrastructure and green zones, respectively. The fifth criterion is a clean environment, as clean streets and paths afford greater comfort for pedestrians. Safety from crime is sixth, which is an element that can help pedestrians feel safe when using the streets. Separation from cars and street lights are joint seventh. Road safety is followed respectively and represents significant safety-related elements, as in some areas, sidewalks may be missing or narrow. Table 6 shows the criteria’s weights for each neighborhood.

4.1.3. Factors That Encourage Walking

While the previous question, concerning the criteria that make a neighborhood walkable, is similar to the factors that encourage walking, there is a difference between them. Many people may avoid walking despite the presence of all the features of walkable streets. As stated above, not only are there different groups of people (seniors, adults, children) among potential walkers, but there are also various purposes for walking (e.g., utilitarian, leisure). Therefore, the questionnaire featured a question designed to identify the factors that encourage people to walk, contributing to measuring walkability. The answers to this question could also be helpful references for the future design of pedestrian sidewalks.
The results for this question (Table 7; overall results are shown in Table 9) showed that the factor that most strongly encourages people to walk is exercise, which relates to a desire to maintain one’s health. The second-ranked factor is the existence of recreational spaces in the area. Nice and temperate weather can encourage people to walk outside, and well-built infrastructure is a joint third. Fourth is the proximity of services, which allows pedestrians to reach their destinations faster. People also walk more when pedestrian areas are nearby, which is the fifth-ranked factor. The results also show that having mosques helps encourage walking. Table 7 shows the weights of encouragement criteria for each neighborhood.

4.1.4. Factors That Discourage Walking

This final question was complementary to the previous question, as it focused on the issues that, based on the respondents’ experiences, discourage walking. This question was relatively straightforward and practical, given that it focused more on the current problems in each neighborhood rather than abstract factors. Therefore, by highlighting the issues that cause people to find walking difficult, this question could produce data underlining indicators for measuring walkability.
The results for this question (Table 8; overall results are shown in Table 9) showed that infrastructure is the primary issue that hinders walkability in neighborhoods. Bad weather was ranked second. A lack of safety measures concerning crime, such as a lack of existing surveillance in the neighborhood, was the third factor hindering walkability. Lack of road safety was ranked fourth. Unclean environments were ranked fifth, followed by a lack of pedestrian areas and street lighting, respectively. Table 8 shows the weights of discouragement criteria for each neighborhood, and Table 9 represents the overall weights and ranking of the criteria.

4.2. Discussion

The study results provide interesting results for neighborhood walkability. Results indicate that for the destination in all the neighborhoods, the mosque had a unanimous vote. That should not be a surprise to the authors, given the importance of praying for Muslims in their daily lives; however, we see a difference in value compared to previous literature reviews. A study made in the United States showed that having grocery stores, restaurants, banks, and schools can increase walking [61]. A study made in Australia [62] showed that having shops and public transport can encourage more walking. Another study in the United States [63] showed that private recreational factors, parks, and playground destinations promote more walking. Nevertheless, the remaining criteria of destinations are close to the first case.
Results also indicate that the top five criteria that define a walkable neighborhood were related to physical environments. Moreover, 86% of the criteria weights were physical environments alone, 13% were social criteria, and the remaining 3% were economical. However, in a comparative study done in Lithuanian cities [64], social criteria were the dominant elements, and environments scored second. The same applied to a study conducted in Porto Alegre, Brazil, [25] where public security and traffic safety held the highest. This finding seems to indicate the necessity to upgrade the neighborhood’s physical environment to improve walkability in Jeddah.
Moreover, results reveal that most survey respondents showed that the residents regarded walking as leisure rather than utilitarian activity. Both exercising and recreation activities hold 52% of the weights for factors that encourage walkability. In that regard, Jeddah residents share the same purpose with Lithuanian cities and Australia [62,64], and contrary to the United Kingdom, people go walking for shopping and work.
Another striking pattern concerned the presence of pedestrian areas in Jeddah, highlighting its significance for walking and physical activities. This finding aligns with the study finding of Australia’s cities [62]. On the other hand, discouraging factors are not presented as much in other literature, thus making this approach novel. The results emphasize that pedestrian areas are critical for walkability in Jeddah. It can be proved by the fact that it scored only second in the Al-Salamh neighborhood since it was the only neighborhood where pedestrian areas were widely implemented.
This study shows that the FAHP method is a sophisticated tool to determine the relative value and construct a hierarchy order for the main physical characteristics to improve walkability in Jeddah, Saudi Arabia. The FAHP method helped determine their weights and values numerically and strengthen the results due to its ability to treat fuzzy data consistently. However, it must be noted that the criteria were probably chosen simply because of the neighborhood’s lack of variation. Nevertheless, the case study presents important insight regarding walkability studies. Its application to a Saudi city proposed a different result from the usual western countries such as Europe and the United States, where their infrastructure differs. Most of the literature measured walkability in their native lands, which do not represent our city’s reality. No two cities or countries share the same attributes and values for walkability. Setting criteria is essential for any decision-making process. The population is a key factor in identifying what drives people to walk more and promotes walkability. Taking their view will add more insights and knowledge into practice. Those insights will help set new criteria for walkability measures, but gathering information from inexpert responders may prove a challenging task for any researcher.

5. Conclusions

This paper attempted to identify the proper criteria set for neighborhood walkability using the fuzzy analytic hierarchy process model (FAHP) for the case of Jeddah, a fast-growing city in Saudi Arabia. The criteria were obtained using the Social choice functions (SCFs); then, the weighting process was done by the FAHP. The reliability of the FAHP to measure criteria weights had already been proven but never with newly established criteria. The results show that the proposed technique made it possible to determine the relative value and construct a hierarchy order for the main physical characteristics to improve walkability in Jeddah, Saudi Arabia. The FAHP method helped determine their weights and values numerically and strengthen the results due to its ability to treat fuzzy data consistently.
This method’s input data were obtained from a questionnaire survey in four neighborhoods of the city. The two biggest drives for walking identified by the residents were doing an exercise (30%) and recreation (22%), which shows that walkability is seen as a leisure activity rather than utilitarian. Furthermore, the order of the destinations was the mosque (31%), grocery store (19%), supermarket (15%), and then pedestrian areas (11%). The authors should at least expect the destination results, given the importance of prayer to the population, but with the FAHP, we managed to quantify its importance. Most studies in the literature focused on walkability’s social aspects, but in Jeddah, the environment aspect was much more important due to the lack of variation. Promoting walkability in Jeddah should increase the presence of pedestrian areas, emphasizing recreation activities.
As there is little literature regarding the use of the FAHP in the context of walkability, this study not only provides a measure for walkability in Saudi Arabian cities but also represents a valuable contribution to the field. In particular, the novel contribution of this research helps define the base criteria for measuring walkability. It presents a detailed description of Jeddah’s factors and obstacles that influence selecting the criteria for a walkability measure.
This topic is still under-researched in the current literature. Thus, this paper can represent a starting point for future studies on the same subject and add new information to existing knowledge. The outcome of this research also provides meaningful implications for future practice and recommendations. The following is a list of such implications and recommendations:
Limitations:
  • The scope of the present research survey was just four neighborhoods; it may be necessary to expand the scope to strengthen its quality and validity.
  • The survey measured classes considered relevant by the respondents, which may have limited the ability to obtain a comprehensive image of the neighborhoods’ walkability. This approach may have impeded the broader use of walkability measures. The formulation of a more advanced framework and strategies for expanding the walkability measure would help address this.
  • The study weighted the walkability measure criteria for each neighborhood; however, further consideration of each criterion is necessary.
  • The consequences of using the research classes are not yet known since the measure has only just been developed.
Implications/recommendations:
  • The destination with the highest percentage of walking visitors is the mosque; thus, roads that lead to mosques are likely to exhibit increased usage and pedestrian traffic—the same can be said for roads leading to grocery stores.
  • The primary factor encouraging walking is exercise; consequently, installing equipment for exercising in pedestrian areas is likely to attract more pedestrians to the areas.
  • The government could assist in developing walkable neighborhoods by considering residents’ opinions when implementing related developments. Their perspectives could help to measure the level of walkability in their respective neighborhoods.
  • Further deconstruction of criteria such as pedestrian areas into intents and requirements should be performed, which would help planners identify important aspects.
  • The study could be extended to compare residents who live in neighborhoods that feature pedestrian areas with those who do not live in such neighborhoods regarding their walkable neighborhoods’ perspectives.
  • This area of research can be expanded to other cities in Saudi Arabia. Comparing the findings could provide valuable information, and combining the findings could increase the selected methodology’s strength.

Author Contributions

Conceptualization, F.A. and M.A.; methodology, F.A.; software, F.A.; validation, F.A. and M.A.; formal analysis, F.A.; investigation, F.A.; resources, F.A.; data curation, F.A.; writing—original draft preparation, F.A.; writing—review & editing, F.A. and M.A.; visualization, M.A.; supervision, M.A.; project administration, F.A. All authors have read and agreed to the published version of the manuscript.

Funding

The authors declare no funding.

Conflicts of Interest

The authors declare no conflict of interest.

References

  1. Urban Population to Become the New Majority Worldwide. Available online: https://www.prb.org/urbanpoptobecomemajority/ (accessed on 12 September 2020).
  2. Handy, S.; Mokhtarian, P. Growing Cooler: The Evidence on Urban Development and Climate Change: Reid Ewing; Bartholomew, K., Winkelman, S., Walters, J., Chen, D., Eds.; Urban Land Institute: Washington, DC, USA, 2008. [Google Scholar]
  3. Soni, N.; Soni, N. Benefits of pedestrianization and warrants to pedestrianize an area. Land Use Policy 2016, 57, 139–150. [Google Scholar] [CrossRef]
  4. Lee, S.; Talen, E. Measuring walkability: A note on auditing methods. J. Urban Des. 2014, 19, 368–388. [Google Scholar] [CrossRef]
  5. Wright, L.; Montezuma, R. Reclaiming Public Space: The Economic, Environmental, and Social Impacts of Bogota’s Transformation. In Proceedings of the Cities for People Conference, Walk21, Copenhagen, Denmark, 9–11 June 2004. [Google Scholar]
  6. Talen, E.; Koschinky, J. The walkable neighborhood: A literature review. Int. J. Sustain. Land Use Urban Plan. 2013, 1, 42–63. [Google Scholar] [CrossRef]
  7. Brambilla, R.; Longo, G. For Pedestrians Only: Planning, Design, and Management of Traffic-Free Zones; Watson-Guptill: New York, NY, USA, 1977. [Google Scholar]
  8. Forkenbrock, D.J.; Benshoff, S.; Weisbrod, G.E. Assessing the social and economic effects of transport projects. Trans. Res. Board 2001, 31, 109. [Google Scholar]
  9. Gehl, J. Life Between Buildings: Using Public Space; Island Press: Washington, DC, USA, 2011. [Google Scholar]
  10. Beatley, T.; Manning, K. The Ecology of Place: Planning for Environment, Economy, and Community; Island Press: Washington, DC, USA, 1997. [Google Scholar]
  11. Lo, R.H. Walkability: What is it? J. Urbanism. Inter. Res. Placemaking Urban Sustain. 2009, 2, 145–166. [Google Scholar] [CrossRef]
  12. Handy, S. Critical Assessment of the literature on the relationships among transportation, land use, and physical activity. In Transportation Research Board and the Institute of Medicine Committee on Physical Activity, Health, Transportation, and Land Use; Resource Paper for TRB Special Report; Transportation Research Board: Wahington, DC, USA, 2005; p. 282. [Google Scholar]
  13. Moudon, A.V.; Lee, C.; Cheadle, A.D.; Garvin, C.; Johnson, D.; Schmid, T.L.; Weathers, R.D.; Lin, L. Operational definitions of walkable neighborhood: Theoretical and empirical insights. J. Phys. Act. Health 2006, 3, 99–117. [Google Scholar] [CrossRef] [PubMed]
  14. Manaugh, K.; El-Geneidy, A. Validating walkability indices: How do different households respond to the walkability of their neighborhood? Transport. Res. D Transp. Environ. 2011, 16, 309–315. [Google Scholar] [CrossRef]
  15. Ewing, R.; Handy, S. Measuring the unmeasurable: Urban design qualities related to walkability. J. Urban Des. 2009, 14, 65201384. [Google Scholar] [CrossRef]
  16. Maghelal, P.K.; Capp, C.J. Walkability: A review of existing pedestrian indices. Urisa J. 2011, 23, 5–19. [Google Scholar]
  17. Jeddah. (In Arabic). Available online: https://www.makkah.gov.sa/page/jeddah (accessed on 22 August 2020).
  18. Lamíquiz, P.J.; López-Domínguez, J. Effects of built environment on walking at the neighbourhood scale. A new role for street networks by modelling their configurational accessibility? Trans. Res. Part A 2015, 74, 148–163. [Google Scholar] [CrossRef] [Green Version]
  19. Aharia, S.G.; Ghaffari-Nasabb, N.; Makuib, A.; Ghodsypoura, S.H. A portfolio selection using fuzzy analytic hierarchy process: A case study of Iranian pharmaceutical industry. Int. J. Ind. Eng. Comput. 2011, 2, 225–236. [Google Scholar]
  20. Pelegrina, G.D.; Duarte, L.T.; Romano, J.M.T. Application of independent component analysis and TOPSIS to deal with dependent criteria in multicriteria decision problems. Exp. Syst. Appl. 2019, 122, 262–280. [Google Scholar] [CrossRef] [Green Version]
  21. Saaty, T.L.; Vargas, L.G. Models, Methods, Concepts and Applications of the Analytic Hierarchy Process; Kluwer Academic Publishers: Norwell, MA, USA, 2001. [Google Scholar]
  22. Ljubomir, G.; Pamučar, D.; Drobnjak, S.; Pourghasemi, H.R. Modeling the Spatial Variability of Forest Fire Susceptibility Using Geographical Information Systems and the Analytical Hierarchy Process; Elsevier: Amsterdam, The Netherlands, 2019. [Google Scholar]
  23. Ha, M.H.; Yang, Z.; Heo, M.W. A new hybrid decision making framework for prioritising port performance improvement strategies. Asian. J. Shipp. Logist. 2017, 33, 105–116. [Google Scholar] [CrossRef]
  24. Mardani, A.; Jusoh, A.; Zavadskas, E. Fuzzy multiple criteria decision-making techniques and applications—Two decades review from 1994 to 2014. Exp. Sys. Appl. 2015, 42, 4126–4148. [Google Scholar] [CrossRef]
  25. Ruiz-Padillo, A.; Pasqual, F.M.; Uriarte, A.M.; Cybis, H.B. Application of multicriteria decision analysis methods for assessing walkability: A case study in Porto Alegre, Brazil. Trans. Res. Part D 2018, 63, 855–871. [Google Scholar] [CrossRef]
  26. Shafiei, S.; Vaelizadeh, R.; Bertrand, F.; Ansari, M. Evaluating and ranking of travel mode in metropolitan. A transportation economic approach. Civ. Eng. J. 2018, 4, 1303–1314. [Google Scholar] [CrossRef]
  27. Dudek, M.; Solecka, K.; Richter, M. A multicriteria appraisal of the selection of means of urban user transport using the Electre and AHP methods. Czas. Tech. 2018, 6, 79–93. [Google Scholar]
  28. Moslem, S.; Duleba, S. Application of AHP for evaluating user demand for public transport improvements in Mersin, Turkey. Pollack Period. 2018, 13, 67–76. [Google Scholar] [CrossRef]
  29. Ma, F.; He, J.; Ma, J.; Xia, S. Evaluation of urban green transportation planning based on central point triangle whiten weight function and entropy-AHP. Transp. Res. Procedia. 2017, 25, 3634–3644. [Google Scholar] [CrossRef]
  30. Murat, Y.S.; Arslan, T.; Cakici, Z.; Akqam, C. Analytical Hierarchy Process (AHP) based Decision Support System for Urban Intersections in Transportation Planning. In Using Decision Support Systems for Transportation Planning Efficiency; Ocalir-Akunal, E.V., Ed.; IGI Global, Gazi University: Ankara, Turkey, 2016; pp. 203–222. [Google Scholar]
  31. Chen, Y.; Wang, S.; Yao, J.; Li, Y.; Yang, S. Socially responsible supplier selection and sustainable supply chain development: A combined approach of total interpretive structural modeling and fuzzy analytic network process. Bus. Strategy Environ. 2018, 27, 1708–1719. [Google Scholar] [CrossRef]
  32. Moslem, S.; Ghorbanzadeh, O.; Blaschke, T.; Duleba, S. Analysing stakeholder consensus for a sustainable transport development decision by the fuzzy AHP and interval AHP. Sustainability 2019, 11, 3271. [Google Scholar] [CrossRef] [Green Version]
  33. Moslem, S.; Gul, M.; Farooq, D.; Celik, E.; Ghorbanzadeh, O.; Blaschke, T. An integrated approach of best-worst method (BWM) and triangular fuzzy sets for evaluating driver behavior factors related to road safety. Mathematics 2020, 8, 414. [Google Scholar] [CrossRef] [Green Version]
  34. Kudlac, S.; Gasparik, J.; Dedik, M.; Kurenkov, P. Identification of Restricting Criteria for Comprehensive Assessment of Logistics Chains in Intermodal Transport. LOGI Sci. J. Trans. Log. 2018, 9, 18–27. [Google Scholar] [CrossRef] [Green Version]
  35. Stopka, O.; Stopkova, M.; Ľuptak, V.; Krile, S. Application of the chosen multi-criteria decision-making Methods to identify the autonomous train system supplier. Trans. Prob. 2020, 15, 45–57. [Google Scholar] [CrossRef]
  36. Stopka, O.; Kampf, R. Determining the most suitable layout of space for the loading units’ handling in the maritime port. Transport 2018, 33, 2802013290. [Google Scholar] [CrossRef] [Green Version]
  37. Naharudin, N.; Salleh, A.H.; Abdul Halim, M.; Abd Latif, Z. Conceptual Framework for Walkability Assessment for Pedestrian Access to Rail Transit Services by using Spatial-MCDA. In Proceedings of the IOP Conf. Series: Earth and Environmental Science, Hulun Buir, China, 28–30 August 2020. [Google Scholar]
  38. Dogan, O.; Deveci, M.; Canıtez, F.; Kahraman, C. A corridor selection for locating autonomous vehicles using an interval-valued intuitionistic fuzzy AHP and TOPSIS method. Soft Compu. 2019, 24. [Google Scholar] [CrossRef]
  39. Grošelj, P.; Zadnik Stirn, L. Evaluation of several approaches for deriving weights in fuzzy group analytic hierarchy process. J. Decis. Syst. 2018, 27, 217–226. [Google Scholar] [CrossRef]
  40. Fan, G.; Zhong, D.; Yan, F.; Yue, P. A hybrid fuzzy evaluation method for curtain grouting efficiency assessment based on an AHP method extended by D numbers. Expert Syst. Appl. 2016, 44, 289–303. [Google Scholar] [CrossRef]
  41. Prasetyo, D.H.; Mohamad, J.; Fauzi, R. A GIS-based multicriteria decision analysis approach for public school site selection in Surabaya, Indonesia. Geomatica 2018, 72, 69–84. [Google Scholar] [CrossRef]
  42. Pourghasemi, H.R.; Pradhan, B.; Gokceoglu, C. Application of fuzzy logic and analytical hierarchy process (AHP) to landslide susceptibility mapping at Haraz watershed, Iran. Nat. Hazards 2012, 63, 965–996. [Google Scholar] [CrossRef]
  43. About Jeddah. (In Arabic). Available online: https://edu.moe.gov.sa/jeddah/About/Pages/%D8%B9%D9%86-%D8%AC%D8%AF%D8%A9.aspx (accessed on 15 September 2020).
  44. Jehhah CPI Profile. 2018. Available online: https://www.futuresaudicities.org/cpi-reports/CPI%20Profile%20for%20Jeddah.pdf (accessed on 15 September 2020).
  45. Jeddah City. (In Arabic). Available online: https://www.jeddah.gov.sa/Jeddah/About/index.php (accessed on 29 August 2020).
  46. Frank, L.D.; Sallis, J.F.; Saelens, B.E.; Leary, L.; Cain, K.; Conway, T.L.; Hess, P.M. The development of a walkability index: Application to the Neighborhood Quality of Life Study. Br. J. Sports Med. 2010, 44, 924–933. [Google Scholar] [CrossRef]
  47. Alcantud, J.C.R.; de Andrés Calle, R.; Cascón, J.M. A unifying model to measure consensus solutions in a society. Math. Comput. Modell. 2013, 57, 1876–1883. [Google Scholar] [CrossRef]
  48. Zavadskas, E.K.; Cavallaro, F.; Podvezko, V.; Ubarte, I.; Kaklauskas, A. MCDM assessment of a healthy and safe built environment according to sustainable development principles: A practical neighborhood approach in vilnius. Sustainability 2017, 9, 702. [Google Scholar] [CrossRef] [Green Version]
  49. Saaty, T.L. A scaling method for priorities in hierarchical structures. J. Math. Psychol. 1977, 15, 234–281. [Google Scholar] [CrossRef]
  50. Saaty, T.L. The Analytic Hierarchy Process; McGraw-Hill: New York, NY, USA, 1980. [Google Scholar]
  51. Triantaphyllou, E.; Mann, S.H. Using the analytic hierarchy process for decision making in engineering applications: Some challenges. Int. J. Ind. Eng. Appl. Pract. 1995, 2, 35–44. [Google Scholar]
  52. Rahaman, A.S.; Solavagounder, A. Geoinformatics based landslide vulnerable zonation mapping using analytical hierarchy process (AHP), a study of Kallar river sub watershed, Kallar watershed, Bhavani basin, Tamil Nadu. Model. Earth Syst. Environ. 2017, 3. [Google Scholar] [CrossRef]
  53. Ross, T.J. Fuzzy Logic. with Engineering Application, 2nd ed.; Wiley Publication: Hoboken, NJ, USA, 2010. [Google Scholar]
  54. Lima-Junior, F.R.; Carpinetti, L.C.R. Dealing with the problem of null weights and scores in fuzzy analytic hierarchy process. Soft Compu. 2020, 24, 9557–9573. [Google Scholar] [CrossRef]
  55. Buckley, J.J. Fuzzy hierarchical analysis. Fuzzy Set Syst. 1985, 17, 233–247. [Google Scholar] [CrossRef]
  56. The Value of Walkability and Walk Score Inaccuracies. Available online: https://www.cnu.org/publicsquare/2016/09/19/value-walkability-and-walk-score-inaccuracies (accessed on 15 September 2020).
  57. Gardner, K.; Johnson, T.; Buchan, K.; Pharoah, T. Developing a pedestrian strategy for London. In Transport Policy and its Implementation. Transport Policy and its Implementation, Proceedings of the Seminar B Held at the 24th Europan Transort Forum, England, UK, 2–6 September 1996; National Academy of Science: Washington, DC, USA, 1996. [Google Scholar]
  58. Moura, F.; Cambra, P.; Goncalves, A. Measuring walkability for distinct pedestrian groups with a participatory assessment method: A case study in Lisbon. Landsc. Urban. Plan. 2017, 157, 282–296. [Google Scholar] [CrossRef]
  59. Cervero, R.; Kockelman, K. Travel demand and the 3Ds: Density, diversity, and design. Transport. Res. D Transp. Environ. 1997, 2, 199–219. [Google Scholar] [CrossRef]
  60. Ewing, R.; Connors, M.; Goates, J.; Hajrasouliha, A.; Neckerman, K.; Nelson, A.; Greene, W. Validating urban design measures. In Proceedings of the Transportation Research board 92nd Annual Meeting, Washington, DC, USA, 13–17 January 2013. [Google Scholar]
  61. Pikora, T.J.; Giles-Corti, B.; Kkuiman, M.W.; Bull, F.C.; Jamrozik, K.; Donovan, R.J. Neighborhood environmental factors correlated with walking near home: Using SPACES. Med. Sci. Sports Exerc. 2006, 38, 708–714. [Google Scholar] [CrossRef]
  62. Addy, C.L.; Wilson, D.K.; Kirtland, K.A.; Ainsworth, B.E.; Sharpe, P.; Kimsey, D. Associations of Perceived Social and Physical Environmental Supports with Physical Activity and Walking Behavior. Am. J. Public Health 2004, 94, 440–443. [Google Scholar] [CrossRef]
  63. Dičiūnaitė-Rauktienė, R.; Virginija Gurskienė, V.; Burinskienė, M.; Maliene, V. The Usage and Perception of Pedestrian Zones in Lithuanian Cities: Multiple Criteria and Comparative Analysis. Sustainability 2018, 10, 818. [Google Scholar] [CrossRef] [Green Version]
  64. Carmona, M. London’s local high streets: The problems, potential and complexities of mixed street corridors. Prog. Plan. 2014, 100, 1–84. [Google Scholar] [CrossRef] [Green Version]
Figure 1. The research processes. FAHP: fuzzy analytic hierarchy process.
Sustainability 12 09286 g001
Figure 2. Map of Jeddah and the locations of the case studies. (a) GIS map of the case studies (b) Satellite map of the case studies (c) Jeddah’s districts.
Sustainability 12 09286 g002
Figure 3. Fuzzy triangular scale.
Sustainability 12 09286 g003
Table 1. The characteristics of the study boundaries.
Neighborhood CharacteristicsAl-NaeemAl-SamerAl-NaseemAl-Salamh
DensityLow to mediumLow to mediumHighHigh
Presence of Mixed-use and Commercial StreetsLow to mediumMedium to highHighHigh
Presence of Pedestrian AreasOnly in a small area in the center of the neighborhoodOnly in a small area in the north of the neighborhood NoneThe entire west side of the neighborhood
Sidewalk WidthOnly walkable in the pedestrian areaWide only in the commercial streetsWide, as there are many commercial streets in the areaWide, as there are many commercial streets in the area
Table 2. The scales for pair-wise comparisons [42].
ScalesDegree of ImportanceDescriptionsFuzzy Triangular ScaleReciprocal Fuzzy Triangular Scale
1EqualThe two criteria are equally important to the other pairs(1,1,1)(1,1,1)
3ModerateThe criteria are slight to moderately more important(2,3,4)(1/4,1/3,1/2)
5StrongThe criteria are much more important or essential (4,5,6)(1/6,1/5,1/4)
7Very strongThe criteria are strongly favored over the other pairs, and this is shown in practice(6,7,8)(1/8,1/7,1/6)
9Extremely strongThe criteria are undeniably favored over the other pairs, and this is shown in practice(9,9,9)(1/9,1/9,1/9)
2Intermediate valuesUsed to represent intermediate values between degree 1, 3, 5, 7, and 9(1,2,3)(1/3,1/2,1)
4(3,4,5)(1/5,1/4,1/3)
6(5,6,7)(1/7,1/6,1/5)
8(7,8,9)(1/9,1/8,1/7)
Table 3. An example of a fuzzy comparison matrix table.
Criteria C1C2C3C4C5C6C7C8
Unclean EnvironmentC1(1,1,1)(1/6,1/5,1/4)(1/4,1/3,1/2)(1/3,1/2,1)(2,3,4)(2,3,4)(1,2,3)(1/4,1/3,1/2)
Poor InfrastructureC2(4,5,6)(1,1,1)(2,3,4)(3,4,5)(6,7,8)(9,9,9)(4,5,6)(1,2,3)
Lack of Safety from CrimeC3(2,3,4)(1/4,1/3,1/2)(1,1,1)(1,2,3)(3,4,5)(4,5,6)(2,3,4)(1/3,1/2,1)
Lack of Road SafetyC4(1,2,3)(1/5,1/4,1/3)(1/3,1/2,1)(1,1,1)(2,3,4)(4,5,6)(2,3,4)(1/4,1/3,1/2)
Lack of Street LightingC5(1/4,1/3,1/2)(1/8,1/7,1/6)(1/5,1/4,1/3)(1/4,1/3,1/2)(1,1,1)(1,2,3)(1/3,1/2,1)(1/8,1/7,1/6)
No ParksC6(1/4,1/3,1/2)(1/9,1/9,1/9)(1/6,1/5,1/4)(1/6,1/5,1/4)(1/3,1/2,1)(1,1,1)(1/3,1/2,1)(1/8,1/7,1/6)
Lack of Pedestrian AreaC7(1/3,1/2,1)(1/6,1/5,1/4)(1/4,1/3,1/2)(1/4,1/3,1/2)(1,2,3)(1,2,3)(1,1,1)(1/6,1/5,1/4)
Bad WeatherC8(2,3,4)(1/3,1/2,1)(1,2,3)(2,3,4)(6,7,8)(6,7,8)(4,5,6)(1,1,1)
Table 4. Random consistency index (RI) [49].
N (Number of Factors)12345678910
RI0.000.000.520.891.111.251.351.401.451.49
Table 5. The destination criteria and their FAHP weights for each neighborhood.
NeighborhoodMosqueGrocery StoreSupermarketPedestrian AreaSeafrontParksMeeting AcquaintancesPharmacySchoolRestaurant
Al-Naeem28%16%14%21%6%N/Q3%2%2%5%
Al-Samer31%24%9%12%7%5%3%4%3%3%
Al-Naseem30.2%15%19%11%7%5.4%3.8%2.4%4%2.4%
Al-Salamh26%26%13%13%2%6%6%3%3%N/Q
Table 6. Criteria that make up a walkable neighborhood and their FAHP weights for each neighborhood. Table 7 shows the weights of encouragement criteria for each neighborhood.
NeighborhoodPedestrian AreaParksInfrastructureGreen ZonesClean EnvironmentSafety from CrimeSeparation from CarsStreet LightRoad SafetyServices’ Proximity
Al-Naeem29%10%22%16%5%6%2%N/Q3%3%
Al-Samer31%20%13%10%8%2%5%3%5%N/Q
Al-Naseem29%22%17%10%7%3%2%2%3%5%
Al-Salamh27%16%4%8%20%11%2%4%2%6%
Table 7. Criteria that encourage walking and their FAHP weights for each neighborhood.
NeighborhoodExerciseRecreationInfrastructureTemperate WeatherServices’ ProximityPedestrian AreaMosquesAlternative TransportRoad SafetyClean Environment
Al-Naeem31%21.6%8.4%11%3%11%2%4%3%4%
Al-Samer30%14%21%10%5%3%5%4%5%3%
Al-Naseem33%15.9%2.8%4.7%11.6%13.7%8%2.8%4.7%2.8%
Al-Salamh31.3%19%6.3%13.4%11%2%8%4%2%3%
Table 8. Criteria that discourage walking and their FAHP weights for each neighborhood.
NeighborhoodPoor InfrastructureBad WeatherLack of Safety from CrimeLack of Road SafetyUnclean EnvironmentNo Pedestrian AreaLack of Street LightNo Parks
Al-Naeem33.6%23.3%8.4%8.4%5.3%14.7%3.5%2.8%
Al-Samer33.3%23%12.4%13%5%7.3%3%3%
Al-Naseem34%22%15%10%6%6%4%3%
Al-Salamh23.4%34%14.7%7%10.4%3%4.5%3%
Table 9. The overall result of the criteria and their weight and ranking.
RankDestinationsElementsEncouragementDiscouragement
CriteriaScoreCriteriaScoreCriteriaScoreCriteriaScore
1Mosque0.309Pedestrian Area0.324Exercise0.296Poor Infrastructure0.326
(31%)(32%)(30%)(33%)
2Grocery Store0.192Parks0.188Recreation0.220Bad Weather0.233
(19%)(19%)(22%)(23%)
3Supermarket0.146Infrastructure0.148Infrastructure + Temperate Weather0.125Lack of Safety from Crime0.150
(15%)(15%)(12%)(15%)
4Pedestrian Area0.112Green Zones0.102Services’ Proximity0.069Lack of Road Safety0.106
(11%)(10%)(7%)(11%)
5Seafront0.083Clean Environment0.082Pedestrian Area0.051Unclean Environment0.074
(8%)(8%)(5%)(7%)
6Parks0.052Safety from Crime0.050Mosques0.043No Pedestrian Area0.050
(5%)(5%)(4%)(5%)
7Meeting Acquaintances0.039Separation from Cars 0.034Alternative Transport0.028Lack of Street Lighting0.035
(4%)(3%)(3%)(4%)
8Pharmacy0.029Road Safety0.028Road Safety0.025No Parks0.026
(3%)(3%)(3%)(3%)
9School0.022Services’ Proximity0.026Clean Environment0.018N/QN/Q
(2%)(3%)(2%)
10Restaurant0.018Street Light0.018N/QN/QN/QN/Q
(2%)(2%)
Consistency ratio0.0950.0940.0860.067
Publisher’s Note: MDPI stays neutral with regard to jurisdictional claims in published maps and institutional affiliations.

