Improving Cooperation among Farmers for Communal Land Conservation in Ethiopia: A Public Goods Experiment

1
Social Sciences Division, Japan International Research Center for Agricultural Sciences, 1-1 Ohwashi, Tsukuba 305-8686, Japan
2
Department of Agricultural and Resource Economics, College of Dryland Agriculture and Natural Resources, Mekelle University, Mekelle 231, Ethiopia
*
Author to whom correspondence should be addressed.
Sustainability 2020, 12(21), 9290; https://0-doi-org.brum.beds.ac.uk/10.3390/su12219290
Submission received: 18 September 2020
/
Revised: 4 November 2020
/
Accepted: 7 November 2020
/
Published: 9 November 2020
Abstract
:Farmers in developing countries depend on communal natural resources, yet countries in Sub-Saharan Africa are facing the severe degradation of communal lands due to the so-called “tragedy of the commons”. For the sustainable management of common resources, policy interventions, such as farmer seminars, are necessary to ensure high-level cooperation among farmers for land conservation. However, the effects of this type of information provision are not well known. The purpose of this study is to examine the effects of the dissemination of conservation information on collaborative communal forest management using an economic field experiment with 936 farmers selected by random sampling from 11 villages in the northern Ethiopian Highlands. We conducted a public goods game experiment using a framework of voluntary contribution to communal land conservation with an intervention to remind participants about the consequence of their behaviors. The results show that the volunteer contribution increased after the intervention, and thereafter the decay of the contribution was slow. The results indicate that providing information about the consequences leads to a higher contribution. The effects of information provision are heterogeneous in terms of social condition, such as access to an urban area and social capital, and individual characteristics, such as wealth. These findings imply that information provision effectively improves farmer collaboration toward natural resource conservation in developing countries.
1. Introduction
Communal lands support the livelihood of rural people in many developing countries. Since community-owned forests and pasture provide ecosystem services, such as forage and fuelwood, timber, and water [1,2,3], the sustainable utilization of communal lands is often questioned [4,5]. Further, Sub-Saharan African countries, such as Ethiopia, have experienced a severe degradation of communal lands [6,7,8,9,10]. It is difficult to protect communal lands from illegal invasion by people or animals [11,12]. This is especially true for natural forest conservation in Sub-Saharan Africa, where population pressure is high [8,13]. The sustainable management of common resources requires social norms or rules [14,15,16], and individuals using communal lands must be aware of the necessity to collaborate with each other [9,17,18,19]. Even if external people or donors create rules for communal lands, local people might not follow them in the long run [20,21]. Monitoring and enforcement are costly and technically difficult to adopt in developing countries [22]. Thus, the autonomous development of local people’s motivation is important [23,24,25]. In particular, they should be aware that the conservation of their own resources will benefit them [26,27].
Past empirical studies show that the awareness of, or motivation for, land conservation and collaboration among local people is important to prevent land degradation [7,17,18,28,29,30,31,32,33,34,35,36]. Although individuals’ decisions about communal land utilization tend to cause a free-riding problem, which results in the tragedy of the commons, the social norm of collaboration among community members can prevent this problem [37]. Some empirical studies show evidence that the provision of adequate information, through training or extension services, to local people is effective for natural resource conservation [17,18,34,38,39]. Since most of these studies used questionnaire surveys, it is unknown whether people’s contribution to public goods was correctly measured. Moreover, to know whether information provision enhances awareness of resource conservation, it is necessary to conduct an experiment involving the voluntary provision of public goods.
The purpose of this study is to examine the effects of information provision among community members on the awareness of collaboration for the conservation of communal lands in Ethiopia. We conducted a public goods game experiment for farmers living in different areas, as well as personal interviews. We introduced an “intervention” of information provision (i.e., a brief explanation in the middle of the session) in the standard public goods game. The purpose of the intervention is to test whether the average contribution of a public goods game, which usually declines (i.e., decays) over a session, increases after the information provision. The hypotheses to be tested here are whether the contribution increases just after the intervention and whether the contribution is maintained at a high level thereafter.
This study conducted an experiment with 936 households in a rural area of northern Ethiopia, where land degradation, including soil erosion and deforestation, is severe due to natural calamities, human-induced factors, such as the expansion of grazing and farmland, and high population pressure [6,7,10,40]. However, since the 1990s, the vegetation has been significantly improved due to community works [6,41]. Haregeweyn et al. [9] argue that despite a recent improvement in soil and water conservation in the Ethiopian highlands, socio-economic constraints, such as profitability, costs, and community participation, remain. Thus, how to improve the collaboration among community members is a key factor for the sustainable development of rural areas in Ethiopia.
2. Materials and Method
2.1. Conceptual Framework
A public goods game can evaluate people’s voluntary contribution to public goods, which represents their moral awareness of the conservation of common property resources [37,42]. While the amount of contribution becomes zero in a Nash equilibrium for self-interested individuals, as assumed in standard neo-classical economics, it becomes positive if individuals have altruism or reciprocity toward other people. The contribution is based on altruism in a narrow sense, that is similar to reciprocity, so that an individual contributes while expecting others to also contribute [43].
In a repeated public goods game, contribution “decays” while it is repeating [44]. Thereafter, laboratory experiments have revealed the mechanism of the decay. Players decide their own contribution based on the past contribution of the other players [45,46]. The players tend to match their own contribution to that of the others [47]. They realize that other players obtain benefits from free-riding without paying; subsequently they also become a free-rider, which creates a decaying contribution [48]. Thus, the amount of the contribution depends on the previous contributions of the others and the mutual relationships among the players. However, it is not very clear what kinds of specific situations affect the decay.
Andreoni [49] determines a restarting effect of the public goods game by which the contribution increases when a new session restarts. When one session of the game ends and a new session starts from the beginning, the contribution at the beginning of the second session is generally higher than the contribution at the end of the first session [49,50]. The reason for this restarting effect is now well identified [46]. Andreoni [49] argues that the restarting effect occurs because new social norms are established after the first game. Burlando and Hey [51] and Mengel [52] argue that players re-think what they should do according to their recent experience; hence, the new contribution is made based on past experiences. Kandori [53] and Figuieres et al. [54] explain a mechanism of decaying intrinsic moral motivation: assuming that individuals have a high motivation at the beginning and the motivation then decays gradually, the restarting effect occurs when players want to refresh their mind and re-establish a relationship with others.
Information is a key factor in influencing common property resource management [55]. Providing information about the participants’ duties and the expectations of other people through discussion, or persuasion between players, can enhance mutual cooperation [56,57]. Chaudhuri and Paichayontvijit [58] show that exhortative messages result in higher cooperation in a public goods game. However, there is a risk that persuasion or exhortation induces the behavior of players in a certain direction, which may erode the objectivity of the experiment.
In our experiment, we give only one reminder, which is the same as the instruction we give to players before starting the game. We prohibit any persuasion, recommendation, or informing players about any values. In addition, to avoid the restarting effect, we do not stop an ongoing session; we give the instruction in the middle of a session and continue without a break.
2.2. Data
It is important to conduct economic experiment studies with people in the field. Although economic experiments have generally been conducted with educated people in developed countries, the results of these experimental studies do not apply necessarily to cases worldwide, since altruism and reciprocity are affected by cultural contexts [59]. Although information and communication are important determinants of natural resource conservation [60,61], economic experiments on the effects of information provision on natural resource conservation have rarely been undertaken in rural areas of developing countries, calling for further empirical studies in these areas.
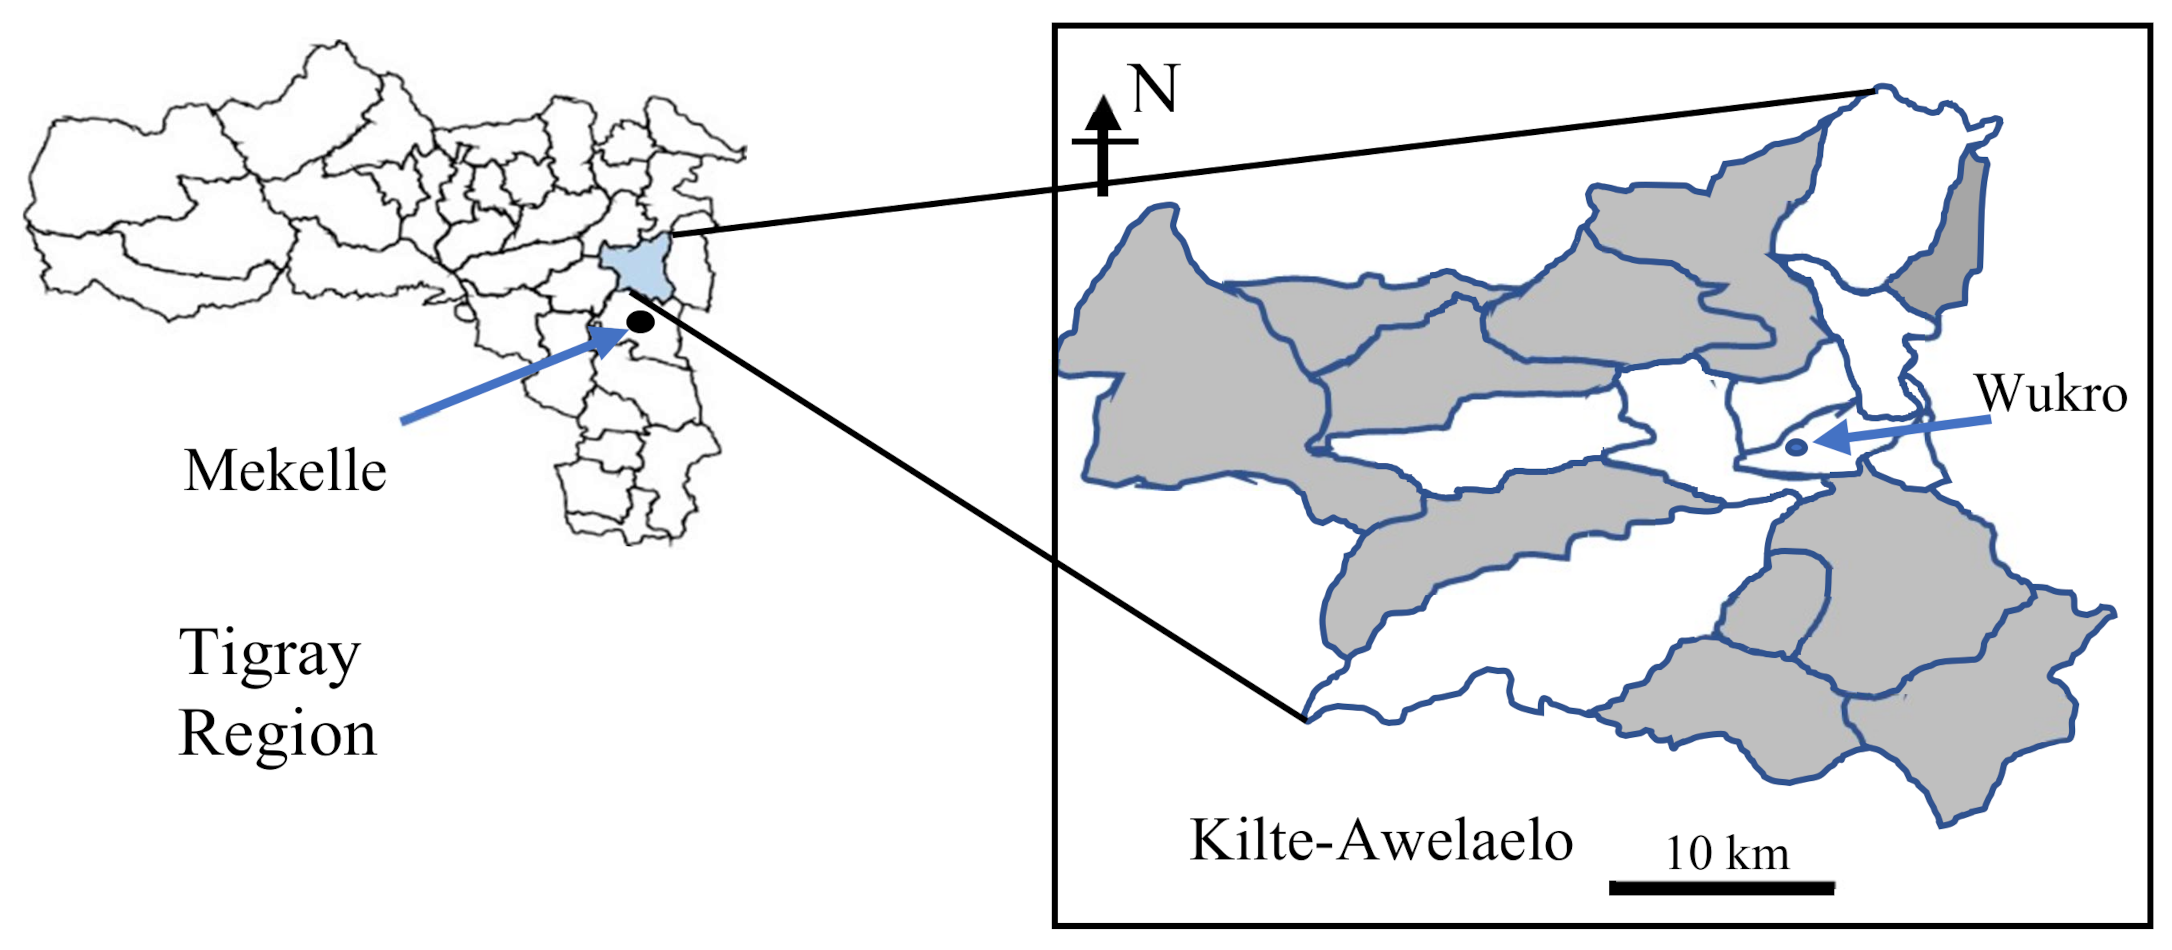
We conducted economic experiments about farmers’ awareness of conservation for communal lands in the Kilte-Awelaelo District (woreda), in the Tigray Region, Ethiopia, from September 2019 to February 2020. While Ethiopia has diversified ecosystems, the Kilte-Awelaelo District is situated in a semi-arid area, 2000–2300 m above sea level. The center of the district, Wukro, is located approximately 960 km north of the national capital, Addis Ababa, and approximately 50 km north of the regional capital of Tigray, Mekelle. The distance from the district (woreda) center to the centers of the surveyed villages (tabia) ranges between 11 km and 37 km.
Communal lands in Ethiopia provide valuable natural resources to local farmers. Tigray farmers graze their animals in communal forests, and collect therein animal fodder and firewoods, although only dead branches may be collected for firewood [62]. The Tigray Region has experienced the degradation of communal natural resources due to excessive grazing and collection of wood. Since local institutions and community bylaws have been established by local farmers over the past two decades, the conservation of natural resources has improved [63]. Villagers in Kilte-Awelaelo divide communal land resources into free-grazing areas, seasonal-grazing areas, and enclosed areas, and strictly control the period of grazing and animals [64]. Farmers in the Tigray Region engage in various practices of conservation of communal forests and pastures [65]. The rules of communal land utilization are determined by community meetings in each village [66,67].
Most residents in villages are smallholder farmers, with cattle, sheep, goats, and donkeys. No one has agricultural machinery in this area. Available farmland areas are limited, and the livelihood status of farmers remains at a low level in this district [65]. Some engage in non-farm daily work, such as carpentry, trading, and stone and sand collection. Landless farmers work for share-cropping, while some of them engage in agricultural or forestry works, or hillside distribution [68]. Most farmers engage in voluntary work for the conservation of communal lands, such as the construction of stone-bunds, soil-bunds, stone terraces, deep trenches, and check dams, as well as tree plantations [69,70,71,72]. Communal resource conservation and management in Tigrai is entirely conducted through collective actions in which rural households are obliged to participate. The collective effort includes the free labor contribution of farmers (through public mobilization) and food for work projects funded by governmental organizations and NGOs. Unpaid labor force for collective action is mobilized at the household level, based on the number of people who are 18 years old and above that and are able to work. Thus, it is implicitly assumed that labor is an abundant resource that rural households can readily provide to manage communal resources. The eligible members of each household are obliged to engage in 20 working days every year and for even longer periods in some villages.
The study sites are 11 villages of the Kilte-Awelaelo District, the eastern part of Tigray Region, in northern Ethiopia (Figure 1). The total number of surveyed farmers is 936. All participants of the experiments are farmers using communal lands. The participants of the experiment were selected from lists of all households in each village (tabia), using a standard random selection procedure. People in administrative positions, such as village leaders and police officers, were excluded. We conducted experiments in the classrooms of village schools and meeting halls of farmers’ training centers in the villages. During the experiment, participants were seated to keep a distance of at least 3 m from each other.
2.3. Experimental Design and Procedures
We followed a standard linear public goods game, that is, an experiment for a voluntary contribution mechanism of public goods. The experiment involved eight people. There were 117 sessions and 936 participants. Each player earned 50 Ethiopian Birr (ETB: 1 ETB = 0.031 USD on 1 January 2020) as a show-up fee along with his or her earnings in the experiment. The initial endowment was 20 ETB: each player received 20 coins of 1 ETB. Each session involved 10 rounds of the game. Players were not informed about how many rounds were conducted.
In this experiment, a hypothetical scenario was created to explain the benefits of cooperation and the negative effect of non-cooperative behavior in collective action to conserve communal forest and other resources in a community.
Following the scenario, to improve communal land, each player was asked to provide any amount of contributions from 0 to 5 ETB into an individual envelope. After each round, the contributions of all subjects were aggregated, doubled and divided equally among all players, and then re-distributed to each player. The contribution was paid from the money in their possession.
Each session took 1.5 h. The initial instruction for the experiment took about 30 min on average. Facilitators read the instruction (Appendix A), explained the procedure of the game, and showed illustrations of some examples, not suggesting what the participants should do. After an experiment was finished, we conducted individual interviews with each participant in a private space to collect personal data.
During the instruction, we explained the scenario of the experiment to the participants: this is a case in which each participant contributes for the conservation of communal land that they usually use. To ensure that participants understood the rules of the public goods game correctly, we took sufficient time for instruction. Since half of them did not have formal education, we carefully explained the instructions using their language without mathematical notation. During the instruction, we showed some examples to explain how the game works. After the instruction, we tested the understanding of all participants and repeated the instruction until they fully understood it.
The payoff function for an individual i is
where pi is the payoff for person i and ci is the contribution made by individual i. The first term of the left-hand side of Equation (1) represents the individual share, which is twice the sum of the contributions divided by eight people, and the second term is each individual’s contribution.
To test if information provision enhances farmers’ awareness, facilitators conducted the following “intervention”. After the 5th round in each session, the facilitator repeated the initial instruction to participants before starting the game. The facilitator did not add any message about what the participants should do. Any persuasion and suggestion by the facilitator or assistants was strictly prohibited. We tried not to take a break during the intervention.
The null hypothesis for the statistical test is that the contribution in the 6th round is equal to or smaller than the contribution in the 5th round. Since the contribution has a tendency to decay, the contribution in the 6th round is not higher than that in the 5th round unless the effect of information provision is higher.
2.4. Econometric Model
We estimated the following models. The first model is to estimate determinants of the amount of the contribution. The amount of the contribution is bounded between 0 and 5, whereas the actual willingness to pay for the contribution may be higher or lower. As the dependent variable is continuous and censored, a Tobit model is applied; it enables us to estimate the determinant factors of the amount of the contribution. The dependent variable is the amount of contribution in each round of the public goods game.
where ci represents the contribution of individual i to public goods, t is time (round), Roundk (2 < k < 10) is a dummy variable for the round, z is a 1xM vector of individual and geographic characteristics, ε is the error term, and α, β, γ, δ, and ρ are parameters. Here, we estimated three kinds of models. Model I is a basic model that consists of only dummies of each round and average previous contribution. Model II includes individual and geographic characteristics. Model III includes cross-terms of these variables with a dummy of Round 6, which includes the contribution at the initial round (pay_1). Since previous studies show evidence of decaying contribution over time [46,49,50,54], we propose a null hypothesis according to which the contribution does not increase due to the intervention of information provision; thus, β6 + Σδn ≤ 0. Therefore, the null hypothesis is rejected if β6 + Σδn > 0, supporting a positive effect of the intervention. Furthermore, if βj > 0 for 7 ≤ j ≤ 10, then the null hypothesis of the impact of the intervention disappears in the round, and we accept an alternative hypothesis about the impact of the intervention.
In addition, to investigate how the contribution changes each time, we also estimated the difference model of the amount of the contribution:
This model tests the impact of the intervention on decay in each round. If α0 < 0 (for all i), the contribution generally decays. If βj > 0 for 7 ≤ j ≤ 10, then the null hypothesis, according to which the speed of decay after the intervention is the same as the average, is rejected, and we accept the hypothesis that the speed of decay is smaller than the average.
The variables used for the estimation of the econometric models are presented in Table 1. The variable of pay is the amount of voluntary contribution in each round; that of dpay is the extent to which it is different from the previous round; and that of previous is the average value of the contribution in the previous round for all of the other participants. The variables of female, education, and age indicate characteristics of the household head. Furthermore, land fertility may affect the motivation for soil water conservation, since farmers consider the expected benefits of their conservation works [73,74,75]. While the study areas are not very fertile as a whole, areas with Calcisols are less fertile than others. The variable of fertility is 0 if Calcisols are dominant and 1 otherwise. The variable of distance indicates the distance in kilometers from the district center, Wukro, to the participants’ home. Trust shows whether a respondent thinks that people in the same village trust each other, which may affect the conservation of natural resources [61,76,77,78,79]. During the personal surveys conducted after the experiments, we asked respondents whether people in the same village, even those who do not know each other, trust each other. The variables of farmland and animal represent the size of the participants’ farmland area and the number of livestock in the tropical livestock unit, respectively.
Table 1 also presents the mean and standard deviation for each variable. The mean of pay is positive and significant, which represents a significant voluntary contribution to public goods, rejecting the hypothesis of perfectly selfish behaviors assumed in neo-classical economics. The negative value of dpay indicates a declining or “decaying” contribution, which was observed in previous studies of public goods games [44,80].
3. Results
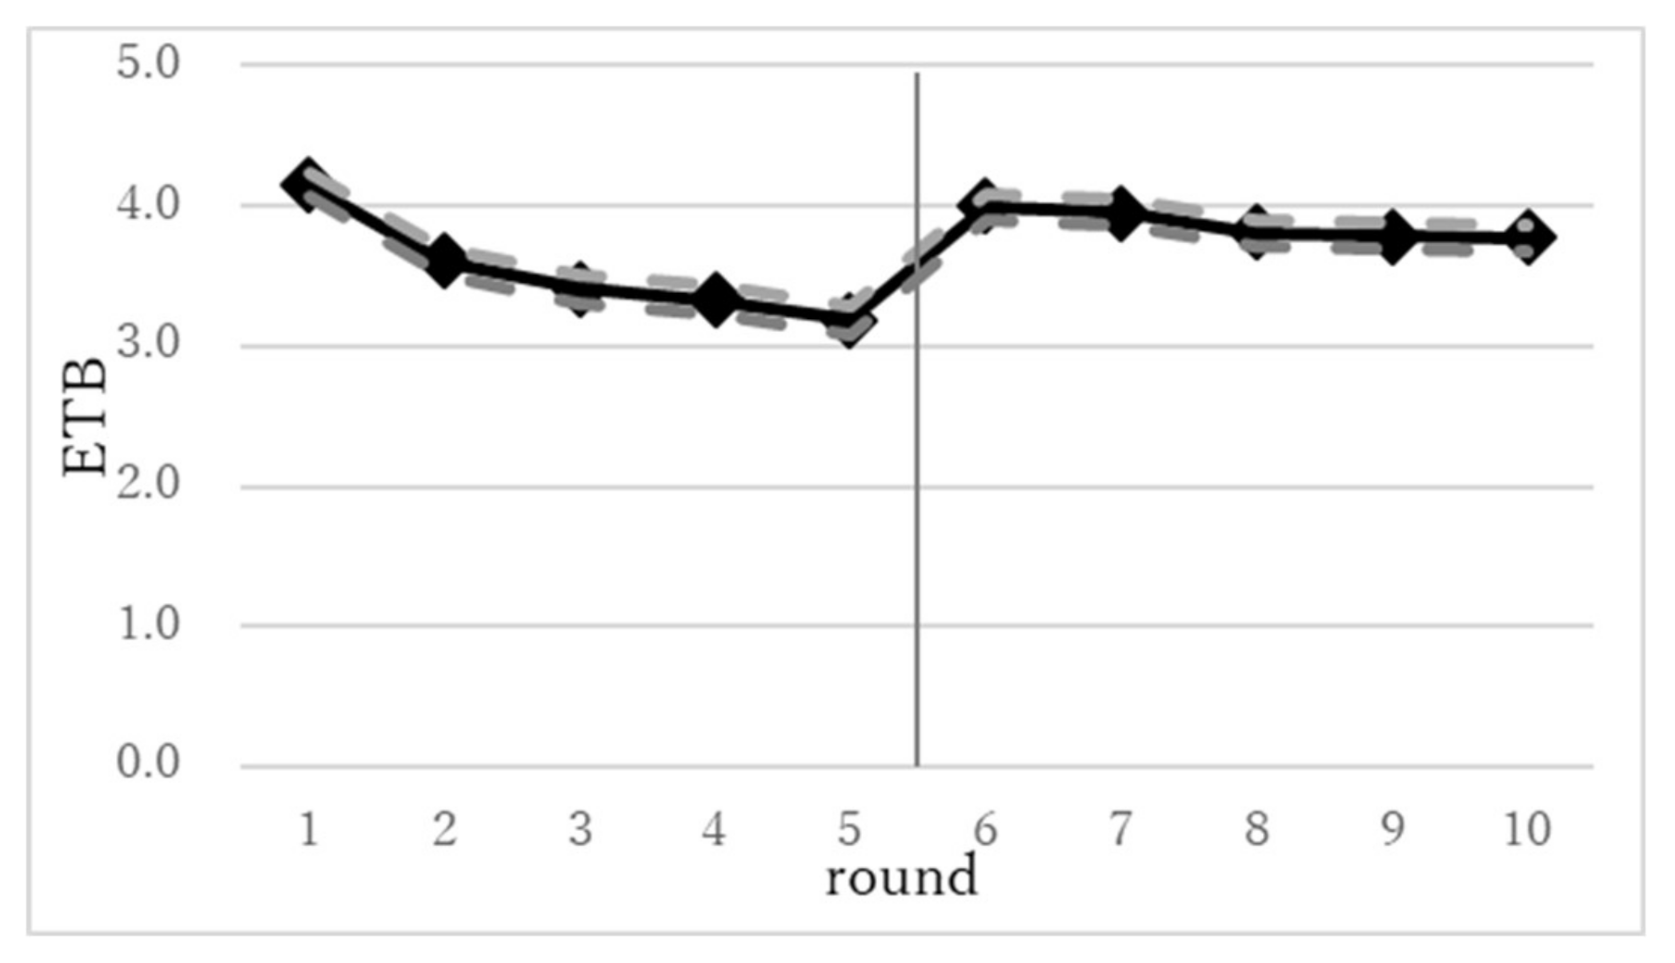
The average amounts of contribution per player are presented in Figure 2. The dotted lines are their 95% confidence intervals, which are narrow due to the large sample size for all rounds (9360). Throughout the session, the average amount of contribution is relatively high. While players’ choice is between 0 and 5 ETB, the average contribution for all rounds is above 3 ETB. The average contribution exceeds 4 ETB at the beginning (Round 1), but it drops until the round just before the intervention (Round 5). After the intervention, it returns to approximately 4 ETB in the round just after the intervention (Round 6). After the intervention, the contribution slightly drops until the final round (Round 10). The speed of decay of the contribution becomes slower.
Table 2 shows the average amount of contribution in key rounds: Round 1 (the initial round), Round 5 (the round just before the intervention), Round 6 (the round just after the intervention), and Round 10 (the final round). The first row of Table 2 shows average payments in ETB in each round, and the values in the second row indicate the extent to which they changed. The t-statistics of the changes in terms of the null hypothesis of no change are in parentheses. The contribution declines from Round 1 to Round 5 by 0.964 ETB. It increases by 0.808 ETB from Round 5 to Round 6, so that 85.1% of the drop from Round 1 to Round 5 is regained. The contribution declines during the period from Round 6 to Round 10 by 0.224 ETB. The t-test for the null hypothesis of no difference between drop during Rounds 1 to 5 and the drop during Rounds 6 to 10 is rejected at the 1% level. The rate of change in contribution per round is −4.9% during Round 1 to Round 5 and −1.1% during Round 6 to Round 10. The t-test shows once again a significant difference at the 1% level. The fourth and fifth rows of Table 2 compare a group of people living in peripheral areas located 20 km away from the district center and a group of people living in central areas, within 20 km. While the contribution in Round 1 is almost the same for both groups, the contribution drops more for the central area group than for the rural area group. After the intervention, the contribution recovers in both groups but remains higher for the peripheral area group.
Table 3 presents the results of the estimation for Tobit models for determinants of contribution to public goods. The estimates for Round 6 to Round 10 are all positive and significant at the 1% level. This shows that the amount of contribution increases after the intervention. In particular, the estimates of Round 6 are positive in Model I and Model II, directly indicating that the contribution increases at Round 6. Note that Model III has cross-terms of Round 6, so that the impact is not apparent. The estimates of Round 10 are positive for all models; thus, the effects of the intervention remain until the end of the game.
The coefficient estimates of distance are positive in Model II and Model III. This shows that the contribution is higher as the distance increases. The coefficient estimate of trust is positive, suggesting that higher social capital among people in the same village results in a higher contribution. Furthermore, older people contribute more. The estimates of soil fertility, size of farmland, and number of animals are all negative.
The cross-terms in Model III show the effects on changes in contribution after the intervention. Education has a positive influence on contribution, showing that the increase in Round 6 is greater for those with higher education. Soil fertility also has positive effects on contribution. Those with larger farmland or more animals have positive effects on changes in the contribution. Those who contributed more in Round 1 have a greater increase in the contribution.
Table 4 presents the coefficient estimates of the OSL (ordinary least squares) regression models for determinants of changes in contribution. The dependent variable is changes in the amount of contribution in each round. While Table 3 shows factors of a contribution level, Table 4 represents factors of decay or an increase in contribution. The results of the estimation show that all models show positive coefficients for Round 6, indicating significant effects of the intervention as above. The coefficients of Rounds 6, 7, 9, and 10 are positive, while no estimates before Round 5 are significantly positive. This result shows that changes in contribution are higher after the intervention. The F-test of the null hypothesis according to which all of the coefficients of Rounds 7 to 10 are zero is rejected at the 1% level, supporting the hypothesis that the speed of decay is lower after the intervention than the average contribution of all rounds.
The estimates of Model II and Model III also show significant heterogeneity on changes in the contribution. Older people, those living far from town, and those who trust each other experienced a lower decay in contribution, implying that community ties affect the changes in contribution. People living in fertile areas, those with a larger farmland, and those with more livestock holdings show a greater decay in contribution. This suggests that richer farmers are likely to decrease their contribution. Model III’s estimates for cross-terms with education, fertility, and animal are positive, and the distance is negative, confirming the results of Table 3.
4. Discussion
This study has revealed that information on the consequences of players’ behaviors related to communal land conservation can promote collaboration among community members in rural areas in Ethiopia. It shows that the behavioral effects of information provision, which have been found in lab experiments in developed countries [81,82], also occur in rural areas in Ethiopia, suggesting that policy intervention using this effect is possible.
While previous studies [56,57,58] have provided information to persuade or induce players to collaborate, this study did not do so. Instead, we only showed an example of the consequence of possible behaviors. The result shows that the contribution to the public resources increases by providing participants with a chance to be aware of the importance of the contribution. This is consistent with questionnaire surveys in the past that show that farmers’ training has positive effects on conservation activities [17,18,34,38,39]. In addition, this study has found that the speed of decay of awareness is lower after the provision of information.
Previous public goods games show that collaboration among players is enhanced when one session of the game ends and a new session starts [49,83]. Experiments in this study are not the same as the restarting effects, because we performed the intervention in the middle of a session and continued the game immediately while the experiment was not reset to the new game. Still, the contribution jumped up as if it was a restarting case. As Norton [84] mentions, it is probable that Schelling’s [85] focal point works as a trigger of collaboration when everyone implicitly assumes its importance.
The effects of contribution in the previous period are positive, suggesting that the contribution is higher if other members contribute a larger amount in the previous round, and it is lower if others contribute less. This demonstrates endogeneity in voluntary contributions. When people believe that other people are more collaborative, they become more altruistic. Meanwhile, when they believe that others are less collaborative, they become less altruistic. This is also confirmed by the positive estimate of trust among people in a community. It shows that contribution is higher in communities where people have more trust in other members.
Whereas past studies point out the existence of heterogeneity in the contribution to public goods depending on communities [51,86], the factors of the heterogeneity are not well known. This study reveals that the heterogeneity is caused by social conditions, such as access to urban sector, social capital (i.e., trust) among people in a community, and the individual characteristics of a player, such as wealth. The result that altruism is higher in remote areas is consistent with Oniki et al. [66]. Age and distance from an urban area have positive effects on the contribution. The result that trust has a positive effect is in accordance with previous studies of trust games [76,77,78,87]. The findings are also consistent with those of the public goods game of Croson [50], which showed that the contribution is lower when members change frequently. Young people and those living in central areas are likely to interact more frequently with people in other areas through non-farm work and social exchange, which may reduce the contribution. The negative effects of fertility, size of farmland, and number of animals on the contribution imply that wealthier farmers are less interested in cooperation with others. Collaboration with other members of a community is more important for poor farmers in terms of labor-sharing and risk-sharing.
5. Conclusions
Ethiopia is facing severe land degradation in community-owned forests and pasture. Because benefits from the communal lands, such as fodder, firewood, and recharge water, are essential for farmers’ livelihood in rural Ethiopia, it is critical that farmers’ in the country voluntarily contribute to the conservation of these lands. However, intervention in the form of monetary incentives is not effective, as it does not create intrinsic motivation among local people [88,89,90]. We applied a public goods game experiment and showed that information about the consequences of collaboration increased players’ public contribution; that is, it enhanced farmers’ conservation awareness. Although we did not tell players what they should do or suggest moral behavior—we only reminded them of the basic rules of the game—the average contribution increased nearly to the initial level and hardly decreased after the intervention. This result shows that players reconsidered their conduct, enhancing collaboration among their community to achieve the best outcomes.
The finding indicates that reminding people of the consequences of their behavior significantly changes their behavior with regard to conservation in rural areas of Ethiopia. This suggests that providing information is an effective intervention that can promote common resource management in other developing countries. We also found that even though Ethiopia is a low-income country, local farmers have a strong tendency to contribute to the community rather than maximizing their own profits. The results of this study suggest that periodic seminars to remind local farmers of the benefits of communal lands could enable them to maintain a high level of commitment to natural resource conservation and sustainable development.
Moreover, this study shows the existence of heterogeneity in the contribution to natural resource conservation in terms of players’ personal and geographic characteristics, which has rarely been found in experiments with educated people in developed countries. In particular, urbanization has negative effects on improving the contribution, which implies that more intensive intervention to increase the farmers’ awareness is required as communities become economically developed.
It should be noted that the main purpose of this study was to undertake an inter-temporal comparison of behaviors before and after the provision of information; thus, we did not use cross-sectional controls without intervention in the same round. This study could be extended to compare various scenarios including different types of information or communication methods. In such a case, the experiment would require controls without intervention. A further future extension could be a randomized controlled trial that provides information about communal land conservation to local farmers in different communities. This would provide a more realistic scenario for intervention programs to enhance moral awareness of resource conservation in developing countries.
Author Contributions
Conceptualization, S.O. and H.E.; methodology, S.O.; formal analysis, S.O.; investigation, H.E., M.B., and T.N.; resources, H.E., M.B., and T.N.; data curation, S.O., H.E., M.B., and T.N.; writing—original draft preparation, S.O.; writing—review and editing, H.E., M.B., and T.N.; supervision, H.E.; project administration, S.O. All authors have read and agreed to the published version of the manuscript.
Funding
This research received no external funding.
Acknowledgments
This study is part of the Watershed Management Project in Africa, of Japan’s International Research Center for Agricultural Sciences. We thank the Office of Agriculture and Natural Resources of Kilte-Awelaelo District for support for this study. We also acknowledge the assistance with data analysis by Shah Alamgir.
Conflicts of Interest
The authors declare no conflict of interest.
Appendix A. Guidelines, Instructions, and Rules Applied during the Public Goods Game (English Translation)
General Notice
- 1
- During the survey, please keep silent so that the other people do not know your answer. Please do not talk with other participants. Please do not make any comments to the other participants about your decisions. If you have any questions, please raise your hand and we can help you any time.
- 2
- Before starting the experiment, we need to obtain consent from participants.
Instructions for Experiment
- ①
- Now we are going to start a session. You will earn real money that you can take home.
- ②
- Assume that all of you use the same communal land in this tabia together. No other farmers use the communal land. If you want to improve the conditions of the communal land, you must work for soil and water conservation and sacrifice your other works. We will call this conservation work “contribution”. In this game, you pay actual money to show that you sacrifice something.
- ③
- If you undertake soil and water conservation in the communal land, then more grass and trees can grow in the communal land. Then, you can collect more grass or firewood from the communal land, so your livelihood will be better. We call this “benefit” in this game.
- ④
- This game uses a simpler framework, but it is similar to the case of voluntary work for communal land management.
- ⑤
- In this game, you can contribute any amount of money up to 5 ETB each time.
- ⑥
- After you contribute some money to communal land, the condition of communal land becomes better. Then you earn some benefit. In this game, the total contribution amount from all of you will be doubled. We will add the same amount of money as the total contribution amount.
- ⑦
- Remember that in the case of communal land improvement, everyone can use the communal land equally. So, the total contribution amount from all of you is equally divided among each person. We will not tell you who contributed how much ETB.
- ⑧
- We will repeat several rounds of this game. You can take home all the money you earn.
- ⑨
- In summary, (1) In each round, put your contribution from 0 ETB to 5 ETB in your envelope and hand it to the assistants. (2) We will double the total amount. (3) The total amount is divided equally among participants. (4) You may receive benefit or lose money. (5) This process is repeated.
- ⑩
- If you do not understand the instructions well or have any questions, please raise your hand.
Example (This Part is Repeated after the 5th Round)
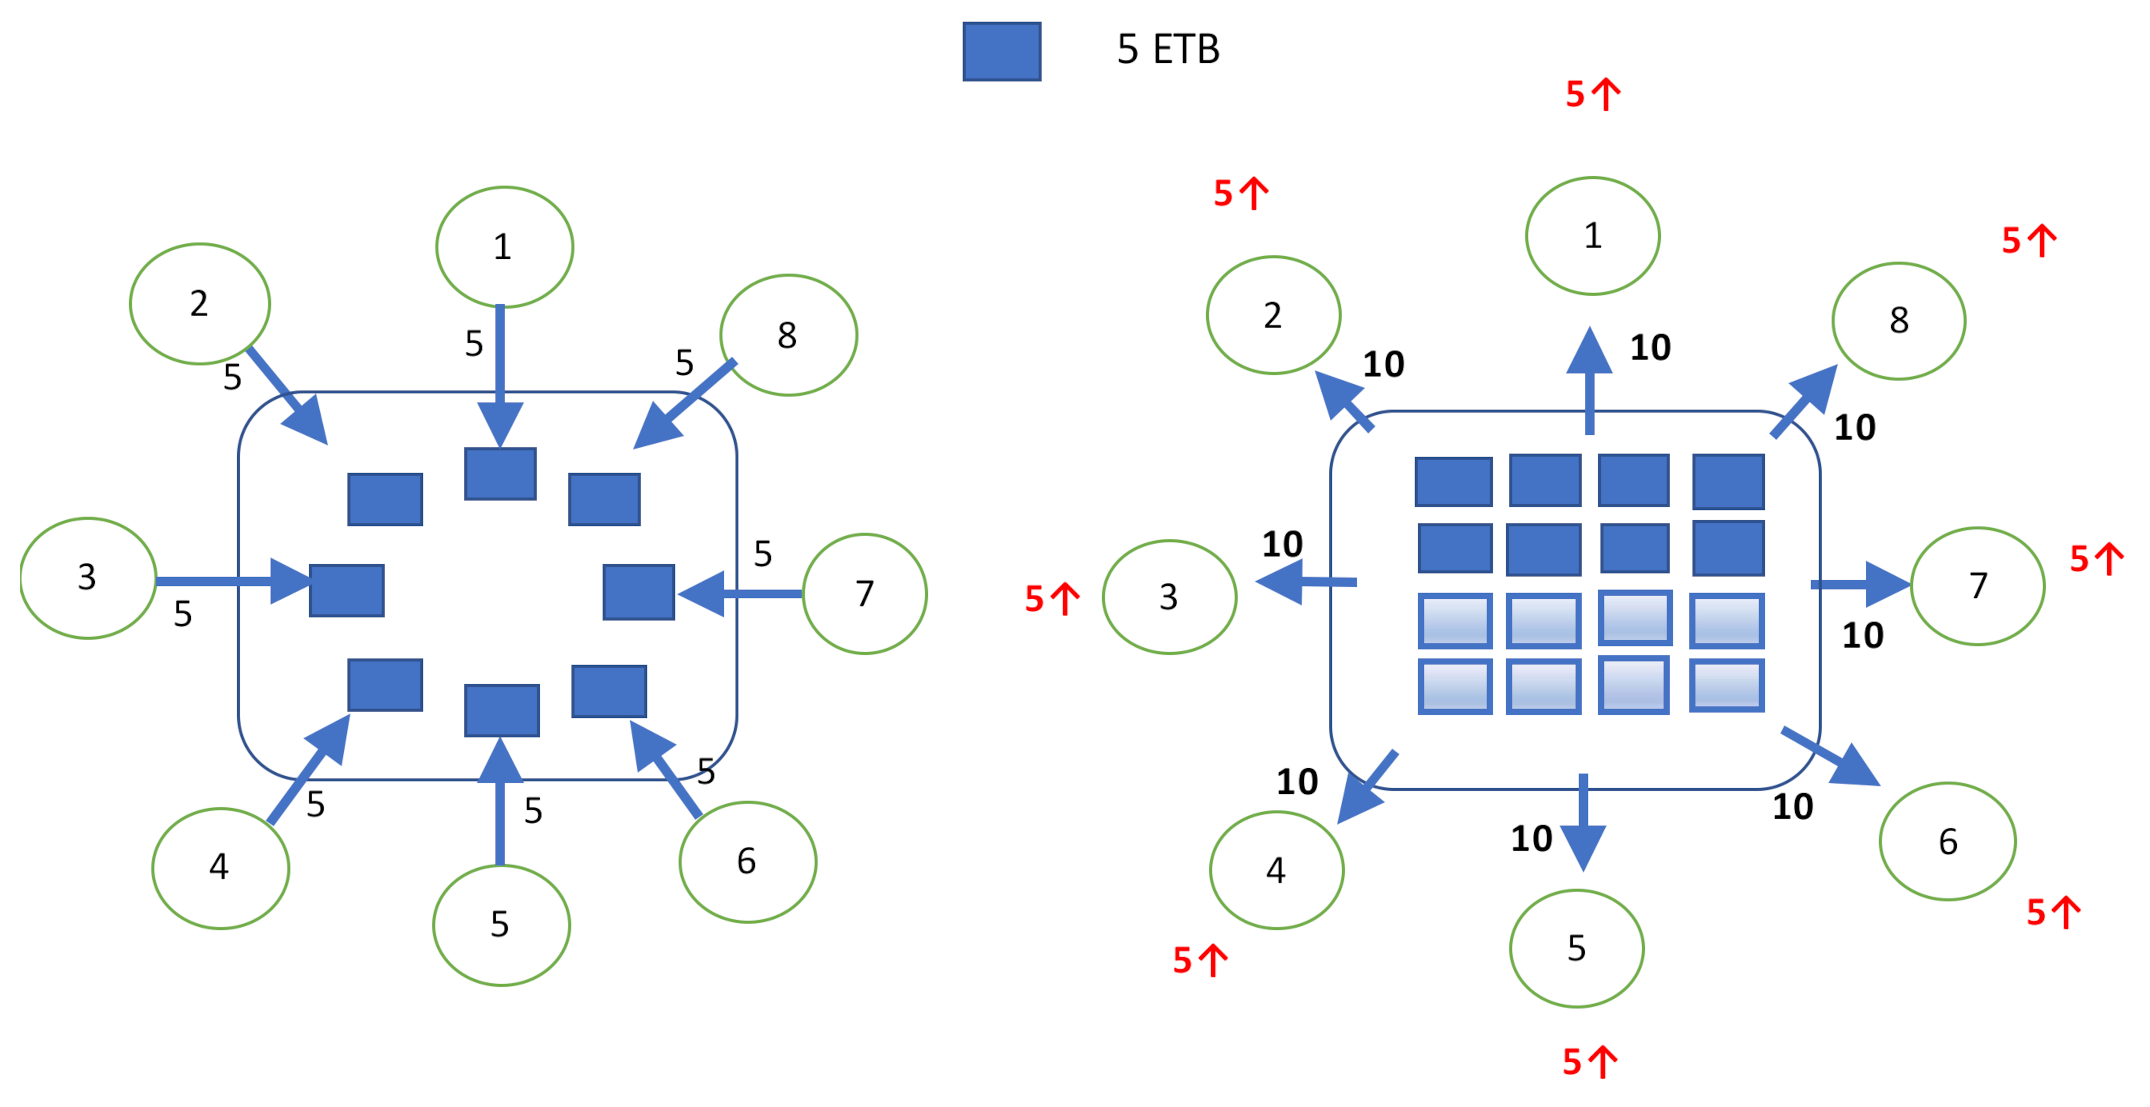
Experimenter: show Figure A1 and explain the following example.
Figure A1.
Illustration used to explain the experiment.

- ①
- Now I will present an example so that you can understand this game more clearly. These eight people, 1, 2, ..., 8, use this communal land together.
- ②
- Assume that you are one of the eight people. Suppose each person contributes 5 ETB to a public account. This black square (■) represents a 5-ETB note.
- ③
- Now we have eight black squares in total. Then, the amount will double to give 16 black squares.
- ④
- These 16 notes are divided equally among eight people. Each person receives the same amount of money. In this figure, each person receives two black squares, worth 10 ETB.
- ⑤
- Remember that each person paid 5 ETB initially and now has 10 ETB. So, all of you earn the benefit of 5 ETB.
- ⑥
- If you have any questions, please let me know now.
Starting the Game
- ①
- Now, you get 20 ETB as a part of the participation fee for this experiment. It is yours. In each round of the game, you will contribute up to 5 ETB. You can contribute nothing, which means you do not contribute your money. You can choose 0, 1, 2, 3, 4, or 5 ETB. Do not contribute more than 5 ETB. If you choose 0 ETB, please submit an empty envelope to an assistant. (To assistants: Please indicate a place for each participant so that everyone stays as far as possible (at least 3 m) from the other participants.)
- ②
- Now we will start the first round of the game. Please put any amount of money up to 5 ETB that you want to contribute to improve the common communal land. Then, please hand your envelope to one of the assistants.
- ③
- Remember that you should not show or tell other participants how much money you enter. Please do not speak at all during the game. Please always hide your money so that the other participants do not see it. Please raise your hand when you have a question.
- ④
- (After checking the amount of money and collecting all money in envelopes) We are going to start the next round of the game. Please put your contribution in your envelope. (Note: experimenters and assistants should not reveal how many rounds we will have.
Intervention after Finishing the 5th Game
Now I want to remind you of the characteristics of this game (show the illustration figure and repeat the same explanation as that at the beginning).
References
- Abebe, S.T.; Dagnew, A.B.; Zeleke, V.G.; Eshetu, G.Z.; Cirella, G.T. Willingness to pay for watershed management. Resources 2019, 8, 77. [Google Scholar] [CrossRef] [Green Version]
- Kwayu, E.J.; Paavola, J.; Sallu, S.M. The livelihood impacts of the Equitable Payments for Watershed Services (EPWS) program in Morogoro, Tanzania. Environ. Dev. Econ. 2017, 22, 328–349. [Google Scholar] [CrossRef] [Green Version]
- Wunder, S. The efficiency of payments for environmental services in tropical conservation. Conserv. Biol. 2007, 21, 48–58. [Google Scholar] [CrossRef]
- Muhati, G.L.; Olago, D.; Olaka, L. Participatory scenario development process in addressing potential impacts of anthropogenic activities on the ecosystem services of Mt. Marsabit Forest, Kenya. Glob. Ecol. Conserv. 2018, 14, e00402. [Google Scholar] [CrossRef]
- Laurance, W.F. Reflections on the tropical deforestation crisis. Biol. Conserv. 1999, 91, 109–117. [Google Scholar] [CrossRef]
- Gebremicael, T.G.; Mohamed, Y.A.; van der Zaag, P.; Hagos, E.Y. Quantifying longitudinal land use change from land degradation to rehabilitation in the headwaters of Tekeze-Atbara Basin, Ethiopia. Sci. Total Environ. 2018, 622–623, 1581–1589. [Google Scholar] [CrossRef] [PubMed]
- Shiferaw, B.; Holden, S.T. Resource degradation and adoption of land conservation technologies in the Ethiopian Highlands: A case study in Andit Tid, North Shewa. Agric. Econ. 1998, 18, 233–247. [Google Scholar] [CrossRef]
- Teucher, M.; Schmitt, C.B.; Wiese, A.; Apfelbeck, B.; Maghenda, M.; Pellikka, P.; Lens, L.; Habel, J.C. Behind the fog: Forest degradation despite logging bans in an East African cloud forest. Glob. Ecol. Conserv. 2020, 22, e01024. [Google Scholar] [CrossRef]
- Haregeweyn, N.; Tsunekawa, A.; Nyssen, J.; Poesen, J.; Tsubo, M.; Meshesha, D.T.; Schuett, B.; Adgo, E.; Tegegne, F. Soil erosion and conservation in Ethiopia: A review. Prog. Phys. Geogr. 2015, 39, 750–774. [Google Scholar] [CrossRef] [Green Version]
- Haregeweyn, N.; Tsunekawa, A.; Poesen, J.; Tsubo, M.; Meshesha, D.T.; Fenta, A.A.; Nyssen, J.; Adgo, E. Comprehensive assessment of soil erosion risk for better land use planning in river basins: Case study of the Upper Blue Nile River. Sci. Total Environ. 2017, 574, 95–108. [Google Scholar] [CrossRef] [Green Version]
- Yang, Y.; Li, H.; Liu, Z.; Hatab, A.A.; Ha, J. Effect of forestland tenure security on rural household forest management and protection in southern China. Glob. Ecol. Conserv. 2020, 22, e00952. [Google Scholar] [CrossRef]
- Giday, K.; Humnessa, B.; Muys, B.; Taheri, F.; Azadi, H. Effects of livestock grazing on key vegetation attributes of a remnant forest reserve: The case of Desa’a Forest in northern Ethiopia. Glob. Ecol. Conserv. 2018, 14, e00395. [Google Scholar] [CrossRef]
- Place, F.; Otsuka, K. Population pressure, land tenure, and tree resource management in Uganda. Land Econ. 2000, 76, 233–251. [Google Scholar] [CrossRef]
- Ostrom, E. Governing the Commons: The Evolution of Institutions for Collective Action; Cambridge University Press: Cambridge, UK, 1990. [Google Scholar]
- Cardenas, J.C. Social norms and behavior in the local commons as seen through the lens of field experiments. Environ. Resour. Econ. 2011, 48, 451–485. [Google Scholar] [CrossRef]
- Ostrom, E. Understanding Institutional Diversity; Princeton University Press: Princeton, NJ, USA, 2005. [Google Scholar]
- Mango, N.; Makate, C.; Tamene, L.; Mponela, P.; Ndengu, G. Awareness and adoption of land, soil and water conservation practices in the Chinyanja Triangle, Southern Africa. Int. Soil Water Conserv. Res. 2017, 5, 122–129. [Google Scholar] [CrossRef]
- Moges, D.M.; Taye, A.A. Determinants of farmers’ perception to invest in soil and water conservation technologies in the North-Western Highlands of Ethiopia. Int. Soil Water Conserv. Res. 2017, 5, 56–61. [Google Scholar] [CrossRef]
- Palmer, C.; Souza, G.L.; Laray, E.; Viana, V.; Hall, A. Participatory policies and intrinsic motivation to conserve forest commons. Nat. Sustain. 2020, 3, 620–627. [Google Scholar] [CrossRef]
- Bowles, S. The Moral Economy: Why Good Incentives Are No Substitute for Good Citizens; Yale University Press: New Haven, CT, USA; London, UK, 2016. [Google Scholar]
- Maini, R.; Lohmann, J.; Hotchkiss, D.R.; Mounier-Jack, S.; Borghi, J. What happens when donors pull out? Examining differences in motivation between health workers who recently had performance-based financing (PBF) withdrawn with workers who never received PBF in the Democratic Republic of Congo. Int. J. Health Policy Manag. 2019, 8, 646–661. [Google Scholar] [CrossRef] [Green Version]
- Chakraborty, R.N. Stability and outcomes of common property institutions in forestry: Evidence from the Terai region of Nepal. Ecol. Econ. 2001, 36, 341–353. [Google Scholar] [CrossRef]
- Singh, V.S.; Pandey, D.N.; Prakash, N.P. What determines the success of joint forest management? Science-based lessons on sustainable governance of forests in India. Resour. Conserv. Recycl. 2011, 56, 126–133. [Google Scholar] [CrossRef]
- Rishi, P. Joint forest management in India: An attitudinal analysis of stakeholders. Resour. Conserv. Recycl. 2007, 51, 345–354. [Google Scholar] [CrossRef]
- Travers, H.; Clements, T.; Keane, A.; Milner-Gulland, E.J. Incentives for cooperation: The effects of institutional controls on common pool resource extraction in Cambodia. Ecol. Econ. 2011, 71, 151–161. [Google Scholar] [CrossRef]
- Pawar, K.V.; Rothkar, R.V. Forest conservation & environmental awareness. Proc. Earth Planet. Sci. 2015, 11, 212–215. [Google Scholar]
- Nigussie, Z.; Tsunekawa, A.; Haregeweyn, N.; Tsubo, M.; Adgo, E.; Ayalew, Z.; Abele, S. The impacts of Acacia decurrens plantations on livelihoods in rural Ethiopia. Land Use Policy 2020, 100, 104928. [Google Scholar] [CrossRef]
- Desta, H.; Lemma, B.; Stellmacher, T. Farmers’ awareness and perception of Lake Ziway (Ethiopia) and its watershed management. Limnologica 2017, 65, 61–75. [Google Scholar] [CrossRef]
- Ariti, A.T.; van Vliet, J.; Verburg, P.H. Farmers’ participation in the development of land use policies for the Central Rift Valley of Ethiopia. Land Use Policy 2018, 71, 129–137. [Google Scholar] [CrossRef]
- Yami, M.; Mekuria, W.; Hauser, M. The effectiveness of village bylaws in sustainable management of community-managed exclosures in Northern Ethiopia. Sustain. Sci. 2013, 8, 73–86. [Google Scholar] [CrossRef]
- Gashaw, T.; Tulu, T.; Argaw, M.; Worqlul, A.W.; Tolessa, T.; Kindu, M. Estimating the impacts of land use/land cover changes on Ecosystem Service Values: The case of the Andassa watershed in the Upper Blue Nile basin of Ethiopia. Ecosyst. Serv. 2018, 31, 219–228. [Google Scholar] [CrossRef]
- Sileshi, M.; Kadigi, R.; Mutabazi, K.; Sieber, S. Determinants for adoption of physical soil and water conservation measures by smallholder farmers in Ethiopia. Int. Soil Water Conserv. Res. 2019, 7, 354–361. [Google Scholar] [CrossRef]
- Getahun, K.; Poesen, J.; Van Rompaey, A. Impacts of Resettlement Programs on Deforestation of Moist Evergreen Afromontane Forests in Southwest Ethiopia. Mt. Res. Dev. 2017, 37, 474–486. [Google Scholar] [CrossRef] [Green Version]
- Chesterman, N.S.; Entwistle, J.; Chambers, M.C.; Liu, H.-C.; Agrawal, A.; Brown, D.G. The effects of trainings in soil and water conservation on farming practices, livelihoods, and land-use intensity in the Ethiopian highlands. Land Use Policy 2019, 87, 104051. [Google Scholar] [CrossRef]
- Tefera, B.; Sterk, G. Land management, erosion problems and soil and water conservation in Fincha’a watershed, western Ethiopia. Land Use Policy 2010, 27, 1027–1037. [Google Scholar] [CrossRef]
- Abi, M.; Kessler, A.; Oosterveer, P.; Tolossa, D. Understanding the spontaneous spreading of stone bunds in Ethiopia: Implications for sustainable land management. Sustainability 2018, 10, 14. [Google Scholar] [CrossRef] [Green Version]
- Ostrom, E.; Gardner, R.; Walker, J. Rules, Games, and Common-Pooled Resources; The University of Michigan Press: Ann Arbor, MI, USA, 1994. [Google Scholar]
- Kpadonou, R.A.B.; Owiyo, T.; Barbier, B.; Denton, F.; Rutabingwa, F.; Kiema, A. Advancing climate-smart-agriculture in developing drylands: Joint analysis of the adoption of multiple on-farm soil and water conservation technologies in West African Sahel. Land Use Policy 2017, 61, 196–207. [Google Scholar] [CrossRef]
- Nigussie, Z.; Tsunekawa, A.; Haregeweyn, N.; Adgo, E.; Nohmi, M.; Tsubo, M.; Aklog, D.; Meshesha, D.T.; Abele, S. Farmers’ perception about soil erosion in Ethiopia. Land Degrad. Dev. 2017, 28, 401–411. [Google Scholar] [CrossRef]
- Minta, M.; Kibret, K.; Thorne, P.; Nigussie, T.; Nigatu, L. Land use and land cover dynamics in Dendi-Jeldu hilly-mountainous areas in the central Ethiopian highlands. Geoderma 2018, 314, 27–36. [Google Scholar] [CrossRef]
- Nyssen, J.; Frankl, A.; Haile, M.; Hurni, H.; Descheemaeker, K.; Crummey, D.; Ritler, A.; Portner, B.; Nievergelt, B.; Moeyersons, J.; et al. Environmental conditions and human drivers for changes to north Ethiopian mountain landscapes over 145 years. Sci. Total Environ. 2014, 485, 164–179. [Google Scholar] [CrossRef] [Green Version]
- Botelho, A.; Dinar, A.; Pinto, L.M.C.; Rapoport, A. Promoting cooperation in resource dilemmas: Theoretical predictions and experimental evidence. J. Behav. Exp. Econ. 2015, 54, 40–49. [Google Scholar] [CrossRef] [Green Version]
- Andreoni, J. Warm-glow versus cold-prickle: The effects of positive and negative framing on cooperation in experiments. Q. J. Econ. 1995, 110, 1–21. [Google Scholar] [CrossRef]
- Isaac, M.R.; McCue, K.F.; Plott, C.R. Public goods provision in an experimental environment. J. Public Econ. 1985, 26, 51–74. [Google Scholar] [CrossRef] [Green Version]
- Fischbacher, U.; Gächter, S.; Fehr, E. Are people conditionally cooperative? Evidence from a public goods experiment. Econ. Lett. 2001, 71, 397–404. [Google Scholar] [CrossRef] [Green Version]
- Fischbacher, U.; Gachter, S. Social preferences, beliefs, and the dynamics of free riding in public goods experiments. Amer. Econ. Rev. 2010, 100, 541–556. [Google Scholar] [CrossRef] [Green Version]
- Hashim, M.J.; Kannan, K.N.; Maximiano, S. Information Feedback, Targeting, and Coordination: An Experimental Study. Inf. Syst. Res. 2017, 28, 289–308. [Google Scholar] [CrossRef]
- Burton-Chellew, M.N.; El Mouden, C.; West, S.A. Social learning and the demise of costly cooperation in humans. Proc. R. Soc. B Biol. Sci. 2017, 284, 9. [Google Scholar] [CrossRef]
- Andreoni, J. Why free ride -Strategies and learning in public-goods experiments. J. Public Econ. 1988, 37, 291–304. [Google Scholar] [CrossRef]
- Croson, R.T.A. Partners and strangers revisited. Econ. Lett. 1996, 53, 25–32. [Google Scholar] [CrossRef]
- Burlando, R.; Hey, J.D. Do Anglo-Saxons free-ride more? J. Public Econ. 1997, 64, 41–60. [Google Scholar] [CrossRef]
- Mengel, F. Learning by (limited) forward looking players. J. Econ. Behav. Organ. 2014, 108, 59–77. [Google Scholar] [CrossRef] [Green Version]
- Kandori, M. The erosion and sustainability of norms and morale. Jpn. Econ. Rev. 2003, 54, 29–48. [Google Scholar] [CrossRef] [Green Version]
- Figuieres, C.; Masclet, D.; Willinger, M. Weak moral motivation leads to the decline of voluntary contributions. J. Public Econ. Theory 2013, 15, 745–772. [Google Scholar] [CrossRef] [Green Version]
- Banerjee, S.; de Vries, F.P.; Hanley, N.; van Soest, D.P. The impact of information provision on agglomeration bonus performance: An experimental study on local networks. Am. J. Agric. Econ. 2014, 96, 1009–1029. [Google Scholar] [CrossRef] [Green Version]
- Delaney, J.; Jacobson, S. Payments or persuasion: Common pool resource management with Price and non-price measures. Environ. Resour. Econ. 2016, 65, 747–772. [Google Scholar] [CrossRef] [Green Version]
- Brandts, J.; Rott, C.; Sola, C. Not just like starting over —Leadership and revivification of cooperation in groups. Exp. Econ. 2016, 19, 792–818. [Google Scholar] [CrossRef] [Green Version]
- Chaudhuri, A.; Paichayontvijit, T. On the long-run efficacy of punishments and recommendations in a laboratory public goods game. Sci. Rep. 2017, 7, 12286. [Google Scholar] [CrossRef]
- Henrich, J.; Heine, S.J.; Norenzayan, A. The weirdest people in the world? Behav. Brain Sci. 2010, 33, 61–83. [Google Scholar] [CrossRef]
- Bekele, W.; Drake, L. Soil and water conservation decision behavior of subsistence farmers in the Eastern Highlands of Ethiopia: A case study of the Hunde-Lafto area. Ecol. Econ. 2003, 46, 437–451. [Google Scholar] [CrossRef]
- Andersson, K.P.; Cook, N.J.; Grillos, T.; Lopez, M.C.; Salk, C.F.; Wright, G.D.; Mwangi, E. Experimental evidence on payments for forest commons conservation. Nat. Sustain. 2018, 1, 128–135. [Google Scholar] [CrossRef]
- Babulo, B.; Muys, B.; Nega, F.; Tollens, E.; Nyssen, J.; Deckers, J.; Mathijs, E. Household livelihood strategies and forest dependence in the highlands of Tigray, Northern Ethiopia. Agric. Syst. 2008, 98, 147–155. [Google Scholar] [CrossRef]
- Alemayehu, F.; Taha, N.; Nyssen, J.; Girma, A.; Zenebe, A.; Behailu, M.; Deckers, S.; Poesen, J. The impacts of watershed management on land use and land cover dynamics in Eastern Tigray (Ethiopia). Resour. Conserv. Recycl. 2009, 53, 192–198. [Google Scholar] [CrossRef]
- Ogawa, R.; Hirata, M.; Gebremedhin, B.G.; Uchida, S.; Sakai, T.; Koda, K.; Takenaka, K. Impact of differences in land management on natural vegetation in semi-dry areas: The case study of the Adi Zaboy watershed in the Kilite Awlaelo District, Eastern Tigray Region, Ethiopia. Environments 2019, 6, 13. [Google Scholar] [CrossRef] [Green Version]
- Etsay, H.; Negash, T.; Aregay, M. Factors that influence the implementation of sustainable land management practices by rural households in Tigrai region, Ethiopia. Ecol. Process. 2019, 8, 14. [Google Scholar] [CrossRef]
- Oniki, S.; Berhe, M.; Negash, T. Role of Social Norms in Natural Resource Management: The Case of the Communal Land Distribution Program in Northern Ethiopia. Land 2020, 9, 35. [Google Scholar] [CrossRef] [Green Version]
- Oniki, S.; Berhe, M.; Takenaka, K. Efficiency impact of the communal land distribution program in Northern Ethiopia. Sustainability 2020, 12, 4436. [Google Scholar] [CrossRef]
- Negash, T.; Oniki, S.; Berhe, M. Dependence level of rural landless households on allocated communal land: Evidences from Kilte awlaelo and Atsbi Wenberta Districts, Tigrai region, Northern Ethiopia. J. Land Rural Stud. 2019, 8, 57–76. [Google Scholar] [CrossRef]
- Berhe, M.; Hoag, D. The livelihood effects of landless people through communal hillside conservation in Tigray Region, Ethiopia. J. Dev. Agric. Econ. 2014, 6, 309–317. [Google Scholar]
- Gebremedhin, B.; Pender, J.; Tesfay, G. Community natural resource management: The case of woodlots in Northern Ethiopia. Environ. Dev. Econ. 2003, 8, 129–148. [Google Scholar] [CrossRef] [Green Version]
- Gebremeskel, G.; Gebremicael, T.G.; Girmay, A. Economic and environmental rehabilitation through soil and water conservation, the case of Tigray in northern Ethiopia. J. Arid Environ. 2018, 151, 113–124. [Google Scholar] [CrossRef]
- Hishe, S.; Lyimo, J.; Bewket, W. Impacts of soil and water conservation intervention on rural livelihoods in the Middle Suluh Valley, Tigray Region, northern Ethiopia. Environ. Dev. Sustain. 2019, 21, 2641–2665. [Google Scholar] [CrossRef]
- Rabia, A.H.; Afifi, R.R.; Gelaw, A.M.; Bianchi, S.; Figueredo, H.; Huong, T.L.; Lopez, A.A.; Mandala, S.D.; Matta, E.; Ronchi, M.; et al. soil mapping and classification: A case study in the Tigray Region, Ethiopia. J. Agric. Environ. Int. Dev. 2013, 107, 73–99. [Google Scholar]
- Gebremedhin, B.; Swinton, S.M. Investment in soil conservation in northern Ethiopia: The role of land tenure security and public programs. Agric. Econ. 2003, 29, 69–84. [Google Scholar] [CrossRef]
- Tesfaye, A.; Brouwer, R.; van der Zaag, P.; Negatu, W. Assessing the costs and benefits of improved land management practices in three watershed areas in Ethiopia. Int. Soil Water Conserv. Res. 2016, 4, 20–29. [Google Scholar] [CrossRef] [Green Version]
- Ansink, E.; Tesfaye, A.; Bouma, J.; Brouwer, R. Cooperation in watershed management: A field experiment on location, trust, and enforcement. Resour. Energy Econ. 2017, 50, 91–104. [Google Scholar] [CrossRef]
- Bouma, J.; Bulte, E.; van Soest, D. Trust and cooperation: Social capital and community resource management. J. Environ. Econ. Manag. 2008, 56, 155–166. [Google Scholar] [CrossRef]
- Jack, B.K. Upstream–downstream transactions and watershed externalities: Experimental evidence from Kenya. Ecol. Econ. 2009, 68, 1813–1824. [Google Scholar] [CrossRef]
- Vollan, B. Socio-ecological explanations for crowding-out effects from economic field experiments in southern Africa. Ecol. Econ. 2008, 67, 560–573. [Google Scholar] [CrossRef]
- Isaac, R.M.; Walker, J.M.; Thomas, S.H. Divergent Evidence on Free Riding—an Experimental Examination of Possible Explanations. Public Choice 1984, 43, 113–149. [Google Scholar] [CrossRef]
- Bohner, G.; Dickel, N. Attitudes and attitude change. Annu. Rev. Psychol. 2011, 62, 391–417. [Google Scholar] [CrossRef] [Green Version]
- Wood, W. Attitude change: Persuasion and social influence. Annu. Rev. Psychol. 2000, 51, 539–570. [Google Scholar] [CrossRef]
- Chaudhuri, A. Belief heterogeneity and the restart effect in a public goods game. Games 2018, 9, 96. [Google Scholar] [CrossRef] [Green Version]
- Norton, D.A. Killing the (coordination) moment: How ambiguity eliminates the restart effect in voluntary contribution mechanism experiments. Econ. Lett. 2015, 126, 1–5. [Google Scholar] [CrossRef]
- Schelling, T.C. The Strategy of Conflict; Harvard University Press: Cambridge, MA, USA, 1980. [Google Scholar]
- Henrich, J. Does culture matter in economic behavior? Ultimatum game bargaining among the Machiguenga of the Peruvian Amazon. Am. Econ. Rev. 2000, 90, 973–979. [Google Scholar] [CrossRef] [Green Version]
- Luswaga, H.; Nuppenau, E.-A. Participatory forest management in West Usambara Tanzania: What is the community perception on success? Sustainability 2020, 12, 921. [Google Scholar] [CrossRef] [Green Version]
- Rojas, C.; Cinner, J. Do market and trust contexts spillover into public goods contributions? Evidence from experimental games in Papua New Guinea. Ecol. Econ. 2020, 174, 10. [Google Scholar] [CrossRef]
- Deci, E.L. Effects of externally mediated rewards on intrinsic motivation. J. Pers. Soc. Psychol. 1971, 18, 105–115. [Google Scholar] [CrossRef]
- Nigussie, Z.; Tsunekawa, A.; Haregeweyn, N.; Adgo, E.; Cochrane, L.; Floquet, A.; Abele, S. Applying Ostrom’s institutional analysis and development framework to soil and water conservation activities in north-western Ethiopia. Land Use Policy 2018, 71, 1–10. [Google Scholar] [CrossRef]
Figure 1.
Location of study sites. Note: The shaded areas in the right figure indicate surveyed villages.
Figure 1.
Location of study sites. Note: The shaded areas in the right figure indicate surveyed villages.

Figure 2.
Average contribution by round. Notes: Change of contribution from 1 to 5, and from 6 to 10. The dotted lines indicate high and low confidence intervals at 5%. The vertical line indicates the timing of intervention.
Figure 2.
Average contribution by round. Notes: Change of contribution from 1 to 5, and from 6 to 10. The dotted lines indicate high and low confidence intervals at 5%. The vertical line indicates the timing of intervention.


Table 1.
Summary of variables.
| Variable. | Definition | Mean |
|---|---|---|
| pay | Own contribution (ETB) | 3.700 |
| dpay | Change in own contribution (ETB) | −0.042 |
| previous | Average contribution of the other participants in the previous round | 3.692 |
| gender | Gender (1 = female, 0 = male) | 0.295 |
| education | Schooling years | 0.487 |
| age | 40 years old or more | 0.693 |
| fertile | Soil fertility (1 = fertile, 0 = not fertile) | 0.282 |
| distance | Distance from the district center to home | 21.939 |
| trust | Trust all people in own village (1 = Yes, 0 = No) | 0.053 |
| farmland | Own farmland area (hectare) | 0.727 |
| animal | The number of animals (tropical livelihood unit) | 5.792 |
| round k | Dummy variable for the k-th round |
Table 2.
Average contribution in Rounds 1, 5, 6, and 10 (ETB).
| Round 1 | Round 5 | Round 6 | Round 10 | |
|---|---|---|---|---|
| Average amount of contribution | 4.150 | 3.187 | 3.995 | 3.770 |
| Change in contribution during the period | −0.963 | 0.808 | −0.224 | |
| (Round 1→5, 5→6, 6→10) | (−9.796) | (8.095) | (−2.361) | |
| Difference between change 1→5 | 0.739 | |||
| and change 6→10 | (6.368) | |||
| Peripheral area | 4.150 | 3.370 | 4.089 | 3.970 |
| Central area | 4.151 | 2.972 | 3.884 | 3.535 |
| Difference between peripheral and central areas | −0.001 | 0.397 | 0.205 | 0.435 |
| (−0.008) | (2.571) | (1.604) | (3.088) |
Note: t-statistics are in parentheses. “Peripheral area” indicates farmers living in areas further than 20 km from the district center. “Central area” indicates those living within 20 km of the district center.
Table 3.
Determinants of contribution in the public goods game: Tobit regression models.
| Dependent Variable: The Amount of Contribution (ETB) | ||||||
|---|---|---|---|---|---|---|
| I | II | III | ||||
| Coefficient | Standard Error | Coefficient | Standard Error | Coefficient | Standard Error | |
| previous | 1.121 | 0.0345 *** | 1.084 | 0.0348 *** | 1.080 | 0.0348 *** |
| gender | −0.090 | 0.0678 | −0.103 | 0.0715 | ||
| education | 0.014 | 0.0101 | 0.007 | 0.0106 | ||
| age | 0.206 | 0.0685 *** | 0.226 | 0.0721 *** | ||
| fertility | −0.213 | 0.0685 *** | −0.252 | 0.0721 *** | ||
| distance | 0.021 | 0.0037 *** | 0.022 | 0.0039 *** | ||
| trust | 0.395 | 0.1346 *** | 0.403 | 0.1422 *** | ||
| farmland | −0.112 | 0.0513 ** | −0.143 | 0.0539 *** | ||
| animal | −0.008 | 0.0051 | −0.010 | 0.0054 * | ||
| round 2 | −0.302 | 0.1249 ** | −0.280 | 0.1244 ** | −0.277 | 0.1241 ** |
| round 3 | 0.030 | 0.1215 | 0.034 | 0.1209 | 0.035 | 0.1206 |
| round 4 | 0.108 | 0.1208 | 0.108 | 0.1202 | 0.108 | 0.1200 |
| round 6 | 1.592 | 0.1253 *** | 1.585 | 0.1248 *** | 0.350 | 0.4969 |
| round 7 | 0.514 | 0.1259 *** | 0.543 | 0.1255 *** | 0.545 | 0.1253 *** |
| round 8 | 0.340 | 0.1249*** | 0.364 | 0.1244 *** | 0.366 | 0.1242 *** |
| round 9 | 0.512 | 0.1246 *** | 0.533 | 0.1242 *** | 0.535 | 0.1239 *** |
| round 10 | 0.571 | 0.1247 *** | 0.590 | 0.1242 *** | 0.591 | 0.1239 *** |
| round 6 *female | 0.098 | 0.2228 | ||||
| round 6 *education | 0.073 | 0.0333 ** | ||||
| round 6 *age | −0.237 | 0.2266 | ||||
| round 6 *fertility | 0.392 | 0.2258 * | ||||
| round 6 *distance | −0.011 | 0.0121 | ||||
| round 6 *trust | −0.037 | 0.4338 | ||||
| round 6 *farmland | 0.087 | 0.0471 * | ||||
| round 6 *animal | 0.017 | 0.0171 | ||||
| round 6 *pay1 | 0.238 | 0.0665 *** | ||||
| constant | 0.001 | 0.1399 | −0.322 | 0.1798 * | −0.287 | 0.1843 |
| n | 8424 | 8424 | 8424 | |||
| left-censored | 290 | 290 | 290 | |||
| right-censored | 3865 | 3865 | 3865 | |||
| log-likelihood | −12984 | −12947 | −12934 | |||
Note: *** p < 0.01, ** p < 0.05, * p < 0.1.
Table 4.
Determinants of change in contribution in the public goods game: Ordinary least squares regression models.
Table 4.
Determinants of change in contribution in the public goods game: Ordinary least squares regression models.
| Dependent Variable: Changes in the Amount of Contribution (ETB) | ||||||
|---|---|---|---|---|---|---|
| I | II | III | ||||
| Coefficient | Standard Error | Coefficient | Standard Error | Coefficient | Standard Error | |
| previous | −0.072 | 0.0185 *** | −0.080 | 0.0188 *** | −0.077 | 0.0188 *** |
| gender | −0.021 | 0.0376 | −0.041 | 0.0399 | ||
| education | 0.002 | 0.0055 | −0.003 | 0.0059 | ||
| age | −0.012 | 0.0381 | 0.003 | 0.0403 | ||
| fertility | −0.045 | 0.0386 | −0.076 | 0.0409 * | ||
| distance | 0.005 | 0.0020 ** | 0.006 | 0.0022 *** | ||
| trust | 0.032 | 0.0731 | 0.058 | 0.0775 | ||
| farmland | −0.001 | 0.0293 | −0.006 | 0.0311 | ||
| animal | −0.001 | 0.0029 | −0.003 | 0.0030 | ||
| round 2 | −0.342 | 0.0703 *** | −0.336 | 0.0703 *** | −0.338 | 0.0703 *** |
| round 3 | −0.037 | 0.0688 | −0.035 | 0.0688 | −0.035 | 0.0688 |
| round 4 | 0.069 | 0.0686 | 0.069 | 0.0686 | 0.069 | 0.0686 |
| round 6 | 0.940 | 0.0687 *** | 0.938 | 0.0687 *** | 0.911 | 0.2179 *** |
| round 7 | 0.149 | 0.0697 ** | 0.153 | 0.0698 ** | 0.152 | 0.0697 ** |
| round 8 | 0.048 | 0.0696 | 0.053 | 0.0696 | 0.051 | 0.0696 |
| round 9 | 0.146 | 0.0692 ** | 0.150 | 0.0692 ** | 0.148 | 0.0692 ** |
| round 10 | 0.162 | 0.0691 ** | 0.165 | 0.0692 ** | 0.164 | 0.0691 ** |
| round 6 *female | 0.180 | 0.1195 | ||||
| round 6 *education | 0.041 | 0.0176 ** | ||||
| round 6 *age40over | -0.133 | 0.1210 | ||||
| round 6 *fertility | 0.285 | 0.1220 ** | ||||
| round 6 *distance | -0.011 | 0.0064 * | ||||
| round 6 *trust | -0.233 | 0.2324 | ||||
| round 6 *farmland | 0.010 | 0.0233 | ||||
| round 6 *animal | 0.019 | 0.0091 ** | ||||
| constant | 0.099 | 0.0783 | 0.049 | 0.1004 | 0.044 | 0.1032 |
| n | 8424 | 8424 | 8424 | |||
| F-test | 49.83 *** | 26.84 *** | 19.22 *** | |||
Note: *** p < 0.01, ** p < 0.05, * p < 0.1.
Publisher’s Note: MDPI stays neutral with regard to jurisdictional claims in published maps and institutional affiliations. |
© 2020 by the authors. Licensee MDPI, Basel, Switzerland. This article is an open access article distributed under the terms and conditions of the Creative Commons Attribution (CC BY) license (http://creativecommons.org/licenses/by/4.0/).
Share and Cite
MDPI and ACS Style
Oniki, S.; Etsay, H.; Berhe, M.; Negash, T. Improving Cooperation among Farmers for Communal Land Conservation in Ethiopia: A Public Goods Experiment. Sustainability 2020, 12, 9290. https://0-doi-org.brum.beds.ac.uk/10.3390/su12219290
AMA Style
Oniki S, Etsay H, Berhe M, Negash T. Improving Cooperation among Farmers for Communal Land Conservation in Ethiopia: A Public Goods Experiment. Sustainability. 2020; 12(21):9290. https://0-doi-org.brum.beds.ac.uk/10.3390/su12219290
Chicago/Turabian StyleOniki, Shunji, Haftu Etsay, Melaku Berhe, and Teklay Negash. 2020. "Improving Cooperation among Farmers for Communal Land Conservation in Ethiopia: A Public Goods Experiment" Sustainability 12, no. 21: 9290. https://0-doi-org.brum.beds.ac.uk/10.3390/su12219290
Note that from the first issue of 2016, this journal uses article numbers instead of page numbers. See further details here.