Unified Energy Agents for Combined District Heating and Electrical Network Simulation

1
Research Group for Business Informatics and Software Engineering, University of Duisburg-Essen, 47057 Duisburg, Germany
2
Chair of Energy Technology, University of Duisburg-Essen, 47057 Duisburg, Germany
3
Institute of Power Systems Engineering, University of Wuppertal, 42119 Wuppertal, Germany
*
Author to whom correspondence should be addressed.
Sustainability 2020, 12(21), 9301; https://0-doi-org.brum.beds.ac.uk/10.3390/su12219301
Submission received: 15 October 2020
/
Revised: 1 November 2020
/
Accepted: 4 November 2020
/
Published: 9 November 2020
(This article belongs to the Special Issue Multi-Utility Energy System Optimization)
Abstract
:A sustainable and climate-friendly energy supply needs flexible and efficient distribution systems. Key factors to implement this kind of systems are intelligent coordination (smart grid approaches) and the integration of different energy sectors. This article introduces the unified energy agent as an agent-based approach for a comprehensive modelling and control of energy conversion systems. This approach enables both the simulation and optimization of coupled energy networks, and then in a next step, the development of corresponding smart grid solutions to be applied in the field. Its applicability for the simulation of coupled networks is presented by a real-world use-case of an innovative combined heat and electrical network, which was implemented for the city of Lemgo, Germany. Preliminary results from the project are discussed and an outlook on future work is given.
1. Introduction
The current transition towards a more sustainable energy supply requires significant changes in the way energy distribution is planned and controlled. Public attention is primarily focused on the electricity sector, where the changes are the most obvious due to the increasing use of weather-dependent and thus volatile renewable energy sources, but other energy sectors are also affected by the transition. Different forms of energy must be seen together to find an efficient solution for the current challenges.
Renewable electrical generation does not follow the demand, as it did in times of fossil or nuclear power plants. This generation therefore requires a new level of flexibility within the distribution system regarding the demand as well as the distribution of energy. Besides smart grid approaches for flexible control solutions, the integration with other energy sectors must help providing this flexibility, since these sectors are able to provide the storage capacities that the electrical sector currently lacks.
The power-to-gas technology currently is the most discussed approach in this direction, but district heating networks are also able to provide flexibility. Yet, district heating networks can contribute to a more sustainable usage of energy on their own. The networks are primarily fed by combined heat and power plants (CHPs), which use coal or natural gas to generate electrical energy and heat at the same time. Therefore, at least in municipal areas they usually provide more efficient domestic heat and hot water than local gas or oil fired heating systems [1,2]. Further, the integration of renewable heat sources and waste heat can reduce the amount of fossil fuels that are required to satisfy the heat demand and thus the CO2-footprint of the overall system [3].
Additionally, heating networks can help to solve the problems caused by a volatile renewable electricity generation that does not follow the demand. By using electrically operated heat pumps, district heating systems can store surplus electrical energy from renewable generation (power-to-heat). They thus can help to stabilize the electricity grid and increase at the same time the share of renewable energy in the heating system [4].
In modern supply infrastructures, electricity and district heating networks are no longer separate worlds but are interconnected in many ways. For example, CHPs that produce electricity and heat feed into both networks at the same time, while electrical heat pumps consume electricity to produce heat, and they thus transfer energy from one network to the other. Therefore, simulation and planning tools that consider both forms of energy at the same time are required. With the concepts of a unified energy agent and the energy option model (EOM), a generic way of modelling arbitrary energy systems has been developed at the University of Duisburg-Essen [5,6]. Based on the paradigms of agents and multiagent systems, combined with a detailed description of the behavior and operational flexibility of the energy systems represented by these agents, this approach aims to seamlessly cover the whole life cycle of a software-based control solution [7]. This means that based on the same software core, developed solutions can first be evaluated in simulations, then tested with real systems in laboratory or hardware testbeds, and finally also be applied in the field. The EOM and energy agents will further be introduced in Section 3.2 and Section 3.3
In the research project Agent.HyGrid, which was successfully completed in January 2019, this approach has been applied to develop an active network management system for low-voltage electrical distribution networks (from simulation to field test). Agent.HyGrid was funded by the German Federal Ministry for Economic Affairs and Energy, details on the project can be found on https://www.agent-hygrid.net/en/. Based on the results of Agent.HyGrid, in the current project InSekt a combined simulation of medium-voltage and district heating networks is currently under development. InSekt stands for the German project name “Intelligente Sektorenkopplung zur Reduktion von CO2-Emissionen in Energieversorgungssystemen”, which translates to “intelligent sector coupling for reduction of CO2-emissions in energy supply systems”. The application case for InSekt comes from the city of Lemgo, and the public utility of Lemgo (Stadtwerke Lemgo GmbH; SWL) is involved in the project as an industrial partner. The goal is the integration of a newly erected wastewater heat pump into the existing district heating and medium-voltage networks. Therefore, models of all relevant systems and simulations of both networks are developed to analyze different operation strategies in simulations with respect to their technical and economic feasibility and their effect on the CO2-footprint of the whole system.
The article is further structured as follows. Section 2 gives an overview of related research in the area of simulation tools and smart grid approaches for electrical and district heating networks, as well as other works combining both sectors. In Section 3, the tools and concepts used in InSekt are introduced, namely the simulation tool Agent.Workbench (Section 3.1), the energy option model (Section 3.2) and the concept of unified energy agents (Section 3.3). Section 4 provides information on the use case of the project (Section 4.1), as well as the developed simulation of district heating (Section 4.2) and medium voltage electricity (Section 4.3) networks, and the EOM-based system modelling (Section 4.4). Section 5 discusses the already achieved results and directions for further work, before Section 6 ends the article with a conclusion.
2. Related Work
Since the energy agent approach aims for the simulation of networks as well as the development of smart grid control approaches, related works from both areas are included in this section.
The majority of simulation and optimization tools are focused on one energy sector only. This applies to tools such as GridSim [8] and pandaPower [9] for the electrical sector and TERMIS [10] or Ca.R.Di.F. [11] for the heat sector. Co-simulation tools such as mosaik [12] overcome this limitation by combining several simulation engines, but they do not go beyond simulation like the energy agent approach does.
Recent examples for combined simulations of heat and electrical networks were presented for example in [13,14] for domestic areas and in [15] for an industrial site. While addressing similar scenarios like InSekt, these works stay on the level of mathematical modelling, while the energy agent approach is much closer to the required technical implementation.
Regarding the aspect of smart grid control solutions, which is also addressed by the energy agent approach, other agent-based approaches like DEZENT [16], DeMaPos [17], or PowerMatcher [18] must be mentioned. Agent-based approaches for smart district heating are discussed for example in [19,20]. While these works provide interesting insights for their respective sectors, they lack the multidomain view taken by the energy agent approach and the EOM. A similar view of the energy conversion system connected to multiple sectors is taken in the concept of energy hubs [21], which, however, stays on the conceptual level, while the combination of an energy agent and the EOM provides an implementation that can be applied in different scenarios.
3. Tools and Concepts
The simulation that was developed in the InSekt project is based on the software tool Agent.Workbench, the energy option model, and the corresponding software framework for unified energy agents. They are introduced in the following subsections.
3.1. Agent.Workbench
Agent.Workbench (formerly Agent.GUI, [22]) is a software tool and framework for developing and operating multiagent systems (MAS), which was developed at the University of Duisburg-Essen. It builds upon the well-established software-framework JADE (Java Agent Development framework) for developing multiagent systems in Java. The initial idea behind Agent.Workbench was to provide a graphical end-user application that makes the powerful but not very user-friendly JADE framework manageable for non-computer scientists. Beyond this, Agent.Workbench provides the basic structure to develop and execute MAS-based simulations, e.g., with different environment and time models, the integration of ontologies for communication purposes, or the possibility to manage different simulation setups within a project.
Besides the described end-user functionality, Agent.Workbench can also be executed in a background system mode to distribute agents for large-scale simulations on several machines. An integrated load balancing mechanism can be used to distribute the agents across all available systems, considering the available computing power and the current system load. Finally, the embedded system mode allows for the execution of a single agent or a group of agents on a dedicated hardware with or without a connection to a simulation. This mode is also the base for the deployment of energy agents, which is described in Section 3.3.
The modular architecture of Agent.Workbench is based on OSGi (formerly Open Services Gateway initiative) and Eclipse RCP (rich client platform), allowing for an easy integration of new features using the well-established mechanisms of the Eclipse provisioning platform (p2). It is open source software and freely available on GitHub (https://github.com/EnFlexIT/AgentWorkbench/).
3.2. Energy Option Model
The energy option model (EOM) was first introduced in [6]. It was designed to model the operational flexibility of arbitrary energy conversion systems. While the energy agent concept defines the structure of the agent itself and its interaction with its surroundings, the EOM is used to describe the state and behavior of the energy system itself that is represented and controlled by the agent. Thus, an EOM description serves as the energy agent’s internal reasoning model and is the basis on which control decisions are made. Such an EOM description is not necessarily bound to an energy agent though, it can also be used on its own to describe and analyze the behavior of an energy system.
The core of an energy system’s EOM description is defined by a state machine describing its operating states, along with possible state transitions, durations, and optional minimum or maximum residence times. Additionally, the system’s interfaces to one or more surrounding energy networks are defined. Every interface is bound to a specific domain, which not only can be an arbitrary energy carrier but also a good. Storage capacities for every domain can also be defined. The system description is completed by the specification of input/output (I/O) variables, e.g., for external measurements, user-controlled setpoints, or system setpoints that can be modified by a controlling energy agent.
For each combination of operating states and I/O values, the state of an energy system can be described with respect to the energy or good flows at the system interfaces. These can be either fixed values (e.g., 0 for state “off”), sequences of values taken by measurement series (e.g., to describe a transient startup process), or theory-based calculations. These calculations go back to basic SI units such as the watt [W] or kilowatt [kW] and the fundamentals of thermodynamics. Thus, the conversion process between different energy carriers can be considered, as well as aspects for energy efficiency, such as the energy losses that occur in an energy conversion process. This is a key feature for the application of EOM-descriptions in sector coupling scenarios. This aspect will be further elaborated in Section 4.4, where the specific system models used in the InSekt project will be described.
Besides the current state of a system, an EOM description also specifies the system’s behavior by defining possible state transitions and setpoint variations, and thus the operational flexibility of the system. Based on this, so-called evaluation strategies can be implemented to evaluate possible future courses of action. These can be either planning strategies, for example, to optimize a system’s operating schedule for the next day in advance, but they can also be real-time strategies that can be used by an energy agent to make an instantaneous control decision. Conceptually, there is no limitation for the specific implementation of an evaluation strategy or optimization algorithm. Thus, simple heuristics but also complex optimization algorithms or meta-heuristic approaches can be implemented and used. In any case, the result of the evaluation strategy will be a schedule, which is a sequence of system states over time, while also describing the resulting energy flows and possibly also the resulting costs. Several strategies can be executed in parallel so that resulting schedules can be compared to choose the “best” schedule with respect to a given optimization goal.
The EOM also allows to group several systems to an aggregation. The energy flows generated by the subsystems are aggregated per domain, so the aggregation appears like a single system towards the surroundings. This is useful for modelling complex systems that consist of several subsystems, such as virtual power plants. Aggregations may contain EOM-based system descriptions as described above that allow for a dynamic evaluation, static schedules describing a fixed system behavior, or further aggregations.
The EOM-framework is provided as a feature for Agent.Workbench. It can be installed from the preconfigured p2 repository. Unlike Agent.Workbench, it is not open source, but a trial license for six months is provided upon installation.
3.3. Energy Agents
The energy agent concept was first introduced in [7], and it aims to specify a unified way to implement agents representing arbitrary energy conversion systems. It provides a predefined structure for implementing agents, considering the agent itself, its internal data model, and its behaviors for interacting with the energy system it represents and with other energy agents.
While the focus in this article is on the application of energy agents in a simulation scenario, the scope of the concept covers the whole life cycle of a system. Energy agents can first be developed and tested in simulations, then be deployed on dedicated hardware for the evaluation in hardware testbeds, and then finally be applied in real field applications. This has been achieved by using a modular architecture with clearly defined interfaces. If well designed, most components of the energy agent can remain unchanged when making the step out of the simulation. Only the I/O behaviors for interaction with the technical system must be exchanged.
The process from the simulation stage to the real field stage has been successfully demonstrated in the Agent.HyGrid project as far as field test stage. As the application of energy agents in InSekt is limited to pure simulation, we will not go further into deployment aspects here.
To represent and control an energy conversion system, the energy agent must be aware of its specifications and behavior, and thus it is provided with an EOM description of the system. Based on this description and the current measurement values provided by its I/O behavior, the energy agent can derive the current state of the system and make control decisions. Each decision is based on the operational flexibility specified by the EOM description and the evaluation strategy as described in the previous section. Therefore, the energy agent has to be classified as a deliberative agent in the sense of the BDI-concept (Belief, Desire, Intention) [23], because an agent makes decisions not only based on its current sensor inputs but on an internal knowledge model.
If this dynamic behavior is not desired, an energy agent can also be equipped with a fixed schedule instead. In this case, the agent will just follow the schedule and not decide on its own. Both modes can be mixed in the same simulation. In this way, schedules can be used to specify the fixed behavior of the surrounding systems, thus providing the boundary conditions in which the systems of interest can be dynamically evaluated based on an EOM description. This approach is used in the InSekt project.
The implementation of the energy agent concept is currently being prepared for release as a feature for Agent.Workbench. By the time this article is published, it will probably be available for installation from the preconfigured p2 repository.
4. Case Study
In the InSekt project, the energy agent concept is applied to develop a combined simulation of a district heating network and a medium-voltage network. The underlying use case is provided by the public utility of Lemgo, a small town with a population of about 40,000 in the German region of Ostwestfalen-Lippe. The public utility (Stadtwerke Lemgo GmbH; SWL) is the operator of the local district heating and electrical networks, and it acts in the project as an industrial partner.
SWL runs several combined heat and power plants (CHPs) that are operated with natural gas and provide heat and electricity to satisfy the local demand. Recently, a wastewater heat pump was erected at the local sewage plant to capture waste heat from the water cleaning process and feed it into the district heating system. Thus, the amount of fossil fuels required to satisfy the heat demand and the CO2-footprint of the heat production will be reduced.
The main goal of the InSekt project is to simulate the heat and electrical networks in this area and develop strategies for operating the heat pump in a way that is beneficial from a technical, ecological, and economical point of view. In further simulations, possible future scenarios will be analyzed. Those scenarios comprise the integration of solar-thermal heat generation on free areas close to the sewage plant, as well as the installation of an additional heat pipe to solve a bottleneck in the heating network.
While the district heating network has a total length of about 60 km and covers large parts of Lemgo, just a section of 2.5 km in length around the sewage plant is considered in the simulation, resulting in a network of 18 consumer nodes for the heat side. From the electrical side, the network parts supplied by one specific substation are considered, resulting in a network of 72 electric load nodes. There are three natural gas-fired CHP sites located in the simulated area that provide heat and electrical energy, and thus are a part of both networks. However, as one of them is electrically connected to a substation out of the scope of the simulation, it is considered as a heat supplier only.
Since the wastewater heat pump is located at a CHP site next to the sewage plant, it is considered as a part of that CHP site and is therefore modelled not as a separate node in the network model but as part of an EOM aggregation (see Section 4.4). This makes particular sense from the network point of view since both, the CHP and the wastewater heat pump, share one connection pipe to the district heating network.
Around the site of the sewage treatment plant, there are areas that in principle offer potential for the installation of photovoltaics or solar thermal systems. In conceivable future energy supply scenarios, the previous considerations must be extended accordingly. Initially, the areas were examined as part of a first feasibility study regarding energy yields and efficiencies. Therefore, possible system capacities were calculated. The results led to the decision that the embedding of solar thermal energy is preferred in order to promote the decarbonization of the district heating system.
In (subsequent) projects, existing solar thermal models can be adapted in order to investigate the influence of solar energy in addition to the CHP and the wastewater heat pump on the operation of the district heating network. However, many formal aspects (e.g., legal ownership, land usage as “energy areas”, landscape protection requirements, etc.) need to be cleared for this. Still, in the context of InSekt, the influences of additional solar thermal energy on the district heating performance may be considered in simulations later.
4.1. Simulation Concept
The simulation follows the classical bottom-up approach of agent-based simulations. Every active component in the system is represented by an agent, modelling the local behavior of the respective component. Since all agents are embedded in a common environment, namely the model of the networks, which is affected by their actions, the sum of the behavior of all components results in a generative simulation of the behavior of the whole distribution system. District heating and electrical networks seem to be two separate environments at first sight, but since they are connected by the CHP sites that are part of both networks, they form one comprehensive environment.
Agent.Workbench provides a graph-based environment model implementation that was used to create the network model for the simulation. The basic element of this model is a network component that can be a heat consumer, a pipe connector or a heat pipe for the heat domain. Additionally, a “heat slack node” marks the spot where the network is cut off for the simulation, and thus represents the part of the network that is out of scope of the project. In the electrical domain, there are load nodes and nonload nodes, a slack node and electrical lines. Here, load nodes represent producers, consumers, or prosumers of electrical energy, while nonload nodes are sleeves just connecting cables. The slack node represents the substation, which connects the simulated network to the next higher network level. Since the CHP sites feed into both networks, they are part of both domains. In fact, since they are powered with natural gas, they are also part of the gas domain. Because the gas network is not in the scope of this project, it is considered outside the system borders.
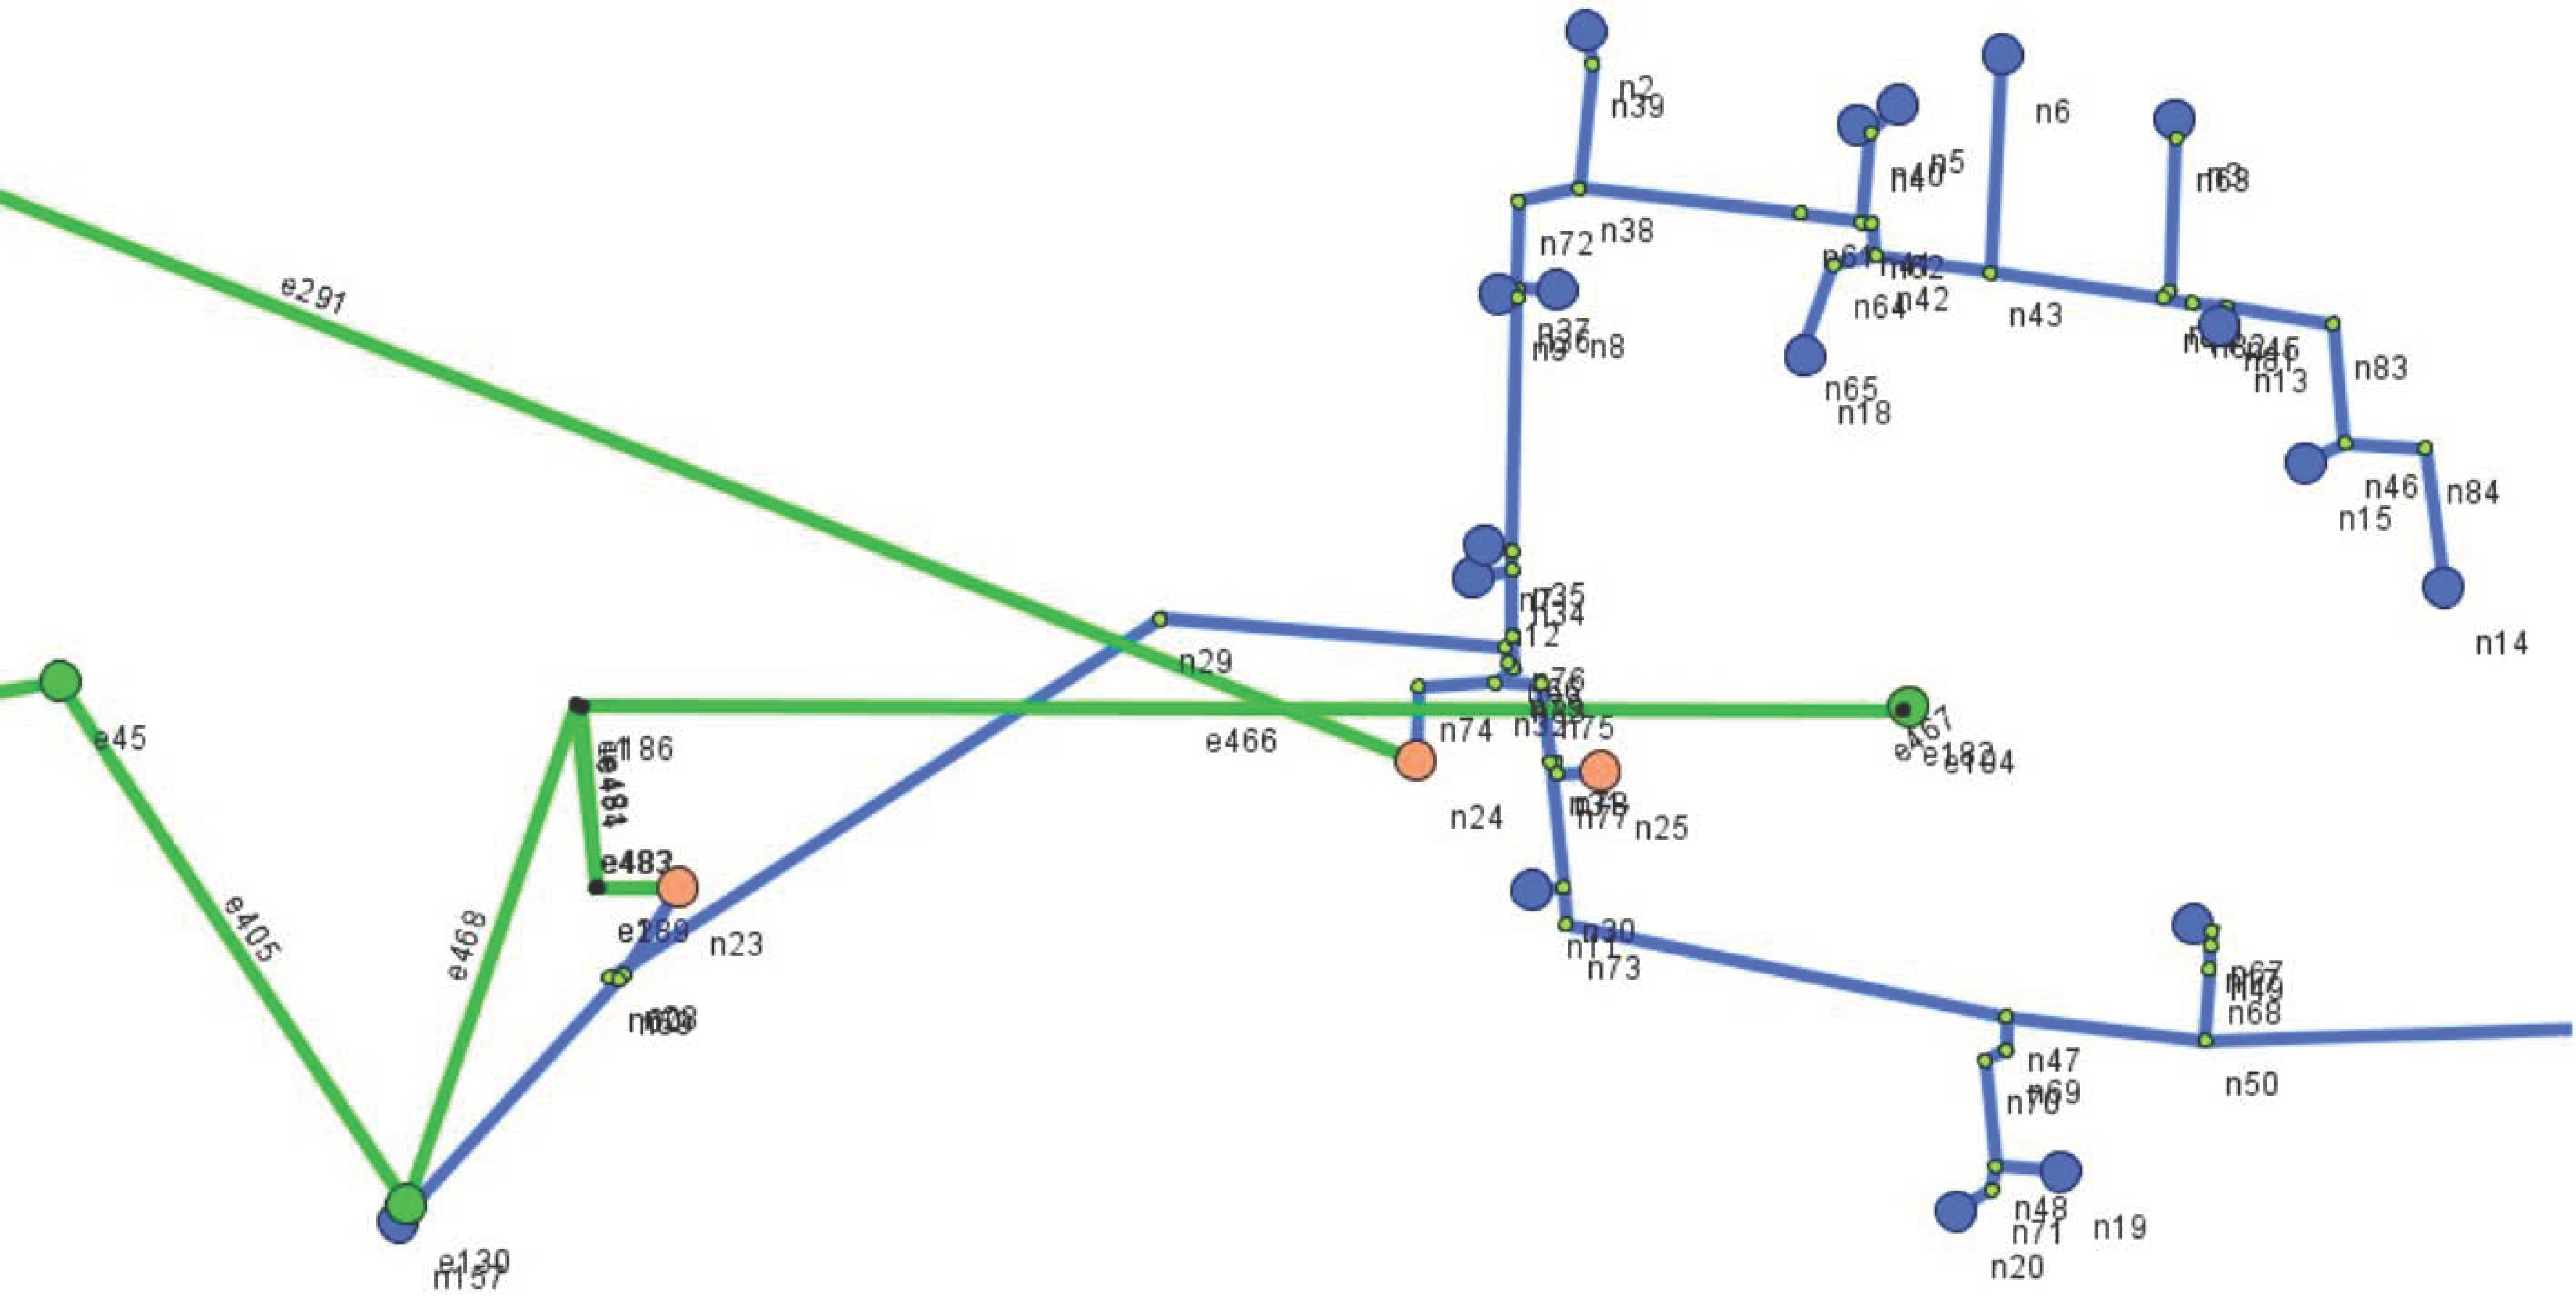
The topology data were exported from the SWL’s geoinformation system (GIS) and imported into Agent.Workbench using a custom-made import module. Figure 1 shows an excerpt of the network model. Pipes and cables are represented by edges, and all other components by nodes. Electric load nodes, heat consumers, and CHP sites are considered active components and are provided with an energy agent representing the corresponding actor, while heat pipes, electric lines, nonload nodes, and pipe connectors are passive components without agents.
Initially, all agents were equipped with static load profiles based on measurement data provided by the SWL, to simulate the situation in Lemgo as the one currently in place. In the next step, the CHP sites were equipped with EOM descriptions to dynamically evaluate different control strategies, while the other agents kept their static load profiles to provide a realistic scenario to be evaluated against.
Each node and edge of the graph is provided with a domain specific data model, separated by the static properties and the dynamic state of the specific component. This also contains a time series, to keep track of the development of specific properties over time. Further details on the data models will be given in the subsection on the specific domain.
As Figure 1 shows, components of the two domains are modelled in the same graph, connected by the nodes that belong to both (n23 and n24). In the simulation, however, they were treated separately. At the simulation startup, an EOM aggregation for each domain was created dynamically, containing all network components that have an interface in the respective domain. Thus, the connecting CHP sites were part of both aggregations. For every domain, java classes implementing the network calculations, runtime visualizations, and other aspects can be configured separately. The network calculations were based on the energy flows provided from the energy agents at the nodes. Both networks were calculated separately, but since the CHP nodes are part of both, their behavior affects both networks. Details on the domain specific network models and calculations will be given in the next two subsections.
4.2. District Heating Network Simulation
Heat pipes comprise separate pipes for the supply and return direction, which can be implemented as a twin pipe or two single pipes. Since this differentiation is not relevant for the network calculation, both directions are always summarized in one component in the network model, and thus separate pipes for supply and return are modelled as one single component.
Thus, every node and edge in the heat part of the network model has two sets of dynamic properties, which describe its state for the supply and return direction. For the heat nodes, this comprises the temperature and pressure for each direction at the respective node, together with a temperature setpoint that describes the temperature that should be kept at this point. Additionally, the environment temperature and the thermal load at the node are specified, where the thermal load is the amount of thermal energy that is currently consumed or provided by the network component at this node.
For the heat pipes, the pressure, temperature, and velocity at both ends of the pipe were modelled for each direction, together with the pressure and temperature drops and the energy loss. Further parameters such as mass or volume flows are determined from those parameters as well. The static data model provides basic information on the specific pipe, such as its diameter, length, and thermal conductivity.
The input for the heat network calculation consists of the thermal loads at the nodes that are provided by the corresponding energy agents for every simulation time step. Other state-relevant values were calculated therein but could also be integrated as measurements from a real operation. Since the network is represented by a graph that is enriched with GIS data and pipe parameters, it contains all necessary information to determine flows, temperatures, and pressures, as well as the relations between them.
For a general heat network calculation, Kirchhoff’s electrical circuit laws were adapted. The first law ensures that the sum of all mass flows in a node is zero. The second law considers that the sum of the pressure losses in a closed path (loop) is zero. Within the program, a matrix equation is solved directly based on the laws of Kirchoff. This approach follows a method by Valdimarsson [24,25]. In general, a topology matrix is derived from the graph model in order to represent the relations between nodes and edges. Thus, the matrix size depends on the number of network edges (i.e., the number of columns) and nodes (i.e., the number of rows). Heat flow direction is indicated by a start node (with the value −1) and an end node (with the value 1) for each edge. Boundary conditions, i.e., system parameters that are known before a calculation such as flow or pressure due to a CHP site’s setpoint, are considered according to the approach of Wernstedt et al. [26]. Linear theory is used to solve a (mass) flow equation, and the solution serves as base for further hydraulic calculations, such as pressure drops. All calculated data were stored to the related components in the network model. Finally, a thermal network calculation including heat distribution losses to the environment was derived by an algorithm that considers relevant temperatures according to the flow solution.
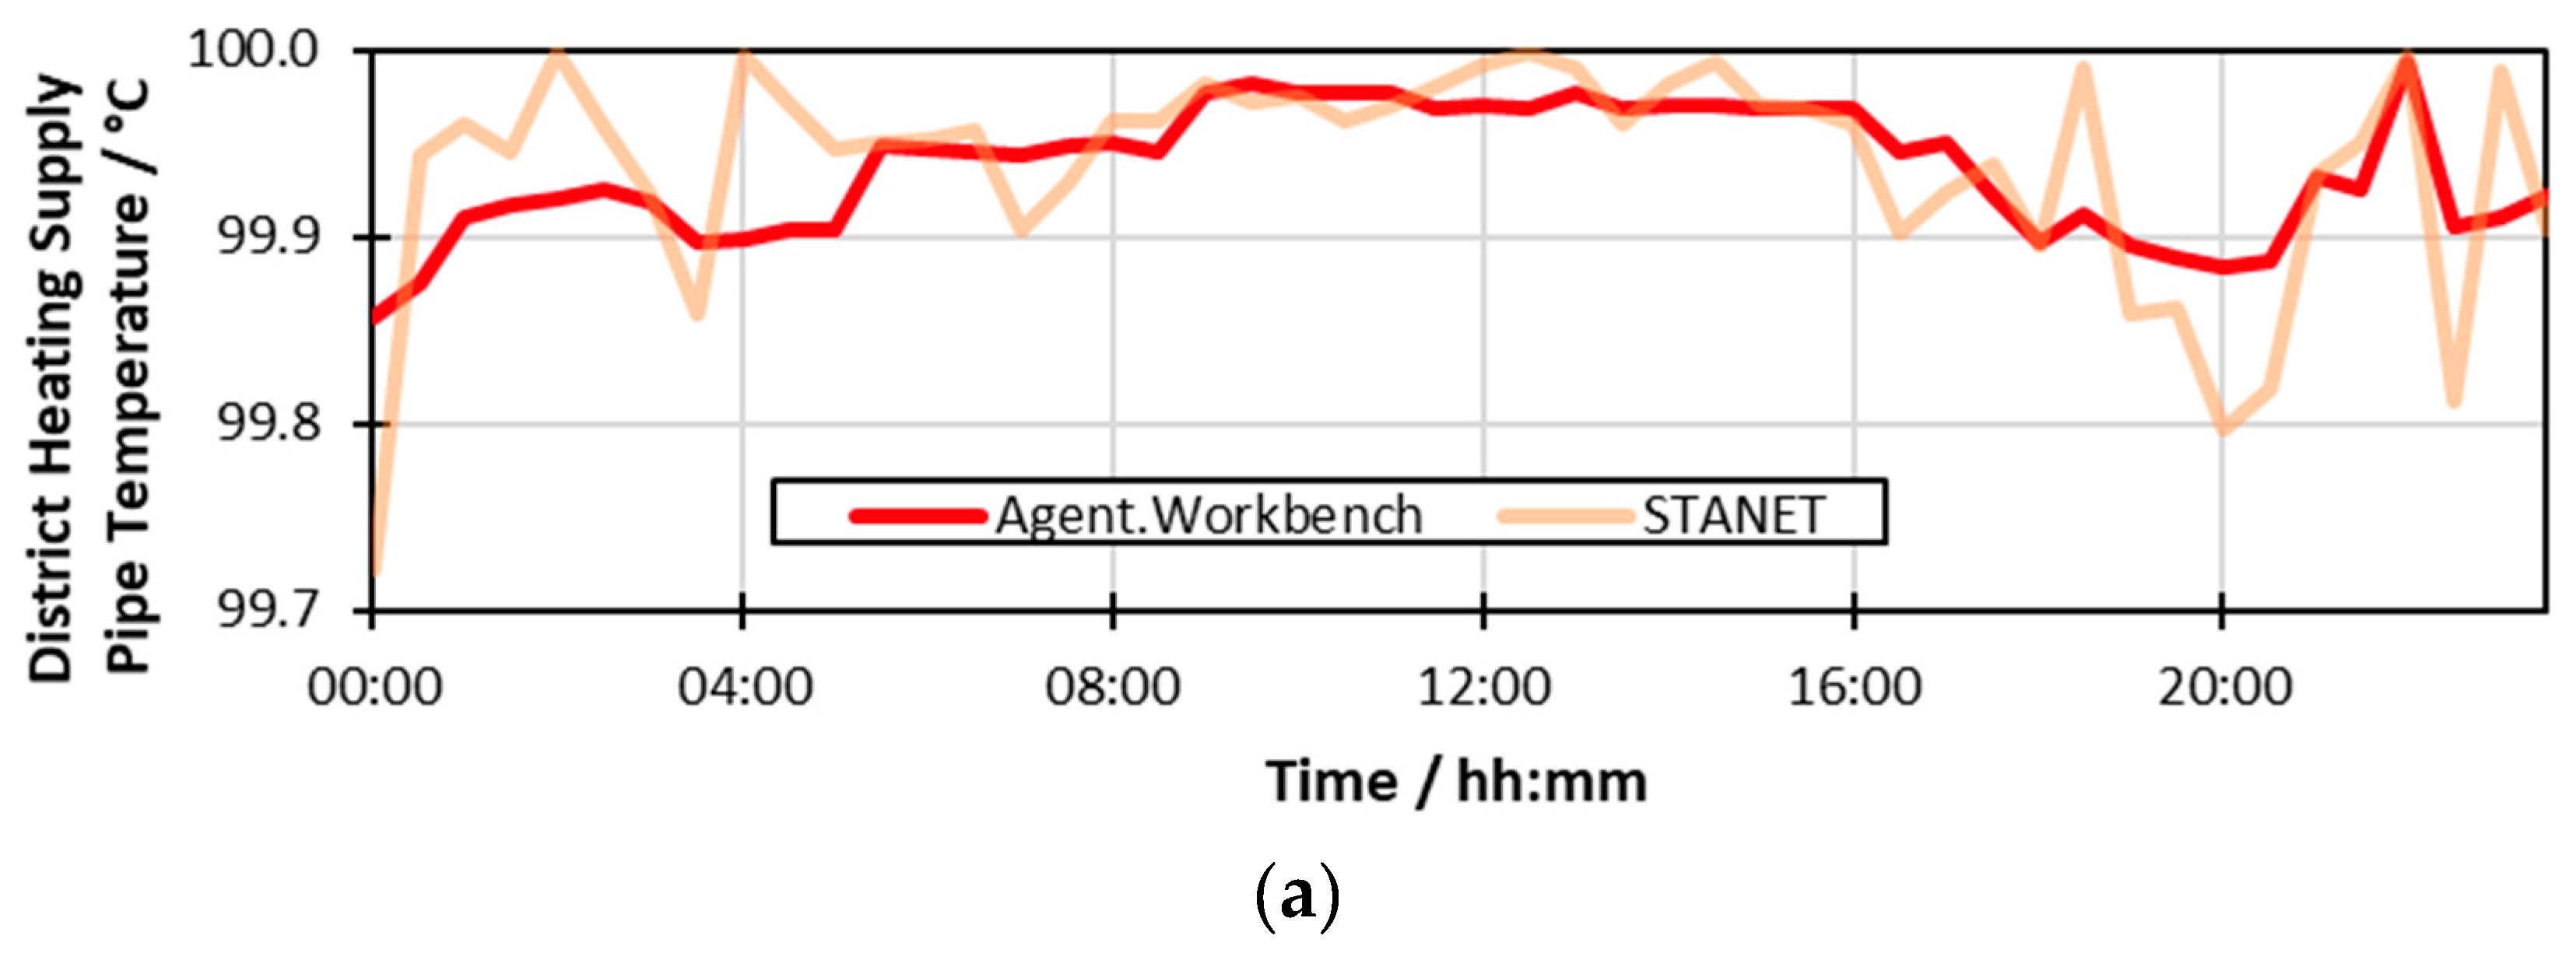
In order to validate the calculation in Agent.Workbench, the district heating system was also modeled in the commercial and commonly used STANET program. Subsequently, a peak load case-study for a typical winter day was carried out with both programs. The diagrams in Figure 2 show the results from both tools for the supply (Figure 2a) and return (Figure 2b) temperatures at a network node that is located within the district heating system’s main transport pipe. It can easily be seen from the figures that the results are very close. In fact, most values do not differ until the second or third decimal place. One possible reason for the deviations could be that the properties of the heat transfer medium (i.e., water) are dynamically evaluated in Agent.Workbench during the network calculation. While STANET does not provide detailed information about this, it can be assumed that it works with static properties instead. In conclusion, based on the assumption that the well-established STANET provides valid results, the very small deviations indicate the suitability of the implemented method as well as the developed calculation algorithm.
Based on the calculation results, the edges in the graph model are dynamically colored in green, yellow, or red based on the resulting fluid velocity, to indicate whether it is below, close to, or above the regulatory thresholds. A typical indicator for district heating analysis is the maximum flow capacity depending on a pipe’s inner diameter (cf. [27]).
4.3. Medium-Voltage Network Simulation
In the medium voltage network, the node data models comprise the complex nodal voltage as well as the summed complex apparent power of all electrical loads and feeds at this node. The complex nodal current and the apparent power at the specific node are directly derived from this.
Regarding the edge models that represent the lines of the medium voltage network, each consist of a static and a dynamic model. The static models of the edges include all electrotechnical parameters to specify the line. These parameters are the resistance, reactance, capacitance, and conduction coating, as well as the length of the line corresponding to the equivalent Pi circuit [28]. The maximum rated current of the cable is specified as a further static parameter, which is not required for the electrical network calculation but is used to determine a possible overload of the line.
The dynamic edge model includes the complex current that is transmitted over the line. From this, the complex apparent power and the line’s degree of utilization are determined after the electrical network calculation.
The complex voltages and powers are always handled in a Cartesian manner, divided into real and imaginary parts. The complex currents are handled in their polar form consisting of the absolute value of the current and the phase angle, called cosine phi.
The network calculation was based on the low voltage network calculation that was developed in the Agent.HyGrid project and tailored to medium-voltage networks within the InSekt project. Here, the edge data models were extended by the capacity and conduction coatings, and the previous three-phase calculation was reduced to a single-phase calculation. Low-voltage networks are strongly asymmetrical. By aggregating a complete low-voltage network to a medium-voltage node and the additional symmetrization by a possible zigzag wiring of the transformer, the loads of a medium-voltage network can be considered approximately symmetrical. The addition of a capacitance and conduction coating now also enables the calculation of higher voltage levels up to the extra-high voltage level.
The electrical network calculation was carried out iteratively based on a Newton–Raphson algorithm, which was specially adapted for electrical network calculation. This algorithm converges quadratically and independently of the size of the network in a few iteration steps. It is based on the node admittance matrix of the network, which grows quadratically with the number of nodes of the network and is based on the static parameters of the network edges and the complex apparent power of all nodes as well as the voltage at the slack node, which is assumed to be constant [29]. The algorithm converges in 3–5 iteration steps and provides as a result all complex nodal voltages, which reflect the entire network state. During postprocessing, all derived variables, both at the nodes and on the edges, were calculated from these node voltages. The calculation of the edge currents and powers was done from the static parameters of the edge and the complex voltages of both end nodes.
To verify the results of the electrical network calculation, a comparison with the commercial tool PSS SINCAL was made. The relevant branch of the electrical network, consisting of 21 nodes, was modelled in PSS SIINCAL. The electrical network was loaded with the same load curves, consisting of 48 time steps of 30 min. Then, an electrical network calculation was executed using both software packages. The evaluative comparison of the results of both network calculations showed a maximum deviation of less than 0.5 mV for the 10 kV network, which corresponds to a relative error of less than 0.0000084%. Since this minimal deviation would not be visible, a visual representation like for the heat network simulation in the previous section is omitted. The high compliance is due to the fact that both software packages are based on the Newton–Raphson algorithm, which represents the current state of the art for quasistatic electrical network calculations. Furthermore, in contrast to the heat network calculation, an electrical network calculation does not show any dependencies on external factors such as temperature.
Based on the calculation results, the nodes and edges in the network visualization are dynamically colored in green, yellow, or red in order to display the current utilization of the lines according to the traffic light concept of the BDEW (Bundesverband der Energie- und Wasserwirtschaft, an association of German energy and water suppliers) [30]. The thresholds between these three traffic light phases can be set individually for each voltage level.
4.4. EOM Modelling of Systems
For the first tests of the network simulations, all energy agents have been equipped with fixed load profiles, describing the system behavior for one day, in a resolution of one minute for the electrical and one hour for the heat network. After the network calculations were validated with these fixed schedules, the CHP sites have been provided with EOM descriptions instead, which specify the system’s operational flexibility and allow different operation strategies to be applied, as described in Section 3.2. These models are presented in the following.
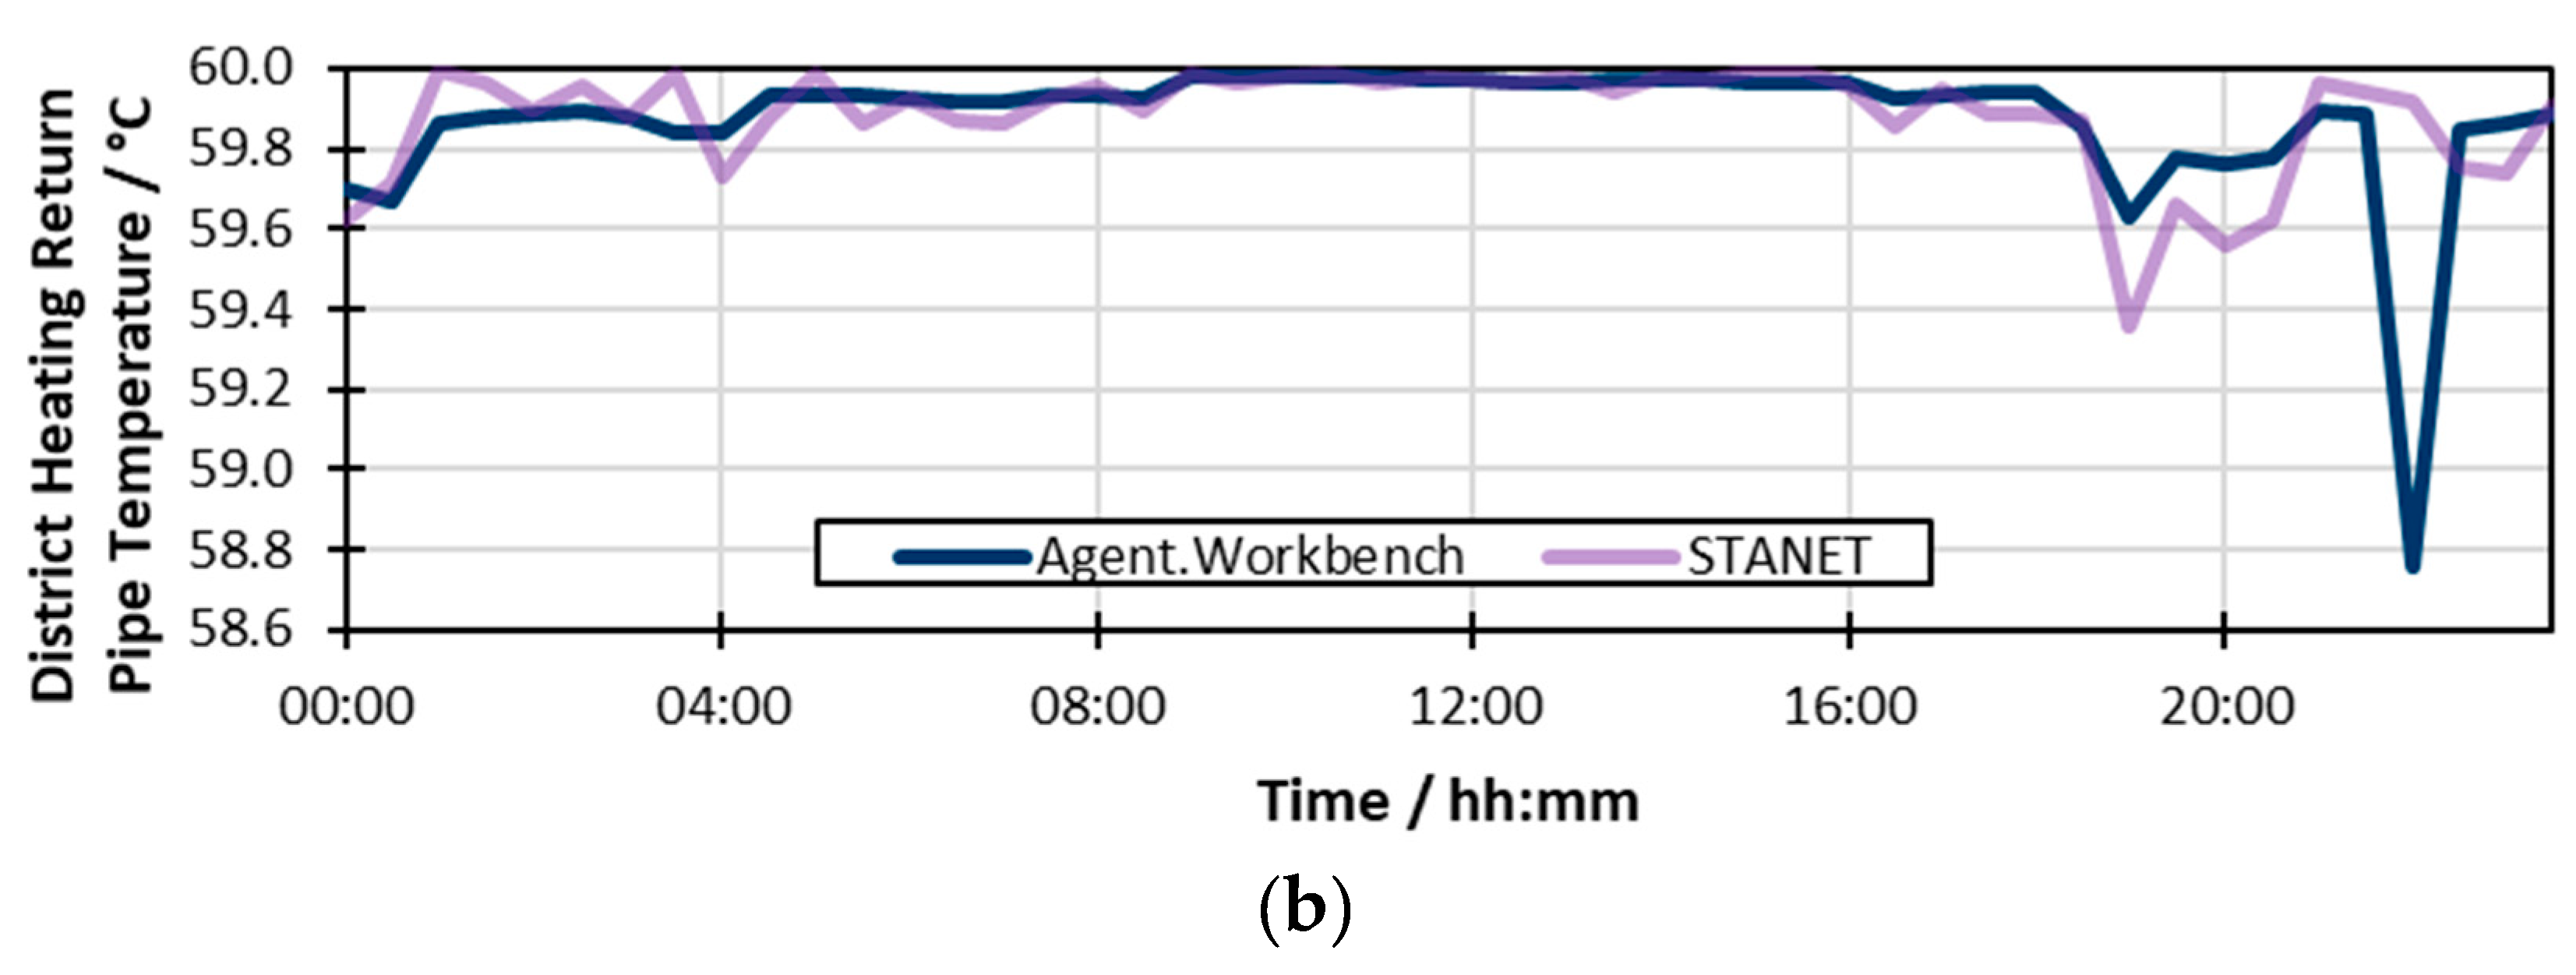
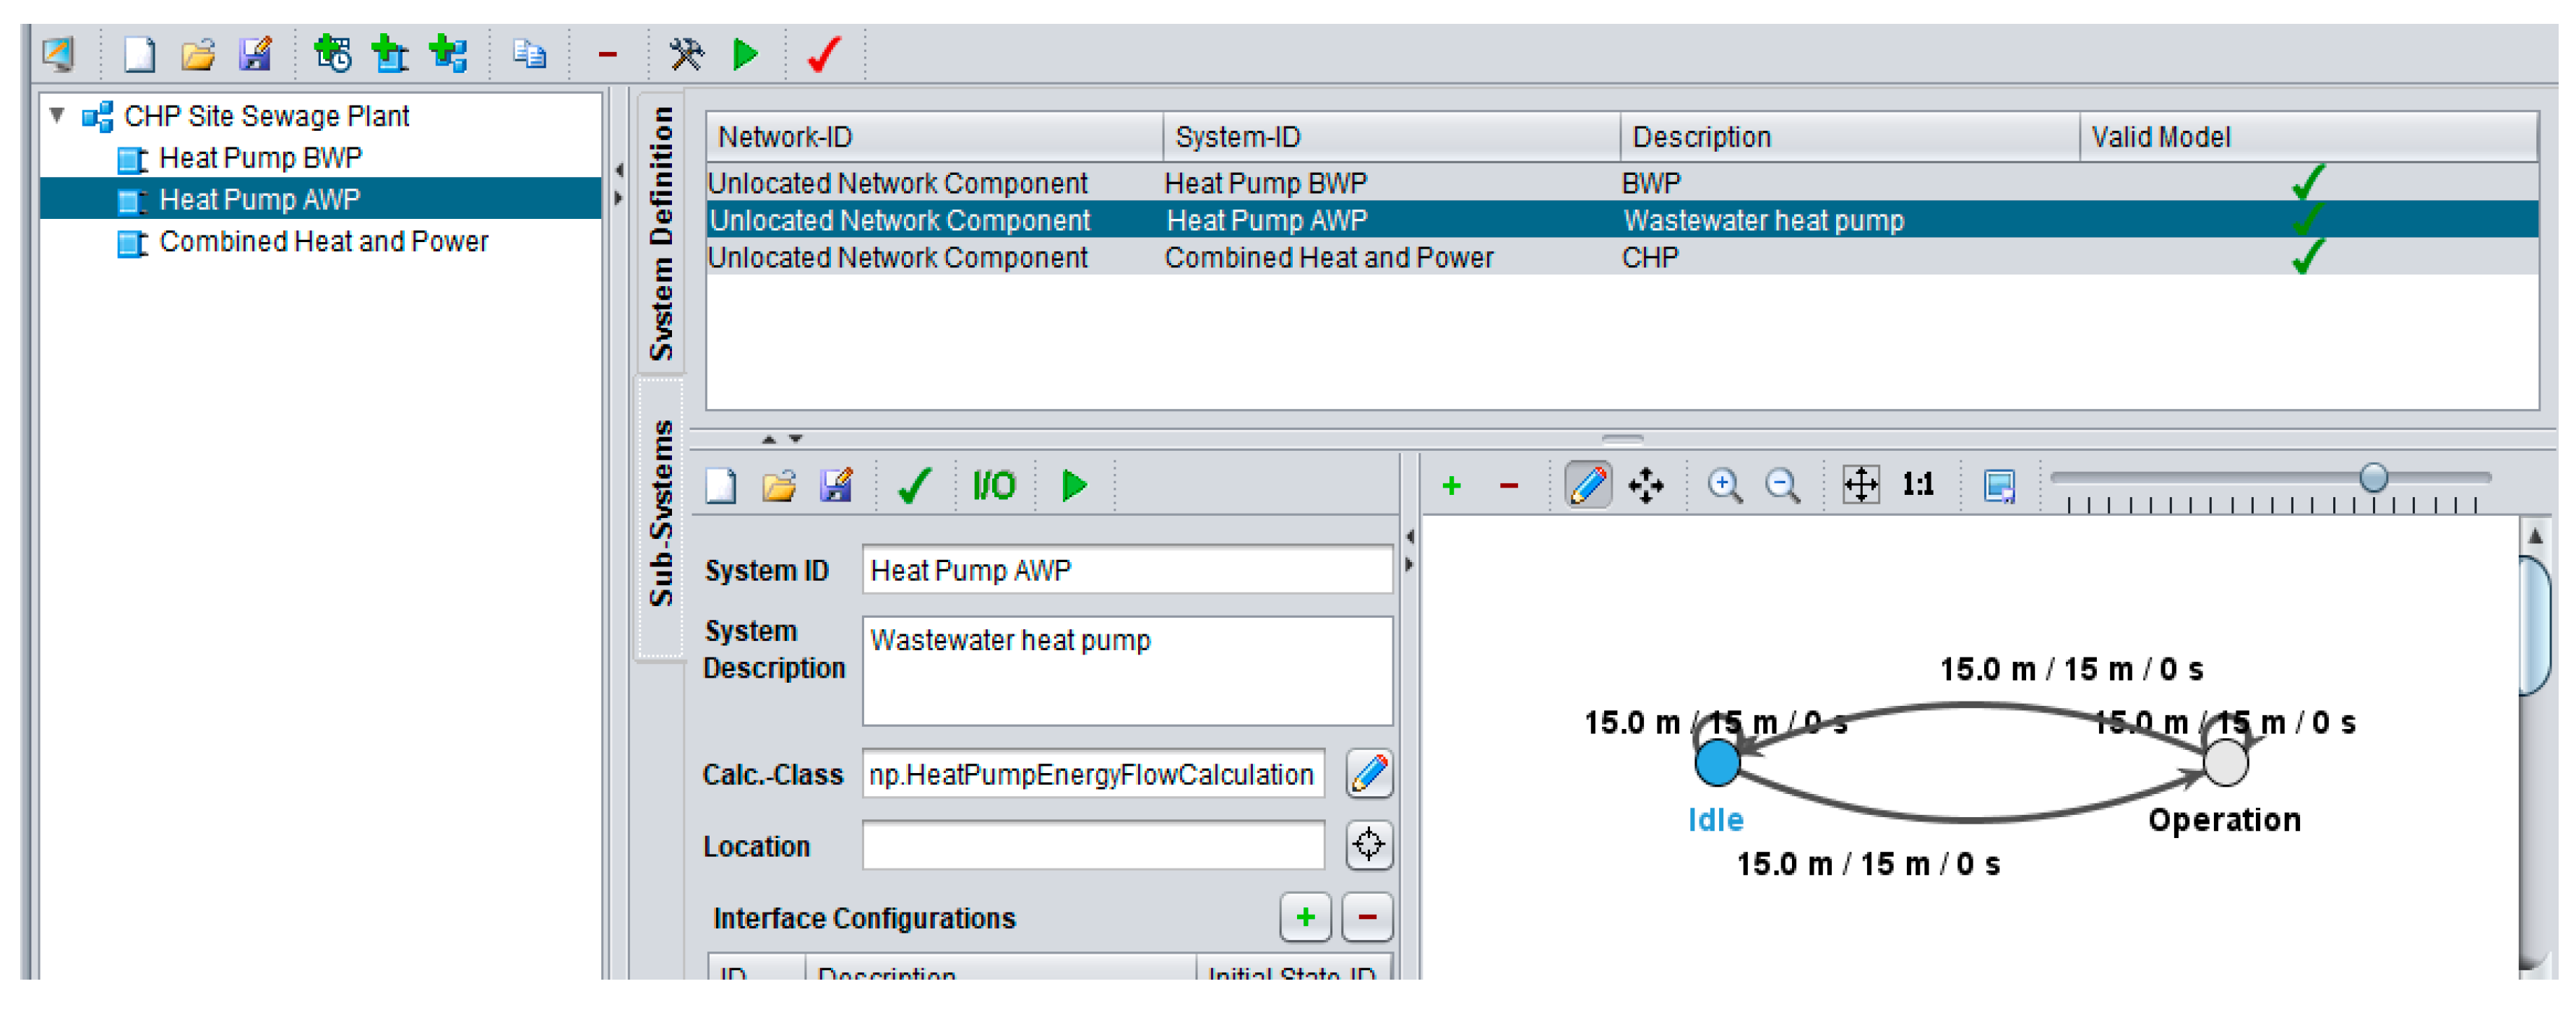
The CHP at node n24 in the network model was implemented as a single dynamic EOM model, parts of which are shown in Figure 3. The state model depicted in Figure 3a was kept simple: just two states, idle and operation. A more complex model could also consider startup and shutdown phases separately, which were neglected in this model. A discretization step length of one minute was chosen, to match the granularity of the electrical networks’ schedules. A minimum residence time of one hour for the idle state and two hours for the operation state was chosen to prevent frequent switching, which might lead to increased wear-out and maintenance costs. A maximum residence time was not specified.
Figure 3b shows the defined technical interfaces of the CHP model. The electrical interfaces Pel and Qel (active and reactive power) and the thermal interface Pth (thermal load) specify the connections to the simulated networks. Pfuel describes the energy consumed by the CHP, i.e., natural gas in this case. While the corresponding gas network was neglected in this simulation, the CHP model kept track of the consumed amount of natural gas. Another interface was defined to keep track of the CO2 emissions of the CHP. The flows at all interfaces were not only calculated for the present moment, but also cumulated over the simulation time, so the model kept track of the energy amounts produced and consumed, as well as the CO2 amount emitted while doing so, and also energy losses during conversion.
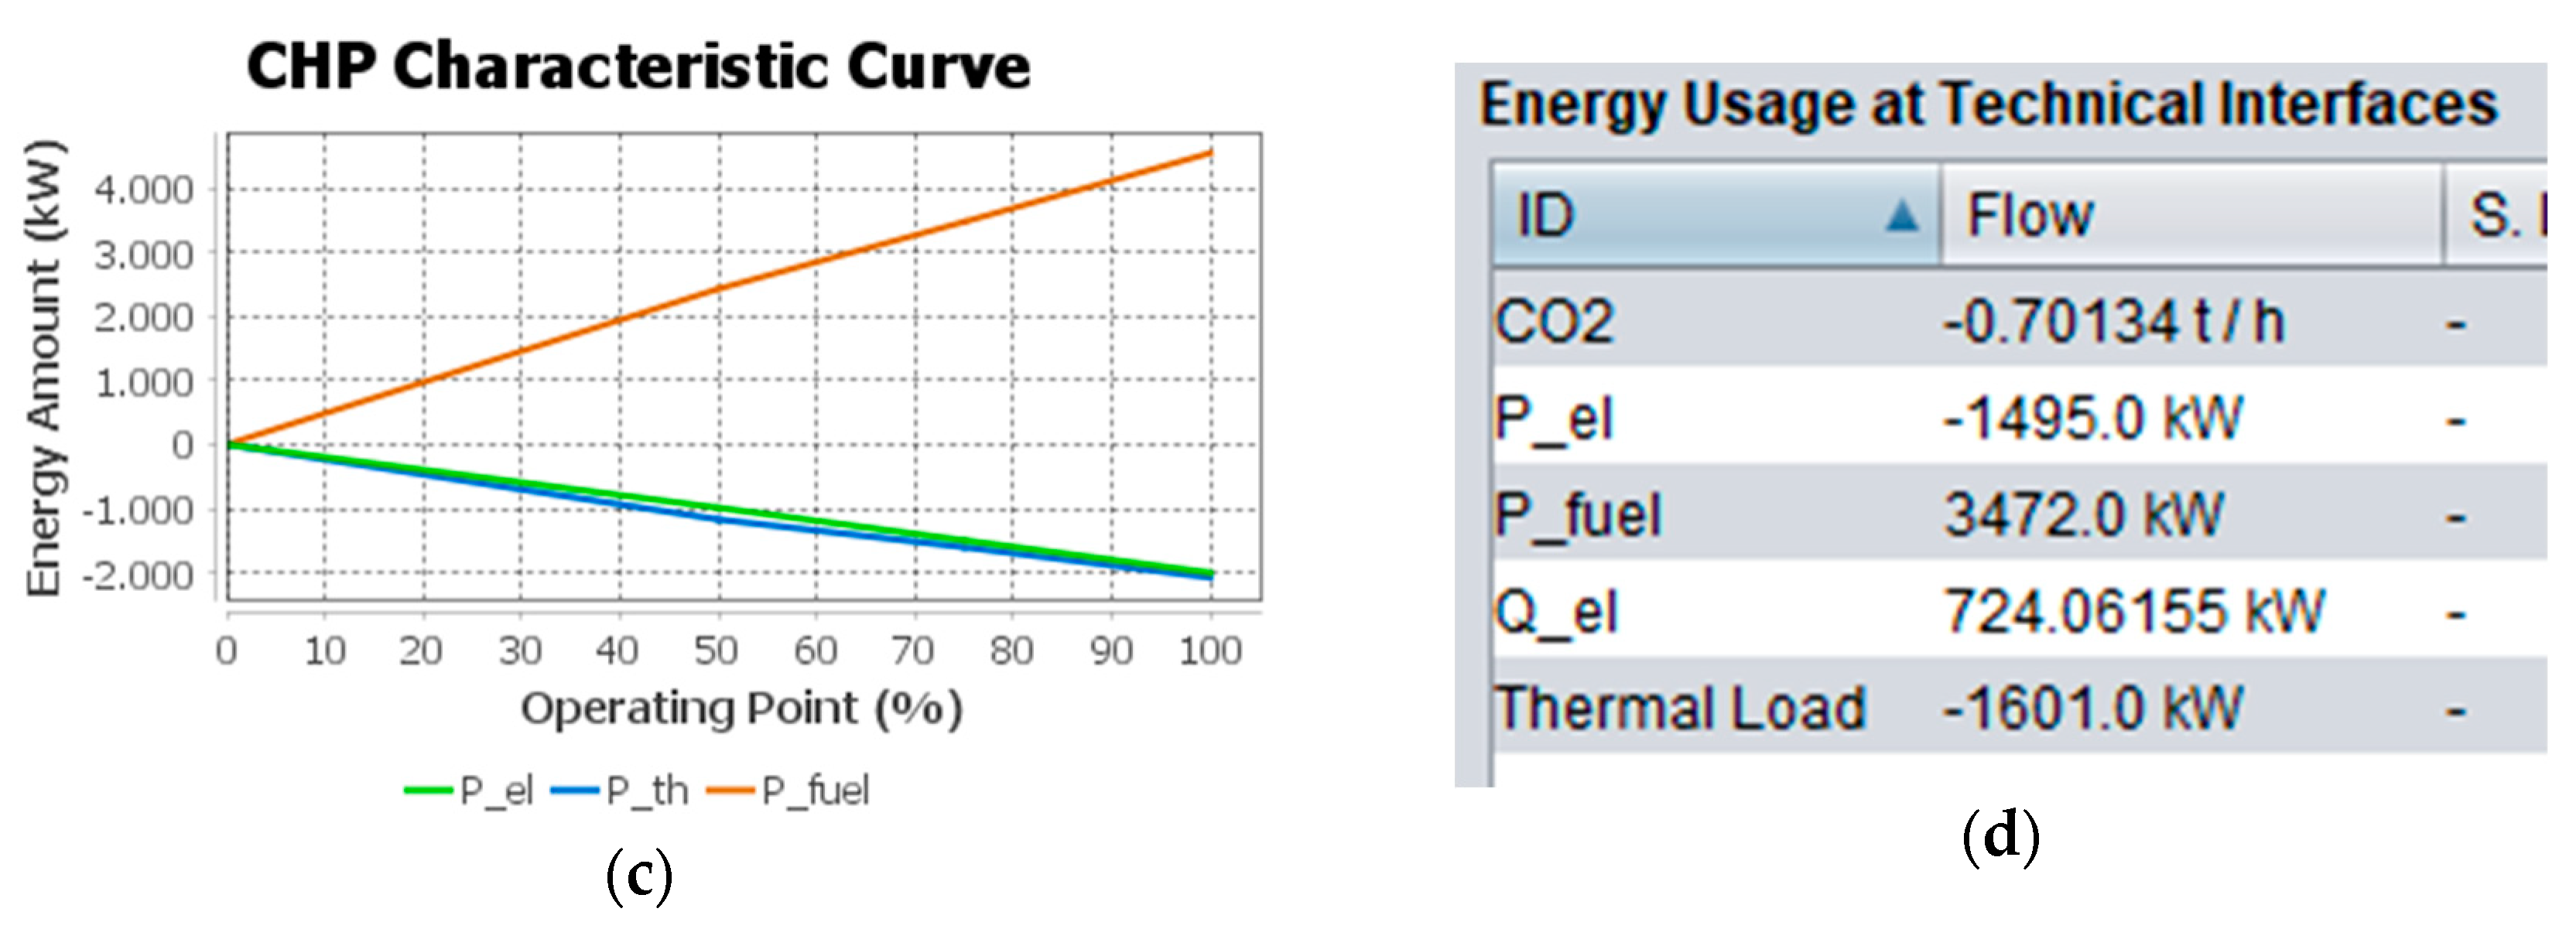
Further, several I/O variables were defined for the CHP. The most important of these is the operating point, specifying in percentage the level that the CHP currently operates at. This is the setpoint of the system that can be modified in evaluation and control strategies to affect the behavior of the CHP. In the idle state, the operating point is fixed to 0%, while it can be varied between 50% and 100% in steps of 5% in operation state. A characteristic curve defined in the model specifies the energy consumption and production in relation to the operating point—this curve is shown in Figure 3c. On this basis, the energy flows for the states were determined, and the energy losses and CO2 emissions were calculated. Figure 3d shows the results with the operating point set to 75%. Amounts are declared in a system-egoistic view; flows into the system are positive and flows out of the system are negative.
As can be seen from the example, the model provides valid results for the simulation of CHP states. The actual behavior of the CHP in a simulation results from a sequence of system states, which can either come from an external controlling instance or can be dynamically generated by the energy agent using a control strategy as described in Section 3.2, based on its knowledge about the system state and its specific optimization goals. No useful control strategies have been implemented yet, but a simple strategy based on random decisions shows that in principle it is possible to use this model in a dynamic simulation.
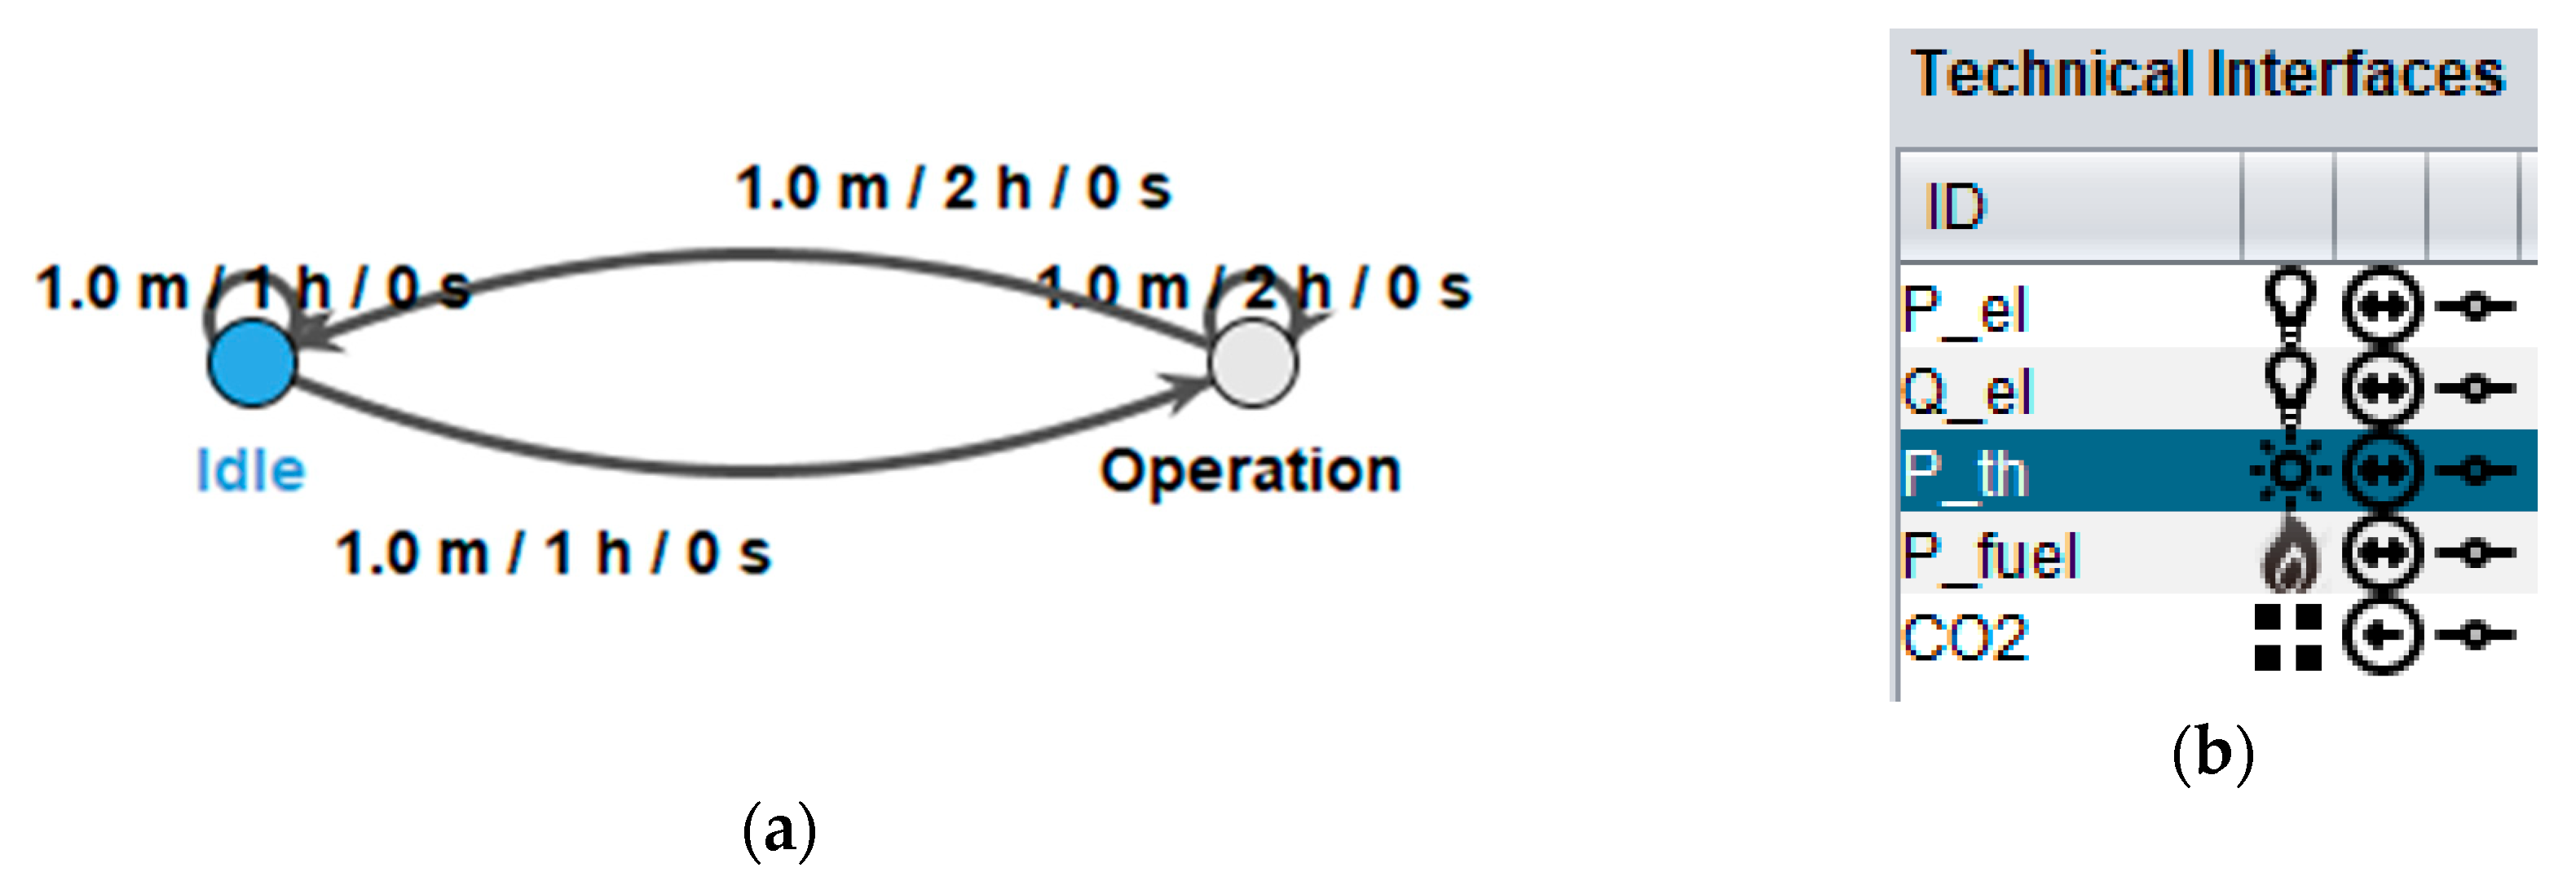
At the CHP site next to the sewage plant (node n23 in the network model), three different systems are located: a natural gas-fired CHP (1), a heat pump that utilizes energy of the CHP’s waste heat (2), which otherwise would remain unused due to low temperatures, and the new wastewater heat pump (3), which is in the focus of the InSekt project and was integrated into this site. For the network model, these systems were aggregated to one node, and thus one energy agent. Internally however, there was a separate EOM description for each system. Those models were combined to an EOM aggregation as introduced in Section 3.2, which is shown in Figure 4.
The CHP was modelled corresponding to the one at node n24, which was described above. The heat pumps were modelled in a similar way. Basically, characteristic curves were modelled, which represent the amount of electrical energy consumed (Pel) and the amount of heat (Pth) supplied for district heating according to the underlying manufacturer’s heat pump specifications. As with the CHP, different loads or operating points can be controlled. The EOM returns the corresponding values of the relevant parameters. From the ratio, the current coefficient of performance (COP) of the heat pump can also be derived. Additionally, the temperature of the heat source has an influence on the selection of the operating point within the framework of a control strategy. Specifically, in the application case presented, the restriction is that temperature of the wastewater should not be cooled down too much for ecological reasons. In general, further individual restrictions can be considered within the EOM.
The energy flows of all subsystems were aggregated per domain, so the aggregation appears like a single system towards the environment. Besides this reduction of simulation complexity, the use of an aggregation provides more flexibility when developing control strategies, as control decisions can either be made by the subsystems on their own, or on the aggregation level for all subsystems. The latter is probably a useful approach in this case, as due to current regulations in Germany, an economic operation of the heat pump is only possible if the electrical energy it consumes is produced by the CHP at the same site (more on this aspect in the discussion section). Thus, the CHP and heat pump must always be considered together. Control strategies for the aggregation have not been implemented yet—this is a task for the remainder of the project. However, like for the single CHP model, the applicability of the aggregated model in simulations was tested with a dummy control strategy making random decisions.
5. Discussion
As explained in the previous section, a multiagent-based simulation of a part of the district heating and medium-voltage networks of city of Lemgo was developed. While both networks were simulated separately, the result is a combined simulation of the coupled networks, since the networks were connected by the CHP. This possibility of integrating several energy domains in one detailed system model is one major point that distinguishes the energy agent approach from the other simulation tools mentioned in Section 2. Another substantial distinction is the seamless life cycle integration that was discussed in Section 3.3 and shown in the Agent.HyGrid project.
First simulations based on static load profiles were performed to reflect the current situation in the Lemgo networks, and these led to plausible results. The network state calculations were validated by comparing the results for smaller test networks with those of professional simulation tools, i.e., Sincal for the electrical as well as ROKA³ and STANET for the district heating network, as shown in the respective Section 4.2 for the district heating and Section 4.3 for the electricity network. Thus, it can be assumed that the generated results for the Lemgo networks are valid.
In the next step, the developed dynamic system models for the systems at the CHP sites will be used to develop control strategies for the Lemgo networks. These strategies should be economically and ecologically beneficial—this with special respect to the integration of the new wastewater heat pump to further reduce the CO2-footprint of the heat production. The implementation of useful control strategies will be a task for the remaining year of the InSekt project. However, the successful integration of dynamic models for both single systems and aggregations in simulations of coupled networks could already be shown with dummy control strategies making random decisions. Thus, the applicability of the energy agent approach for the simulation of sector coupling scenarios could be demonstrated.
Currently, planning is done in advance, driven by matching the predicted demand with the available production capacities using linear programming. Detailed and flexible models will allow for more flexible control approaches, based on the current demand and knowledge about the current state of the network derived from sensor measurements. Furthermore, additional information such as price or weather data that can be obtained by integrating web services will be taken into account.
The ways to implement control strategies are manifold. Based on the description of a system’s operational flexibility in the EOM model, simple problem-specific heuristics can be applied, as well as classical optimization approaches, e.g., linear programming, or metaheuristics such as particle swarm or ant algorithms. The planning process could be executed not only on a local level by the agent itself but also by a central instance for all agents, or in a partly decentralized way for groups of agents. The latter was implemented with the district agents for low voltage distribution networks in the Agent.HyGrid project [31].
Different optimization goals can be imagined, such as an economically focused strategy that aims for benefits from intraday electrical energy markets. On the other hand, an ecologic strategy could aim for maximizing efficiency, minimizing transport and conversion losses, and reducing the usage of fossil fuels. An interesting approach in this context would be the operation of the heat pump with surplus electrical energy from renewable generation, as suggested by the power-to-heat approach: This would increase the usage of renewable energy in the heating sector, thus saving CO2 emissions, and could help to stabilize the electrical network. Unfortunately, in Germany this is not economically viable under current regulations, as the heat pump would be legally treated as a final consumer of electrical energy. Therefore, all taxes and levies would apply [32]. In Lemgo, this can be avoided by operating the heat pump with electrical energy that is produced by the CHP located at the same site. In this case, since the public network is not used, most of those costs do not apply. Thus, while still reducing the CO2-footprint by capturing waste heat, the full potential of the heat pump cannot be used under current regulations. However, by applying different cost models, a comparison between the current and potential different regulations is possible with the presented simulation approach. In this way, the potential benefits of regulatory change can be pointed out.
Possible extensions of the existing infrastructure could also be investigated with this simulation approach: Examples are the integration of solar thermal systems into the sewage plant CHP site that was discussed in Section 4, or the installation of an additional pipe to relief a bottleneck that could be located close to the CHP site.
Finally, in further projects, the scope of the simulation could be broadened. In principle, due to the generic way of handling energy amounts and conversions, the gas network could easily be integrated in the same way as the other domains, thus coupling three instead of two sectors. However, this is not in the scope of the InSekt project and would require the participation of gas experts in the project consortium.
6. Conclusions
The concepts of unified energy agents and the energy option model were introduced. A simulation of coupled electrical and district heating networks was presented, based on a real application case from the city of Lemgo. Based on this simulation, it was shown that the energy agent approach is applicable for the simulation of sector coupling scenarios. Possible ways of performing optimizations on the basis of the simulation were discussed, before closing with an outlook on potential extensions. Regarding the application case, further ideas for additional decarbonization of district heating supply were mentioned, especially the integration of solar thermal. These are considered for subsequent projects in which new cross-sectoral MAS approaches can be applied.
Author Contributions
Conceptualization, C.T., C.D., and N.L.; methodology, C.D., N.L., C.T., and J.M; software, C.D. and N.L.; validation, C.T. and J.M.; investigation, C.T., J.M., and N.L.; data curation, C.T. and J.M.; writing—original draft preparation, N.L., C.T., and J.M.; writing—review and editing, C.D. and S.E.; supervision, S.E.; project administration, C.T.; funding acquisition, C.T. All authors have read and agreed to the published version of the manuscript.
Funding
This research was funded by the European Regional Development Fund (EFRE) and the State of North Rhine Westphalia (NRW) within the scope of the project “Intelligente Sektorenkopplung zur Reduktion von CO2-Emissionen in Energieversorgungssystemen (InSekt)”, research grants no. EFRE-0801095, EFRE-0801111, and EFRE-0801112. The publication of this article was supported by the Open Access Publication Fund of the University of Duisburg-Essen.
Acknowledgments
The authors would like to thank Ralf Settertobulte and Uwe Weber from Stadtwerke Lemgo GmbH for detailed interviews concerning the operation of electrical and district heating networks. In addition to many helpful discussions, they provided data for the modelling approach as well as simulations presented in this contribution.
Conflicts of Interest
The authors declare no conflict of interest. The funders had no role in the design of the study; in the collection, analyses, or interpretation of data; in the writing of the manuscript, or in the decision to publish the results.
References
- Lund, H.; Möller, B.; Mathiesen, B.V.; Dyrelund, A. The role of district heating in future renewable energy systems. Energy 2010, 35, 1381–1390. [Google Scholar] [CrossRef]
- Connolly, D.; Lund, H.; Mathiesen, B.V.; Werner, S.; Möller, B.; Persson, U.; Boermans, T.; Trier, D.; Østergaard, P.A.; Nielsen, S. Heat Roadmap Europe: Combining district heating with heat savings to decarbonise the EU energy system. Energy Policy 2014, 65, 475–489. [Google Scholar] [CrossRef]
- Lund, H.; Werner, S.; Wiltshire, R.; Svendsen, S.; Thorsen, J.E.; Hvelplund, F.; Mathiesen, B.V. 4th Generation District Heating (4GDH): Integrating smart thermal grids into future sustainable energy systems. Energy 2014, 68, 1–11. [Google Scholar] [CrossRef]
- Bloess, A.; Schill, W.-P.; Zerrahn, A. Power-to-heat for renewable energy integration: A review of technologies, modeling approaches, and flexibility potentials. Appl. Energy 2018, 212, 1611–1626. [Google Scholar] [CrossRef]
- Derksen, C.; Linnenberg, T.; Unland, R.; Fay, A. Structure and classification of unified energy agents as a base for the systematic development of future energy grids. Eng. Appl. Artif. Intell. 2015, 41, 310–324. [Google Scholar] [CrossRef]
- Derksen, C.; Unland, R. The EOM: An adaptive energy option, state and assessment model for open hybrid energy systems. In Proceedings of the 2016 Federated Conference on Computer Science and Information Systems (FedCSIS), Gdansk, Poland, 11–14 September 2016; pp. 1507–1515. [Google Scholar]
- Derksen, C.; Linnenberg, T.; Unland, R.; Fay, A. Unified Energy Agents as a Base for the Systematic Development of Future Energy Grids. In Multiagent System Technologies, Proceedings of the 11th German Conference on Multiagent System Technologies (MATES 2013), Koblenz, Germany, 16–20 September 2013; Klusch, M., Thimm, M., Paprzycki, M., Eds.; Springer: Berlin/Heidelberg, Germany, 2013; pp. 236–249. [Google Scholar]
- Müller, M.; Samweber, F.; Leidl, P. Impact of different charging strategies for electric vehicles on their grid integration. In Netzintegration der Elektromobilität 2017, Proceedings of the 2nd Internationale ATZ-Fachachtung Netzintegration der Elektromobilität, Berlin, Germany, 16–17 May 2017; Liebl, J., Ed.; Springer Fachmedien: Wiesbaden, Germany, 2017; pp. 41–55. [Google Scholar]
- Thurner, L.; Scheidler, A.; Schäfer, F.; Menke, J.-H.; Dollichon, J.; Meier, F.; Meinecke, S.; Braun, M. Pandapower—An Open-Source Python Tool for Convenient Modeling, Analysis, and Optimization of Electric Power Systems. IEEE Trans. Power Syst. 2018, 33, 6510–6521. [Google Scholar] [CrossRef] [Green Version]
- Tol, H.İ.; Svendsen, S. Improving the dimensioning of piping networks and network layouts in low-energy district heating systems connected to low-energy buildings: A case study in Roskilde, Denmark. Energy 2012, 38, 276–290. [Google Scholar] [CrossRef] [Green Version]
- Ancona, M.A.; Bianchi, M.; Branchini, L.; Melino, F. District Heating Network Design and Analysis. Energy Procedia 2014, 45, 1225–1234. [Google Scholar] [CrossRef] [Green Version]
- Lehnhoff, S.; Nannen, O.; Rohjans, S.; Schlogl, F.; Dalhues, S.; Robitzky, L.; Hager, U.; Rehtanz, C. Exchangeability of power flow simulators in smart grid co-simulations with mosaik. In Proceedings of the 2015 Workshop on Modeling and Simulation of Cyber-Physical Energy Systems (MSCPES), Seattle, WA, USA, 13 April 2015; pp. 1–6. [Google Scholar]
- Maurer, J.; Elsner, C.; Krebs, S.; Hohmann, S. Combined Optimization of District Heating and Electric Power Networks. Energy Procedia 2018, 149, 509–518. [Google Scholar] [CrossRef]
- Jambagi, A.; Kramer, M.; Cheng, V. Electricity and heat sector coupling for domestic energy systems: Benefits of integrated energy system modelling. In Proceedings of the 2015 International Conference on Smart Cities and Green ICT Systems (SMARTGREENS), Lisbon, Portugal, 20–22 May 2015; pp. 1–6. [Google Scholar]
- Öchsner, R.; Nuß, A.; Lange, C.; Rueß, A. Research Platform: Decentralized Energy System for Sector Coupling. Chem. Eng. Technol. 2019, 42, 1886–1894. [Google Scholar] [CrossRef]
- Lehnhoff, S. Dezentrales Vernetztes Energiemanagement: Ein Ansatz auf Basis eines Verteilten Adaptiven Realzeit-Multiagentensystems; Vieweg + Teubner Verlag: Wiesbaden, Germany, 2010; ISBN 978-3-8348-1270-4. [Google Scholar]
- Linnenberg, T.; Wior, I.; Schreiber, S.; Fay, A. A market-based multi-agent-system for decentralized power and grid control. In Proceedings of the Emerging Technology and Factory Automation Conference (ETFA2011), Toulouse, France, 5–9 September 2011; pp. 1–8. [Google Scholar]
- Kok, J.K.; Warmer, C.J.; Kamphuis, I.G. PowerMatcher: Multiagent control in the electricity infrastructure. In Proceedings of the Fourth International Joint Conference on Autonomous Agents and Multiagent Systems, Utrecht, The Netherlands, 25–29 July 2005; Association for Computing Machinery: New York, NY, USA, 2005; pp. 75–82. [Google Scholar]
- Wernstedt, F. Multi-Agent Systems for Distributed Control of District Heating Systems. Ph.D. Thesis, Blekinge Institute of Technology, Karlskrona, Sweden, 2005. [Google Scholar]
- Johansson, C. Towards Intelligent District Heating. Ph.D. Thesis, Blekinge Institute of Technology, Karlskrona, Sweden, 2010. [Google Scholar]
- Geidl, M.; Koeppel, G.; Favre-Perrod, P.; Klockl, B.; Andersson, G.; Frohlich, K. Energy hubs for the future. IEEE Power Energy Mag. 2007, 5, 24–30. [Google Scholar] [CrossRef]
- Derksen, C.; Branki, C.; Unland, R. Agent. GUI: A multi-agent based simulation framework. In Proceedings of the 2011 Federated Conference on Computer Science and Information Systems (FedCSIS), Szeczin, Poland, 18–21 September 2011; pp. 623–630. [Google Scholar]
- Rao, A.S.; Georgeff, M.P. BDI Agents: From Theory to Practice. In Proceedings of the First International Conference on Multi-Agent Systems (ICMAS-95), San Francisco, CA, USA, 12–14 June 1995; pp. 312–319. [Google Scholar]
- Valdimarsson, P. Modelling of Geothermal District Heating Systems. Ph.D. Thesis, University of Iceland, Faculty of Engineering, Reykjavik, Iceland, 1993. ISBN 978-9979-54-055-7. [Google Scholar]
- Valdimarsson, P. Graph-Theoretical Calculation Model for Simulation of Water and Energy Flow in District Heating Systems. In Proceedings of the 5th International Symposium on Automation of District Heating Systems, Helsinki, Finland, 20–23 August 1995. [Google Scholar]
- Wernstedt, F.; Davidsson, P. Simulation of District Heating Systems for evaluation of Real-Time Control Strategies. In Proceedings of the 1st European Simulation and Modelling Conference, Naples, Italy, 27–29 October 2003. [Google Scholar]
- Austrian Council for Agricultural Engineering and Rural Development. Planning of Biomass Heating Plants and Local District Heating Networks; ÖKL fact sheet 67; ÖKL: Vienna, Austria, 2016. [Google Scholar]
- Arrillaga, J.; Arnold, C.P. Computer Analysis of Power Systems; John Wiley & Sons, Inc.: Hoboken, NJ, USA, 1990; ISBN 978-0-471-92760-0. [Google Scholar]
- Grainger, J.J.; Stevenson, W.D. Power System Analysis; McGraw-Hill: New York, NY, USA, 1994; ISBN 978-0-07-061293-8. [Google Scholar]
- BDEW Konkretisierung des Ampelkonzepts im Verteilungsnetz. Available online: http://www.bdew.de/service/stellungnahmen/konkretisierung-ampelkonzept-verteilungsnetz/ (accessed on 23 April 2020).
- Ludwig, M.; Korotkiewicz, K.; Dahlmann, B.; Zdrallek, M. Agent-based Grid Automation in Distribution Grids: Experiences Under Real Field Conditions. In Proceedings of the CIRED Workshop 2018, Ljubljana, Slovenia, 7–8 June 2018; AIM: Liege, Belgium, 2018. [Google Scholar]
- Witte-Humperdinck, N.E. Untersuchung der Auswirkungen von Einspeisung erneuerbarer Wärme auf KWK-Wärmenetze in urbanen Quartiersstrukturen. Ph.D. Thesis, University of Duisburg-Essen, Duisburg, Germany, 2019. [Google Scholar]
Figure 1.
Excerpt of the network model. Electrical lines and nodes are shown in green and heat nodes and pipess in blue. The orange nodes are the combined heat and power plant (CHP) sites that are part of both domains.
Figure 1.
Excerpt of the network model. Electrical lines and nodes are shown in green and heat nodes and pipess in blue. The orange nodes are the combined heat and power plant (CHP) sites that are part of both domains.

Figure 2.
Comparison of simulation results with the commercial tool STANET, for the supply (a) and return (b) direction at a node in the district heating system’s main transport pipe.
Figure 2.
Comparison of simulation results with the commercial tool STANET, for the supply (a) and return (b) direction at a node in the district heating system’s main transport pipe.


Figure 3.
A simple energy option model (EOM) model of a CHP (Caterpillar G3516H). The operating states are shown in (a), while (b) depicts the defined technical interfaces. The characteristic curve of the CHP, which specifies the consumed and produced energy amount in relation to the operating point, is depicted in (c). In (d), the energy flows and CO2 emissions for operation at 75% are shown.


Figure 4.
EOM aggregation at the CHP site at the sewage plant, consisting of a CHP and two heat pumps.
Figure 4.
EOM aggregation at the CHP site at the sewage plant, consisting of a CHP and two heat pumps.

Publisher’s Note: MDPI stays neutral with regard to jurisdictional claims in published maps and institutional affiliations. |
© 2020 by the authors. Licensee MDPI, Basel, Switzerland. This article is an open access article distributed under the terms and conditions of the Creative Commons Attribution (CC BY) license (http://creativecommons.org/licenses/by/4.0/).
Share and Cite
MDPI and ACS Style
Loose, N.; Thommessen, C.; Mehlich, J.; Derksen, C.; Eicker, S. Unified Energy Agents for Combined District Heating and Electrical Network Simulation. Sustainability 2020, 12, 9301. https://0-doi-org.brum.beds.ac.uk/10.3390/su12219301
AMA Style
Loose N, Thommessen C, Mehlich J, Derksen C, Eicker S. Unified Energy Agents for Combined District Heating and Electrical Network Simulation. Sustainability. 2020; 12(21):9301. https://0-doi-org.brum.beds.ac.uk/10.3390/su12219301
Chicago/Turabian StyleLoose, Nils, Christian Thommessen, Jan Mehlich, Christian Derksen, and Stefan Eicker. 2020. "Unified Energy Agents for Combined District Heating and Electrical Network Simulation" Sustainability 12, no. 21: 9301. https://0-doi-org.brum.beds.ac.uk/10.3390/su12219301
Note that from the first issue of 2016, this journal uses article numbers instead of page numbers. See further details here.