Transport Mode Choice for Residents in a Tourist Destination: The Long Road to Sustainability (the Case of Mallorca, Spain)


Abstract
:
1. Introduction
2. Literature Review
3. Methods
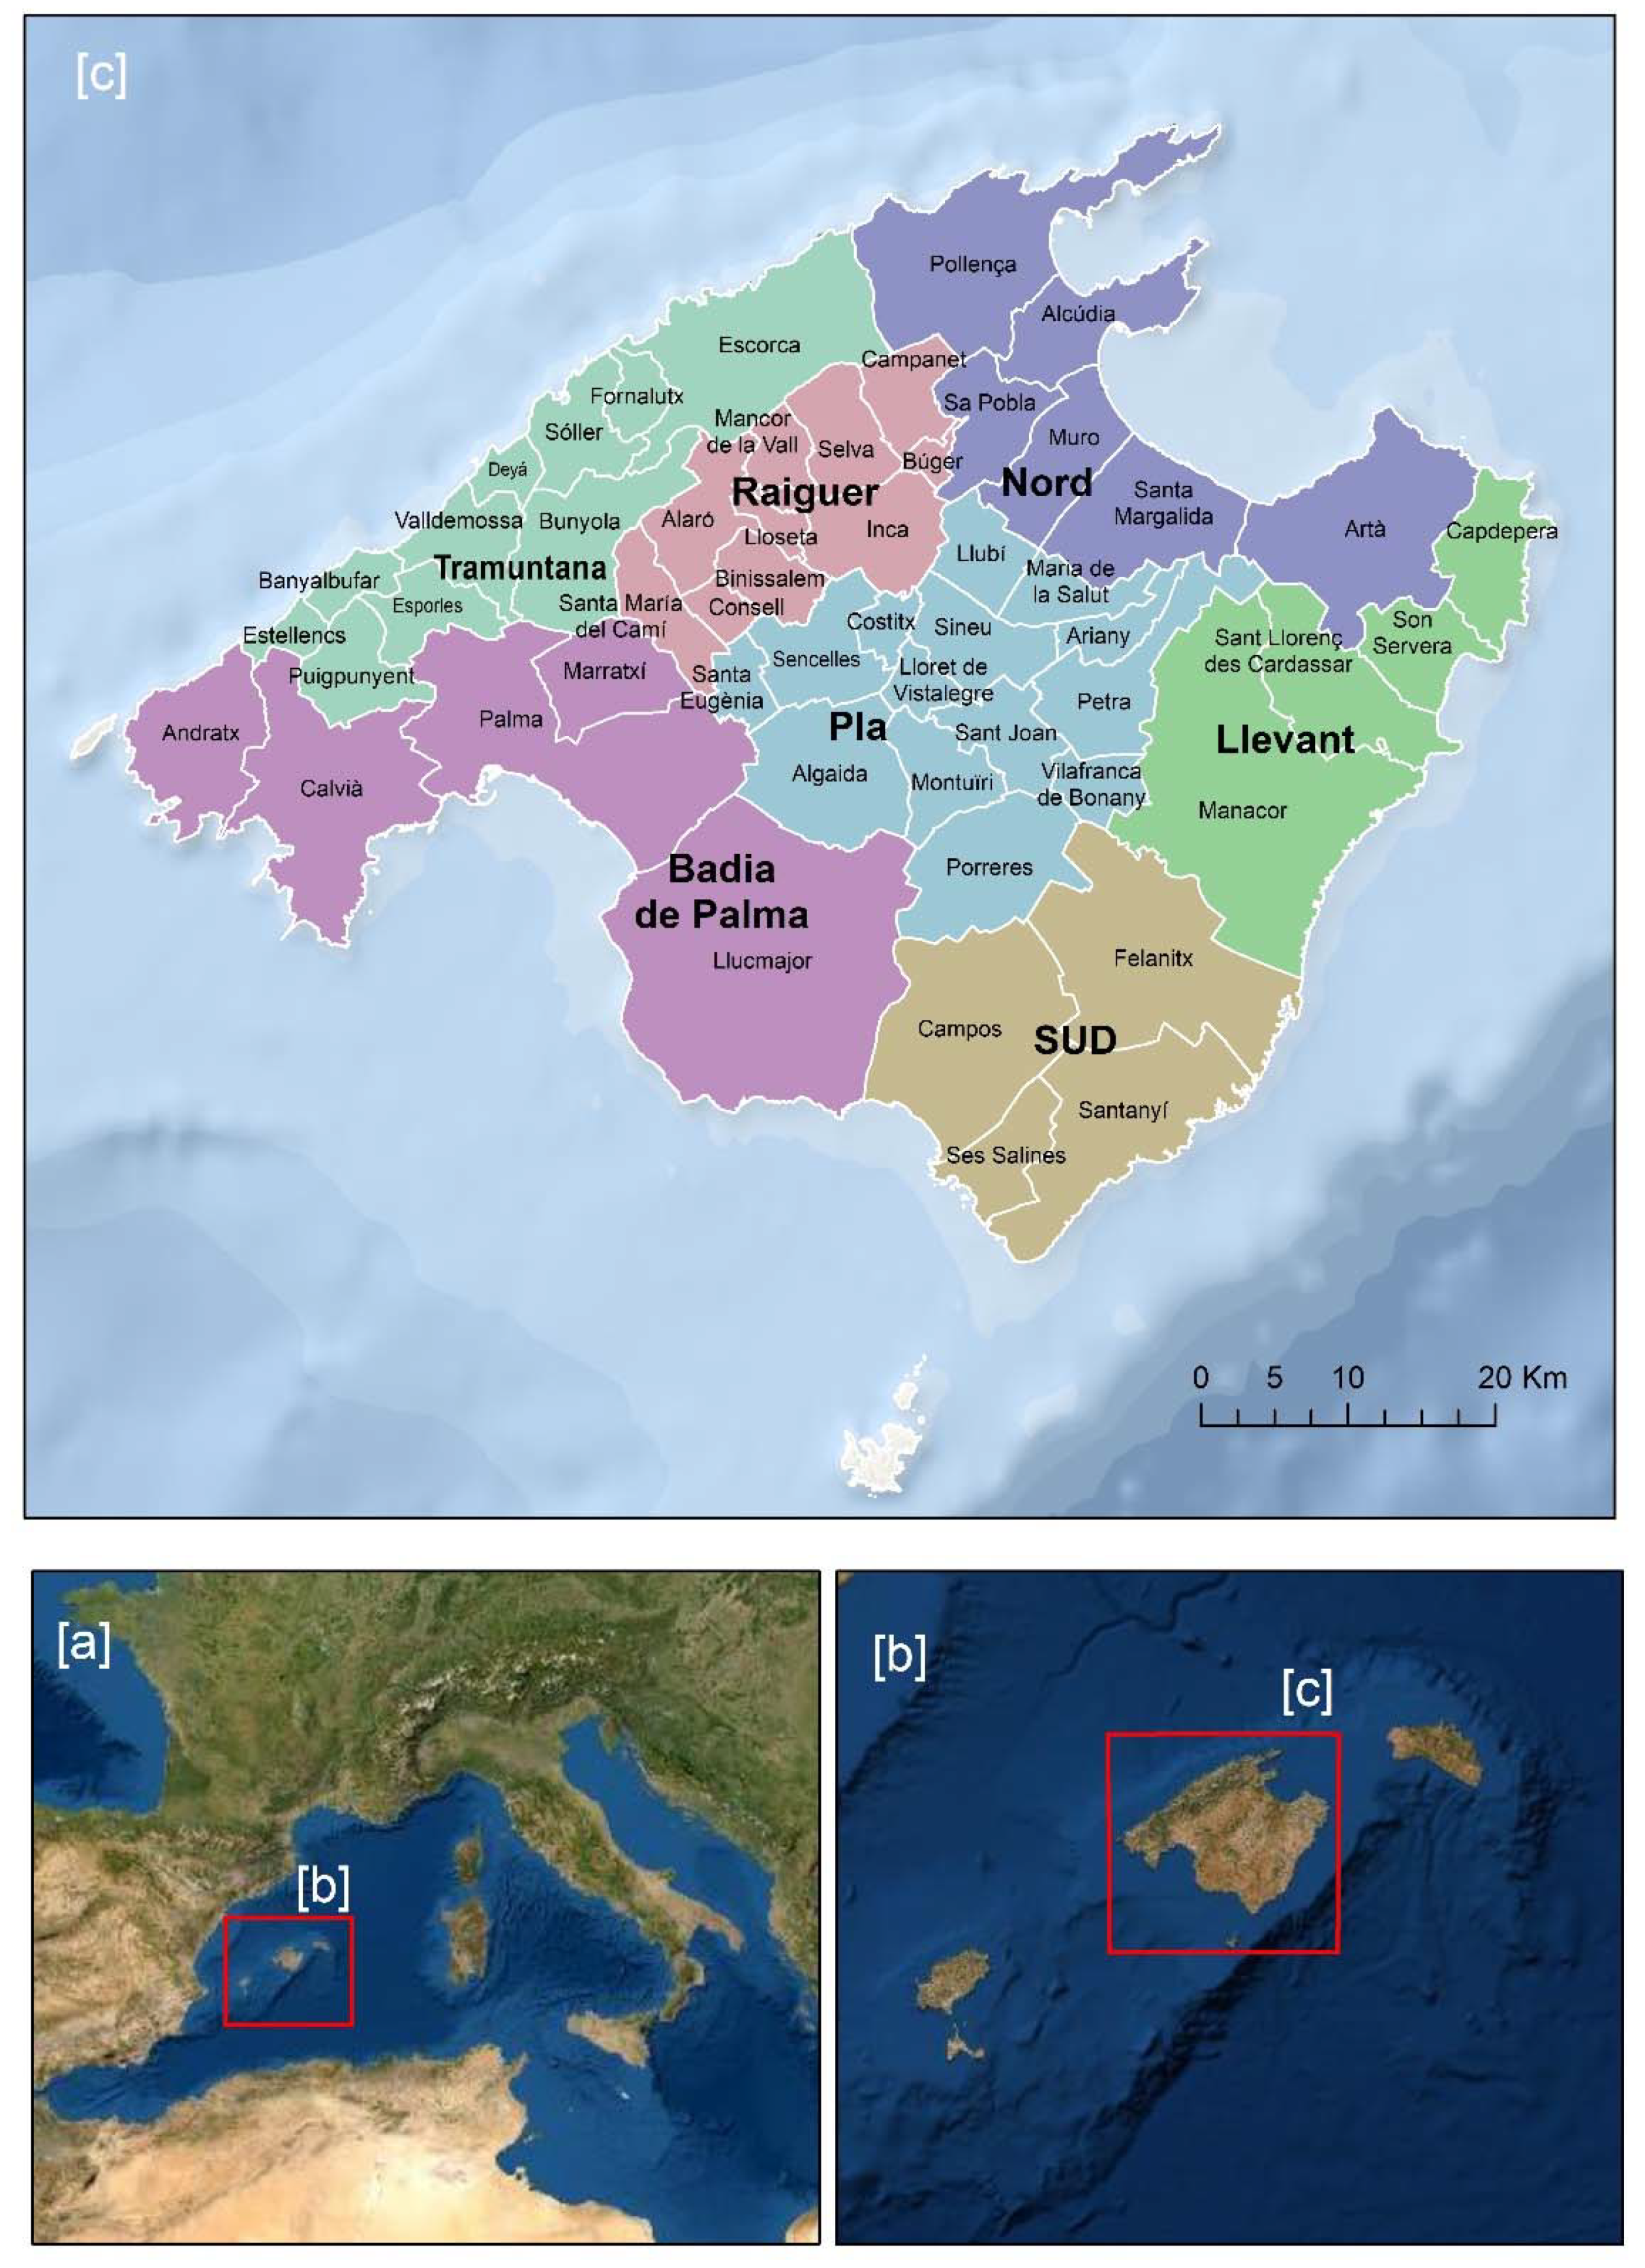
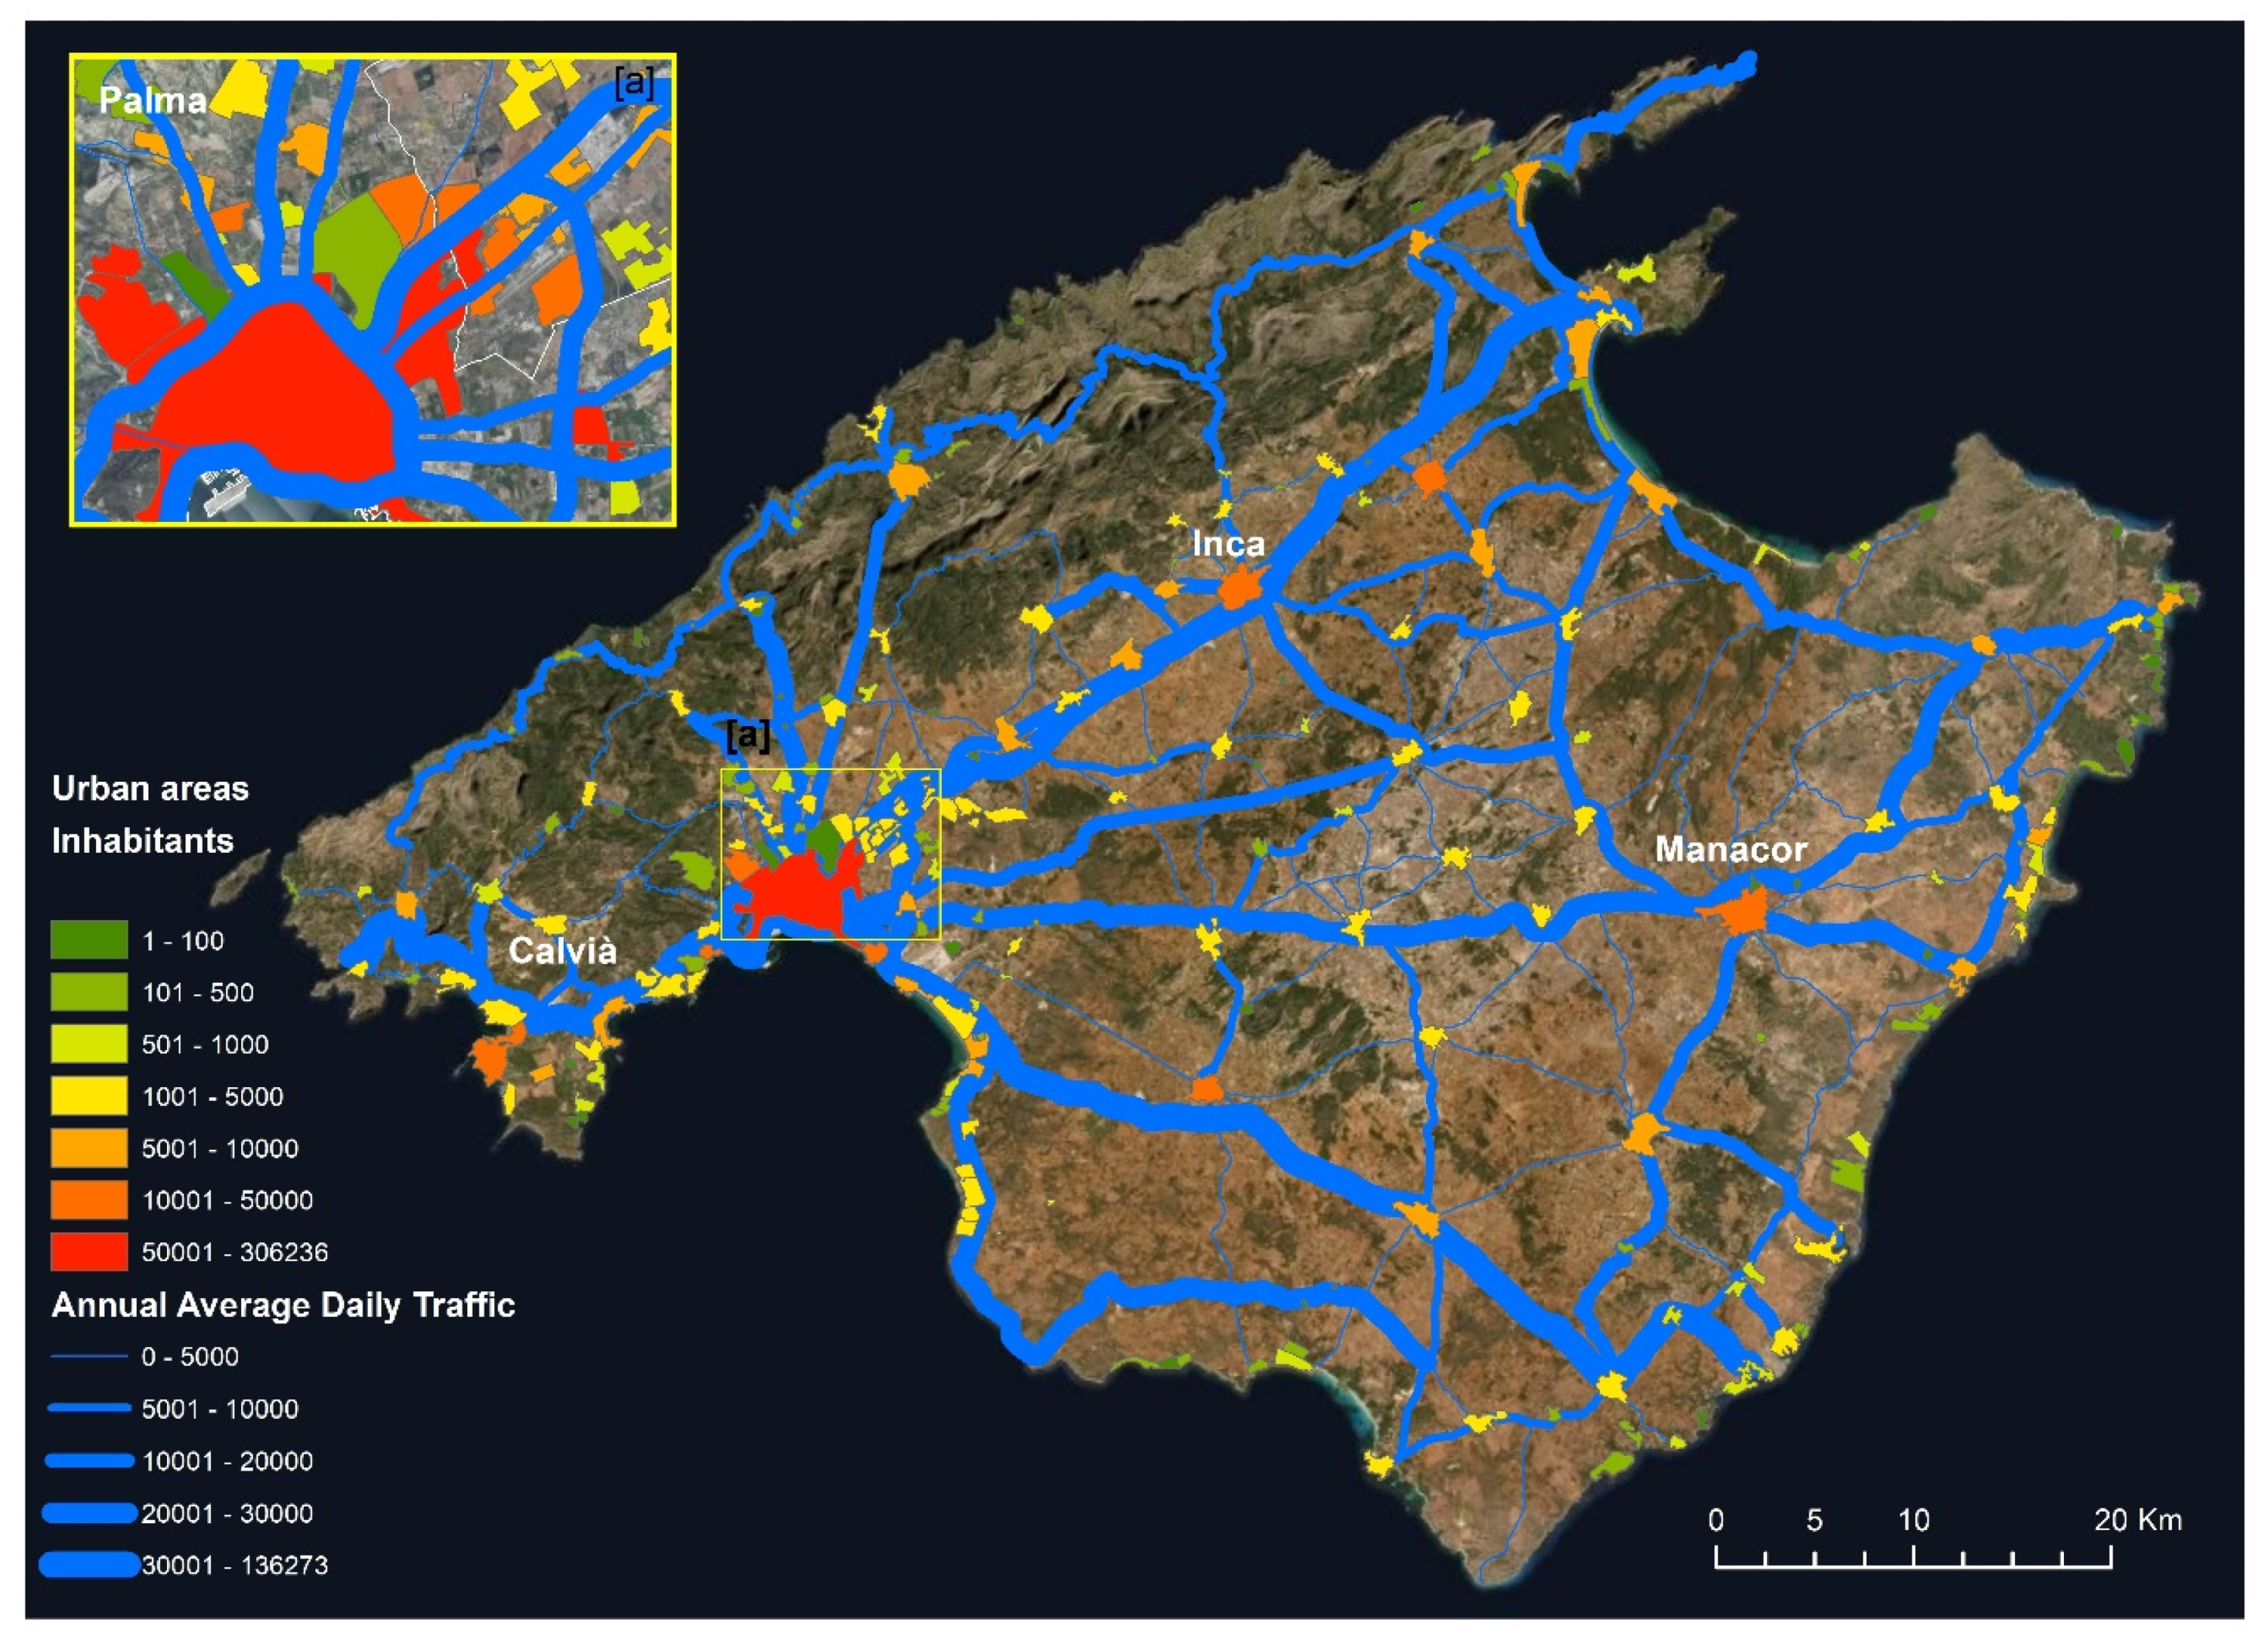
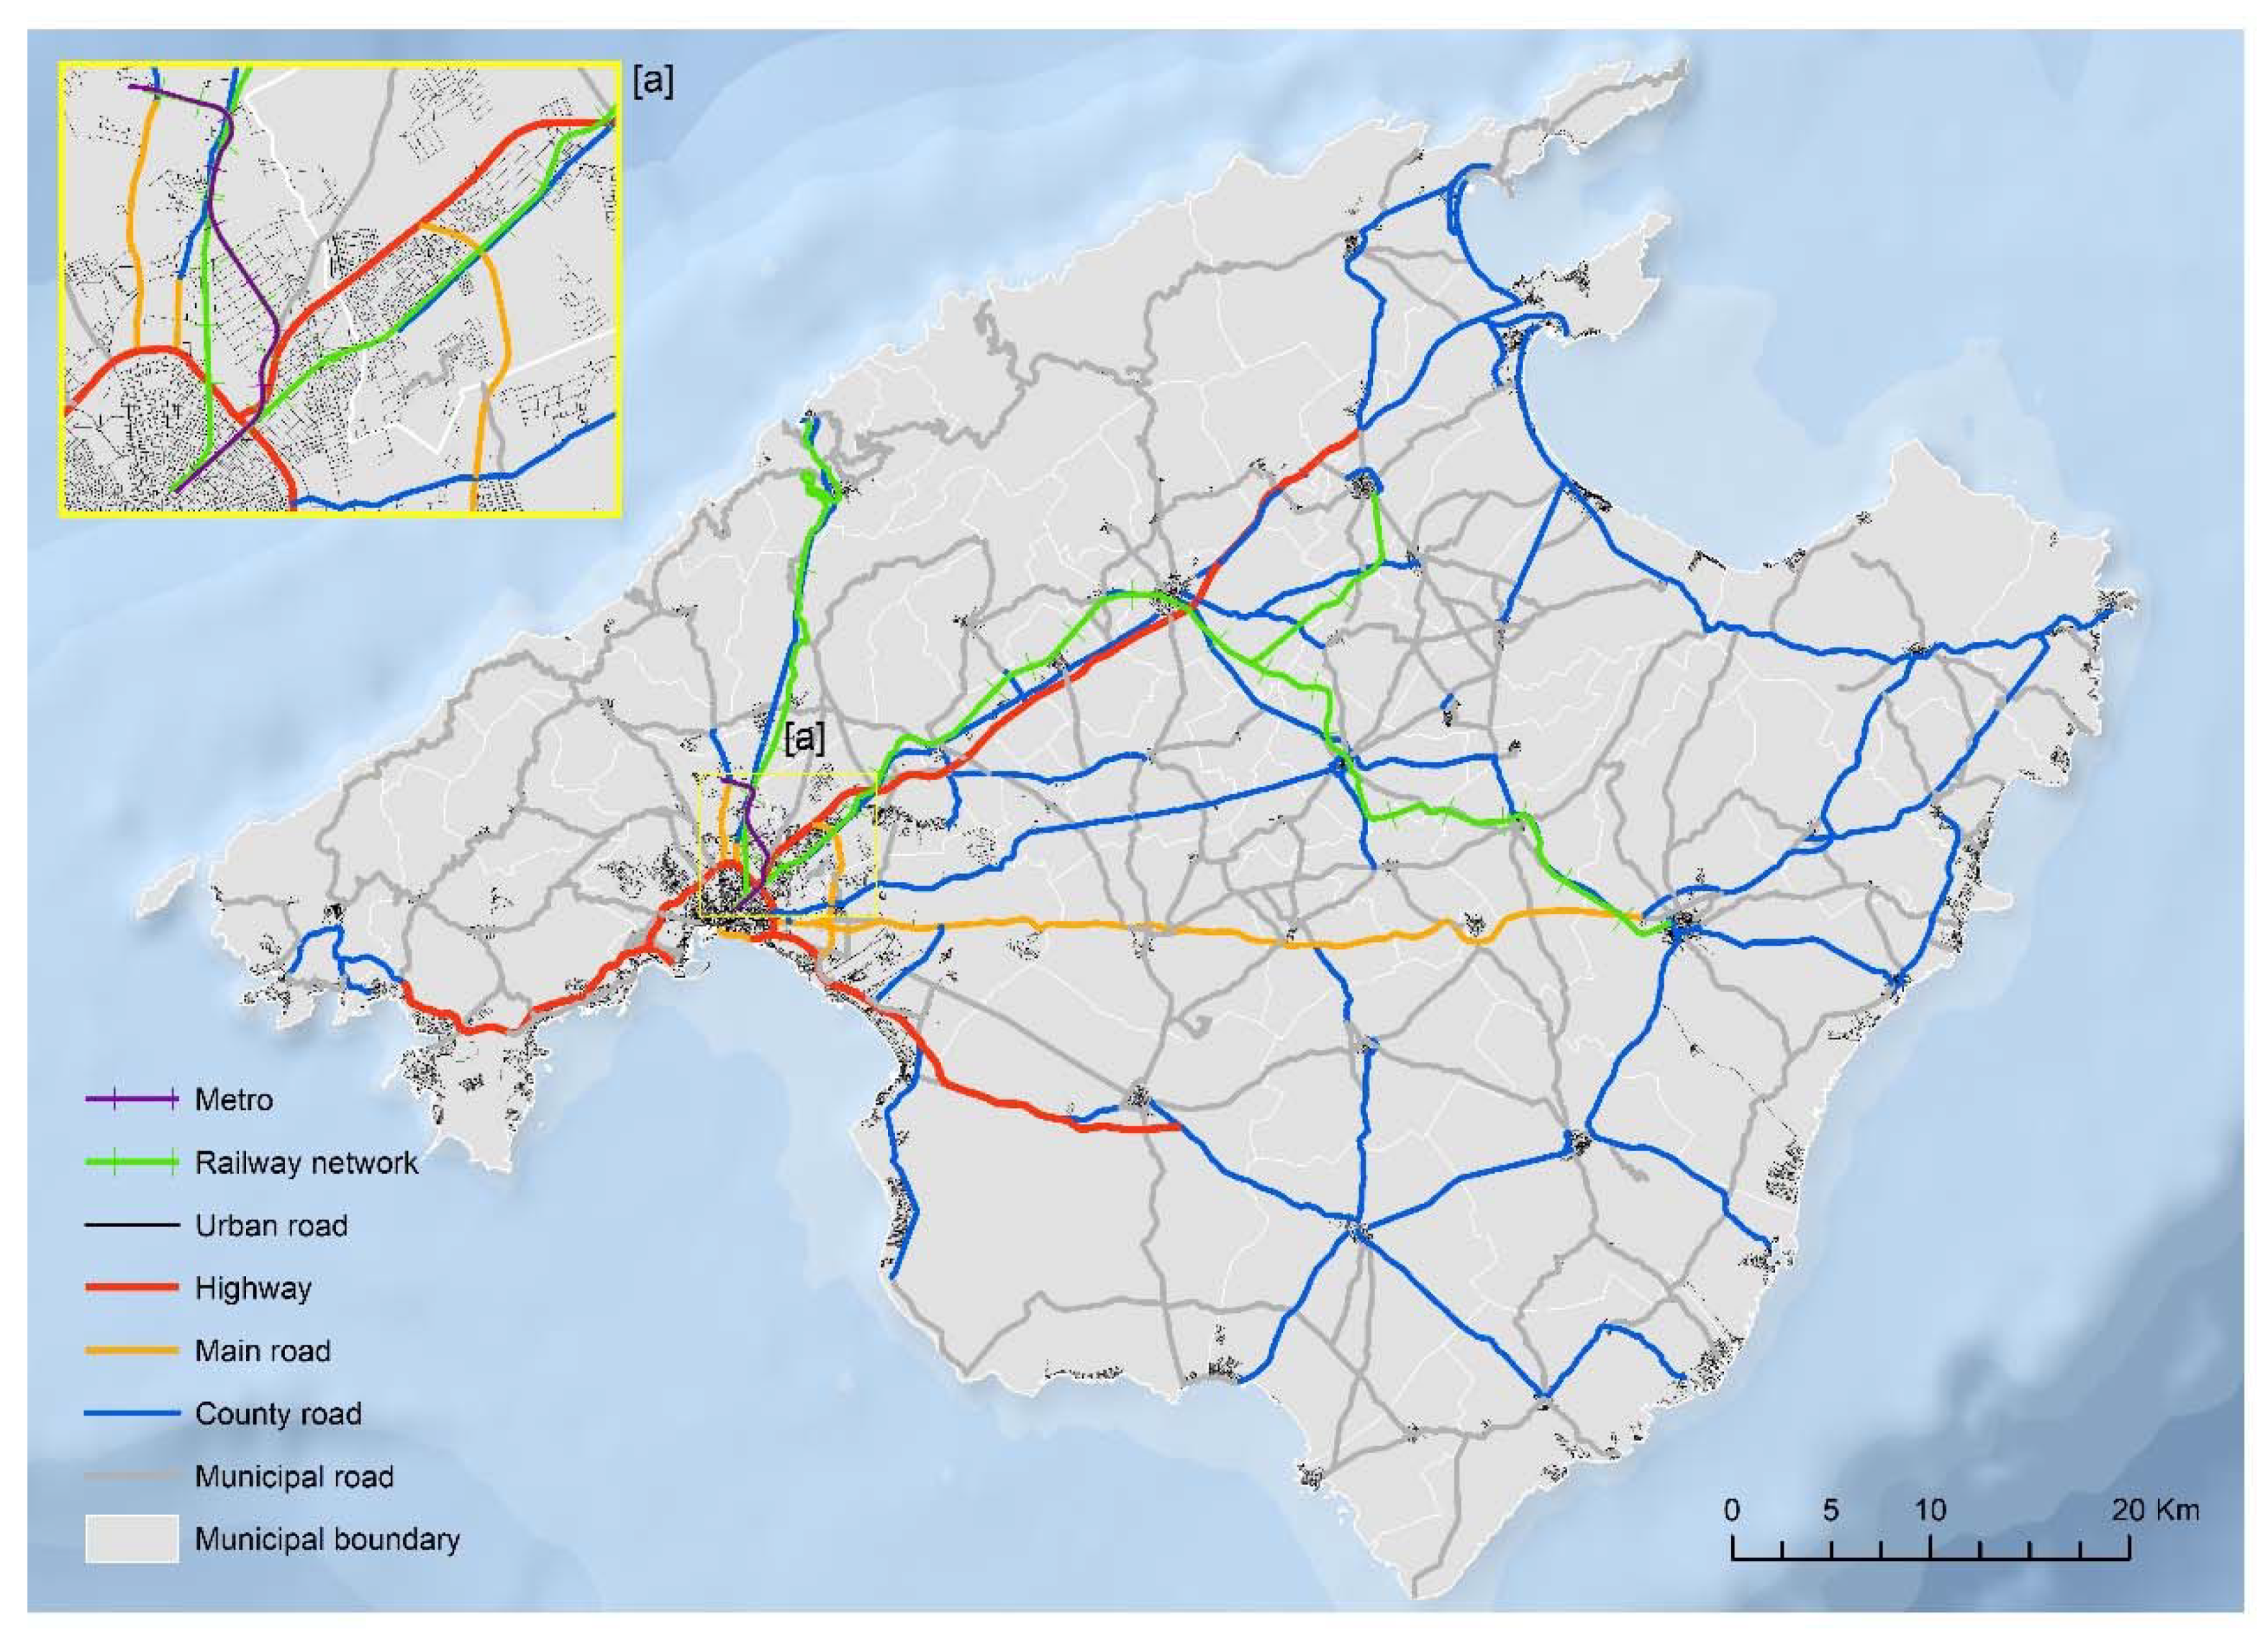
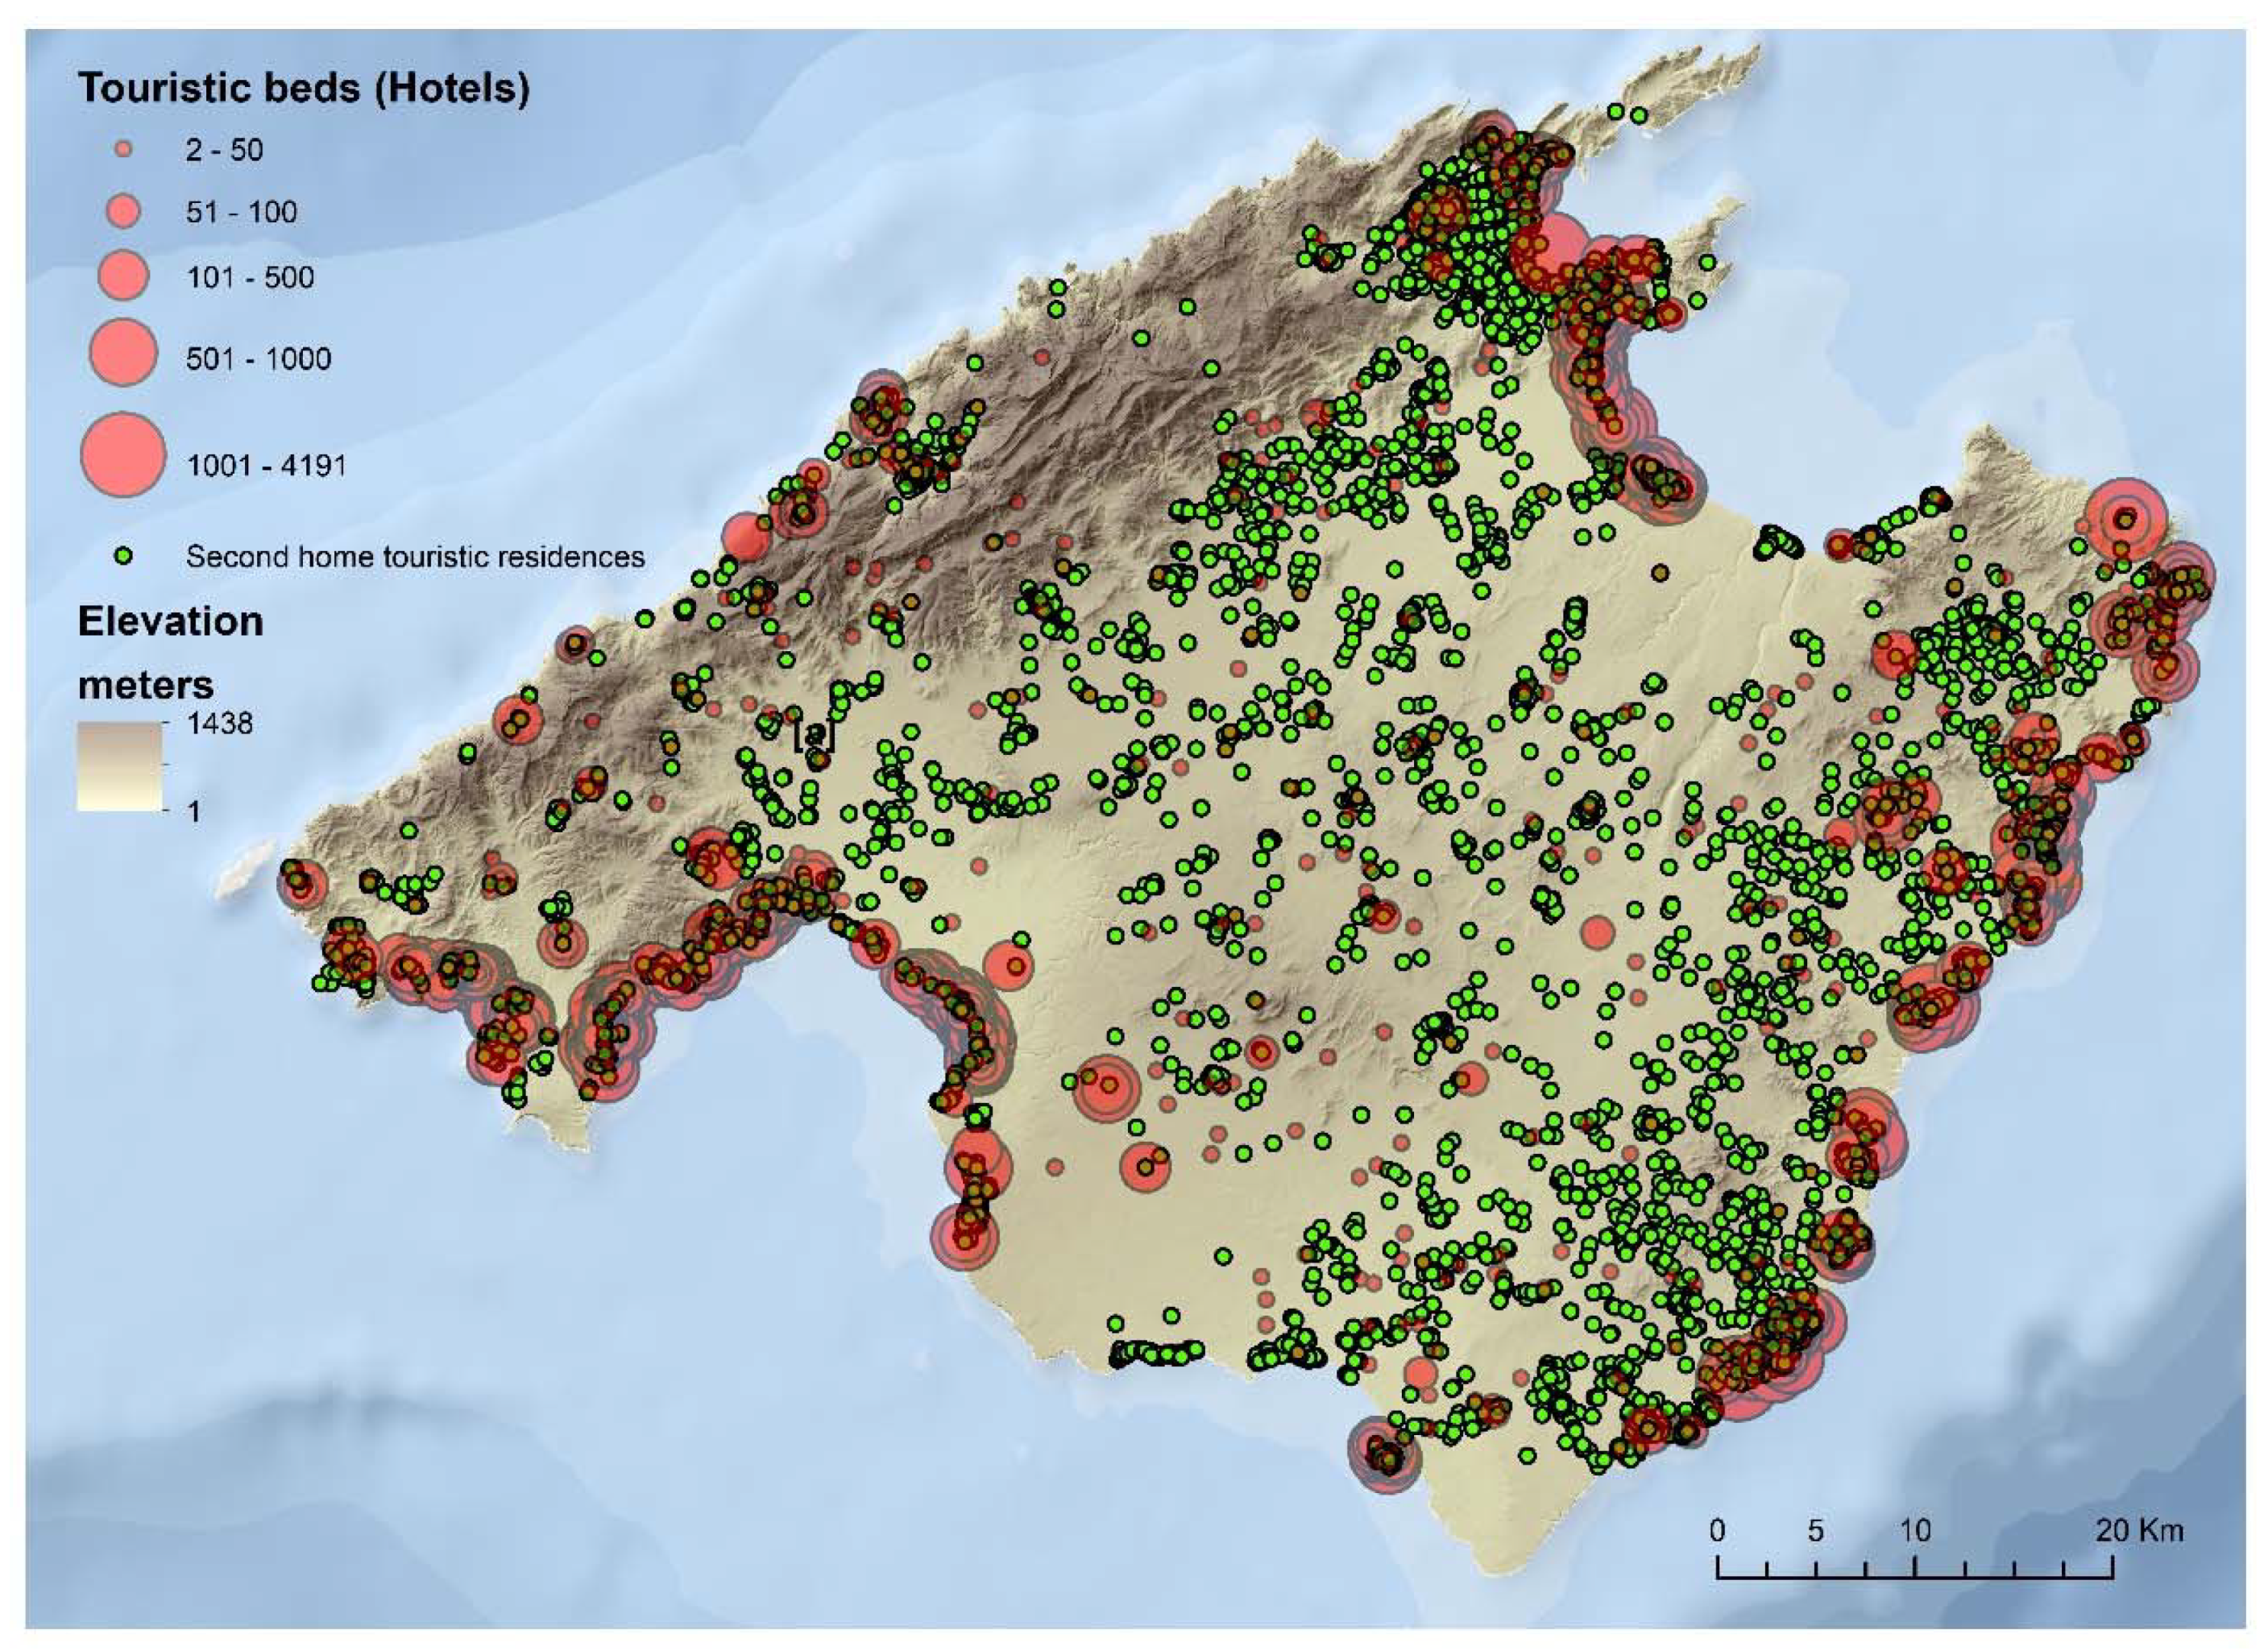
3.1. Case Study
3.2. Data Sources
3.3. Analytic Process
3.3.1. Binary Analysis of the Relationship between Modality and Other Variables
3.3.2. Integrated Analysis of the Modal Choice
3.3.3. Analysis of the Modal Choice at the Municipal Level
4. Results and Discussion
4.1. Modal Relationships
- Gender and modes: The female population is more likely to use both pedestrian modes (56% female/44% male) and bus transport (61.9% female/38.1% male). Bicycles (35.2% women/64.8% men) and motorbikes (16.5% women/83.5% men), on the other hand, are more commonly used by men. These results show a social model of female segregation, in which women are forced to use public transport rather than private vehicles because they do not have the resources to access their own cars or because of a cultural model in which it is difficult for them to have both a driver’s license and their own vehicle.
- Age groups and modes: The private vehicle is typically selected as the preferred mode of transport (55.5% for young people aged 14–29, 62.2% for adults aged 30–44, 51.5% for those aged 45–64), except among the population group over 65, where the pedestrian mode accounts for 61.6% of their journeys. The young population group, from 14 to 29 years old, mostly selects the bus (37.2%), train (39.5%), and metro (53%). The young people’s modal choices of bus and metro are related to the segment of the youth population traveling to school. A special case is the metro, which is mainly used by students from the University of the Balearic Islands, who travel to the campus (located 7.5 km away) from Palma by the only metro line available on the island. The group of adults aged between 30 and 44 years has the highest use of private vehicles (40.5%), motorbikes (43.3%), and bicycles (37%).
- Travel time and modes: Ninety-one percent of trips in Mallorca are local, not exceeding 30 min by car. This interval of travel time corresponds to 83% of trips by train, 80.8% of trips by metro, 93% of trips by car, 98.2% of trips by motorbike, 84.5% of trips by bicycle, and 92.4% of trips by foot. Trips of 30 to 60 min account for 7.6% of the total. Train use is predominant at this interval. Most of the movements around the island comprise recurrent journeys close to the city of Palma from peripheral municipalities, while there are also journeys between inland municipalities and nearby coastal areas. In the interval of trips lasting over 60 min, movements are mostly made on foot or by car (with these modes accounting for 62.6% of trips lasting from 60 to 90 min, 59.2% of trips lasting from 90–120 min, and 64.3% of trips lasting over 120 min).
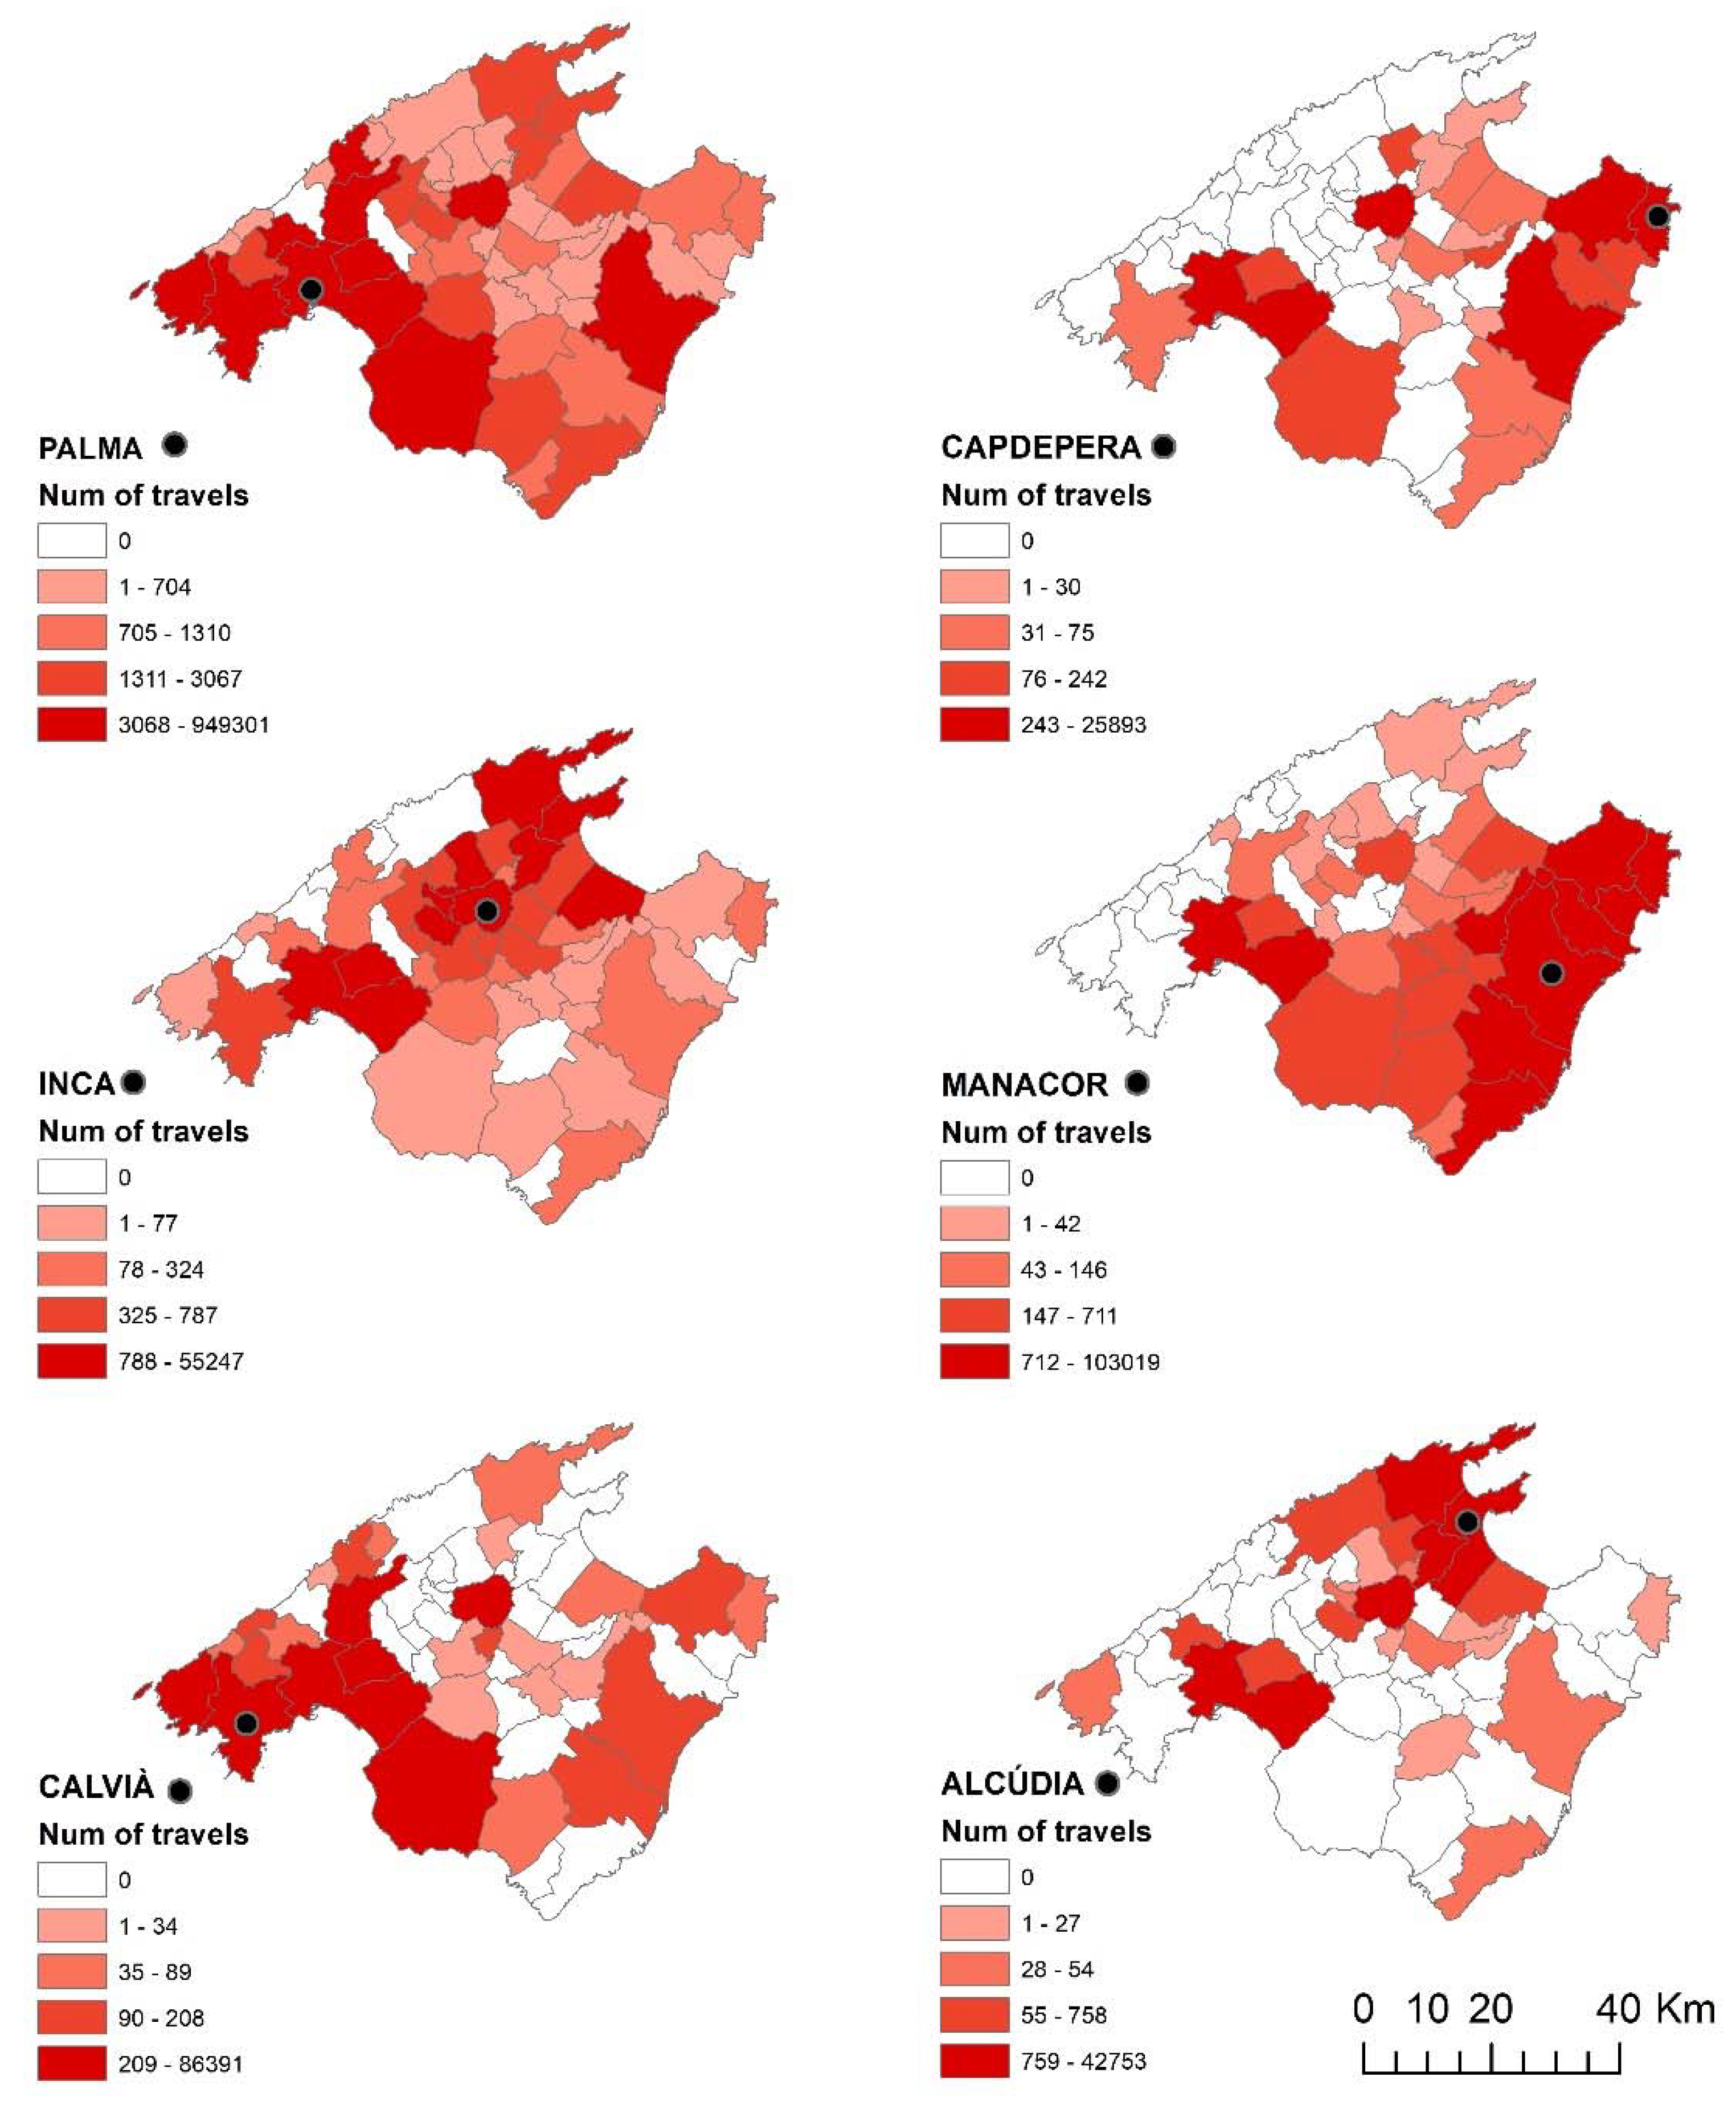
- Proximity to Palma and modes: In total, 54.8% of trips are concentrated in areas less than 15 km from Palma. In addition, 22.53% of train trips are made in areas between 30 and 50 km from Palma, corresponding mainly to movements in Inca and Manacor. These results confirm a radial model of movements to and from Palma as a unique center of attraction and trip generation.
- Regions and modes: The Badia de Palma region concentrates the largest number of journeys (62.9%) in Mallorca. It is worth noting that 95% of all bus journeys and 100% of all trips by metro are made in the Badia de Palma area. The majority of train use is in the Badia de Palma region (56.2%) and in the Raiguer region (23.5%). This distribution shows the great reputation of the city of Palma and its surrounding municipalities (Marratxí, Calvià, Llucmajor) as areas that generate and attract journeys.
- Motive for the journey and modes: Home travel (53.2%), personal arrangements (20.4%), and access to work (16.8%) are the main reasons for travelling. Some 18.1% of bus journeys are made for work purposes. The majority of trips are for traveling home (58.9%) and personal management (24.5%). It should be noted that people preferably start their journeys from their homes in private vehicles and use this mode for almost all their movements.
- Occupation and travel modes: Active people who are employed mainly use cars for their journeys (64.3%), and students also use private vehicles (45.5%). Of the total number of metro users, 49.6% are students. The retired population has reduced use of motorized modes and concentrates 58.9% of their mobility on pedestrian journeys. The bus is used mostly by the working population (37.9%) and students (23.8%).
4.2. Factors in Modal Selection
4.2.1. Motorized Modes
4.2.2. Collective Modes: Bus, Train, and Metro
4.2.3. Healthy or Active Modes
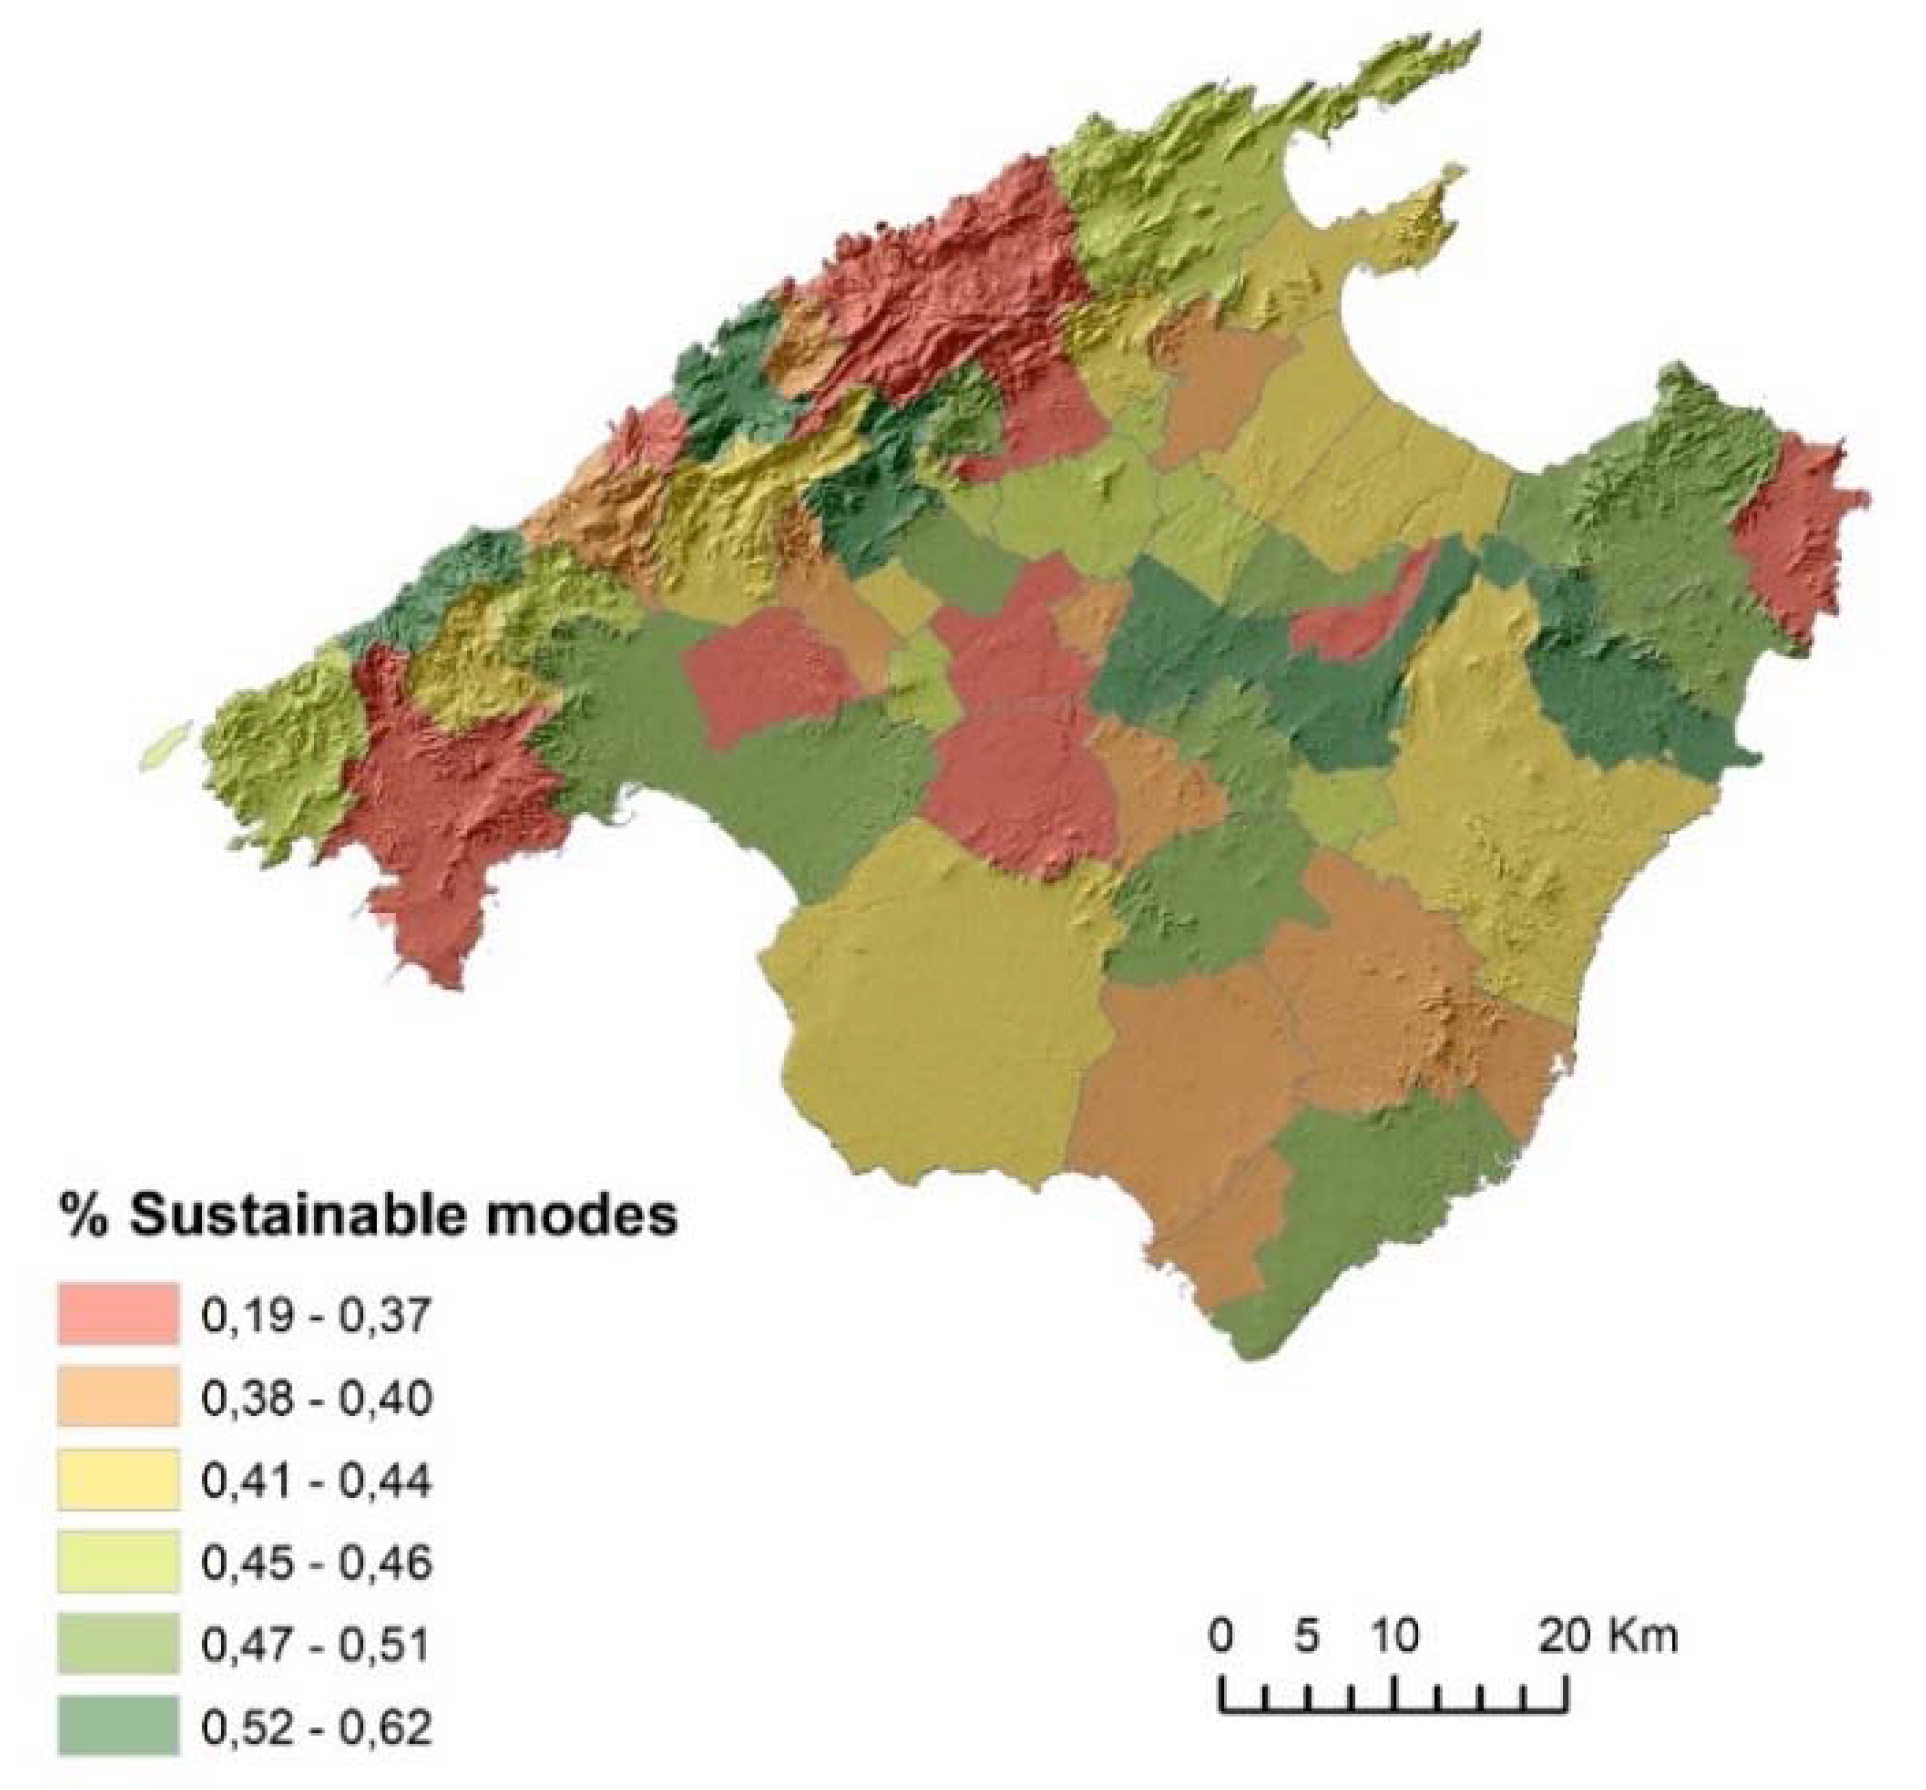
4.2.4. Sustainable Modes
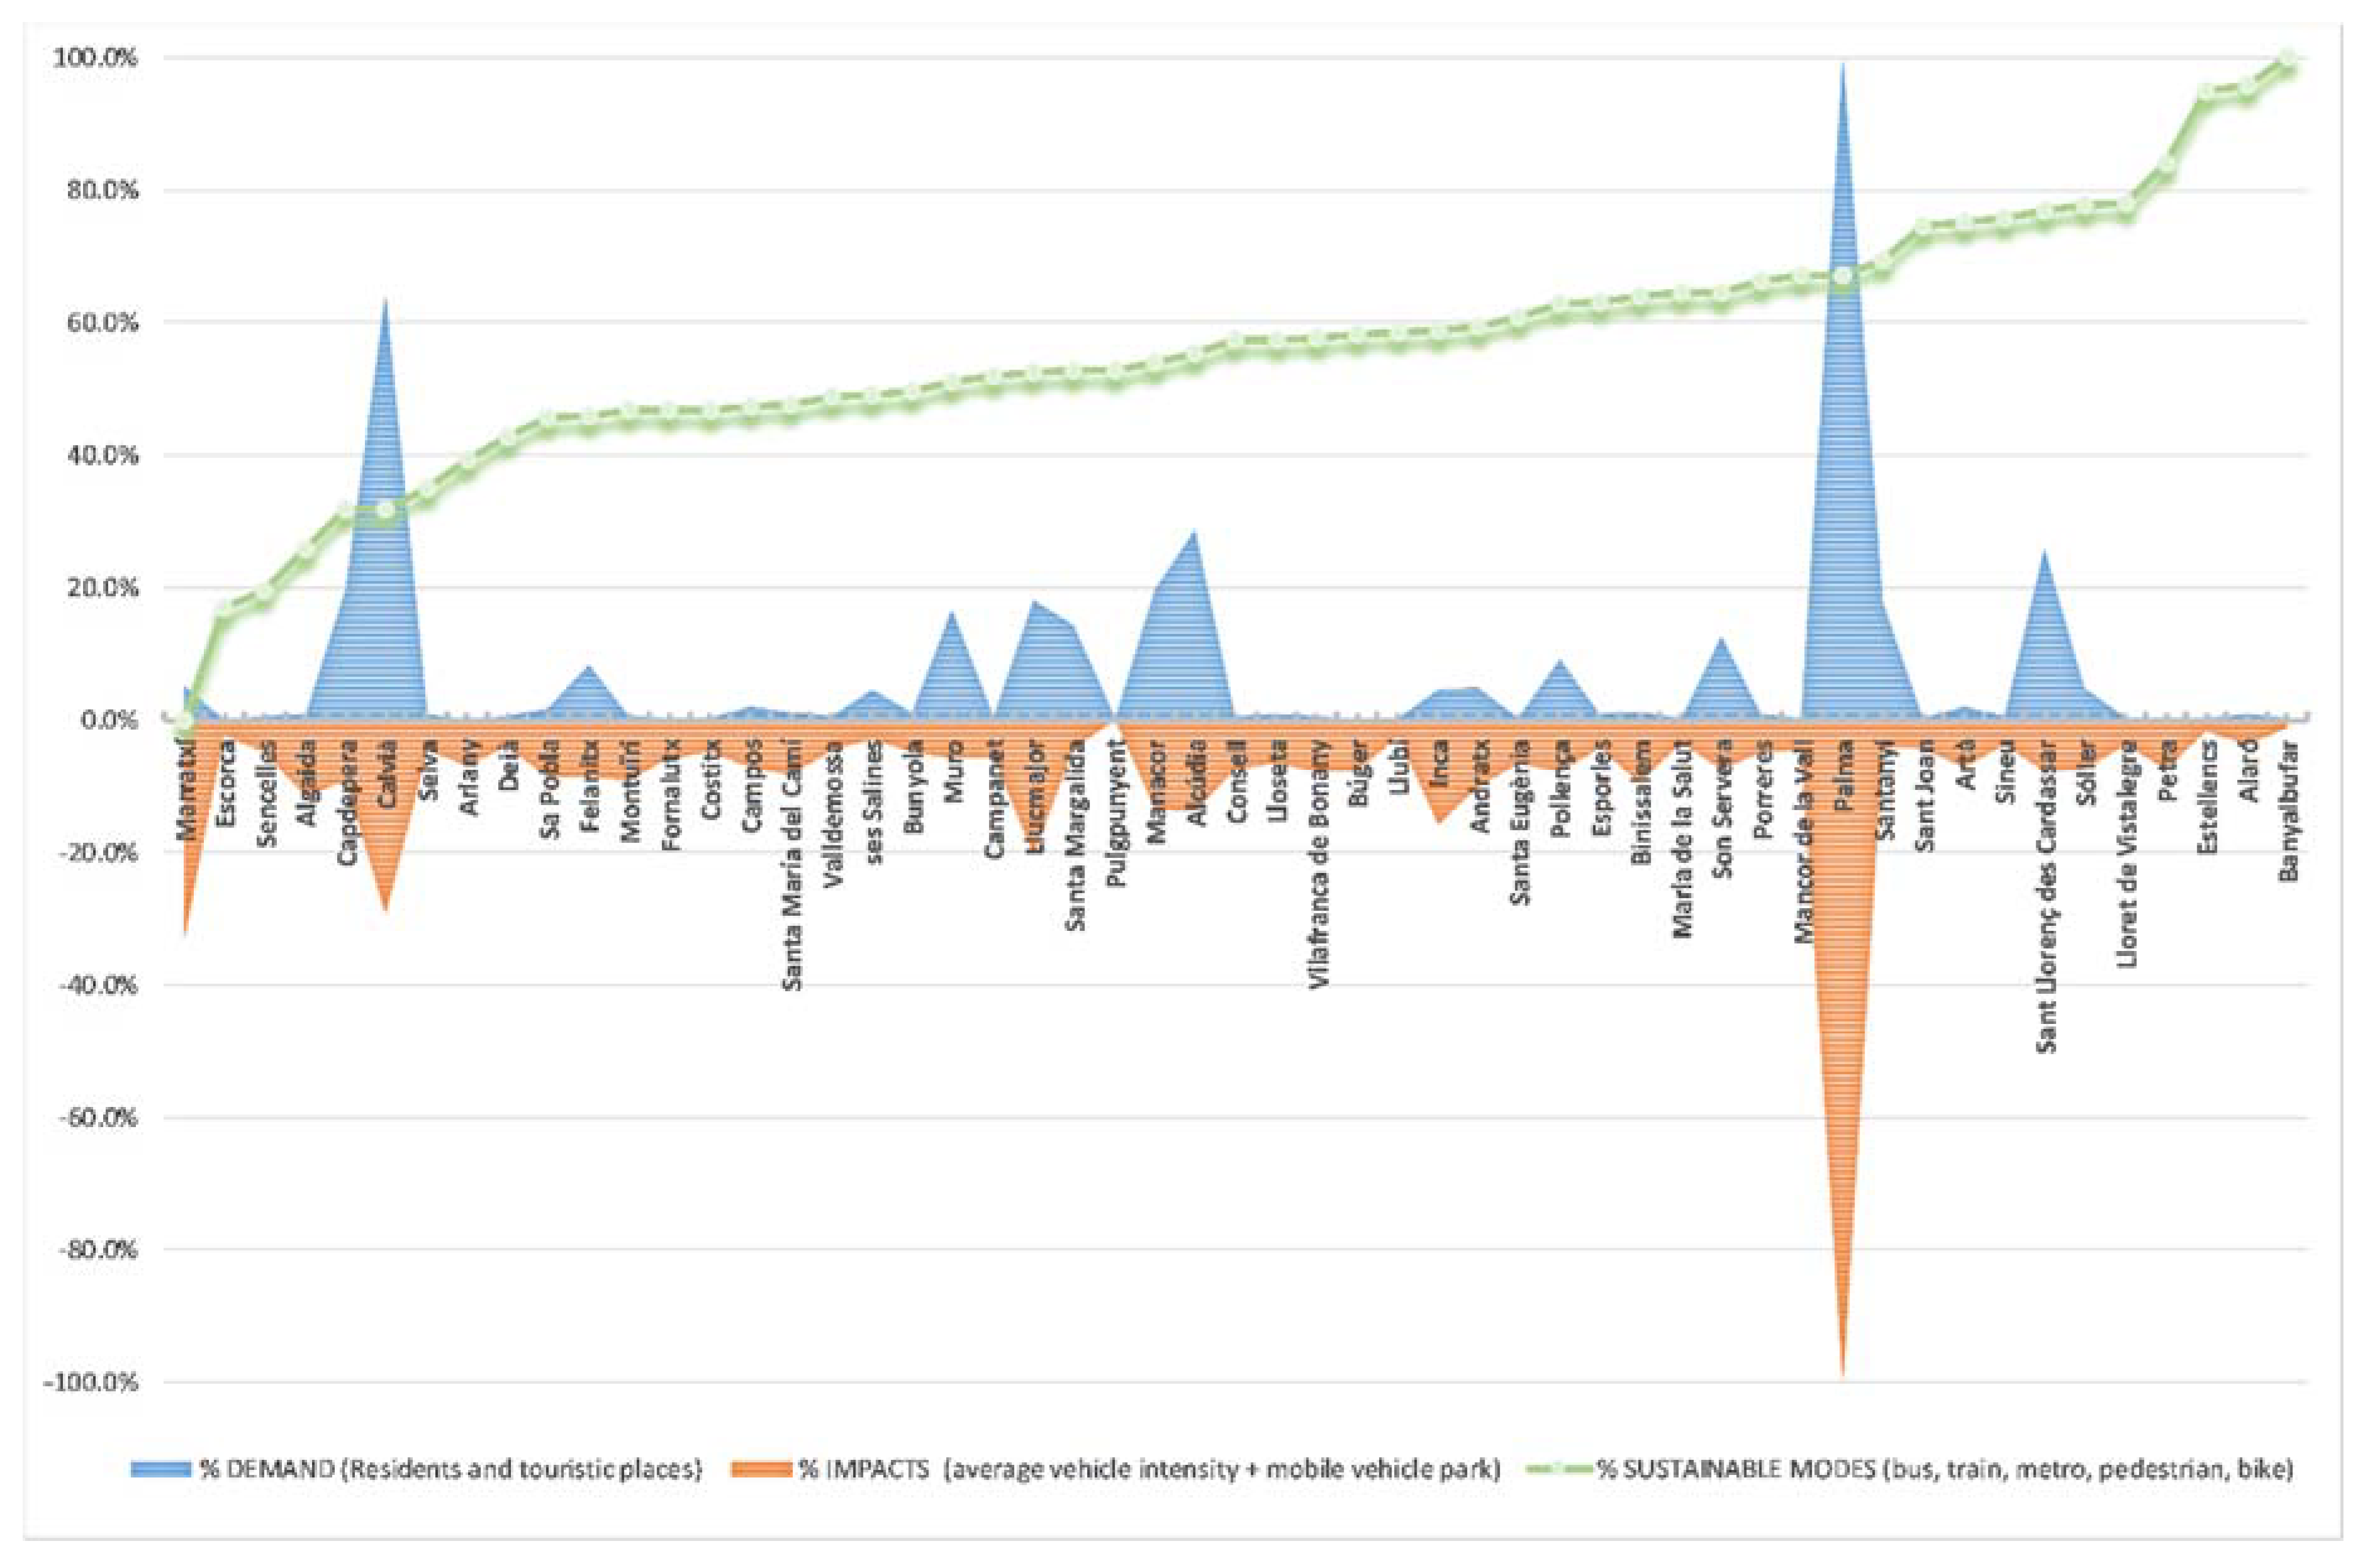
4.3. Modal Choice at the Municipal Level
- Road transport infrastructures are predominant in the island territory, and these roads determine the destinations and their flows. Despite a collective awareness of the promotion of sustainable modes, Mallorca does not have sufficient infrastructure to give proper support to this model. In particular, the rail network is minimal and very poor, as are the metro lines, which are found only in the city of Palma; nor is there any infrastructure for electric trams in urban or peri-urban areas, which could reduce the dependence on cars. The use of railways in certain municipalities in the Raiguer region is significant. Therefore, it is demonstrated that where rail infrastructures exist, their use is also normalized.
- The development of the tourist model in the 1960s was carried out in parallel with the development of motorization, consolidating private transport’s predominance and the lack of concern for collective public modes of transport on the part of the authorities.
- The population pattern in Mallorca is seasonal, making the development and maintenance of efficient and sustainable public transport services complex and costly. Most of the connections among population centers are radial through Palma, a historical territorial heritage, so transversal accessibility on the island is not always guaranteed. The areas of new construction are consolidated in territories without transport services, so the use of private vehicles is obligatory for many journeys.
- The dynamics of mobility promoted by seasonal tourism attract workers living in inland areas to coastal areas. This generates a continuous flow of journeys, which increase traffic congestion at the access points to tourist areas. The implementation of holiday homes (Airbnb) in urban and rural areas has added to the pressure on private vehicle transport.
- The size of the island (maximum 100 km) makes it feasible, a priori, to travel by car to all zones in a short time, making the private vehicle the preferred mode of transport for the population. Most journeys (91.7%) do not exceed 30 min. This makes it an aspiration for all inhabitants to have a private vehicle regardless of the externalities it generates.
- The capital, Palma, has the largest population and concentrates the most important infrastructures, equipment, and services of the island. Therefore, it is a unique center of attraction and trip emission. One example is the University of the Balearic Islands, located 7.5 km from Palma, which generates the mobility of a university group that exceeds 15,000 people, and 62.4% of journeys are made by car. This territorial polarization causes imbalances in mobility on an island level that are difficult to resolve.
- The topography of Mallorca makes it difficult to develop sustainable transport infrastructures (railway networks), especially in the Serra de Tramuntana regions. This entails a greater dependence on private vehicles for the residents of this area.
- o
- Guaranteeing access to public transport, especially for vulnerable groups;
- o
- Reducing pollution generated by mobility;
- o
- Reducing accidents;
- o
- Minimizing energy consumption;
- o
- Minimizing the minimum distance of journeys;
- o
- Changing the modal distribution in favor of non-motorized collective modes;
- o
- Making public transport more flexible and giving rigidity to the private transport offer;
- o
- Optimizing the connections between islands.
5. Conclusions
Author Contributions
Funding
Acknowledgments
Conflicts of Interest
References
- Banister, D. The sustainable mobility paradigm. Transp. Policy 2008, 15, 73–80. [Google Scholar] [CrossRef]
- Banister, D. Cities, mobility and climate change. J. Transp. Geogr. 2011, 19, 1538–1546. [Google Scholar] [CrossRef]
- Litman, T.; Burwell, D. Issues in sustainable transportation. Int. J. Glob. Environ. Issues 2006, 6, 331. [Google Scholar] [CrossRef]
- Bueno, P.; Vassallo, J.; Cheung, K. Sustainability Assessment of Transport Infrastructure Projects: A Review of Existing Tools and Methods. Transp. Rev. 2015, 35, 622–649. [Google Scholar] [CrossRef] [Green Version]
- Santos, G. Sustainability and Shared Mobility Models. Sustainability 2018, 10, 3194. [Google Scholar] [CrossRef] [Green Version]
- Moeckel, R.; Garcia, C.L.; Chou, A.T.M.; Okrah, M.B. Trends in integrated land use/transport modeling: An evaluation of the state of the art. J. Transp. Land Use 2018, 11, 463–476. [Google Scholar] [CrossRef]
- Bierlaire, P.; De Palma, M.; Hurtubia, A.; Waddell, R. Integrated Transport and Land Use Modeling for Sustainable Cities; EPFL Press: Lausanne, Switzerland, 2015. [Google Scholar]
- Meilă, A.D. Sustainable Urban Mobility in the Sharing Economy: Digital Platforms, Collaborative Governance, and Innovative Transportation. Contemp. Read. Law Soc. Justice 2018, 10, 130–136. [Google Scholar]
- Ko, J.; Lee, S.; Byun, M. Exploring factors associated with commute mode choice: An application of city-level general social survey data. Transp. Policy 2019, 75, 36–46. [Google Scholar] [CrossRef]
- Buehler, R. Determinants of transport mode choice: A comparison of Germany and the USA. J. Transp. Geogr. 2011, 19, 644–657. [Google Scholar] [CrossRef]
- Van Acker, V.; Van Wee, B.; Witlox, F. When transport geography meets social psychology: Toward a conceptual model of travel behaviour. Transp. Rev. 2010, 30, 219–240. [Google Scholar] [CrossRef] [Green Version]
- Hunecke, M.; Haustein, S.; Grischkat, S.; Böhler, S. Psychological, sociodemographic, and infrastructural factors as determinants of ecological impact caused by mobility behavior11The results are based on research conducted by the junior research group MOBILANZ, which was supported by the German Federal Min. J. Environ. Psychol. 2007, 27, 277–292. [Google Scholar] [CrossRef]
- Barr, S.; Prillwitz, J. Green travellers? Exploring the spatial context of sustainable mobility styles. Appl. Geogr. 2012, 32, 798–809. [Google Scholar] [CrossRef]
- Johansson, L.; Schipper, O. Measuring the long-run fuel demand of cars: Separate estimations of vehicle stock, mean fuel intensity, and mean annual driving distance. J. Transp. Econ. Policy 1997, 31, 277–292. [Google Scholar]
- Keyvanfar, A.; Shafaghat, A.; Muhammad, N.Z.; Ferwati, M.S. Driving behaviour and sustainable mobility—Policies and approaches revisited. Sustainability 2018, 10, 1152. [Google Scholar] [CrossRef] [Green Version]
- Mraihi, R.; Harizi, R.; Mraihi, T.; Bouzidi, M.T. Urban air pollution and urban daily mobility in large Tunisia’s cities. Renew. Sustain. Energy Rev. 2015, 43, 315–320. [Google Scholar] [CrossRef]
- Prideaux, B. The role of the transport system in destination development. Tour. Manag. 2000, 21, 53–63. [Google Scholar] [CrossRef]
- Nutsugbodo, R.Y.; Amenumey, E.K.; Mensah, C.A. Public transport mode preferences of international tourists in Ghana: Implications for transport planning. Travel Behav. Soc. 2018, 11, 1–8. [Google Scholar] [CrossRef]
- Gronau, W.; Kagermeier, A. Key factors for successful leisure and tourism public transport provision. J. Transp. Geogr. 2007, 15, 127–135. [Google Scholar] [CrossRef]
- Le-Klähn, D.-T.; Gerike, R.; Hall, C.M. Visitor users vs. non-users of public transport: The case of Munich, Germany. J. Destin. Mark. Manag. 2014, 3, 152–161. [Google Scholar] [CrossRef] [Green Version]
- Dickinson, J.E.; Robbins, D. Representations of tourism transport problems in a rural destination. Tour. Manag. 2008, 29, 1110–1121. [Google Scholar] [CrossRef]
- European Commission Libro Verde. Hacia una Nueva Cultura de la Movilidad Urbana; European Commission Libro Verde: Bruselas, Belgium, 2007; p. 25. [Google Scholar]
- De Witte, A.; Hollevoet, J.; Dobruszkes, F.; Hubert, M.; Macharis, C. Linking modal choice to motility: A comprehensive review. Transp. Res. Part A Policy Pract. 2013, 49, 329–341. [Google Scholar] [CrossRef]
- Assi, K.J.; Nahiduzzaman, K.M.; Ratrout, N.T.; Aldosary, A.S. Mode choice behavior of high school goers: Evaluating logistic regression and MLP neural networks. Case Stud. Transp. Policy 2018, 6, 225–230. [Google Scholar] [CrossRef]
- Eluru, N.; Chakour, V.; Elgeneidy, A.M. Travel mode choice and transit route choice behavior in Montreal: Insights from McGill University members commute patterns. Public Transp. 2012, 4, 129–149. [Google Scholar] [CrossRef]
- Alfonzo, M.A. To walk or not to walk? The hierarchy of walking needs. Environ. Behav. 2005, 37, 808–836. [Google Scholar] [CrossRef]
- Commins, N.; Nolan, A. The determinants of mode of transport to work in the Greater Dublin Area. Transp. Policy 2011, 18, 259–268. [Google Scholar] [CrossRef] [Green Version]
- Dill, J.; Wardell, E. Factors Affecting Worksite Mode Choice. Transp. Res. Rec. J. Transp. Res. Board 2007, 1994, 51–57. [Google Scholar] [CrossRef]
- Uriel, E. Regresión lineal múltiple: Estimación y propiedades; Universidad de Valencia: Valencia, Spain, 2013. [Google Scholar]
- Fajardo, H.C.L.C.L.; Gómez, S.A.M.A.M. Análisis de la elección modal de transporte público y privado en la ciudad de Popayán. Territios 2015, 17, 157–190. [Google Scholar] [CrossRef] [Green Version]
- Bergström, A.; Magnusson, R. Potential of transferring car trips to bicycle during winter. Transp. Res. Part A Policy Pract. 2003, 37, 649–666. [Google Scholar] [CrossRef]
- Sabir, M. Weather and Travel Behaviour in Netherlands. Ph.D. Thises, Vrije Universiteit, Amsterdam, The Netherlands, October 2011; pp. 1–152. [Google Scholar]
- Sabir, M.; Koetse, M.J.; Rietveld, P. The impact of weather conditions on mode choice decisions: Empirical evidence for the Netherlands. Proc. BIVEC-GIBET Transp. Res. Day 2007, 512–527. [Google Scholar]
- Liu, C.; Susilo, Y.O.; Karlström, A. The influence of weather characteristics variability on individual’s travel mode choice in different seasons and regions in Sweden. Transp. Policy 2015, 41, 147–158. [Google Scholar] [CrossRef]
- Böcker, L.; Prillwitz, J.; Dijst, M. Climate change impacts on mode choices and travelled distances: A comparison of present with 2050 weather conditions for the Randstad Holland. J. Transp. Geogr. 2013, 28, 176–185. [Google Scholar] [CrossRef]
- Schafer, A.; Victor, D.G. The future mobility of the world population. Transp. Res. Part A Policy Pract. 2000, 34, 171–205. [Google Scholar] [CrossRef]
- Scheiner, J.; Huber, O.; Lohmüller, S. Children’s mode choice for trips to primary school: A case study in German suburbia. Travel Behav. Soc. 2019, 15, 15–27. [Google Scholar] [CrossRef]
- Hong, J.; Shen, Q.; Zhang, L. How do built-environment factors affect travel behavior? A spatial analysis at different geographic scales. Transportation 2014, 41, 419–440. [Google Scholar] [CrossRef]
- Ewing, R.; Cervero, R. ‘Does Compact Development Make People Drive Less?’ The Answer Is Yes. J. Am. Plan. Assoc. 2017, 83, 19–25. [Google Scholar] [CrossRef]
- Braza, M.; Shoemaker, W.; Seeley, A. Neighborhood design and rates of walking and biking to elementary school in 34 California Communities. Am. J. Health Promot. 2004, 19, 128–136. [Google Scholar] [CrossRef]
- Curtis, C.; Babb, C.; Olaru, D. Built environment and children’s travel to school. Transp. Policy 2015, 42, 21–33. [Google Scholar] [CrossRef]
- Berrigan, D.; Troiano, R.P. The association between urban form and physical activity in US adults. Am. J. Prev. Med. 2002, 23, 74–79. [Google Scholar] [CrossRef]
- Klinger, T.; Lanzendorf, M. Moving between mobility cultures: What affects the travel behavior of new residents? Transportation 2015, 43, 243–271. [Google Scholar] [CrossRef]
- Zhou, X.; Yu, Z.; Yuan, L.; Wang, L.; Wu, C. Measuring Accessibility of Healthcare Facilities for Populations with Multiple Transportation Modes Considering Residential Transportation Mode Choice. ISPRS Inter. J. Geo-Inf. 2020, 9, 394. [Google Scholar] [CrossRef]
- Tyrinopoulos, Y.; Antoniou, C. Factors affecting modal choice in urban mobility. Eur. Transp. Res. Rev. 2012, 5, 27–39. [Google Scholar] [CrossRef] [Green Version]
- Müller, S.; Tscharaktschiew, S.; Haase, K. Travel-to-school mode choice modelling and patterns of school choice in urban areas. J. Transp. Geogr. 2008, 16, 342–357. [Google Scholar] [CrossRef]
- Zhang, R.; Yao, E.; Liu, Z. School travel mode choice in Beijing, China. J. Transp. Geogr. 2017, 62, 98–110. [Google Scholar] [CrossRef]
- Searcy, S.E.; Findley, D.J.; Huegy, J.B.; Ingram, M.; Mei, B.; Bhadury, J.; Wang, C. Effect of residential proximity on university student trip frequency by mode. Travel Behav. Soc. 2018, 12, 115–121. [Google Scholar] [CrossRef]
- Scheiner, J.; Holz-Rau, C. Gendered travel mode choice: A focus on car deficient households. J. Transp. Geography 2012, 24, 250–261. [Google Scholar] [CrossRef]
- Kemperman, A.A.; Timmermans, H.H. Influences of built environment on walking and cycling by latent segments of aging population. Transp. Res. Rec. J. Transp. Res. Board 2009, 2134, 1–9. [Google Scholar] [CrossRef]
- Van Middelkoop, M.; Borgers, A.; Timmermans, H. Inducing heuristic principles of tourist choice of travel mode: A rule-based approach. J. Travel Res. 2003, 42, 75–83. [Google Scholar] [CrossRef]
- Kuo, A.; Kao, M.-S.; Chang, Y.-C.; Chiu, C.-F. The influence of international experience on entry mode choice: Difference between family and non-family firms. Eur. Manag. J. 2012, 30, 248–263. [Google Scholar] [CrossRef]
- Abdulsalam, M.A.; Miskeen, B.; Alhodairi, A.M.; Atiq, R.; Bin, A.; Rahmat, K. Modeling a Multinomial Logit Model of Intercity Travel Mode Choice Behavior for All Trips in Libya. Civ. Environ. Struct. Constr. Archit. Eng. 2013, 7, 636–645. [Google Scholar]
- Al-Ahmadi, H.M. Development of intercity work mode choice model for Saudi Arabia. Earthq. Resist. Eng. Struct. VI 2007, 96, 677–685. [Google Scholar]
- De Vos, J.; Derudder, B.; Van Acker, V.; Witlox, F. Reducing car use: Changing attitudes or relocating? The influence of residential dissonance on travel behavior. J. Transp. Geogr. 2012, 22, 1–9. [Google Scholar] [CrossRef] [Green Version]
- Lumsdon, L.M. Factors affecting the design of tourism bus services. Ann. Tour. Res. 2006, 33, 748–766. [Google Scholar] [CrossRef]
- Guiver, J.; Lumsdon, L.; Weston, R.; Ferguson, M. Do buses help meet tourism objectives? The contribution and potential of scheduled buses in rural destination areas. Transp. Policy 2007, 14, 275–282. [Google Scholar] [CrossRef]
- Kaufmann, V.; Bergman, M.M.; Joye, D. Motility: Mobility as Capital. Int. J. Urban Reg. Res. 2004, 28, 745–756. [Google Scholar] [CrossRef]
- Albalate, D.; Bel, G. Tourism and urban public transport: Holding demand pressure under supply constraints. Tour. Manag. 2010, 31, 425–433. [Google Scholar] [CrossRef]
- Attard, M. Reforming the urban public transport bus system in Malta: Approach and acceptance. Transp. Res. Part A Policy Pract. 2012, 46, 981–992. [Google Scholar] [CrossRef]
- Enoch, M.P.; Warren, J.P. Automobile use within selected island states. Transp. Res. Part A Policy Pract. 2008, 42, 1208–1219. [Google Scholar] [CrossRef] [Green Version]
- Gil, A.; Calado, H.; Bentz, J. Public participation in municipal transport planning processes—The case of the sustainable mobility plan of Ponta Delgada, Azores, Portugal. J. Transp. Geogr. 2011, 19, 1309–1319. [Google Scholar] [CrossRef]
- Martín-Cejas, R.R.; Sánchez, P.P.R. Ecological footprint analysis of road transport related to tourism activity: The case for Lanzarote Island. Tour. Manag. 2010, 31, 98–103. [Google Scholar] [CrossRef]
- Bojković, N.; Petrovic, M.; Parezanović, T. Towards indicators outlining prospects to reduce car use with an application to European cities. Ecol. Indic. 2018, 84, 172–182. [Google Scholar] [CrossRef]
- Gerlach, J.; Richter, N.; Becker, U.J. Mobility Indicators Put to Test—German Strategy for Sustainable Development Needs to be Revised. Transp. Res. Procedia 2016, 14, 973–982. [Google Scholar] [CrossRef] [Green Version]
- Gillis, D.; Semanjski, I.; Lauwers, D. How to monitor sustainable mobility in cities? Literature review in the frame of creating a set of sustainable mobility indicators. Sustainability 2015, 8, 29. [Google Scholar] [CrossRef] [Green Version]
- Haghshenas, H.; Vaziri, M. Urban sustainable transportation indicators for global comparison. Ecol. Indic. 2012, 15, 115–121. [Google Scholar] [CrossRef]
- Macedo, J.; Rodrigues, F.; Tavares, F. Urban sustainability mobility assessment: Indicators proposal. Energy Procedia 2017, 134, 731–740. [Google Scholar] [CrossRef]
- Mozos-Blanco, M. Ángel; Pozo-Menéndez, E.; Arce, R.; Baucells-Aletà, N. The way to sustainable mobility. A comparative analysis of sustainable mobility plans in Spain. Transp. Policy 2018, 72, 45–54. [Google Scholar] [CrossRef]
- Moeinaddini, M.; Asadi-Shekari, Z.; Shah, M.Z. An urban mobility index for evaluating and reducing private motorized trips. Measurement 2015, 63, 30–40. [Google Scholar] [CrossRef]
- Muñoz, M.D.; Cantergiani, C.; Salado, M.; Rojas, C.; Gutiérrez, S. Propuesta de un Sistema de para Indicadores de Sostenibilidad para la movilidad y el transporte urbanos. Aplicación mediante SIG a la ciudad de Alcalá de Henares. Cuad. Geogr. 2007, 81, 31–50. [Google Scholar]
- IBESTAT. Demografia/Turismo. 2020. Available online: https://ibestat.caib.es/ibestat/ (accessed on 20 September 2020).
- Sebastián, J.B. Caracterització, Tipificació i Pautes de Localització de les Àrees Rururbanes y L’illa de Mallorca. Ph.D. Thesis, Universitat de les Illes Balears, Illes Balears, Spain, 1996. [Google Scholar]
- Mateu, J.; Seguí, J.M.; Ruiz, M. Mallorca and its metropolitan dynamics: Daily proximity and mobility in an island-city. Eure 2017, 43, 129. [Google Scholar]
- Consell Insular de Mallorca: Tráfico. 2020. Available online: https://web.conselldemallorca.cat/documents/774813/882786/20200309-AFOROS_2019.pdf/fc89cd80-22bd-9ae5-47de-eccc49075c48?t=1583748426651 (accessed on 20 September 2020).
- de Mallorca, C. Carreteres. 2020. Available online: http://www.conselldemallorca.info/sit/incidencies/ (accessed on 20 September 2020).
- Direcció General de Mobilitat i Transport Terrestre. Conselleria de Mobilitat i Habitatge. 2020. Available online: http://www.caib.es/govern/organigrama/area.do?coduo=200&lang=ca (accessed on 20 September 2020).
- de Mallorca, C. Departament de Mobilitat i Infraestructures. 2020. Available online: https://web.conselldemallorca.cat/es/web/web1/movilidad-infraestructuras (accessed on 20 September 2020).
- Govern de les Illes Balears (GOIB). Consorci de Transports de Mallorca. 2020. Available online: https://www.tib.org/es/web/ctm/ (accessed on 20 September 2020).
- Govern de les Illes Balears (GOIB). Serveis Ferroviaris de Mallorca. 2020. Available online: http://www.trensfm.com/ (accessed on 20 September 2020).
- de Palma, A. MobiPalma. 2020. Available online: http://www.mobipalma.mobi/es/ (accessed on 20 September 2020).
- de Palma, A. Empresa Municipal de Transports de Palma. 2020. Available online: http://www.emtpalma.cat/ca/inici (accessed on 20 September 2020).
- Vega Pindado, P. Los Planes de Movilidad Urbana Sostenible en España (PMUS): Dos Casos Paradigmáticos: San Sebastián-Donostia y Getafe; Universidad Complutense de Madrid: Madrid, Spain, 2019. [Google Scholar]
- Union, E. CIVITAS Dyn@mo Project. 2020. Available online: https://civitas.eu/content/palma (accessed on 20 September 2020).
- de Palma, A. Pla de Mobilitat Urbana Sostenible. CIVITAS UE. 2014. Available online: http://www.mobipalma.mobi/es/pla-mobilitat-urbana-sostenible-pmus/ (accessed on 20 September 2020).
- Govern de les Illes Balears (GOIB). Ley 4/2014, de 20 de junio, de transportes terrestres y movilidad sostenible de las Illes Balears. Boletín Oficial del Estado, 172 de 16 de julio de 2014. Actual. Jurídica Ambient. 2014, 38, 51–53. [Google Scholar]
- Govern de les Illes Balears (GOIB). Decret 35/2019 de 10 de maig, D’aprovació del Pla Director Sectorial de Mobilitat de les Illes Balears; Butlletí Of. les Illes Balear: Palma, Spain, 2019; pp. 19412–19418.
- Govern de les Illes Balears (GOIB). Portal de Dades Obertes. 2020. Available online: http://www.caib.es/sites/opendatacaib/ca/inici_home/?campa=yes (accessed on 20 September 2020).
- Airbnb. Inside Airbnb. 2020. Available online: http://insideairbnb.com/ (accessed on 20 September 2020).
- Dirección General de Tráfico. Ministerio del Interior. Gobierno de España. Parque de Vehículos. Available online: http://www.dgt.es/es/explora/en-cifras/parque-de-vehiculos.shtml (accessed on 20 August 2020).
- Govern de les Illes Balears (GOIB). Enquestes de Mobilitat 2009/2010; Internal Report; Govern de les Illes Balears (GOIB): Illes Balears, Spain.
- Peng, C.-Y.J.; Lee, K.L.; Ingersoll, G.M. An introduction to logistic regression analysis and reporting. J. Educ. Res. 2002, 96, 3–14. [Google Scholar] [CrossRef]
- Camarero, L.; Oliva, J. Exploring the social face of urban mobility: Daily mobility as part of the social structure in Spain. Int. J. Urban Reg. Res. 2008, 32, 344–362. [Google Scholar] [CrossRef]
- Miralles-Guasch, C.; Melo, M.M.; Marquet, O. A gender analysis of everyday mobility in urban and rural territories: From challenges to sustainability. Gender Place Cult. 2016, 23, 398–417. [Google Scholar] [CrossRef]
- Schwanen, T.; Mokhtarian, P.L. What if you live in the wrong neighborhood? The impact of residential neighborhood type dissonance on distance traveled. Transp. Res. Part D Transp. Environ. 2005, 10, 127–151. [Google Scholar] [CrossRef] [Green Version]
- Castanheira, G.; Bragança, L. The Evolution of the Sustainability Assessment Tool SBToolPT: From Buildings to the Built Environment. Sci. World J. 2014, 2014, 491791. [Google Scholar] [CrossRef] [Green Version]
- Pan, S.-Y.; Gao, M.; Kim, H.; Shah, K.J.; Pei, S.-L.; Chiang, P.-C. Advances and challenges in sustainable tourism toward a green economy. Sci. Total. Environ. 2018, 635, 452–469. [Google Scholar] [CrossRef]
- Scheepers, C.; Wendel-Vos, G.; Broeder, J.D.; Van Kempen, E.; Van Wesemael, P.; Schuit, A. Shifting from car to active transport: A systematic review of the effectiveness of interventions. Transp. Res. Part A Policy Pract. 2014, 70, 264–280. [Google Scholar] [CrossRef]
- Schneider, R.J. Theory of routine mode choice decisions: An operational framework to increase sustainable transportation. Transp. Policy 2013, 25, 128–137. [Google Scholar] [CrossRef]
- Firnkorn, M. Selling Mobility instead of Cars: New Business Strategies of Automakers and the Impact on Private Vehicle Holding. Strat. Dir. 2012, 28, 264–280. [Google Scholar] [CrossRef]
- Ma, Y.; Rong, K.; Mangalagiu, D.; Thornton, T.F.; Zhu, D. Co-evolution between urban sustainability and business ecosystem innovation: Evidence from the sharing mobility sector in Shanghai. J. Clean. Prod. 2018, 188, 942–953. [Google Scholar] [CrossRef]
- Gabrielli, S.; Forbes, P.; Jylhä, A.; Wells, S.; Sirén, M.; Hemminki, S.; Nurmi, P.; Maimone, R.; Masthoff, J.; Jacucci, G. Design challenges in motivating change for sustainable urban mobility. Comput. Hum. Behav. 2014, 41, 416–423. [Google Scholar] [CrossRef]


| DIMENSION/ASPECTS | Transport Mode | Factors | References |
|---|---|---|---|
| The type of trip | Everyone |
| [24,25,26] |
| The means of transport | Everyone |
| [27,28,29,30] |
| Environment | Bicycle Pedestrian |
| [31,32,33,34,35] |
| Economy | Private vehicle |
| [36] |
| Urban design/Built environment Neighborhood spatial patterns | Pedestrian Public transport Private vehicle |
| [37,38,39,40,41,42,43] |
| Facilities | Private vehicle Bicycle Pedestrian |
| [44,45,9,46,47,48,40] |
| Population structure | Private vehicle |
| [49,50,51,52,53,54] |
| Socio-psychological |
| [11,55] |
| 2009 | 2017 | |||
|---|---|---|---|---|
| Mode | Trips | % | % | |
| Public | Bus | 128,727 | 5.7% | |
| Train | 17,401 | 0.8% | ||
| Metro | 7616 | 0.3% | ||
| Cab | 6038 | 0.3% | ||
| Subtotal | 159,788 | 7.1% | 10% | |
| Private | Car | 1,214,051 | 53.4% | |
| Motorbike | 52,304 | 2.3% | ||
| Subtotal | 1,266,355 | 55.7% | 55% | |
| Healthy transportation | Bike | 30,149 | 1.3% | 2% |
| Pedestrian | 816,776 | 35.9% | 33% | |
| Subtotal | 846,925 | 37.2% | 35% | |
| Total | 2,278,436 | 100.0% | 100% |
| Pearson Chi-Square | df | Cramer’s V | |
|---|---|---|---|
| Gender (Categories: men/women) | 47,808.306 * | 7 | 0.145 * |
| Age groups (Categories: 14–29/30/44/45/64, +64) | 144,839.779 * | 21 | 0.146 * |
| Activity (Categories: working, retired, student, unemployed, domestic work, other) | 217,340.395 * | 35 | 0.139 * |
| Trip motivation (Categories: leisure, work, doctor, study, mixed, home) | 99,176.263 * | 35 | 0.100 * |
| Travel time (0–30/30–60/60–90/90–120 min) | 126,206.872 * | 28 | 0.118 * |
| County of origin (Categories: Badia Palma, Llevant, Nord, South, Raiguer, Pla, Tramuntana) | 81,004.755 * | 42 | 0.077 * |
| Distance to Palma | 87,084.148 * | 21 | 0.113 * |
| Coastal (coastal/non-coastal) | 31,424.402 * | 7 | 0.118 * |
| CAR | MOTORBIKE | |||
|---|---|---|---|---|
| B | Exp (B) | B | Exp (B) | |
| Man | 0.352 * | 1.422 | 1.560 * | 4.758 |
| 14–29 years | 0.848 * | 2.335 | 1.153 * | 3.167 |
| 30–44 years | 0.963 * | 2.620 | 1.223 * | 3.396 |
| 45–64 years | 0.600 * | 1.822 | 0.753 * | 2.123 |
| Working | 0.326 * | 1.386 | −0.517 * | 0.596 |
| Retired | −0.433 * | 0.649 | −0.926 * | 0.396 |
| Student | −1,182 * | 0.307 | −0.248 * | 0.780 |
| Unemployed | −0.215 * | 0.807 | −0.752 * | 0.471 |
| Other | −0.256 * | 0.774 | −0.138 * | 0.871 |
| Domestic work | −0.236 * | 0.790 | −1.878 * | 0.153 |
| Leisure | 0.893 * | 2.443 | 0.128 * | 1.137 |
| Work | 0.960 * | 2.611 | 0.329 * | 1.390 |
| Doctor | 0.934 * | 2.545 | −0.642 * | 0.526 |
| Study | 0.675 * | 1.964 | −0.419 * | 0.658 |
| Mixed activities | 0.841 * | 2.318 | −0.234 * | 0.791 |
| Home | 0.662 * | 1.939 | 0.051 * | 1.052 |
| Badia de Palma | 0.625 * | 1.869 | −1.260 * | 0.284 |
| Llevant | 0.829 * | 2.291 | −1.549 * | 0.212 |
| Nord | 0.778 * | 2.178 | −1.327 * | 0.265 |
| South | 0.910 * | 2.484 | −1.831 * | 0.160 |
| Raiguer | 0.086 * | 1.090 | −1.196 * | 0.302 |
| Pla | 0.206 * | 1.228 | −0.611 * | 0.543 |
| 0–30 min | 0.934 * | 2.546 | 0.677 * | 1.968 |
| 30–60 min | 0.626 * | 1.869 | −0.688 * | 0.502 |
| 60–90 min | 0.385 * | 1.470 | −0.244 * | 0.784 |
| 90–120 min | 0.184 * | 1.202 | −0.425 * | 0.654 |
| Non-coastal | 0.345 * | 1.413 | −1.044 * | 0.352 |
| Constant | −2.496 * | 0.082 | −3.742 * | 0.020 |
| BUS | TRAIN | METRO | ||||
|---|---|---|---|---|---|---|
| B | Exp (B) | B | Exp (B) | B | Exp (B) | |
| Man | −0.537 * | 0.585 | −0.284 * | 0.753 | 0.024 | 1.024 |
| 14–29 years | 0.076 * | 1.079 | 0.474 * | 1.606 | −0.956 * | 0.385 |
| 30–44 years | −0.207 * | 0.813 | 0.001 | 1.001 | −0.424 * | 0.654 |
| 45–64 years | 0.077 * | 1.080 | −0.004 | 0.996 | −0.209 | 0.811 |
| Working | −0.763 * | 0.466 | 15.959 | - | 1.778 | - |
| Retired | −0.287 * | 0.751 | 16.407 | - | 14.824 | - |
| Student | 0.318 * | 1.374 | 16.667 | - | 17.858 | - |
| Unemployed | −0.313 * | 0.731 | 16.079 | - | 14.311 | - |
| Other | −0.115 * | 0.892 | 14.462 | - | 11.13 | 3.044 |
| Domestic work | −0.523 * | 0.593 | 16.445 | - | 13.740 | - |
| Leisure | 0.302 * | 1.353 | 1.409 * | 4.093 | 0.449 * | 1.566 |
| Work | 0.826 * | 2.284 | 1.226 * | 3.408 | 1.544 * | 4.685 |
| Doctor | 1383 * | 3.988 | 1.088 * | 2.968 | −13.764 | 0.000 |
| Study | 0.816 * | 2.261 | 1.249 * | 3.486 | 1.879 * | 6.545 |
| Mixed activities | 0.101 * | 1.106 | 0.307 * | 1.359 | 0.906 * | 2.473 |
| Home | 0.327 * | 1.386 | 0.894 * | 2.446 | 0.871 * | 2.390 |
| Badia de Palma | −0.274 * | 0.760 | −1.060 * | 0.346 | −0.949 * | 0.387 |
| Llevant | −2.801 * | 0.061 | 1.809 * | 6.107 | −5.102 | 0.006 |
| Nord | −2.253 * | 0.105 | 0.693 * | 2.001 | −16.491 | 0.000 |
| South | −1.559 * | 0.210 | −1.752 * | 0.173 | −14.906 | 0.000 |
| Raiguer | −0.419 * | 0.658 | 3.653 * | 38.591 | −5.002 * | 0.007 |
| Pla | −0.236 * | 0.790 | 2.945 * | 19.009 | −3.623 * | 0.027 |
| 0–30 min | −2.122 * | 0.120 | 2.553 * | 12.849 | −4.534 * | 0.011 |
| 30–60 min | −1.750 * | 0.174 | −2.141 * | 0.117 | −2.652 * | 0.070 |
| 60–90 min | −1.867 * | 0.155 | −2.040 * | 0.130 | −0.741 * | 0.477 |
| 90–120 min | −0.479 * | 0.620 | −2.741 * | 0.064 | −11.630 | 0.000 |
| Non-coastal | −0.246 * | 0.782 | −1.216 * | 0.297 | 1.710 * | 5527 |
| Constant | −1.635 * | 0.195 | −21.013 | 0.000 | −20.732 | 0.000 |
| PEDESTRIAN | BIKE | |||
|---|---|---|---|---|
| B | Exp (B) | B | Exp (B) | |
| Man | −0.303 * | 0.738 | 0.606 * | 1.833 |
| 14–29 years | −0.903 * | 0.406 | 0.108 * | 1.114 |
| 30–44 years | −0.776 * | 0.460 | 0.041 | 1.041 |
| 45–64 years | −0.408 * | 0.665 | −0.103 * | 0.902 |
| Working | 0.167 * | 1.181 | 0.355 * | 1.426 |
| Retired | 0.879 * | 2.408 | −0.185 * | 0.831 |
| Student | 0.598 * | 1.818 | 0.229 * | 1.258 |
| Unemployed | 0.700 * | 2.013 | 0.041 | 1.042 |
| Other | 0.301 * | 1.351 | 0.496 * | 1.641 |
| Domestic work | 0.695 * | 2.004 | 0.197 * | 1.217 |
| Leisure | −1.113 * | 0.329 | 0.035 | 1.036 |
| Work | −1.234 * | 0.291 | −0.287 * | 0.750 |
| Doctor | −1.871 * | 0.154 | −2.097 * | 0.123 |
| Study | −1..034 * | 0.355 | −0.530 * | 0.588 |
| Mixed activities | −0.649 * | 0.523 | −0.625 * | 0.535 |
| Home | −0.668 * | 0.513 | −0.243 * | 0.784 |
| Badia de Palma | −0.546 * | 0.579 | −0.266 * | 0.766 |
| Llevant | −0.512 * | 0.600 | 0.468 * | 1.597 |
| Nord | −0.455 * | 0.634 | 0.566 * | 1.761 |
| South | −0.668 * | 0.513 | 1.082 * | 2.950 |
| Raiguer | 0.064 * | 1,066 | −1.394 * | 0.248 |
| Pla | −0.109 * | 0.897 | −0.537 * | 0.584 |
| 0–30 min | −0.843 * | 0.430 | −1.680 * | 0.186 |
| 30–60 min | −0.181 * | 0.834 | 0.090 * | 1.094 |
| 60–90 min | −0.058 * | 0.944 | 0.629 * | 1.876 |
| 90–120 min | 0.115 * | 1.122 | −0.629 * | 0.533 |
| Non-coastal | −0.349 * | 0.706 | 0.645 * | 1.906 |
| Constant | 0.921 * | 2.512 | −4.603 * | 0.010 |
| B | Exp (B) | |
|---|---|---|
| Man | −0.374 * | 0.688 |
| 14–29 years | −0.852 * | 0.427 |
| 30–44 years | −0.806 * | 0.447 |
| 45–64 years | −0.427 * | 0.653 |
| Working | −0.136 * | 0.873 |
| Retired | 0.650 * | 1.915 |
| Student | 0.635 * | 1.886 |
| Unemployed | 0.428 * | 1.534 |
| Other | 0.136 * | 1.146 |
| Domestic work | 0.404 * | 1.498 |
| Leisure | −0.978 * | 0.376 |
| Work | −0.936 * | 0.392 |
| Doctor | −1200 * | 0.301 |
| Study | −0.631 * | 0.532 |
| Mixed activities | −0.658 * | 0.518 |
| Home | −0.597 * | 0.550 |
| Badia de Palma | −0.609 * | 0.544 |
| Llevant | −0.699 * | 0.497 |
| Nord | −0.649 * | 0.522 |
| South | −0.781 * | 0.458 |
| Raiguer | 0.028 * | 1.028 |
| Pla | −0.106 * | 0.900 |
| 0–30 min | −1.066 * | 0.345 |
| 30–60 min | −0.569 * | 0.566 |
| 60–90 min | −0.380 * | 0.684 |
| 90–120 min | −0.209 * | 0.811 |
| Non-coastal | −0.388 * | 0.678 |
| Constant | 1.751 * | 5.763 |
| Mode | % Trips in the Same Municipality | |
|---|---|---|
| Public | Bus | 88.1% |
| Train | 0.6% | |
| Metro | 82.7% | |
| Cab | 82.0% | |
| Private | Car | 64.0% |
| Motorbike | 87.6% | |
| Healthy transportation | Bike | 92.8% |
| Pedestrian | 99.0% | |
| Total modes | 78.5% |
Publisher’s Note: MDPI stays neutral with regard to jurisdictional claims in published maps and institutional affiliations. |
© 2020 by the authors. Licensee MDPI, Basel, Switzerland. This article is an open access article distributed under the terms and conditions of the Creative Commons Attribution (CC BY) license (http://creativecommons.org/licenses/by/4.0/).
Share and Cite
Ruiz-Pérez, M.; Seguí-Pons, J.M. Transport Mode Choice for Residents in a Tourist Destination: The Long Road to Sustainability (the Case of Mallorca, Spain). Sustainability 2020, 12, 9480. https://0-doi-org.brum.beds.ac.uk/10.3390/su12229480
Ruiz-Pérez M, Seguí-Pons JM. Transport Mode Choice for Residents in a Tourist Destination: The Long Road to Sustainability (the Case of Mallorca, Spain). Sustainability. 2020; 12(22):9480. https://0-doi-org.brum.beds.ac.uk/10.3390/su12229480
Chicago/Turabian StyleRuiz-Pérez, Maurici, and Joana Maria Seguí-Pons. 2020. "Transport Mode Choice for Residents in a Tourist Destination: The Long Road to Sustainability (the Case of Mallorca, Spain)" Sustainability 12, no. 22: 9480. https://0-doi-org.brum.beds.ac.uk/10.3390/su12229480