Article

The Paradox of Informal Settlements Revealed in an ATLAS of Informality: Findings from Mapping Growth in the Most Common Yet Unmapped Forms of Urbanization

1
Program in Environmental Design, Faculty of Planning and Urban Design, University of Colorado, Boulder, CO 80309, USA
2
Community Engagement Design and Research Center, Researcher, University of Colorado, Boulder, CO 80309, USA
3
Program in Environmental Design, Undergraduate Research Assistant, University of Colorado, Boulder, CO 80309, USA
*
Author to whom correspondence should be addressed.
Sustainability 2020, 12(22), 9510; https://0-doi-org.brum.beds.ac.uk/10.3390/su12229510
Submission received: 30 July 2020 / Revised: 9 November 2020 / Accepted: 13 November 2020 / Published: 15 November 2020
(This article belongs to the Special Issue Forms of Informal Settlement: Upgrading, Morphology and Morphogenesis)

Abstract

:
Informal settlements are the most common form of urbanization on the planet, accounting for one-third of the total urban form. It is expected that by the mid twenty-first century, up to three billion people will live in informal urban environments. However, we lack a consistent mapping method to pinpoint where that informality is located or how it expands. This paper presents the findings from a collection of standardized measurements of 260 informal settlements across the world. The main research goal is to identify a standard global sample of informal neighborhoods. It then focuses on mapping urban growth with remote sensing and direct mapping tools. The third stage classifies settlements based on how adjacency features such as development, topography, or bodies of water relate to their growth. The survey of growth corroborates the idea of informality as expanding geography, although at different rates than previously cited in the literature. We found peri-urban location to be a suitable estimator of informal settlement growth. This finding validates the comparison of multiple settlements to understand rates of change of urban informality worldwide. The findings here are vital to resolve important questions about the role of informal urban development in the context of accelerated global population growth.

1. Introduction

Despite a reported decrease in the relative proportion of the population living in informal settlements between 2000 and 2014 (from 28 percent to 23 percent), “the absolute number of urban residents who live in slums continued to grow” [1,2]. Surprisingly, despite the scale of the phenomena of informality, we lack a comprehensive database that presents these cases globally. Scholars typically map informal urban development at two scales, the national and the neighborhood scale. At the national level, based on data collected by states or international agencies, these entities use domestic indexes to compare change across regions [3,4,5]. However, these valuable index focused studies have concentrated on regional or national measures creating little reliability at the city scale. The second group of studies focuses on single case studies at the neighborhood scale [6,7]. While these exercises present astonishing detail, the single case selection presents problems of generalization of findings. These two scales of measurement create blindness of informality at an urban scale and its relationship with global trends. Today, technological advances in mapping using remote sensing and scholarly work to develop tools to identify informal settlements unique morphology open the opportunity to breach that gap by accessing both the city and global scale simultaneously. The Atlas of Informality (AoI) is an attempt to broaden understanding of such overlooked phenomena by creating a dataset that directly maps informal settlements at the neighborhood scale over time. The primary goal of this research is, first, to create a database that breaches the data gap between measurements of informality at the national level and those single cases at the local scale for neighborhood comparison of informal settlements across geographies. The second is to critically answer, how do such geographies of informality expand globally?
This research uses an inclusive definition of informal settlement, incorporating into the global database all cases designated as informal settlements in any of its diverse interpretations to include the broad spectrum of informal settlement urban forms. A defining characteristic of informal settlements as an urban form is their constant state of change due to the piecemeal additive construction process. This persistent state of change complicates the study of these urban forms. However, it is necessary to study the variation of settlements’ change over time to further understand their urban processes. This research collects standardized measurements of 260 informal settlements to provide a tool to geolocate, at the neighborhood scale, each one of these places. It then focuses on the mapping of urban growth. For the mapping of informal settlements, the AoI uses a combination of remote sensing and direct mapping with readily available satellite photography. We use manual digitization from fifteen years of high-resolution satellite data to construct all cases for this project. The direct mapping measure is a more labor-intensive process as compared to automatic mapping methods but provides more accurate and standardized data because of human ability to recognize and interpret nuanced variations in form at a level technology cannot yet accomplish. It requires more human labor hours per element to develop as the mapping sample increases in size as opposed to automatic mapping methods that increase in efficiency as the sample size grows.
The survey of growth corroborates the idea of informality as expanding geography. The cases selected represent some of the most evident in the literature. In the AoI sample, all cases are older than twenty years, and a majority are much older than that. New settlements account for less than 5% of the sample. In the mapping of growth of informal areas, the expectation is that old cases will reach a point of consolidation and stop growing [8].
Our findings from measuring informal areas at the neighborhood scale contradict current data on informal settlements that show a deceleration in the rate of growth of such places. The United Nations in their recent Sustainable Development Goals Report states that “The proportion of the urban population living in slums worldwide declined by 20 percent between 2000 and 2014 (from 28 percent to 23 percent)” [2]. The discrepancies presented here are crucial to clarifying global measures of the scale and type of change occurring within informal settlements since these measures guide global urban policy. This paper is divided into the following sections; first, there is a discussion about the need for standardized measures of informality at the neighborhood scale with global sampling. A survey of the informal settlement definitions within the context of the literature follows. With the mapping of the current research, we offer a refined definition of informal settlement. We then focus on the methodological approach to measure samples across the world. Finally, we present the findings of the project, ending with the implications of such results in the context of global policy and scholarship.

2. Measuring Informal Settlements

Recurrent questions that emerge when studying informal settlements are: What is the dimension of the informal urban form phenomena? What quantity and proportion of the population live in such conditions? What interventions can be enacted? To answer such questions, methodologically, scholars [3,4,5,6,9,10] base their claims on the extent of informality and informal urban development at two scales. The first is at the national scale, based on the data collected by nations or international agencies—organizations such as the World Bank and UN-Habitat are stewards of such data—the other scale of research focuses on case studies at the city/neighborhood scale.
The national scale data are valuable to inform policy and to set strategic goals such as the Millennium Goals (MG) of the Sustainable Development Goals (SDGs). However, this data, as presented in the State of World Cities report by the UN-Habitat [11] or the World Development Indicators [12], are compiled with estimates and not actual measurements. Furthermore, such entities measure informal settlements and development using national indexes, which can be compared across regions since they focus on the national scale; however, this method lacks detail at the urban scale. To date, work that evaluates the global scale of urban informal settlements, or slums, as they are commonly known, [4,5] is based on such data. These national indexes are necessary to evaluate the evolution of informal settlements and overall development in regions. There are great examples of scholarly work using national indexes that concentrate on the role of informal settlements in the process of urbanization in Latin America [3]. They focus on these indexes to tell the story of the region. While these studies capture the spirit of their data, they still have little reliability at the city scale. The shortcomings of the data on which this group of research is based are the result of the complexity of mapping informal settlements. Most developing nations do not have the technical capacity, or the resources, to map informal areas in detail, and even when the capability exists, some governments regulations forbid or impede the mapping, recording, or sharing of public data of such populations [13,14,15]. Limitations on resources, or regulatory approaches in some cases, leave empty spaces where informal settlements exist on maps [16]. In this way, entire neighborhoods are kept invisible and outside of official documents sometimes in deliberate ways [17]. However, many other variables also contribute to concealing or revealing informal settlements, such as their relationship to topography and urban morphology [18]. Visibility, recognition, and classification of informal settlement are crucial for communities to access to secure tenure [19].
The second scale of research of informal settlements focuses on case studies at the neighborhood scale. Examples of best practices are citywide horizontal studies of multiple favelas in Rio de Janeiro, Brazil [6], Medellin, and Colombia [8], and the work of activist architects in Caracas on the history of informal urban form [7]. While these exercises present fabulous detail, the single case selection presents traditional problems of generalization of findings inherent with this case study methodology. Methods of measurement differ substantially from city to city. Even within cities, informal settlement definitions may vary, depending on the year the measurements were performed [20]. These two scales of measurement (nation and neighborhood) create blindness on the urban scale of the informal urban condition and of its relationship with global trends. We are missing a means to bridge the gap between these two efforts to better capture the elusive physical conditions of the global poor and to better identify population and landscape vulnerabilities. The AoI becomes a valuable tool to add dimension to our understanding of the change and development of informal settlements. However, first, before mapping, it is crucial to define an informal settlement clearly.

2.1. Towards an Inclusive Definition of Informal Settlements

Among the obstacles to comparative work on informal settlements is the epistemological complexity of defining what constitutes an informal settlement. Different organizations, national and municipal government agencies, and scholars disagree on which variables are determinant of an informal settlement [21]. Defining informal settlements is a complicated endeavor; the literature on informal settlements, both current and historic, spends a significant amount of time attempting to determine the limits between what is formal and informal [22,23,24,25,26]. Authors call attention to the need for more specificity in the way the phenomena of informal settlements are defined and classified [27]. International agencies find it challenging to assess indicators of informal settlements, as currently defined, and examples of such problems can be found in the Sustainable Development Goals [1,28]. No consistency of evaluative variables exists between different countries or cities [29]. At meta-level, informal settlements are the most common process of city-making. Some authors agree that “urban informality is hence conceived as a negotiation process through which spatial value is produced” [30]. However, characterization is still an elusive subject because the definition of informal settlements can have social, economic, or political implications. Each definition of informal settlements has its limitations. For the purpose of exposing the various forms of informal settlements globally, we argue that the more specific the definition is, the less we can know about the phenomena at a global scale. We take this stance with the understanding that the more open the description is, the higher level of variability is introduced into the sample, and thus less comparability can be found. Even at the city scale, we can find variations in determining what is considered informal. A previous study pointed out that “in Rio de Janeiro, what defines a favela changes over the years and depends on the state initiative at the time” [10]. In Medellin, areas marked as informal by city officials in the 70s are not recognized as such by the same city department in the next decade, even without any upgrading happening [10].
On a global scale, the definition problems start with the multitude of names used to label informal settlements; each country in the world has a different word to define what an informal settlement is. Nor do scholars agree on a precise definition of informal settlement. Some authors define informal settlements, for example, as the predominant characteristic of the urban form of African cities [31]. However, informal settlement as urban phenomena can exist in every continent. A non-contested defining feature is that a “slum” is a group of buildings and not a single one [32], and a mainly urban phenomenon even if rural areas have deficient housing conditions that could be labeled as informal.
The most common description of informal settlements portrays them as areas where there is a lack of basic infrastructure, poor housing, illegal dwelling, non-secure tenure, high urban density, lack of sanitation, poverty, and exclusion [33]. The United Nations defines “slums” with qualitative measures, such as the lack of durable housing [34]. Informal settlements in literature are traditionally presented as the other side of the coin from the formal. Therefore, they are defined by the lack of features present in the formal city. In this tension between the formal and the informal, the settlements can be established as places lacking access to those faculties of the formal city such as access to safe water, access to improved sanitation, durable structures, sufficient living area (overcrowding), and access to secure tenure [35]. We recognize these remain vague characterizations of the complexity that informal settlements embody. Yet, in studying the phenomena, we start from the current state of knowledge, in its many forms, and contribute new insights to refine our understanding of informal settlements.
Table 1 presents several variables applied as defining characteristics of informal settlements across multiple scholars and institutions [10,23,32,33,34,36,37,38,39,40,41,42,43,44]. The table presents intersections and contradictions within the multiple definitions of informal settlements. It reveals the challenges of choosing one definition over another. Depending on the agency, government, or scholar that is looking at the phenomenon, an informal settlement can be classified in many ways. Adding or subtracting variables would inevitably delete or add places. Scholars argue about the difficulties of creating generalizations of the informal settlements phenomenon because of the lack of data across continents. Taubenböck and Kraff argue that “a systematic approach to measuring morphological characteristics of slums in different cities across the world beyond test cases is still absent” [41]. For this study, which engages a global morphological approach to map informal settlements, the ultimate goal is to create a database that permits evaluation across multiple cases to build theory through cross case comparison.
The goal of the Atlas of Informality (AoI) is to create a globally representative database for informal settlements and a methodology from the sample categories that can be used across the globe. This research then seeks to use an inclusive definition of what an informal settlement is. The AoI database incorporates any case designated by a scholar, practitioner, publication, or community as an informal settlement in any of their multiple definitions and names. We selected this overarching way to determine what an informal settlement is and to provide a tool to incorporate the broad spectrum of informal settlements as an urban form globally in the effort to create a consistent and inclusive mapping.

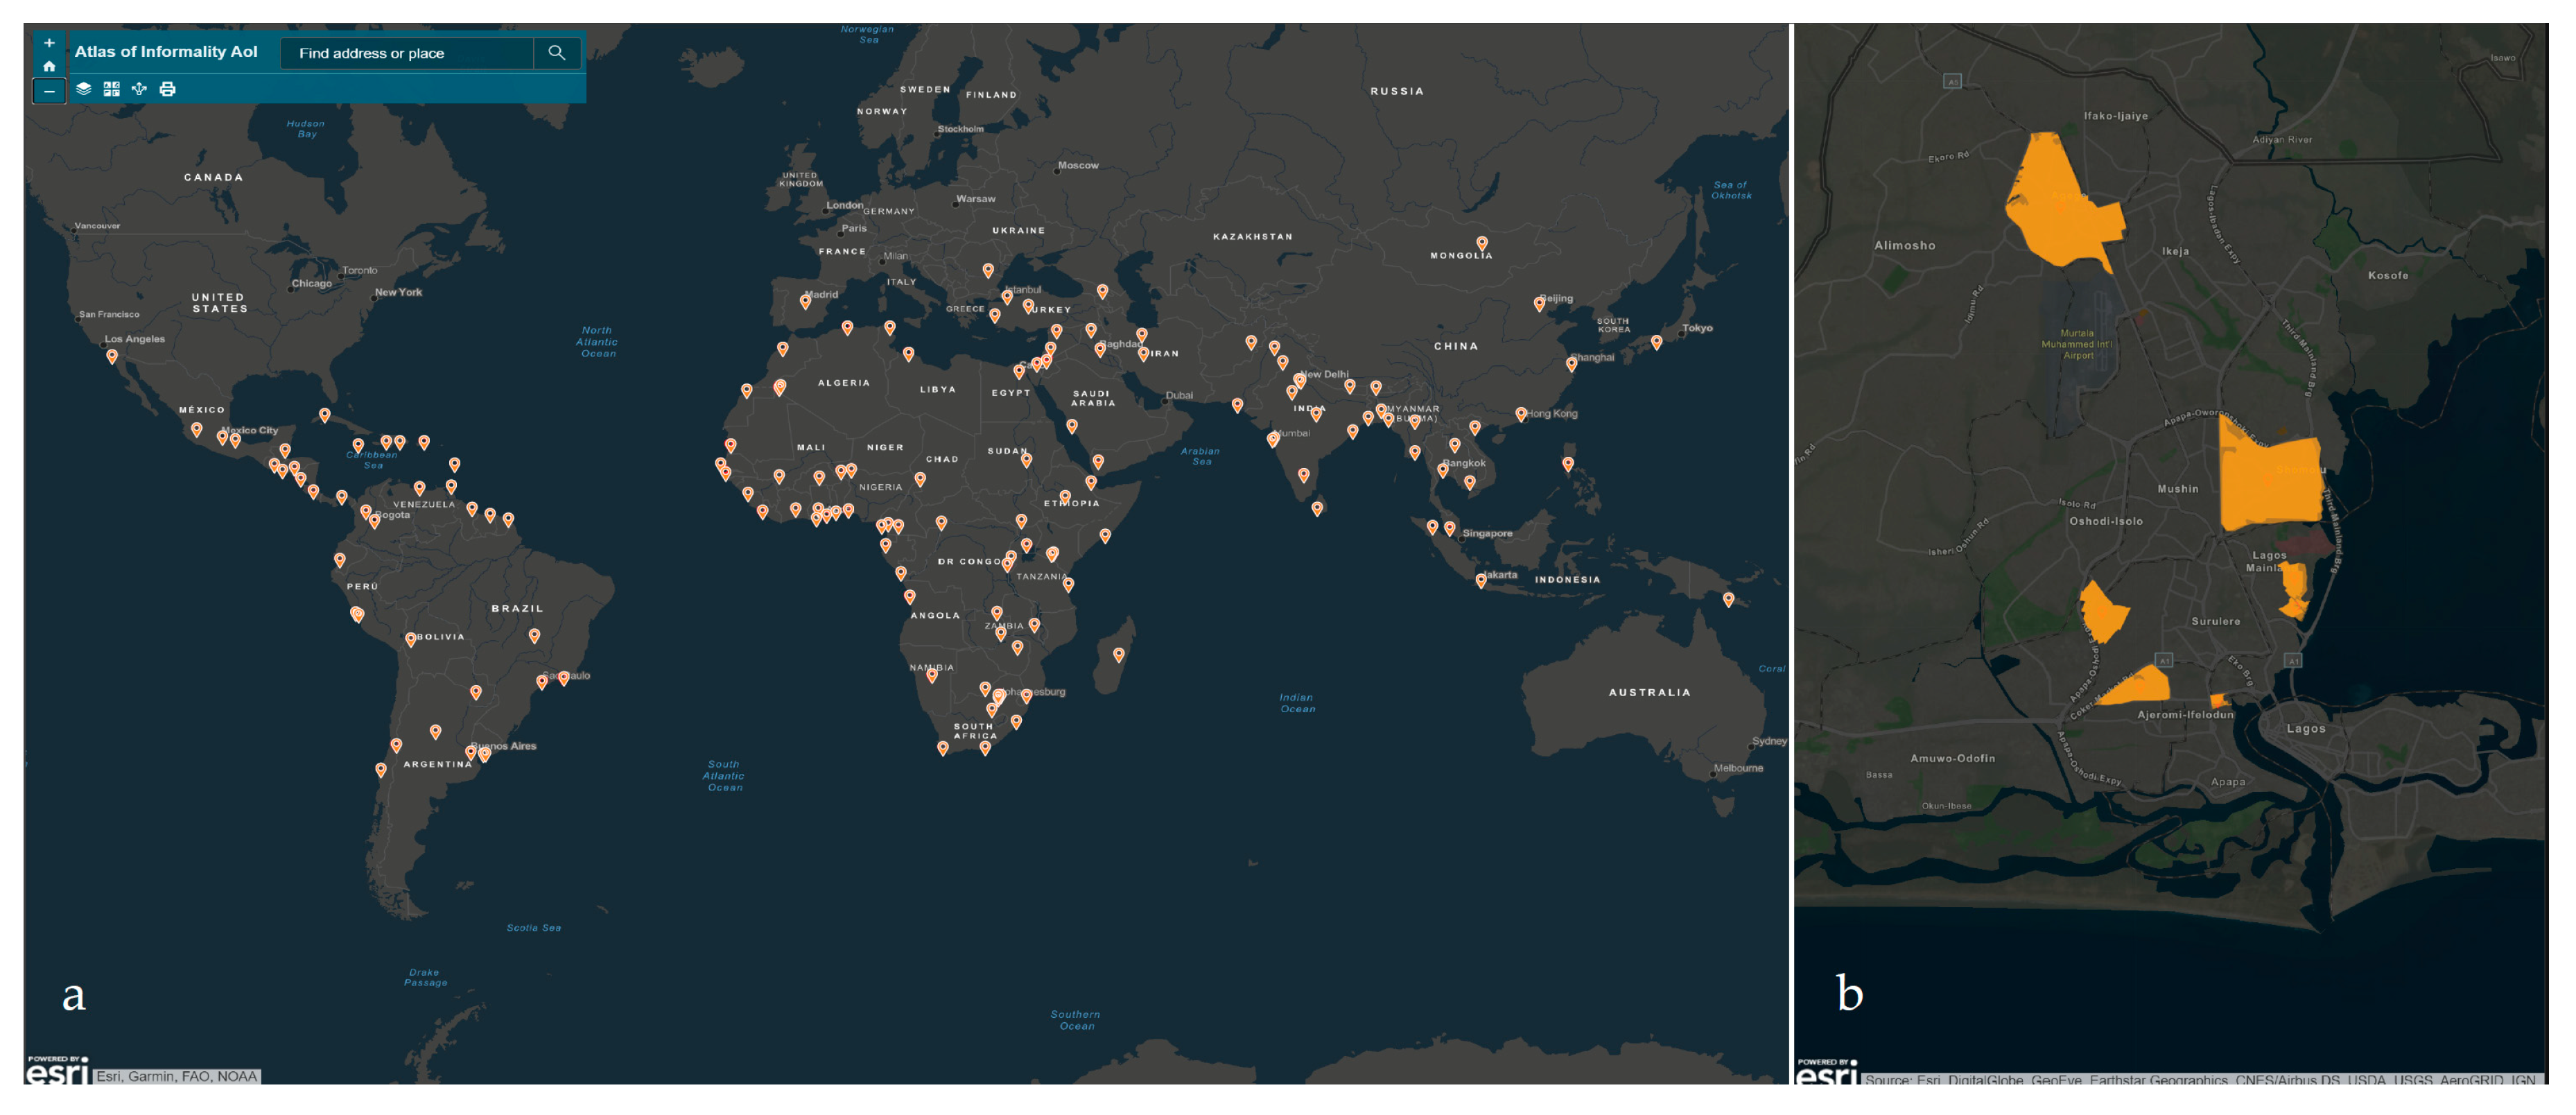
2.2. Mapping Informal Neighborhoods Globally

Despite initiatives to diminish the prominence of informal settlements as an urban reality [45], on a global scale, it is estimated that the number of informal settlements continues to grow. According to the United Nations Economic and Social Council’s evaluation of the progress of the Sustainable Development Goals (SDGs), “despite some gains, the absolute number of urban residents who live in slums continued to grow, owing in part to accelerating urbanization, population growth, and lack of appropriate land and housing policies” [1]. While percentages have diminished over the last 14 years by approximately 9% [45], the total number of world slum dwellers has increased by 11.11% in the same period, some estimating the increase as high as 28% [46]. The World Bank assessment shows a dramatic reduction in slums per region over recent decades, from 35% in 1990 to 20% in 2014 in Latin America and the Caribbean; from 67 to 55% in South Saharan Africa; from 57 to 31% in South Asia; and 47 to 26% in East Asia and the Pacific in the same period; and from 39 to 28% in the Middle East and North Africa in 1990–2005 [47]. However, this macro-level analysis seems to hide within the definition of “slum” the real percentage of change of such spaces.
Existing data about informal settlements are not available, accurate, or complete and, in most cases, obsolete [48]. The mapping of cadastral areas in informal settlements is crucial for the transformation of these areas [49]. Imprecise data about the scale of informal settlements hinder agencies, city officials, and scholars’ efforts to inform appropriate policies about the phenomena of informality. The UN-Habitat highlights a lack of data at the sub-city level [50] as one of the challenges in dealing with urban poverty globally. The question then is: what is the best way to solve this vacuum of information? The AoI response to this problem lies in the intersection of these methods. The main goal is to systematically collect data at the same resolution level and over the same period, to apply when possible remote sensing tools but using manual input so it can bypass today’s technological bottleneck.
The mapping of informal settlements can be divided into five methodologies: community mapping, single case selection, national indexes, remote sensing, and urban morphologies. Each one of these methods has its virtues and challenges. Community mapping is born out of the vacuum of information and the need for communities to create data to make the needs of their neighborhoods visible. Since state agencies fail to map or abstain from mapping informal settlements’ living conditions, among the most effective systems to gather reliable data is self-mapping by communities [51,52,53]. This self-mapping produces a precise level of detail of living conditions. Along with the mapping data, the community benefits from the empowerment that emanates out of community self-identification. However, this happens haphazardly in a neighborhood or, in a few cases, a citywide scale, without consistency across communities. The generalization of community mapping is limited since most maps reflect local needs. The isolation of communities also contributes to the accessibility of the information for groups or individuals not related to these mapping exercises. Another methodology of mapping is single case selection; these are the mappings by scholars, NGOs, and municipalities that focus on the neighborhood or city as a case [10,54,55]. Here, the output is more detailed, as new aerial photography and remote sensing data make the creation of highly detailed maps of neighborhoods possible. Unique case mapping allows bypassing state regulations since non-state agencies can perform them. A disadvantage that this project exposes is the challenge of generalizability of the single cases. National indexes lend themselves to generalization; these mappings draw on the capacity of nations to collect demographic data based on variables of census tracts that then get compared at a global scale. The data collected at this scale are the data of the international agencies such as the World Bank, United Nations/UN-Habitat, and the International Development Bank. However, the broad nature of national indexes is characterized by low-resolution data at the urban scale. National indexes data such as census undergo a filtering process to protect individuals and populations, and these data separate the information from the geographic location of communities to levels that make it difficult to relate this information to informal settlements at the neighborhood scale. However, most of the scholarly understanding of the informal world at a global scale comes out of this type of data [4,5]. Remote sensing (RS) technologies bridge the gap between comparability and the level of detail necessary to create global analyses [41,48]. The use of high-resolution satellite data permits researchers to visit multiple sites and apply variables to analyze the qualities of urban form [56,57,58,59]. The use of algorithms applied to this data, such as object-oriented, radial casting, and contour model (snakes), permits extraction and recognition of unique features of the landscape [48,57,58,59,60,61]. These mapping projects use these algorithms alongside remote sensing imagery to collect, identify, and map informal settlements. GIS literature in remote sensing focuses on how to train algorithms to determine the location of informal settlements [62,63]. The RS method helps identify any unknown settlements, particularly when there is not sufficient information about the locations of these settlements. However, old consolidated settlements or settlements with regular urban patterns are difficult to pinpoint with such an approach. RS mapping is perhaps the most promising upcoming technology. Today, there is an emergence of RS-based studies focused on exploring the morphological features of informal settlements to identify informal settlements, much development has occurred in the automatic classification of locations from optical resources [60,63,64,65], and other methods such as the use of radar have also shown promise and success [66,67]. RS automated methods have also demonstrated validity in the feature detection in landscape archaeology [68,69] and detection of anthropogenic geomorphology [70]. And the use to identify environmental risk in traditional unmapped areas such as in archeology [71,72]. Spatial-contextual information can also be incorporated through Object Based Image Analysis (OBIA), which is also currently the most common strategy for the classification of informal settlement areas [63,73]. The use of Very High Resolution (VHR) with the help of the Level Co-occurrence Matrix (GLCM) has permitted the extraction of informal settlement areas [74]. However, this method still has limitations. So, new capabilities have helped automatize the classification from machine-learning (ML) [75,76] to computer vision using convolutional neural networks (CNNs); this approach has demonstrated higher accuracy for detecting informal settlements from VHR images [77]. Local directional pattern (LDP) has also provided advances over the traditional gray level co-occurrence matrix (GLCM) [78]; a challenge in VHR arises in the limitation of up-to-date thematic maps of informal areas for which the use of Unmanned Aerial Vehicles (UAVs) has served as a tool to breach the time gap but increase the work at the ground level [79]. After all advances in RS automatization, manual delineation still offers advantages over automatic classification achieving an overall accuracy of 80.5% when compared to manual delineation [80]. At the rate of growth of the quality of imagery available and the perfecting of RS methodologies in the future, mapping of any urban form would be a wholly automatic endeavor. However, even as this promise exists, at present, there is still no global mapping of informal settlements or a systematic inventory of its morphologic types across the globe [81]. Finally, Urban Morphology (UM)—the morphology of the built environment, in particular that of the informal settlements, shares unique characteristic patterns across settlements: scale, size, shape, and distribution [82]. Texture measures can be potentially used to represent the contrast between planned and unplanned settlements [83]. Analyzing the urban environment’s physical features such as green space, structure of layout, density of built-up areas, and size of buildings can help to identify heterogeneity in urban areas that helps in the determination of sub-standard residential areas (informal settlements) [84]. The self-built process in which informal settlements are created tends to follow particular morphological processes [85], which can be analyzed using methods such as space syntax [86]. Interest in the urban form of informal settlements developed in an emerging body of knowledge on the morphologies and morphogenesis of informal settlements [8,82,87,88,89,90]. An emerging body of work focuses on exploring the change in the morphology of informal settlements [39,55,85]. Variation over time in the extent of informal areas presents challenges for planning and city management [91]. A second effort of the AoI database is to investigate the variable of time—in particular, how the land surface occupied by informal settlements varies with time. If one of the defining features of informality is their ever-changing nature, what does that change represent on a global scale? Focusing on areas instead of population percentage estimations can provide a more empirical approach to understanding the changing rates of informal settlements globally. It can also direct the establishment of guidelines for urban policy and adaptive capacity.

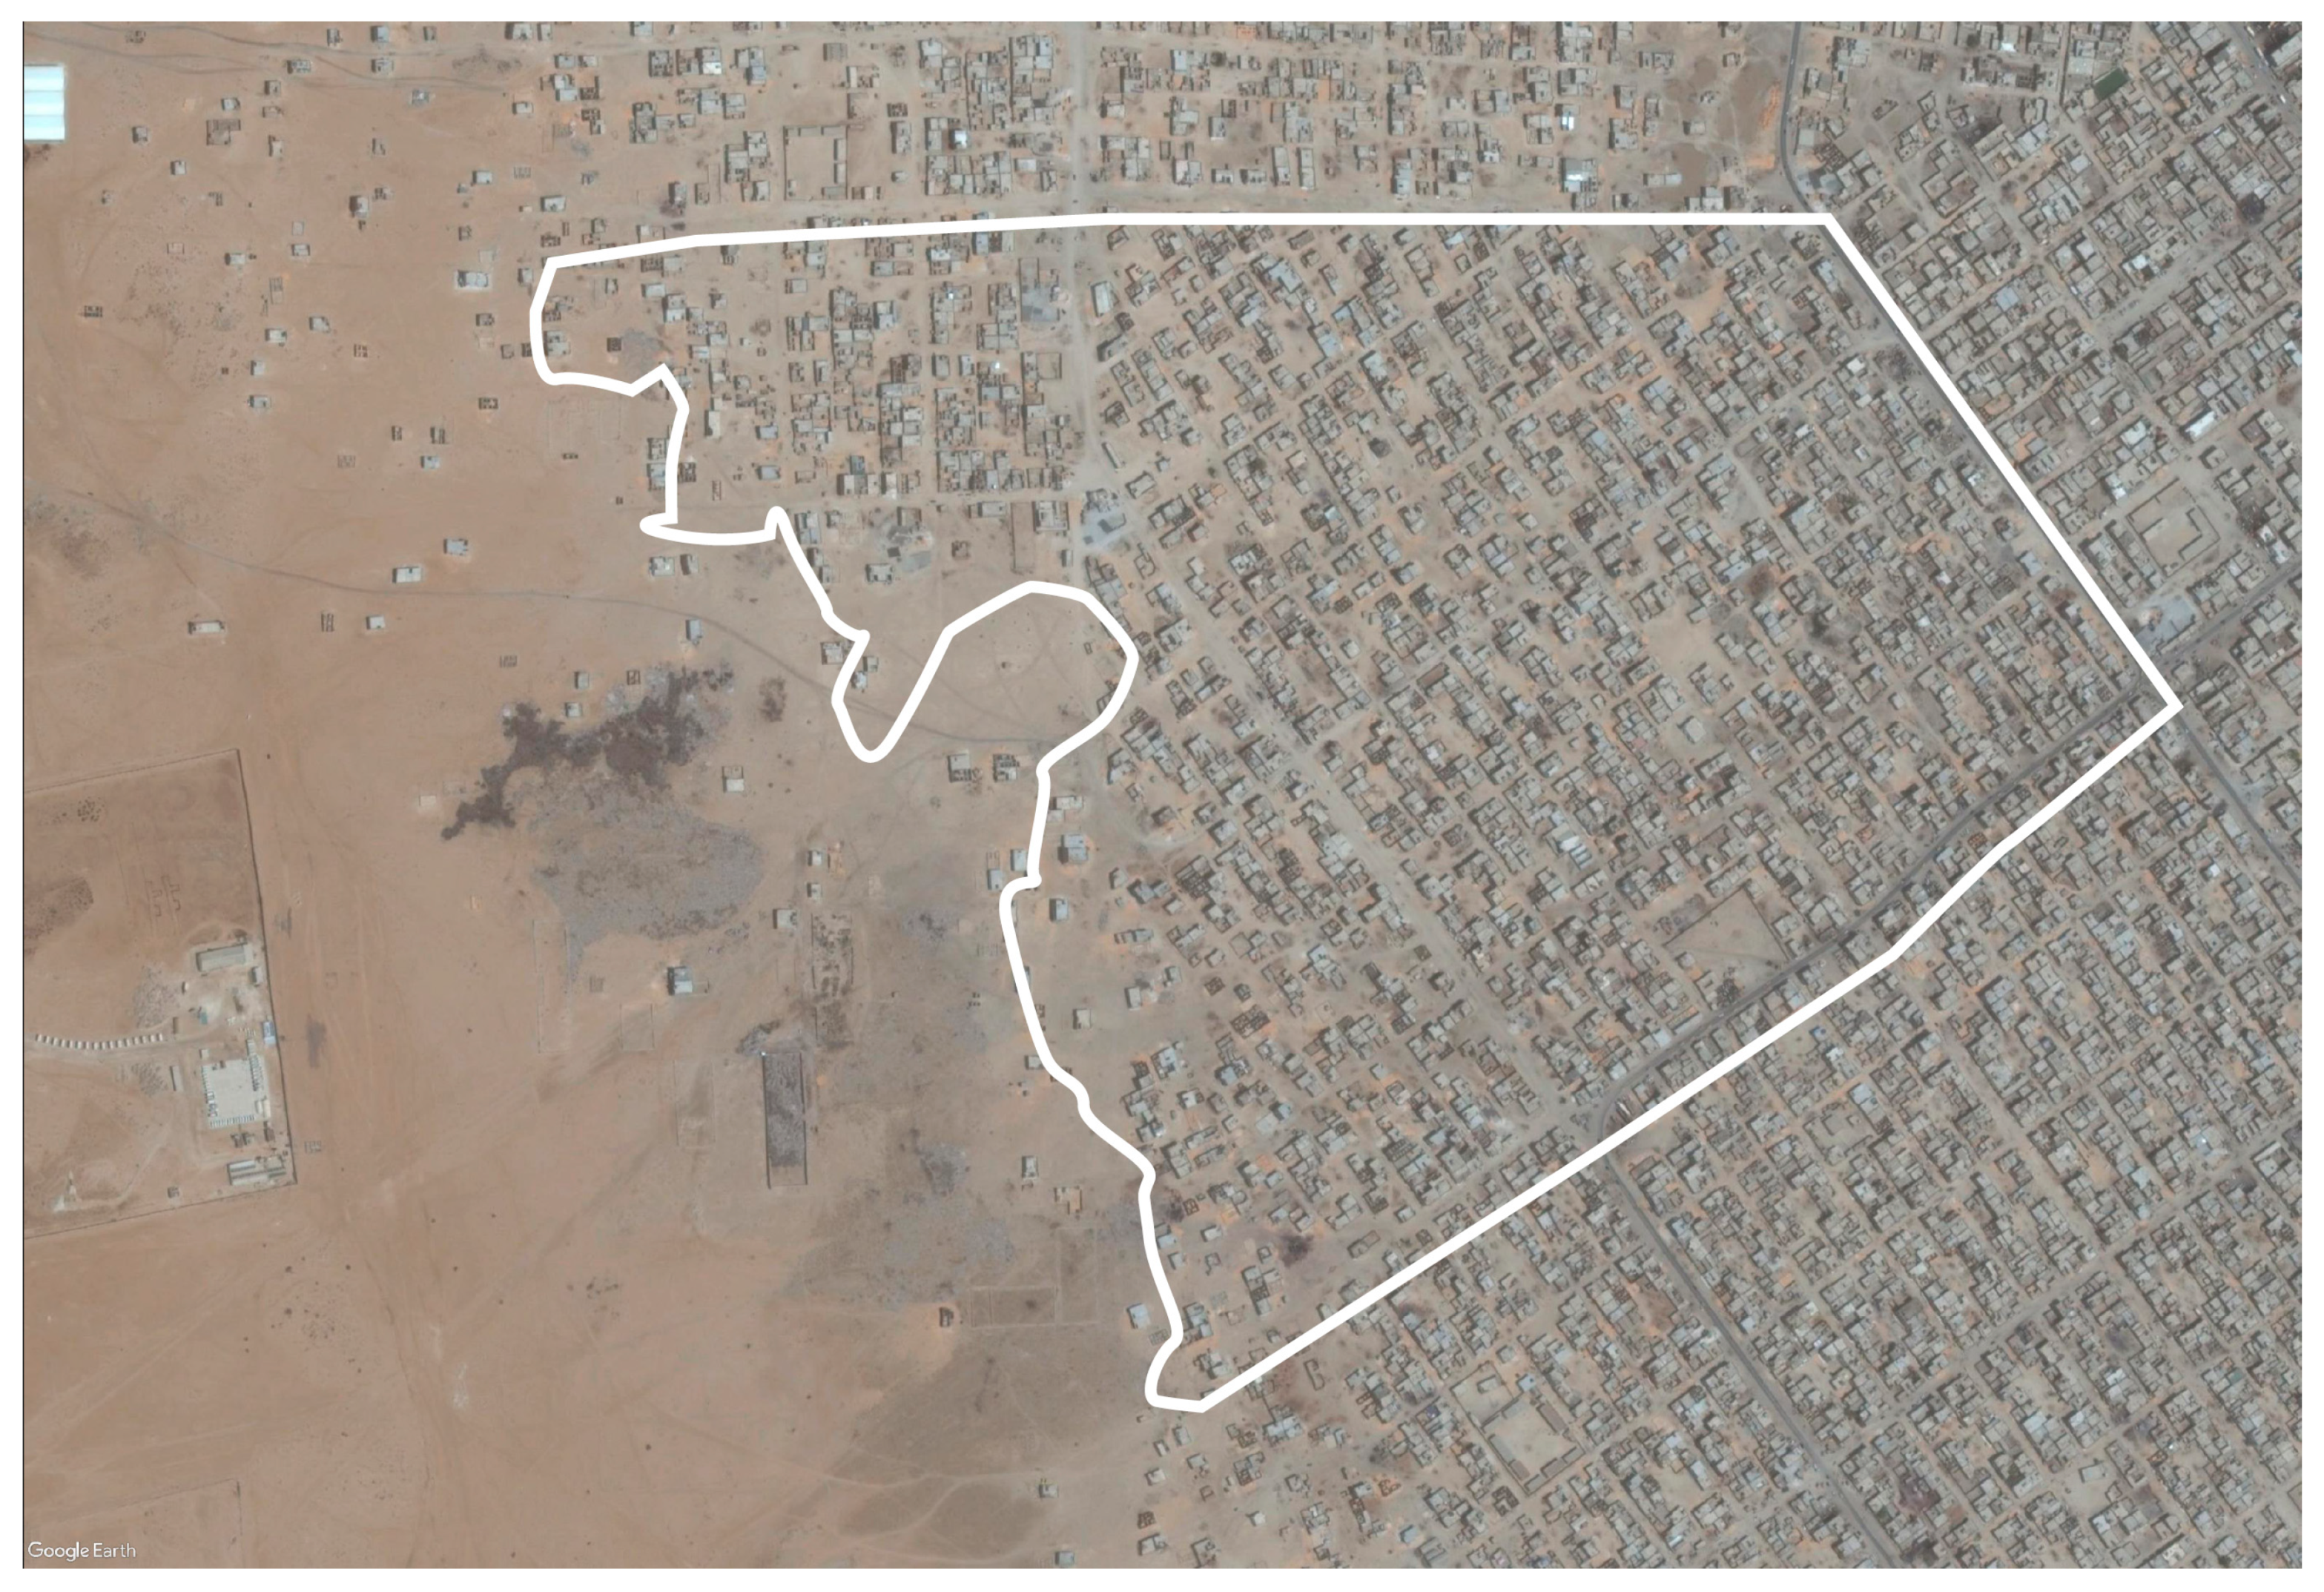
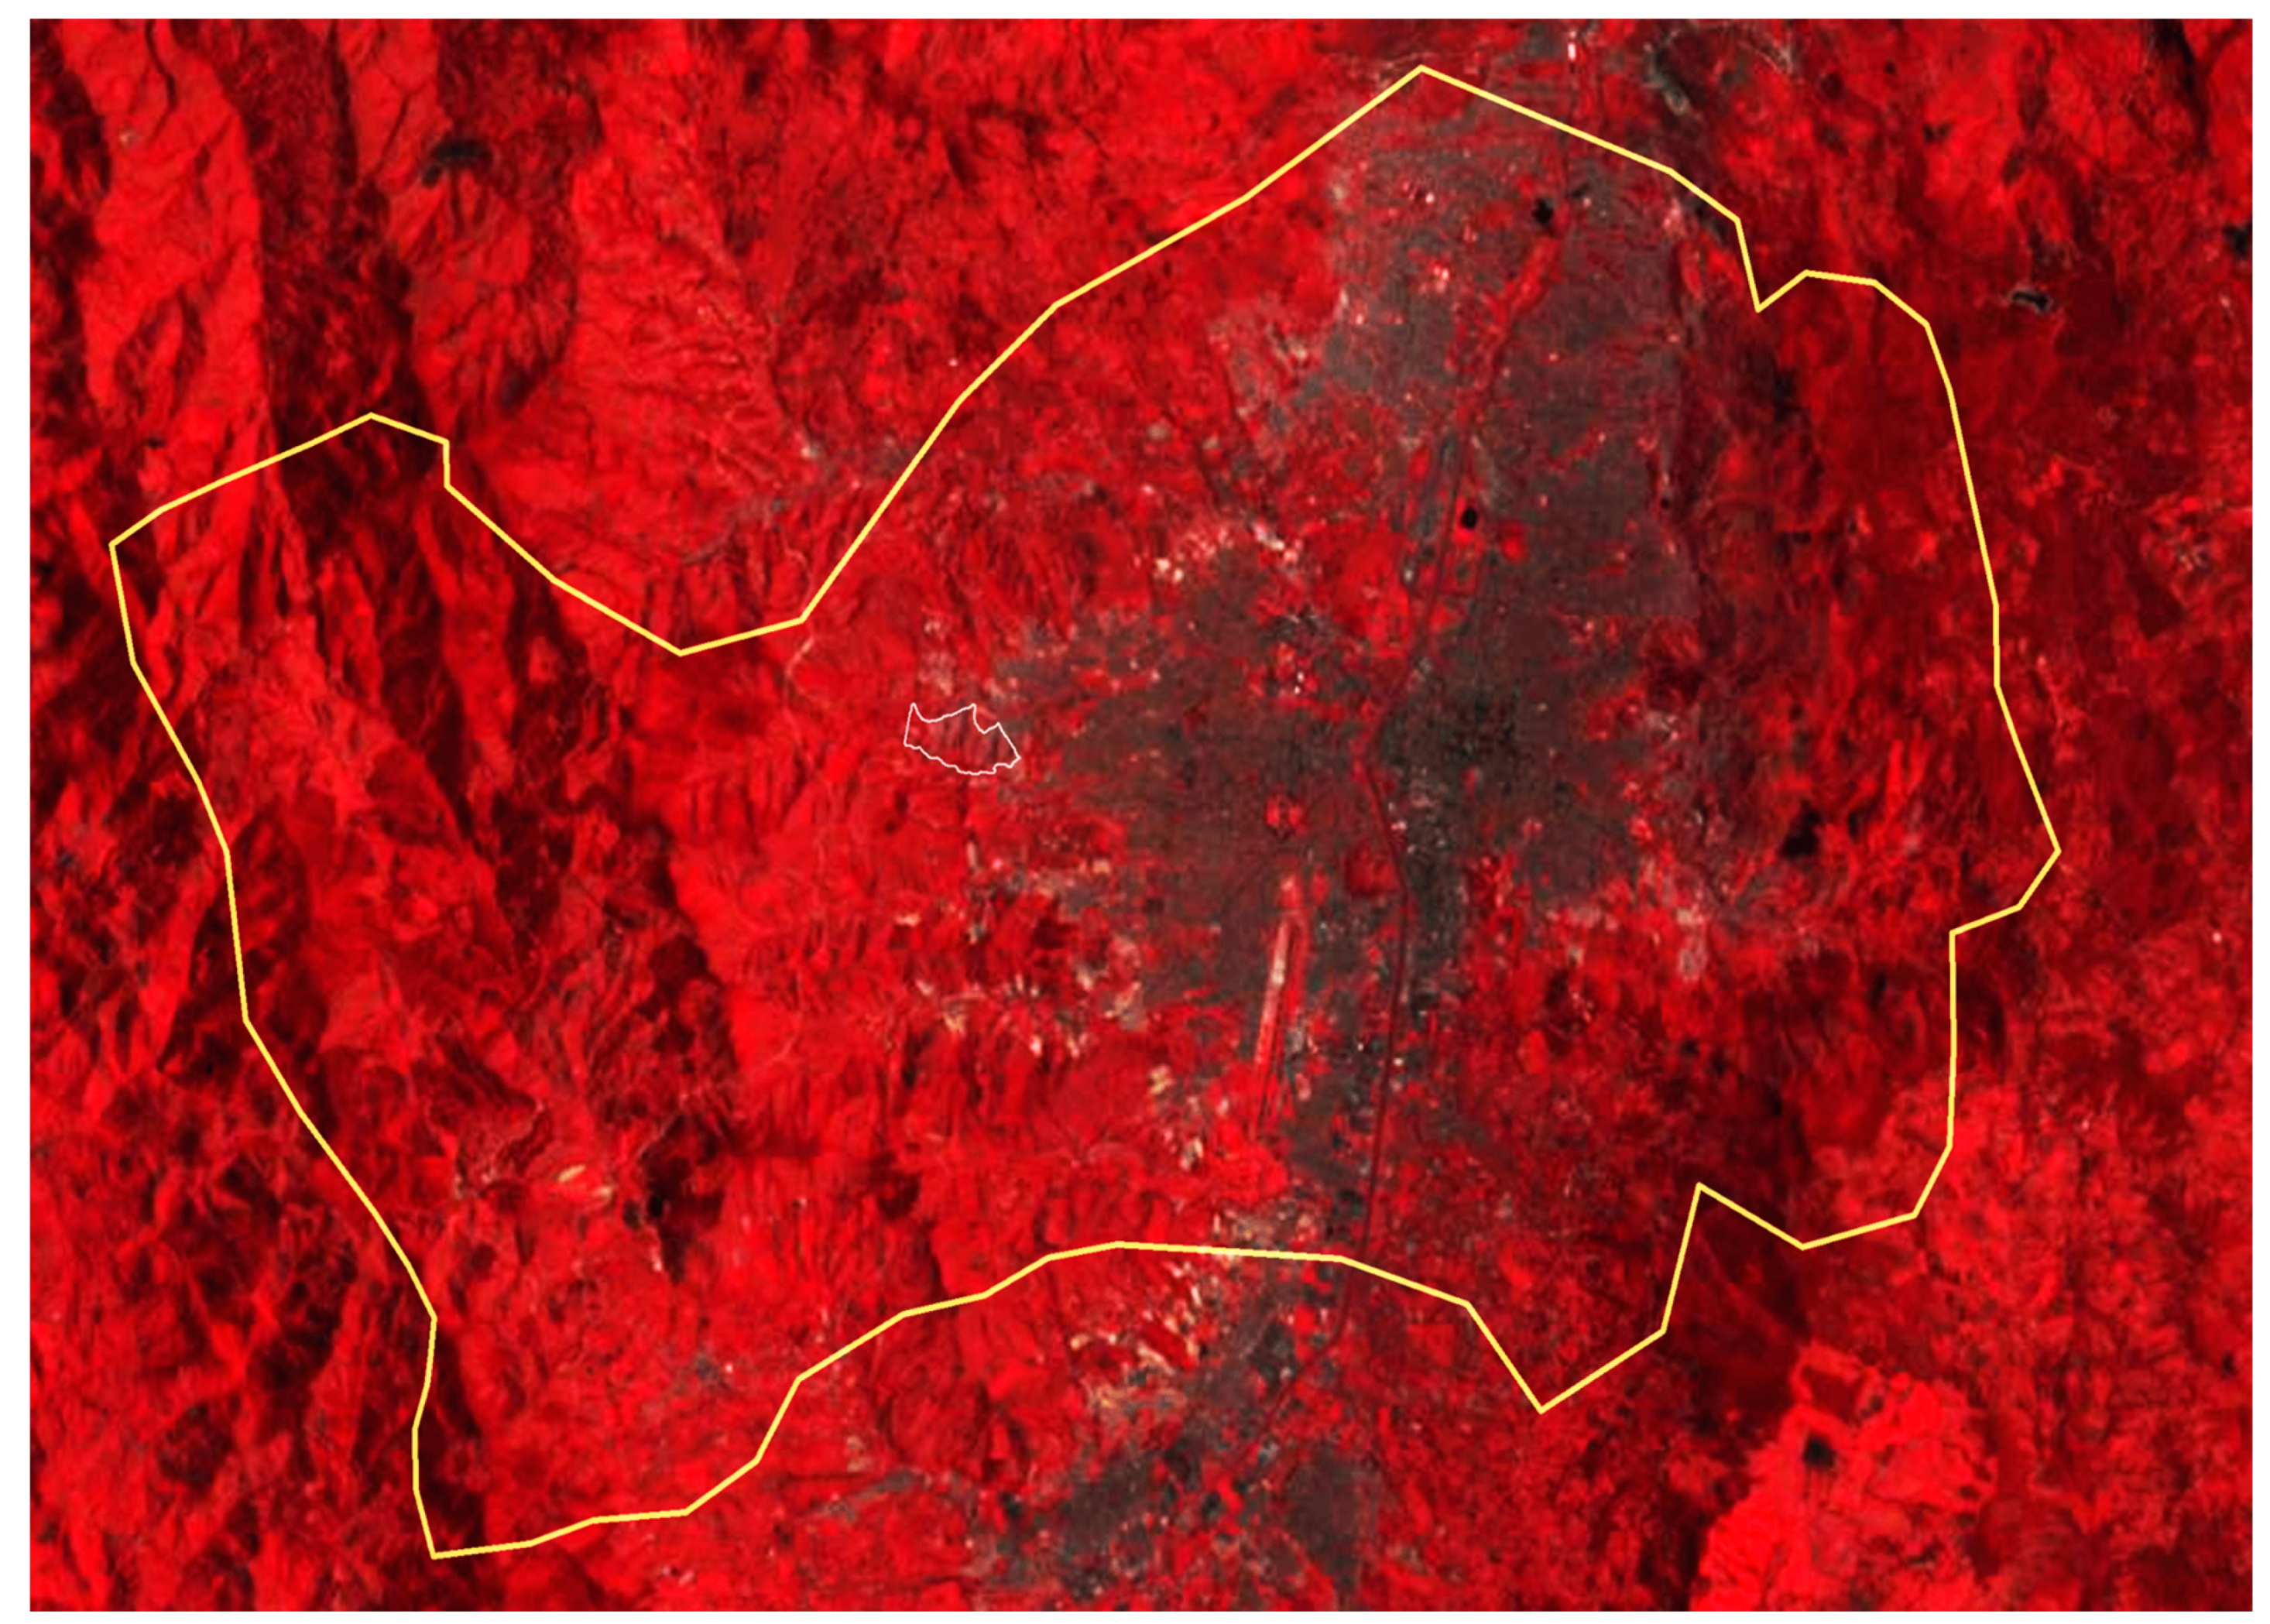
2.3. A Methodological Approach to Map and Measuring Informal Settlements

Mapping informal settlements is a complicated endeavor, new tools have provided ways to do so. However, there is still some level of imprecision that stems from the non-uniform nature of informality globally [81]. How can the nature of growth be captured in these places, and how can the data be collected from such different environments? Currently, digital mapping and new sensing technology have created new opportunities to map informal settlements using remote tools while reducing the gap of traditional studies, allowing mapping of cities and particular urban forms of informal settlements using the same methodology that opens the opportunity for comparability [41,63]. However, new sensing technology is limited in its capacity to differentiate informal settlements from formal city spaces. For this project, we took a different approach: we developed an inclusive definition of informal settlements then selected a few significant cases per city/country as examples of informality in that place. By inclusive definition of informality, we mean that we chose a process that permits capturing an informal neighborhood in any of its definitions. In this research, we first included neighborhoods already designated as an informal settlement by a state, city, community, or scholar; we looked for geographic locations and also for mapped areas with defined settlement boundaries; in addition, we used morphological features of those places such as homogeneous scale and texture of constructions to further determine settlement boundaries. Although imperfect, we chose this method because it permitted us to capture the various ways in which the phenomenon of informality is presented around the world.
For the mapping process, we followed a five-step approach: (1) crowdsourcing of cases, followed by (2) the creation of a mapping protocol, distributed across a similar number of undergraduate environmental design students—one case per student for (3) the application of the mapping protocol with direct mapping. (4) A curation of data followed that included a peer-review process examining completeness and validating the correctness of measurement for each case. This ensured each case complied with the standard of the Atlas. Finally, (5) data compiled with the mapping using Google Earth Pro (GEP) was transferred to Arc-GIS for analysis.
Crowdsourcing of cases: Informal settlements are neighborhoods; we chose this as the unit of analysis. The project endeavored to capture the phenomenon in its various global forms. We aspired to capture a balanced number of cases per city and country, aiming to reach most countries where informal settlements are present. For the initial selection of cases to the AoI, a crowdsourcing process was used to obtain the first set of examples. The idea was to start with the most known cases, those included in the informal settlement literature, those known as the exemplary cases in each city, and those that scholars have already identified through each one of the multiple definitions of informal settlements. We invited scholars of informal settlements to collaborate on the creation of the first list. Additionally, a literature review and web search produced a total of 405 cases. The main objective of the informal settlement selection was to cover most of the world’s countries and cities using one or a few representative cases per city.
To find and corroborate the classification of settlements as informal, a Google Scholar search was performed using keywords such as the name of country or city and the words slum and informal settlement, and any local term used to identify an informal settlement in that geographic area, such as Tugurios, Favelas, Bidonvilles, Chabolas, Pueblos Nuevos, Coreas, Barracas, Kampung, Morros, Ashwa’iyya, Squatters, or Shanty Towns. As the sample grew, priority was given to places (nation/cities) not already covered in the selection. For vacuums in the literature, we used a Google search engine entering the same keywords in popular media (local and national news organizations), state reports (local and national), and organization reports (such UN-Habitat, World Bank, IDB). We intentionally avoided over-representation of places with robust informal settlement mapping already in place. For example, there is vast information about informal settlements in Latin America; Rio de Janeiro in Brazil has ample GIS shapefiles that map the boundaries of each one of its 1040 favelas [20].
Complete and accurate mapping of informal settlements is difficult since these special urban forms are constantly changing. As a result, finding comprehensively mapped places is uncommon. However, there are several cases that demonstrate that it is possible. Samper’s historical research of informality in Medellin presents a compilation of maps identifying informal settlements created by the Departamento Administrativo de Planeación (planning department) of the city of Medellin from 1957 to 2014 [10]. The Instituto Municipal de Urbanismo Pereira Passos (IPP) In Rio de Janeiro, Brazil, maintains a database with mappings from 1999 to the present that includes favela limits, updated regularly by the Sistema de Informações Urbanas (SIURB) of the mayor office (Prefeitura da Cidade do Rio de Janeiro) free to access online [92] The city of Bogota maintains a record of asentamientos humanos (Informal Settlements) accessible at the open access data page of the Colombian Government [93] and updated as part of their city master plan (Plan de Ordenamiento Territorial POT). The organization Techo has a database of open access of Asentamientos (Informal Settlements) for countries such as Chile, Argentina, Colombia, and Paraguay. However, for this research, the goal was to create an equal distribution across the world, to the extent possible with the existing tools and resources.
The Mapping Protocol: The protocol contains a detailed set of instructions on how to find the assigned settlement, determine boundaries, map the current settlement boundary, review historical aerial images, and redraw the settlement boundary, recording dates of change observed. Beginning with the location identified through search and corroboration processes previously described, locations were loaded into GEP for close examination of urban form using the satellite imagery. Specifically, we examined the density of structures as compared to other parts of the city, the regularity, or irregularity of the division of space (grid vs. curvilinear, buildings seemingly overlaid vs. those with distinct edges), and materiality (appearance of concrete, steel, glass, and wood vs. piecemeal materials with less sturdy appearance). The protocol also includes guidance on how to use the GEP software and InDesign layout to record sources and additional information. In addition, protocol included modeling of sample areas in SketchUp software of each settlement for area density comparison; however, that part of the data is not included in this paper. Students were instructed on the use of the software and advised on ways to find more resources to determine the extension and location of the settlement (for a sample of mapping protocol see Supplemental Material). Since data sources varied, this entailed one of the most time-consuming parts of the research. Several scholarly papers refer to informal areas in cities; however, they give little guidance on the location of those areas of research in the cities.
Direct Mapping: For the actual mapping, a combination of remote sensing in the form of satellite historical images and direct mapping was selected as the most viable mapping method. Using readily available satellite photography provided a standard base for each entry. Google Earth Pro (GEP) provided a widely accessible data set that could be used across cases and did not require the purchase of mapping software. An ongoing goal of the project is to continue additional mapping to reach other stakeholders to map additional settlements. Using direct mapping allows us to define clear limits based on the nuanced variations in urban form and triangulate information from different sources that cannot automatically be captured by a learning algorithm. For example, this method allows identification of temporary structures that do not represent the expansion of the settlement, differentiation between city boundaries and settlement encroachments, and inclusion of areas that have unique morphological urban development patterns that are not similar to those in informal settlements in other regions, such as the case of informal areas in Mongolia, whose units of circular shapes differ substantially from settlements in places such as India. Computer vision can be effective at identifying different urban forms, and it is advantageous to distinguish formal from non-formal settlements. However, it is more difficult for that software to determine differences between similar urban forms, such as the limits between two adjacent non-mapped informal settlements. To make determinations on these ambiguities, humans tend to be more proficient; they can interpolate non-geographical resources (such as reference to an academic paper or a media publication) to make such determinations. The limits of a neighborhood are not only based on the unique morphological features but also on their history and its members’ demarcations. For example, in Colombia, the informal settlement of Independencia in on the city map as a single place; however, it is comprised of three different neighborhoods for its residents, each one with a unique history and particular local governance structure. This social difference has determined a different morphological evolutionary process for each area [10]. This project used the two sources of the morphological identification applying RS and the secondary academic and media sources to shed light on those features not readily identifiable by following only the morphology. The academic and media sources permit the identification of geolocation of settlements, and in some cases the estimated boundary of the settlements. The morphological exploration looks at homogenous urban typologies of settlement build texture to determine a more accurate measure of limits [83] This morphological exploration serves to create a baseline measurement to explore changes over time. We acknowledge that with more technological tools, staff, and budgetary resources, all these issues could be automated; however, at this stage of the research, we do not have those resources. For this project, we used manual digitization from high-resolution satellite images, a data methodology used by other mapping projects [94,95] to compensate for the lack of precision found in other remote sensing tools [63].
The first step of the protocol was to find the settlement and determine its boundaries (Figure 1). Determining the limits of an informal settlement is not a precise endeavor [96,97]. However, informal settlements present significant morphological differences, contrasting formal areas that surround them [34,55]. For this project, we determined that in addition to knowing locations, to distinguish the boundaries of an informal settlement we would use those physical characteristics of continued urban patterns, unregulated housing distribution, high density, and small (substandard) building sizes. This analysis of spatial patterns using space syntax tools has been used to identify Favelas in Rio de Janeiro [98]. The direct measure is a more labor-intensive process; however, it provides a more accurate and standardized way to collect the required information. Other forms to determine the limits are municipal maps, scholarly articles, and web maps. The key was to find the boundary of the settlement at the time of mapping. At this stage, the selected researcher would find the exact location and perimeter of the settlement using GEP and would geolocate the site by drawing its current boundary, collecting a 4k resolution aerial image of the site as a reference. After identifying and mapping change for each settlement, we coded surrounding physical features for each entry on the sample to understand how the physical context influences how settlements expand. We codified physical characteristics that could affect or impede settlement expansion based on the three physical variables: surrounding development, topography, and water features. For surrounding development, we evaluated if the urban form permitted the settlement to expand; for this, we classified each settlement as open or closed depending on how the settlement perimeter abutted open land or developed areas. We used the same procedure for water features, visually verifying using the GEO databases for features that represented water limits such as oceans, lakes, or rivers. For topography, we used the GEP database and the World Topographic Map which compiles data from U.S. Geological Survey (USGS), U.S. Environmental Protection Agency (EPA), U.S. National Park Service (NPS), Food and Agriculture Organization of the United Nations (FAO), Department of Natural Resources Canada (NRCAN), HERE, and Esri. Data for select areas were sourced from OpenStreetMap contributors. The map provides coverage for the world down to a scale of ~1:72k. Coverage is provided down to ~1:4k for the following areas: Africa, Australia, and New Zealand; Europe and Russia; India; most of the Middle East; Pacific Island nations; Alaska; Canada; Mexico; South America and Central America. Coverage is available down to ~1:2 and ~1:1k in select urban areas. Settlements located in, or adjacent to, areas with more than 30% slope were classified as having topographic limitations to development.
The second step of the protocol focused on what we considered the most salient and unexplored feature of informal settlements: their changing nature [8,10,23,100,101]. Studies of multitemporal change to map growth in informal settlements in Kenya used aerial images over multiple years to help determine the variation of the urban form [39]. A standard tool to measure urban change is multispectral imagery, used to differentiate built areas from the rest. Vast databases of this information exist for the U.S and Europe, making them a great tool for examining cities in these places with spatial resolutions from 15 to 30-m. However, for the rest of the world, resolution varies to a scale of a 60-m resolution, which made this method inaccurate to measure urban change at the neighborhood scale globally. The Landsat database offers global coverage, but resolutions are different depending on place, varying from 30 to 60-m resolutions. Other sources such as Sentinel-2 offer better resolution—10 m. However, this is still considered low for the study of informal settlements when built units can be as small as 2 m [76]. In this case, the mixing method of VHR and LR can provide appropriate results if used in the context of Machine Learning. A DigitalGlobe 30 cm VHR image offers an adequate and accessible form. We chose the GEP database because it had an acceptable resolution, is free to use, and permitted the easy training of personnel. It allowed us to set up the protocol as a tool that can be deployed to local communities worldwide in an accessible manner.
For this research, we selected manual digitization. While this method is labor-intensive and has its limiting factors, the inclusion of a human in the decision making process about the limits of a settlement permitted inclusion of a case by case evaluation of other variables that were not easily accessed through RS, such as political delimitation, infrastructure projects impacts, history of the place, and cultural approaches to urbanization. Particularly since the majority of the sample is located in the global south, the employment of available multispectral imagery created a low-resolution base map from which to create a detailed measure of urban change at the neighborhood scale. Figure 2 shows an example of mapping using this method in the settlement Independencias in Medellin, Colombia, using LandsatGLS-multispectral from 1990 to 2010 using the setting false-color. According to ArcGIS, “multispectral Landsat GLS image service [has been] created from the Global Land Survey (GLS) data from epochs 1975, 1990, 2000, 2005 & 2010. GLS datasets are created by the United States Geological Survey (USGS) and the National Aeronautics and Space Administration (NASA), using Landsat images. This service includes imagery from Landsat 4, Landsat 5 TM and Landsat 7 ETM, at the 30-m resolution and Landsat MSS at 60-m resolution, bands 5,4,1. It can be used for mapping and change detection of agriculture, soils, vegetation health, water-land features, and boundary studies” [102]. This method presents a low scale of detail. For this reason, the researchers selected historical aerial images as a way to consistently determine and measure change. The GEP historical aerial images database compiles files from multiple sources. The older the aerial images provide less consistency between the places and times of recording of the imagery. This inconsistency of base imagery creates differences when the delimiting of the perimeter occurs. Since it is not possible to have maps for every year, in this project, we standardized mapped samples by dividing the area of change between the first measure and the final measure of the perimeters by the number of years between measurements. This standardization method erases the uniqueness of how deceleration or acceleration of the process of urban area change happens. However, it permits a comparison of mapped areas at the same level. GEP imagery spatial resolution varies from 6” (15 cm) to 12” (30 cm); the positional accuracy (CE 90) is of less than 1 m (accuracy will achieve 1-m CE90 in most areas. Accuracy may not meet 1-m CE-90 in areas of significant relief due to Digital Elevation Model-related errors) [103].
The goal of this task was to find evidence of growth in the chosen area. Using the time tool in GEP, the protocol directed student researchers to record perimeter change in each settlement for each site at four time points across the 20 years of historic imagery available, starting with the first available aerial image and ending with the most updated one. Since urban change is not consistent and marking perimeters for each year not possible, four inflection points were selected per case—four moments in which the settlement area changed (see Figure 3). For settlements with no variation, a new perimeter was also drawn as evidence of no change. GEP data vary for each city but high-resolution imagery is available between 1990 and 2020. Using GEP, available imagery provided a restricted period to examine the process of growth across the settlements identified. However, the foundational date in 94% of settlements was prior to the years available in aerial images of GEP databases. This restriction presented the opportunity to see how mature informal settlements evolve. The final step was the recording and filing of all data gathered in the previous steps alongside measures collected by other sources. These include year of settlement foundation, area, and any additional images readily available on the web.
After mapping all settlements, the research team performed a review of mapping correctness and standardization of the sample. Each entry location was manually reviewed and approved, corrected, or deleted from the AoI sample. Mapping correctness, in this study, was established through a peer review process to determine that the place mapped was considered an informal settlement and that its limits were accurately drawn. For determination of area as an informal settlement in any of the accepted definitions, a reference to a document affirming such determination must be provided. For limits, the student researcher provided geographical or bibliographical evidence that helped to determine an accepted delimitation of project boundary in the current year. For historical imagery, four aerial photographs were used to assess the evolution of area change. Then, the oldest image was selected as a starting point, and a new limit was drawn. The peer-review process forces determination of settlement boundaries to be reviewed by, at a minimum, three people before it is included in the AoI. From the original 405 entries, 145 were removed during the review stage as they did not meet all the requisite criteria, such as evidence of informal settlement determination or agreement of perimeter limits between researchers. Selected settlements locations and areas first and last mapped extension can be found and explored in the webapp for the AoI: www.atlasofinformality.com (see Figure 4).

3. Results

This research presents the findings of a collection of standardized measurements of 260 informal settlements in 147 cities, 102 countries, and 5 continents across the world. The measurements of areas over time present evidence of the expansion of informal settlements (see Figure 5); furthermore, we also looked at the way the physical features that surround the informal neighborhoods condition the way they expand over time. Finally, we tried to make sense of what that rate of growth means in the context of city expansion and forecasting the growth of these areas globally.

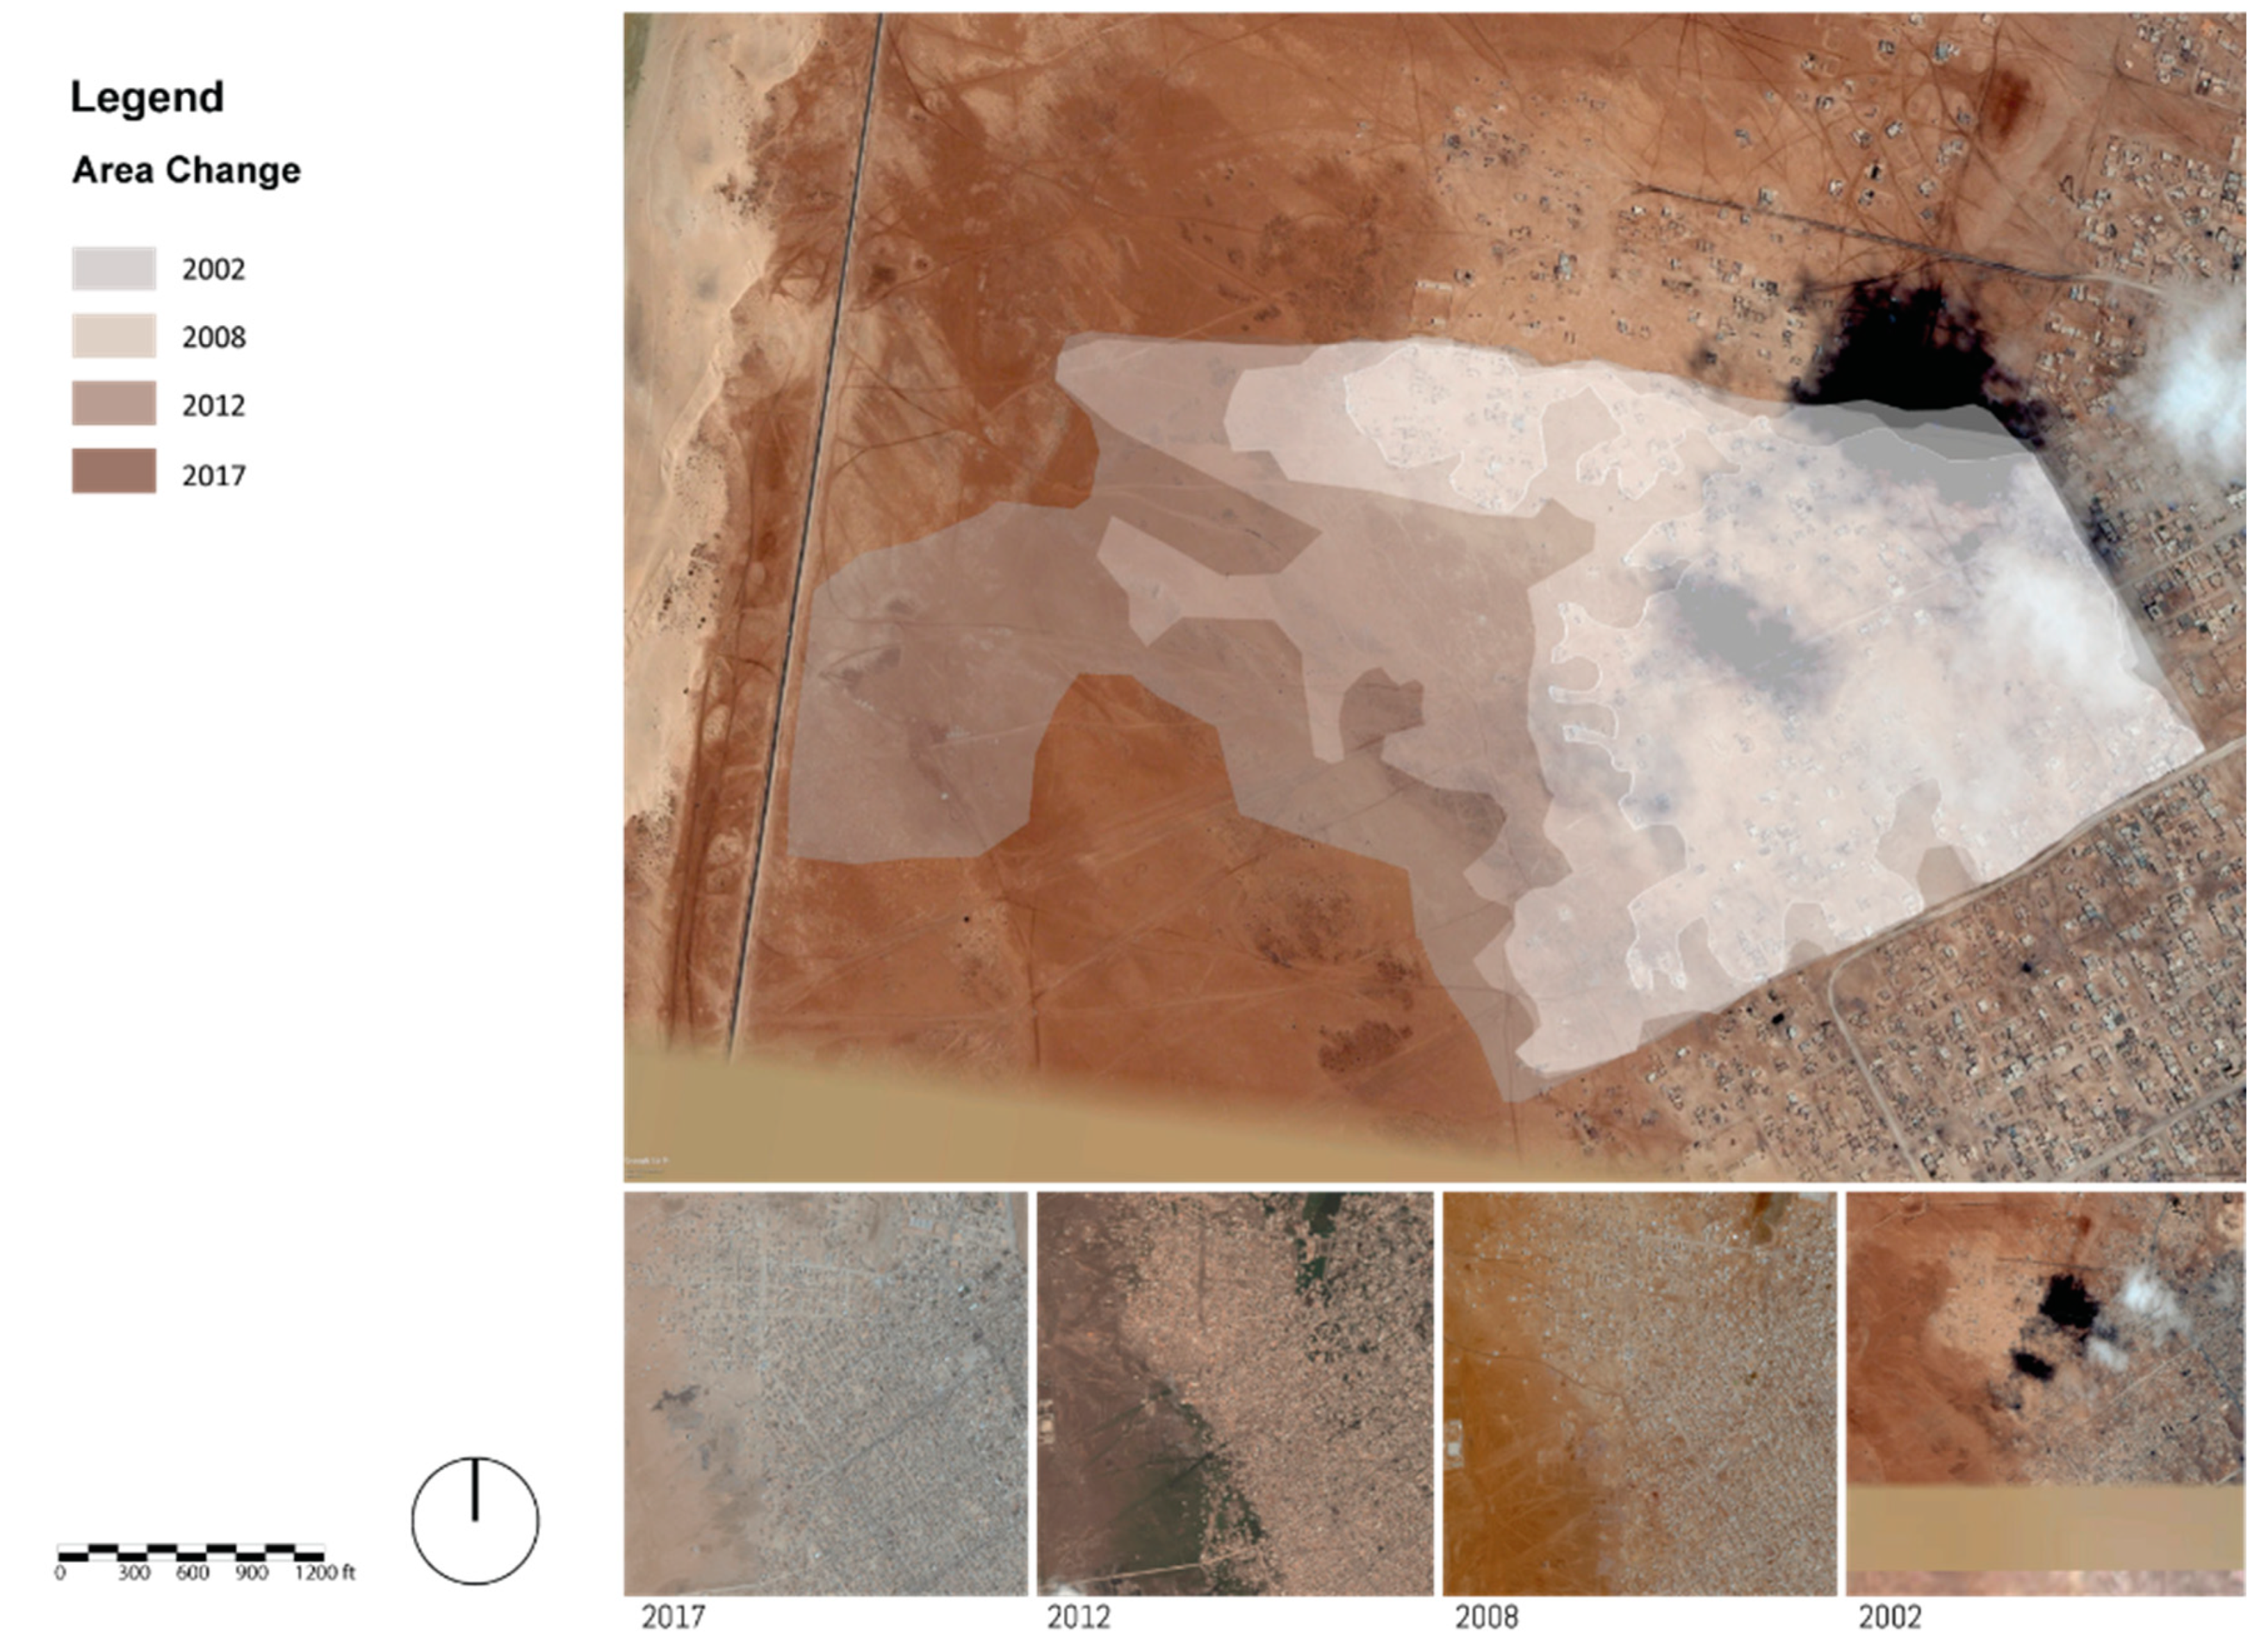
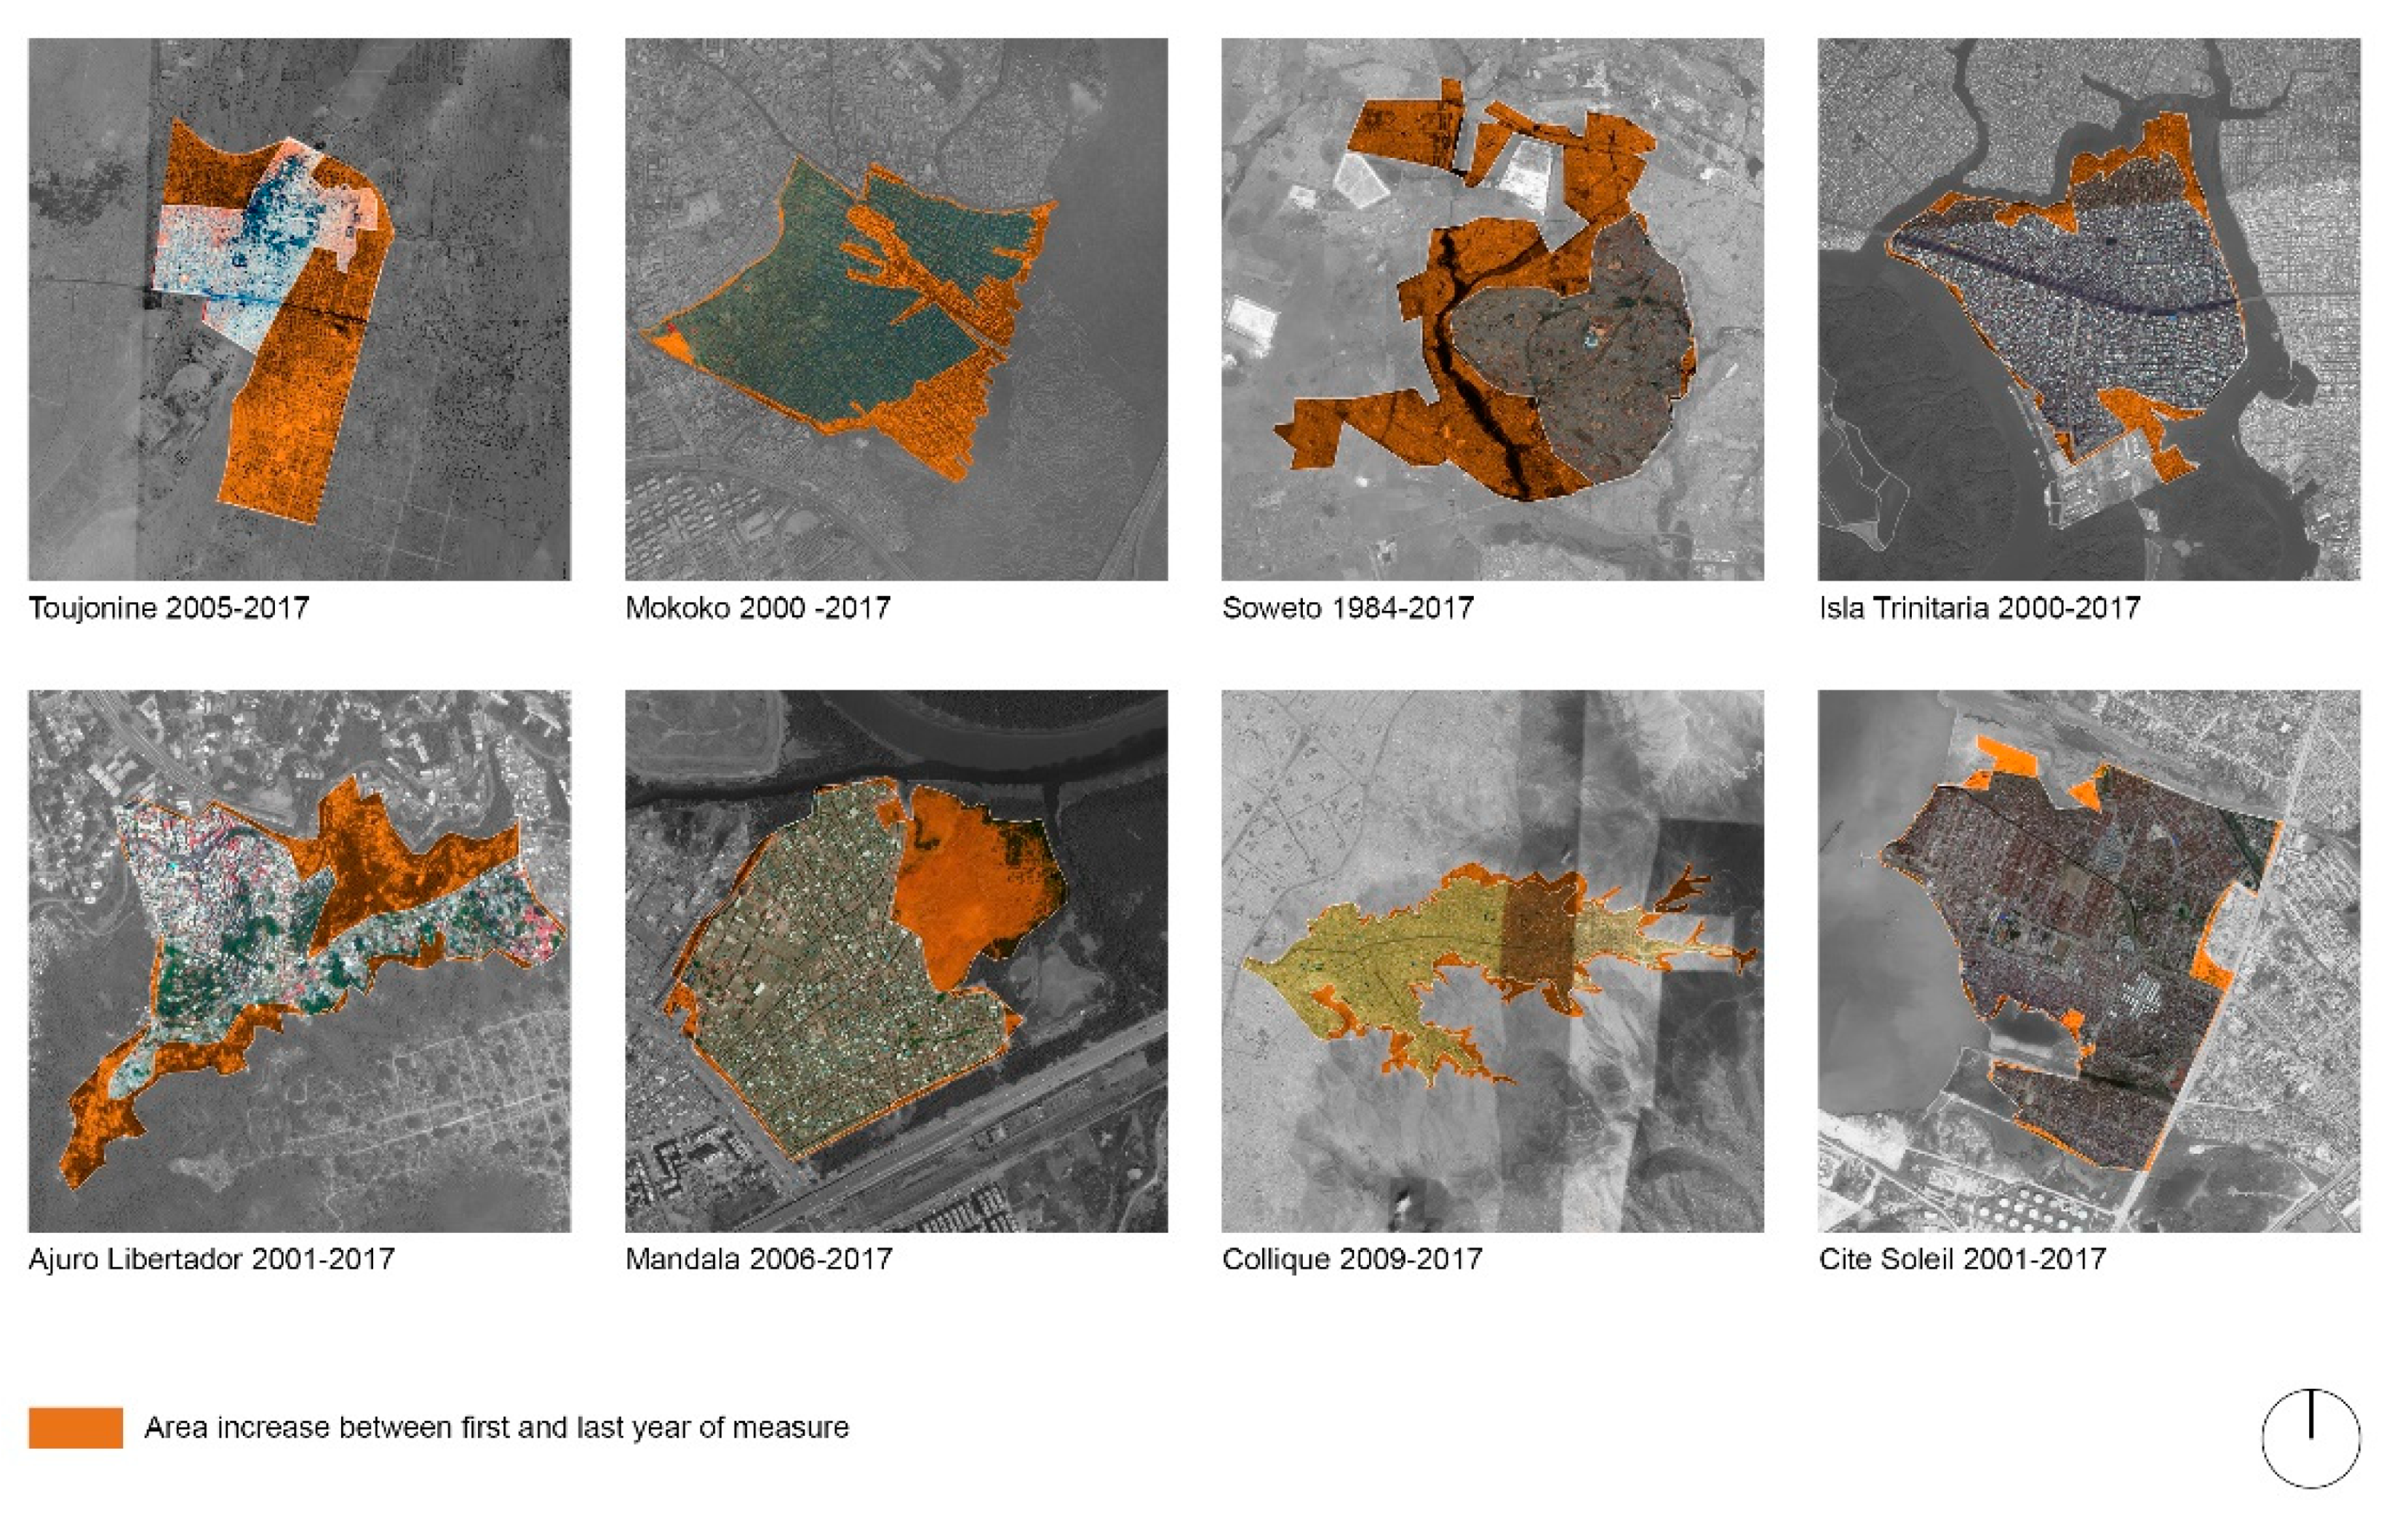
3.1. Learning about Informal Settlement Growth

To understand how areas were changing, we used the AoI measurements to capture their current rate of growth. For the estimation of a settlement area change, we subtracted the area of the last year of measure (ALy) from the area of the first year of measure (AFy). A total of 67% of the sample expanded, 12% had no change, and the rest decreased in size by 21%. The fact that most of the informal settlements are expanding is the most significant finding of the research. The sample has the most representative settlements by city per country; being representative implies some level of consolidation. Researchers deem informal settlements in consolidation states (older settlements) as changing at a lower rate. Change at the consolidation stage happens in the third dimension (added levels to existing structures) [8]. However, our results challenge this previous understanding. To estimate mean percentage growth ( % G y ) of the sample, we subtracted the area of the first year (AFy) from the area of the last year measurement (ALy) and divided that by the difference between the year of first measurement (Fy) and the year of last (Ly). Then, we estimated the proportional value of the growth per year (%Gy) (see Equation (1)).
Equation (1). Average growth per year/settlement:
G y = A L y A F y L y F y   growth   per   year % G y = G y ( 100 ) A L y   percentage   of   growth   per   year
  • N: Cases;
  • Ly: Last Year of Measure;
  • Fy: First Year of Measure;
  • A: Area of Settlement
This gave us an average percentage growth of 9.8% for the sample in area per year. Growth was not homogeneous across regions (See Table 2 for regions growth averages). We discovered, as expected, that regions are expanding at different rates; informal areas in Africa and Latin America are growing more rapidly than those in Asia. Since African cities are going through a period of expansion, finding high rates of growth in informal settlements there is expected. In contrast, Latin America is one of the most urbanized areas of the world with informal settlements in the region dating back a hundred years [6]. Accelerated urban growth is not expected in this region. However, the sample reveals a significant number of settlements with exponential growth. Figure 6 shows how the variation among cases in the sample growth correlates with geographical regions. Africa commands a significant number of entries with growth between 4.84% and 27.93% per year among its regions. Growth in Africa is followed by Latin America, where most of the growth happens in South America with a 19.36% rate of growth, on average, in contrast to Central America (including Mexico) and the Caribbean with moderate growth rates of 0.98% and 1.08%, on average, respectively. Some regions in Asia have negative growth rates, such as Eastern Asia, with −1.32% rate on average, to a peak of 4.06% in Western Asia. Asian settlements present the lowest average increase of 2%. For these estimates, we also report standard deviations (SD), which demonstrate the erratic nature of growth and change in informal settlements, with much larger numbers than expected for this measure. The variability of growth is evidenced by the global SD of 49.75, influenced greatly by an SD of 87.9 for the South American portion of the sample and an SD of 98.69 for the Northern Africa portion of the sample, along with other regions of high variability (see Figure 6 and Table 2).
There are noteworthy differences between the results of the AoI and the UN estimates [105]. In particular, the rate of expansion in the AoI is larger than the estimated percentages of slum population changes from the UN. An interesting contradiction between the data of the AoI and the data gathered at the regional scale by agencies, such as UN Habitat, is that the AoI consistently showed informal neighborhood expansion, meaning that they continued growing. In contrast, the aggregated data present the population living in slums as reducing as a proportion of the entire population. There could be many reasons for this discrepancy, from the detail in measure to the limitation of the relatively small number of cases in the AoI compared to the estimated total globally. However, it raises questions about the accuracy of these studies and supports the need for further systematic measurements of the global situation of informality. It is worth mentioning that the United Nations does not provide data about informal settlements in the global north. Most IS literature focus on informality as phenomena unique to and prevalent in the Global South. There are a few scholars that support the existence of informal settlement in areas of the global north [106]. The lack of studies and data explains the geographic bias of the AoI in its focus on cases in the Global South. However, for the AoI, we found a few instances of informal settlements in the global north (Spain and Japan); however, these places do not exist today as such.

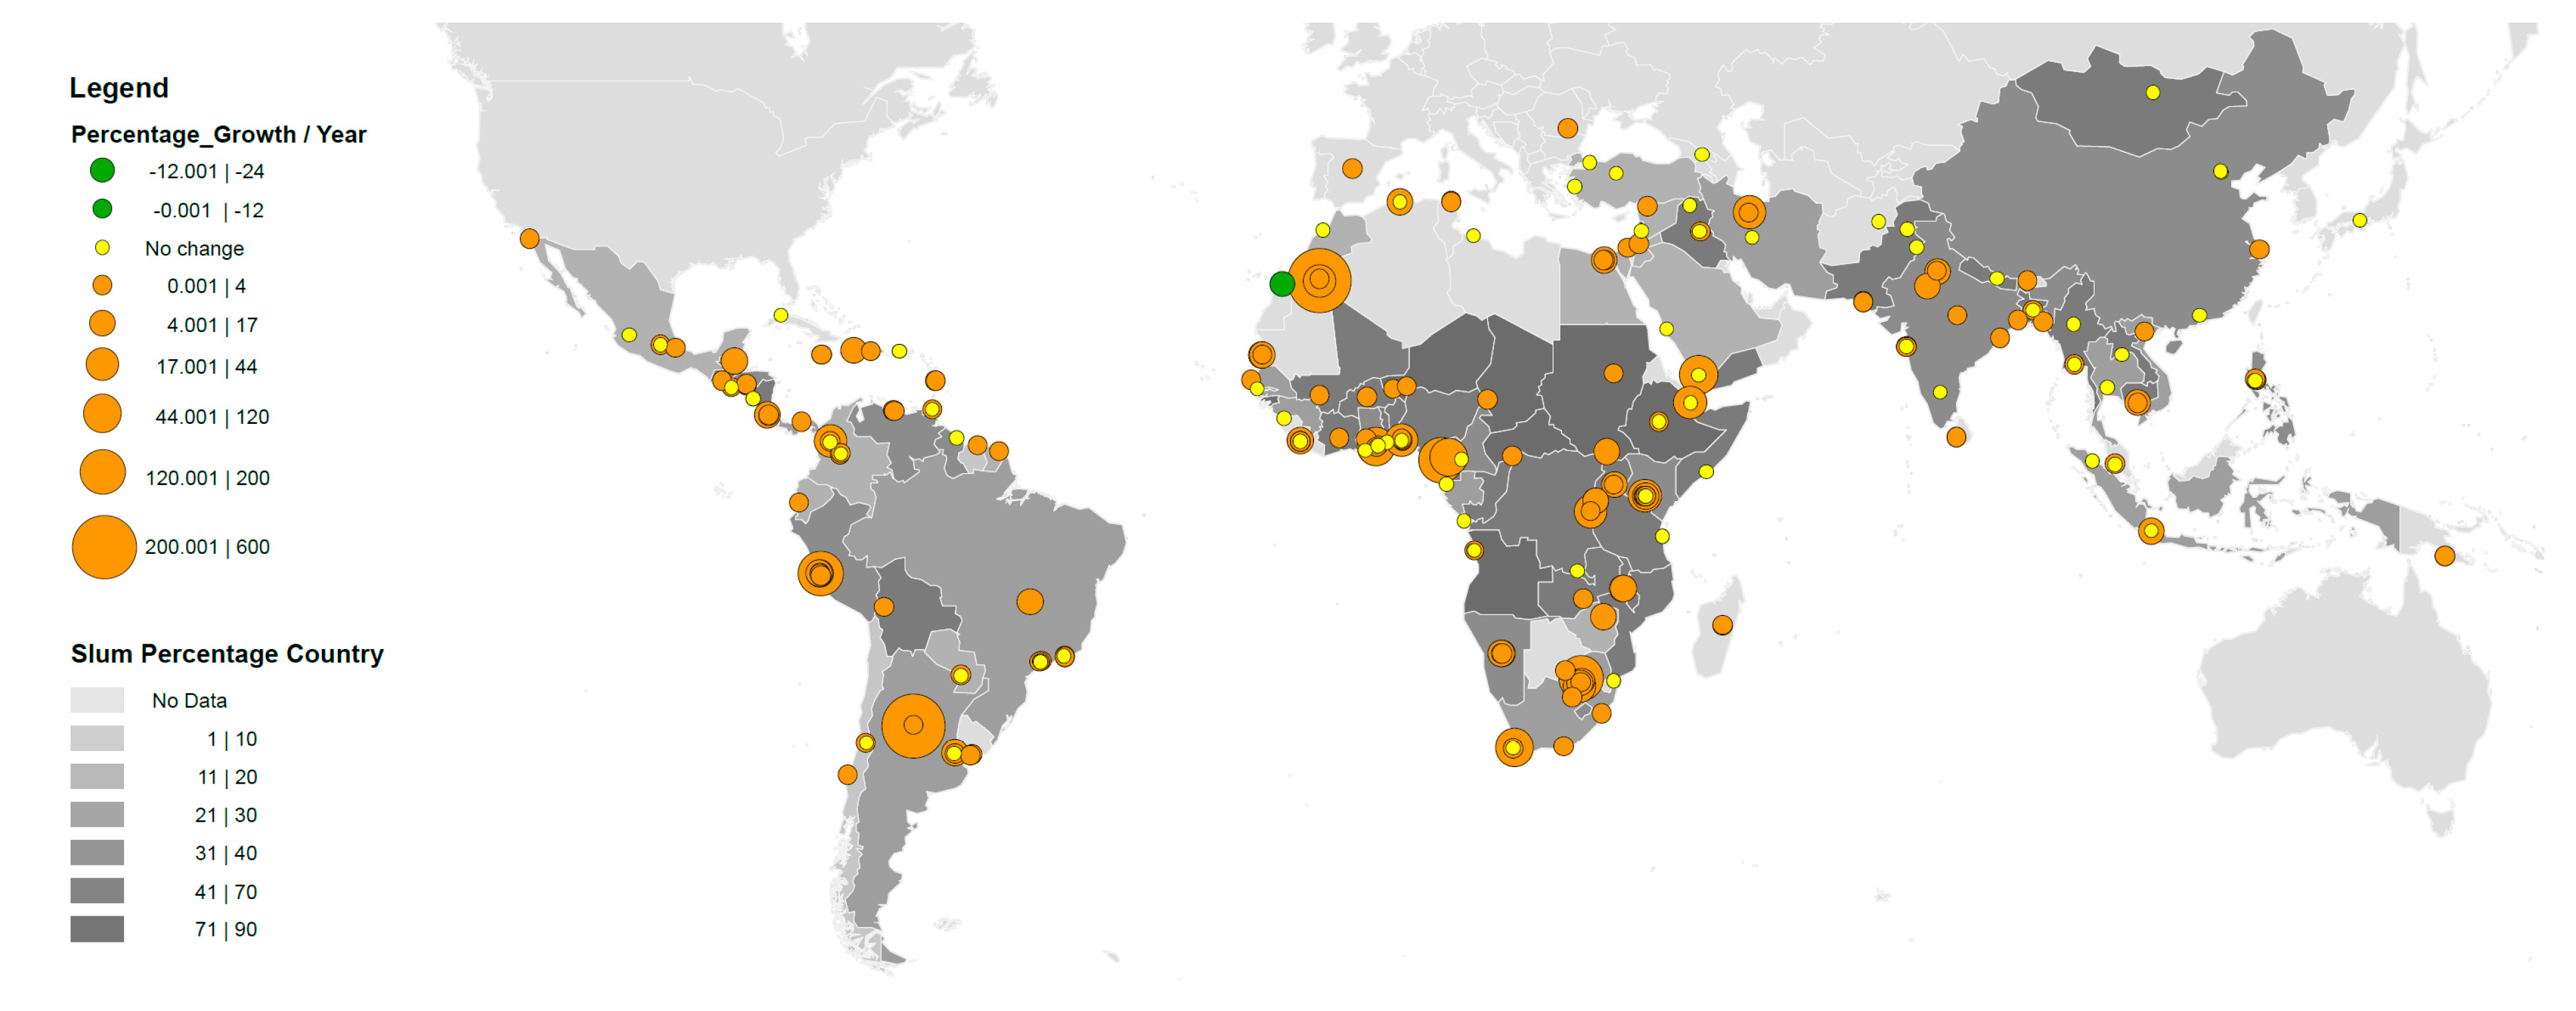
3.2. Classifying the Cases by Location and Landscape Features

Informal settlement area measurements over time present the opportunity to identify predictable patterns of urban growth. We classified the sample based on the possibilities for physical expansion. We only focused on physical features. We did not account for legal or political conditions that could condition growth. There is precedence for the classification of informal settlements using physical features; during the Favela-Bairro urban upgrading project, favelas the Secretaria Municipal de Habitação (SMH) classified depending on their geography as littoral, hill, and flat. Urban expansion depends on the opportunity to extend to abutting areas physically; as such, we classified cases depending on their possibility of expanding as opened or closed. An open settlement would be one with the ability to encroach into an adjacent area. A closed settlement has physical limitations to its expansion. Open classification is indicative of settlements in peri-urban areas abutting open land in which they could expand. From the sample, a total of 18 settlements are open, with an average growth of 19.2% compared to a 1.75% growth rate for the 242 closed settlements. Open settlements grow more than ten times than those that are closed. For example, the settlement of Nuevo Jerusalem in Medellin, Colombia, in the peri-urban area grew more than 8400% in area from 2005 to 2019.
For closed classified settlements, we identified three types of physical obstacles to expansion. The typologies that inhibit growth are development, topographical changes, and bodies of water. We defined development as abutting areas that have any human build structures. We identified topographical changes as settlements next or in high sloped areas. For bodies of water, we included all water type barriers including mangroves, rivers, lakes, and oceans. Based on that classification, closed settlements by type grew at rates of 1.72%, 3.77%, and 1.11%, respectively. From the three inhibitors of growth, bodies of water represent the highest limiting factor. These features are not mutually exclusive when considering cases surrounded by development and changes in topography; informal settlements grew at a rate of 4.11%. In contrast, cases surrounded by development and a body of water only grew at a rate of 1.13%. Informal settlements surrounded by both changes in topography and bodies of water had the lowest percentage of growth of approximately 0.27%.
The analysis shows how there is a clear advantage for informal settlements to expand if they are not surrounded by any boundary, but it also illustrates how surrounding development benefits, with respect to other inhibitors (such as topography or bodies of water), the growth of informal settlements within a denser context. Water acts as the biggest inhibitor for expansion. Areas with topographic limitations, such as adjacency to bodies of water, provide more pronounced evidence of environmental challenges faced by dwellers in informal settlements. In the settlement of Mandala in Mumbai, India, encroaching into the abutting mangrove grew more than 100% until 2009, when the settlement lost approximately 50% of its total area due to slum removal. In West Point, Montserrado, Liberia, for example, ocean erosion is making the settlement lose area towards the west-facing area of the settlement; however, the east side continues growing encroaching into the protected bay. In Ngueli, N’Djamena, Chad, the process of growth is not linear; the settlement adds and loses area due to abutting a river. Ngueli’s boundary changes during different seasons. Ngueli continually expands; however, environmental conditions play a crucial role in its rate of growth. During the rainy season, the Chari River flow increases and floods the settlement destroying the most vulnerable housing units. This case creates evidence of how peripheral urbanization in informal land occupation of environmental sensitive areas is among the most pressing problems of the Global South [107]. In 2012, the settlement was faced with a flood that removed 25% of its total area. Then, in the following year again during the dry period, the settlement increased its boundary to expand again by a rate of 6.16%. Cases such as Mandala, Ngueli, and West Point (see Figure 7) show the nuances of area coverage change in informal settlements. These cases reveal that at the neighborhood scale, growth is not linear, settlement resilience determines their capacity to continue growing even during events that erode the physical form, be these events of human or natural origin. The mapping of perimeter extensions serves as a tool to create evidence of the challenges and resilience of informal settlements under political pressures and ever-increasing climate fluctuations.

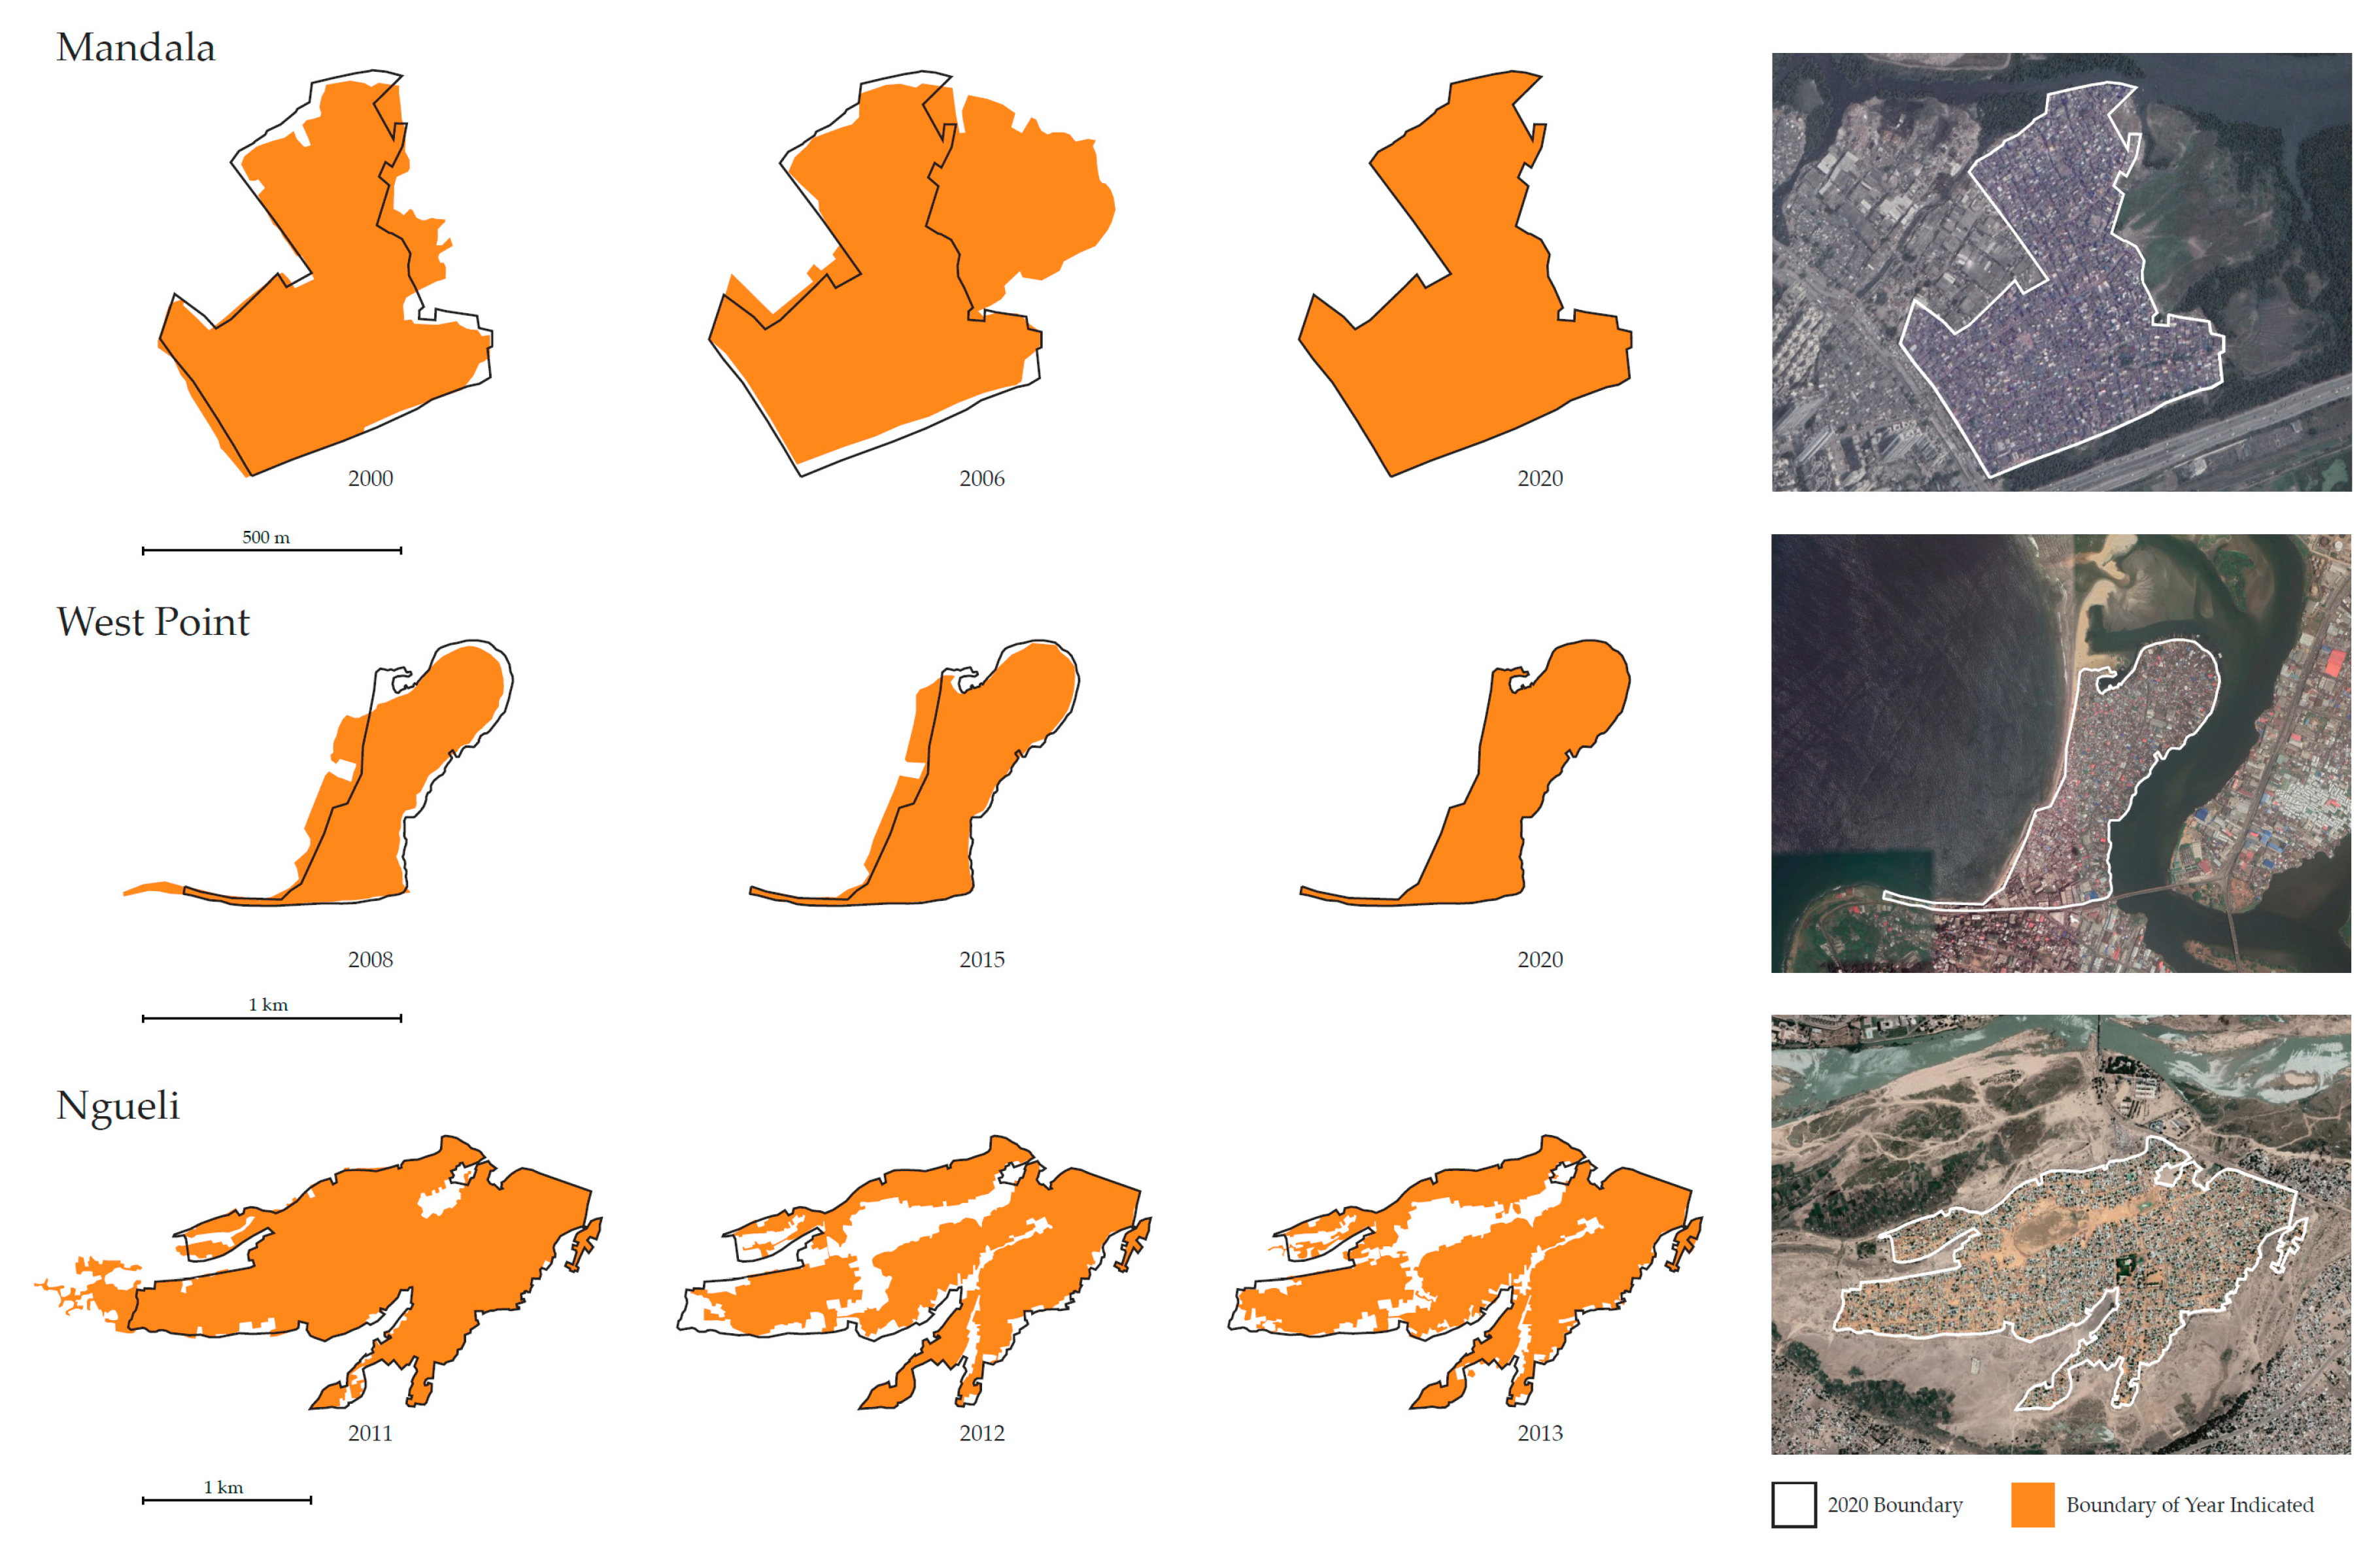
3.3. Making Sense of Growth

We found that informal settlements continue expanding at an average rate of 9.85%/year. One way to comprehend what this finding means in global terms is to transpose the percentage of growth to land coverage, mapped to the estimated total global urban coverage. Estimates of the total area of the built environment in the world vary by order of magnitude: from 276,000 square kilometers (km2) in Vector Map Level 0 (VMAP0) to 3.532 million square kilometers in the Global Rural-Urban Mapping Project (GRUMP) [108]. The Atlas of Urban Expansion estimates urban clusters associated with large cities had a total built-up area of some 340,000 square kilometers in the year 2000 [109]. How much of that urban area coverage is informal is up for discussion, but it could be as much as one-third of the entire urban form if using population as an estimation. The UN estimated the world urban population to be around 4.2 billion people in 2018 [110]. An estimated one-third of that urban population live in an informal area. In informal settlements, their similar morphology permits density estimation, using the expected estimation measured in other studies of an average urban density for slums of 60,000 people per km2 [111], then the estimated area for slums in the world would be around 23,333.33 square kilometers. If we calculate a 9.85% rate of growth annually, then every year, an estimated 2298.33 square kilometers of new informal neighborhoods would have been created out of the expansion of the existing neighborhoods.
This expansion means that every year an informal city, an informal settlement, larger than Moscow, Mexico City, or Sao Paolo is created. This annual development of informal cities would be equal to a city that would rank among the twenty largest urban areas of the world. Many variables are still unknown in this calculation such as the total area of cities, the real proportion of informal settlements in such areas, accurate population densities for informal dwellings, and the accurate measure of growth for all world informal settlements. However, this early estimation of such a large rate of growth brings to the forefront our relative lack of understanding of informal settlements and an urgency to consider the growth of informal settlements for the creation of appropriate global urban policy. The calculation of informality expansion here is similar to the Drake equation for astrobiology, a probabilistic argument used to estimate the number of active, communicative extraterrestrial civilizations in the Milky Way galaxy [112]. Even if some data are still not precise, they aid our understanding of a subject for which we have little certainty but is of significant importance to informing global urban policy. UN-Habitat presents slums (informal settlements) as “representing one of the most extreme forms of deprivation and exclusion and remain a critical factor for the persistence of poverty and exclusion in the world” [113]; having a more nuanced perspective on how urban expansion of informal settlements is changing can provide a measure to further understand those critical issues.

4. Discussion

In this article, we present a novel methodology for identifying the presence and growth of informal settlements across the globe. While individual methods have been previously used by other scholars, the combination of methods and the process of corroboration and validation of data provides a more inclusive set of samples for examination. No method is perfect, and this one had its limitations, such as time, current state of satellite imagery and digitization tools, and variations in interpretation of urban morphology. To mitigate these opportunities for inaccuracy, we employed a peer-review process along with verification of the existence of settlements through expert documentation.
This research builds on the scholarly work that focuses on uncovering the morphological processes that comprise informal settlements’ unique urban fabric [8,18,60,81]. A contributing finding to the current discussion is that of a methodological approach to measure informal settlement expansion. Much exploration is still needed and a refining of the method that can guarantee an automatization of adding new cases and maintaining the Atlas of Informality long-term. Future research should focus on a more detailed measure of the characterizations of such expansion and contraction of urban forms over time as tools and methods provide greater levels of precision, and the inclusion of systems to reach larger samples of settlements around the world.
There is much discussion today about the scale of informal settlements around the world and the need for new strategies to improve the quality of living conditions for the population in those places. The more accurately we can identify the location and patterns of these settlements, the better-matched solutions can be, whether in the form of policies, services, or adaptive strategies. One of the obstacles of researching informal settlements resides in the lack of data about these places. A starting point of creating more data is the correct identification of these informal places. Many studies that only focus on morphological features overlook the cultural and historical elements that define these places more precisely within their context. For example, the limits of a neighborhood are not only based on the unique morphological features but are also rooted in history and members’ demarcations. In Colombia, for example, the informal settlement of Independencias is labelled on the city map as a single place; however, it is comprised of three different neighborhoods, each with a unique history and governance structure that determine variations in morphological evolutionary processes. There remains a gap in the data and research about what the conditions are and how these places change over time. Presently, new remote sensing tools are advancing at an accelerated pace and could soon provide a venue for creating a more robust mapping of the physical condition of informality. However, until that research arrives, and we map all informal settlements in the world, we are still bound by the data that have been collectively processed at the national scale or by single cases. While still limited by the available data, the collection of cases presented in the AoI data set fills a gap for researchers to find and compare informal urban areas across the world in a more accessible manner. Because of the large scale of informality, a global mapping of informal settlements is a long-term project. The AoI only represents a small sample of what is a large phenomenon. However, the main problem presented here is that of the definition of informality which incites errors within the national indexes on which SDG and international agencies base their strategies to solve the world’s most crucial problems continues to prevail. The direct approach of the AoI permits cross-regional and comparative evaluation of the phenomena, with the ability to capture various forms of spatial, social, and historical data. It could also provide an overarching definition of ‘informal settlement’ drawing on the multiple observations of hundreds of scholars across our sample and based on urban form and not on the everchanging explanations and expectations of informality. The goal is that these compilations and measures lead to the production of new intervention tools that go beyond the tested and failed traditional urban development tools.
In this research, we reveal three critical issues about the changing nature of informal settlements. First, that the survey of growth corroborates the idea of informality as an expanding geography. Particularly relevant here is how the estimated rate of growth is more substantial than expected. While it is expected to see a community’s consolidation and growth stop at some point, this mapping revealed the contrary: the entire sample continued expanding. The average increase in the sample is 9.85% percent per year. The data revealed significant differences between regions. African regions continue extending at a high rate, along with South America, as expected. Central America and the Caribbean, in contrast, show low expansion rates, similar to some areas in Asia. These findings highlight a great need for emphasis on the changing nature of these places. This rate of expansion gives scholars, practitioners, public officials, and international agencies a sense of urgency regarding the need to better cope with the challenges that these new cities are confronting. Following traditional measures on the scale of informality, such as percentages of the population by national indexes, has given us a sense of relief, but looking at area expansion here has uncovered a less uplifting forecast. The scale of informal settlement urban expansion requires a thoughtful and continued oversight to understand the real extent and evolution of living conditions and land use patterns of the global urban poor. Specifically, this research highlights the need to incorporate physical area measurement change of informal settlements as a variable to understand progress on global development goals.
The second finding of the research is that informal areas in the periphery of cities develop up to ten times larger than those locked down by development or natural features. Informal settlements growth in the boundaries of cities raises essential questions about the allocation of urban policy resources in relationship to where settlements are located. Often considerable city resources are invested in dealing with informal settlements locked by development in more central areas of cities. Informal settlements more centrally located are more visible and tend to be located next to high land value urban areas, which makes them more visible and desirable land for urban renewal. In the best cases, cities deploy similar resources for all informal areas. However, in light of faster growth in the traditionally abandoned peri-urban informal settlements, different approaches and resources need to be allocated in cities to informal settlements based on their location and the probability of expansion.
A third point that the mapping of growth reveals is the intersection of non-linear growth and environmental risk for communities living in informal settlements. A few cases exposed here demonstrate the resilience challenges these communities suffer from as they cope with the destruction produced by the changing environmental conditions from floods, fires, and sea-level rise. Given their precarious positioning within urban areas, these communities are situated to experience intense impacts from climate change [114]. These events create compounding effects on the urban poor through destroyed housing, displaced social networks, and endangered lives. However, even when all this happens, we see the same areas growing back and continuing their expansion process. Cataloging and detailed study of settlements affected by environmental risk can not only help to identify problem areas and direct resources to alleviate those in danger but can also provide data to better understand how the rest of the urban planet can adapt to the current and future challenges of climate change.
Finally, this research focuses on informal settlements around the world; however, the scale of informality is intertwined with the future of the planet. In the context of current accelerated global population growth, it is undeniable that clarity about the path of informal settlements, which account for the home of more than a third of the population of all cities, provides clarity on the state of global urbanity. If the forecasting of the proportion of informal settlement dwellers is correct, and by 2050 half of all urban dwellers live in informal settlements, understanding how that change would happen is essential data to understand not only the challenges of poverty but the challenges of all global urban dwellers. We need to start investing more in the understanding and overseeing of the spaces of informality not only because the issue is of the utmost importance for billions of poor, but because the future of the planet depends on it.

Supplementary Materials

The following are available online at https://0-www-mdpi-com.brum.beds.ac.uk/2071-1050/12/22/9510/s1, SM S1: Mapping protocol. S2: AoI Webapp www.atlasofinformality.com (Figure 4 shows a screen capture of the AoI webapp).

Author Contributions

Conceptualization, J.S. and J.A.S.; methodology, J.S.; software, J.S. and D.B.; validation, J.S., J.A.S., and D.B.; formal analysis, J.S.; investigation, J.S., J.A.S., and D.B.; resources, J.S.; data curation, J.S., J.A.S., and D.B.; writing—original draft preparation, J.S.; writing—review and editing, J.S. and J.A.S.; visualization, J.S. and D.H.; supervision, J.S.; project administration, J.S. and J.A.S.; funding acquisition, J.S. All authors have read and agreed to the published version of the manuscript.

Funding

This research assistant was funded in part by the Undergraduate Research Opportunities Program (UROP) at the University of Colorado, Boulder.

Acknowledgments

This work would not have been possible without the collaboration of hundreds of students from the ENVD 1104 planning class (2017–2018) from the program of Environmental Design at the University of Colorado Boulder.

Conflicts of Interest

The authors declare no conflict of interest.

References

  1. United Nations. Progress towards the Sustainable Development Goals; United Nations: New York, NY, USA, 2017. [Google Scholar]
  2. United Nations. The Sustainable Development Goals Report 2019; United Nations: New York, NY, USA, 2019; p. 64. [Google Scholar]
  3. Gilbert, A.G. The Latin American City; Latin America Bureau: London, UK, 1998. [Google Scholar]
  4. Davis, M. Planet of Slums; Verso: London, UK, 2006; ISBN 1-84467-022-8. [Google Scholar]
  5. Roy, A.; AlSayyad, N. Urban Informality: Transnational Perspectives from the Middle East, Latin America, and South Asia; Lexington Books: Berkeley, CA, USA, 2004; ISBN 0-7391-0740-2. [Google Scholar]
  6. Perlman, J.E. Favela: Four Decades of Living on the Edge in Rio de Janeiro; Oxford University Press: Oxford, UK, 2010. [Google Scholar]
  7. Zamora, H.A. CABA: Cartografía de los barrios de Caracas. 1966-2014. VVAA. BAC Bol. Acad. Rev. Investig. Arquit. Contemp. 2017, 7, 193–194. [Google Scholar] [CrossRef] [Green Version]
  8. Samper, J. Eroded resilience, Informal settlements predictable urban growth implications for self-governance in the context of urban violence in Medellin, Colombia. UPLanD J. Urban Plan. Landsc. Environ. Des. 2017, 2, 183–206. [Google Scholar]
  9. Saunders, D. Arrival City: How the Largest Migration in History is Reshaping Our World; Vintage: New York, NY, USA, 2011. [Google Scholar]
  10. Samper, J.J. Physical Space and Its Role in the Production and Reproduction of Violence in the “Slum Wars” in Medellin, Colombia (1970s-2013s); MIT: Cambridge, MA, USA, 2014. [Google Scholar]
  11. UN Habitat. World Cities Report 2016; UN Habitat: Nairobi, Kenya, 2016. [Google Scholar]
  12. Mundial, B. World Development Indicators (WDI). 2018. Available online: http://databank.worldbank.org/ddp/home.Do (accessed on 13 July 2020).
  13. Rambaldi, G.; Kyem, P.A.K.; McCall, M.; Weiner, D. Participatory spatial information management and communication in developing countries. Electron. J. Inf. Syst. Dev. Ctries. 2006, 25, 1–9. [Google Scholar] [CrossRef]
  14. Werlin, H. The slum upgrading myth. Urban Stud. 1999, 36, 1523–1534. [Google Scholar] [CrossRef]
  15. Zetter, R.; De Souza, F.A. Understanding processes of informal housing: Appropriate methodological tools for a sensitive research area. Int. Plan. Stud. 2000, 5, 149–164. [Google Scholar] [CrossRef]
  16. Dovey, K. Informalising architecture: The challenge of informal settlements. Archit. Des. 2013, 83, 82–89. [Google Scholar] [CrossRef]
  17. Shatkin, G. Planning to forget: Informal settlements as “forgotten places” in globalising metro Manila. Urban Stud. 2004, 41, 2469–2484. [Google Scholar] [CrossRef]
  18. Kamalipour, H.; Dovey, K. Mapping the visibility of informal settlements. Habitat Int. 2019, 85, 63–75. [Google Scholar] [CrossRef]
  19. Subbaraman, R.; O’brien, J.; Shitole, T.; Shitole, S.; Sawant, K.; Bloom, D.E.; Patil-Deshmukh, A. Off the map: The health and social implications of being a non-notified slum in India. Environ. Urban 2012, 24, 643–663. [Google Scholar] [CrossRef] [Green Version]
  20. Samper, J. Urban Upgrading in a Context of Violence: Perceptions of Security and Physical Space in the Case of the Favela-Bairro in Rio de Janeiro. Int. Relat. Dipl. 2016, 4, 760–778. [Google Scholar] [CrossRef]
  21. Barros, J.; Sobreira, F. City of Slums: Self-Organisation Across Scales; University College, London, Centre for Advanced Spatial Analysis: London, UK, 2002. [Google Scholar]
  22. Leeds, A. The Significant Variables Determining the Character of Squatter Settlements; University of Texas, Institute of Latin American Studies: Austin, TX, USA, 1971. [Google Scholar]
  23. Fernandes, E. Regularization of Informal Settlements in Latin America; Lincoln Institute of Land Policy: Cambridge, MA, USA, 2011. [Google Scholar]
  24. Hansen, K.T.; Vaa, M. Reconsidering Informality: Perspectives from Urban Africa; Nordic Africa Institute: Uppsala, Sweden, 2004. [Google Scholar]
  25. Huchzermeyer, M. Unlawful Occupation: Informal Settlements and Urban Policy in South Africa and Brazil; Africa World Press: Trenton, NJ, USA, 2004. [Google Scholar]
  26. Mehrotra, R. Kinetic city, issues for urban design in South Asia. In Reclaiming (the Urbanism of) Mumbai. Explorations in/of Urbanism; Sun Publishers: Amsterdam, The Netherlands, 2009; pp. 142–152. [Google Scholar]
  27. Huchzermeyer, M.; Karam, A. Informal Settlements: A Perpetual Challenge? UCT Press: Cape Town, South Africa, 2006. [Google Scholar]
  28. Arfvidsson, H.; Simon, D.; Oloko, M.; Moodley, N. Engaging with and measuring informality in the proposed Urban Sustainable Development Goal. Afr. Geogr. Rev. 2017, 36, 100–114. [Google Scholar] [CrossRef] [Green Version]
  29. Sliuzas, R.; Mboup, G.; de Sherbinin, A. Report of the Expert Group Meeting on Slum Identification and Mapping; CIESIN: New York, NY, USA, 2008; pp. 1–36. [Google Scholar]
  30. Chien, K. Entrepreneurialising urban informality: Transforming governance of informal settlements in Taipei. Urban Stud. 2018, 55, 2886–2902. [Google Scholar] [CrossRef]
  31. Kihato, C.W.; Royston, L.; Raimundo, J.A.; Raimundo, I.M. Multiple land regimes: Rethinking land governance in Maputo’s Peri-urban spaces. In Proceedings of the Urban Forum; Springer Nature: Berlin, Germany, 2013; Volume 24, pp. 65–83. [Google Scholar]
  32. Singh, H.H.; Kumra, V.K. Slums: Threat to urban environment. In Geography and environment: Issues and challenges; Concept Publishing Company: New Delhi, India, 1986; pp. 113–138. [Google Scholar]
  33. Gilbert, A.; Gugler, J. Cities Poverty and Development: Urbanization in the Third World; Oxford University Press: Oxford, UK, 1982. [Google Scholar]
  34. UN-Habitat, U.N.H.S. The State of the World’s Cities 2006/2007: The Millennium Development Goals and Urban Sustainability: 30 Years of Shaping the Habitat Agenda; Routledge: Oxfordshire, UK, 2006; Volume 3. [Google Scholar]
  35. Ballesteros, M.M. Linking Poverty and the Environment: Evidence from Slums in Philippine Cities; Philippine Institute for Development Studies Makati City: Makati City, Philippines, 2010. [Google Scholar]
  36. OECD. OECD Glossary of Statistical Terms—Informal Settlements Definition. Available online: https://stats.oecd.org/glossary/detail.asp?ID=1351 (accessed on 30 September 2016).
  37. Kibwana, K. Spontaneous settlement and environmental management. In Essays on Land Law: The Reform Debate in Kenya; Faculty of Law, University of Nairobi: Nairobi, Kenya, 2000; pp. 105–136. [Google Scholar]
  38. Oxford, D. Oxford Advanced Learner’s Dictionary; Oxford University Press Oxford: Oxford, UK, 2000. [Google Scholar]
  39. Hurskainen, P.; Pellikka, P. Change detection of informal settlements using multi-temporal aerial photographs–the case of Voi, SE-Kenya. In Proceedings of the 5th African Association of Remote Sensing of the Environment conference, Nairobi, Kenya, 5 March 2004. unpaginated CD-ROM. [Google Scholar]
  40. Werthmann, C.; Beardsley, J. Improving Informal Settlements—Ideas from Latin America|David Rockefeller Center for Latin American Studies. Available online: http://www.drclas.harvard.edu/brazil/news/designmag (accessed on 13 August 2012).
  41. Taubenböck, H.; Kraff, N.J. The physical face of slums: A structural comparison of slums in Mumbai, India, based on remotely sensed data. J. Hous. Built Environ. 2014, 29, 15–38. [Google Scholar] [CrossRef]
  42. Kamel, N.; Mukhija, V.; Loukaitou-Sideris, A. Learning from the Margin: Placemaking tactics. In The Informal American City: Beyond Taco Trucks and Day Labor; The MIT Press: Cambridge, MA, USA, 2014; p. 119. [Google Scholar]
  43. UN-Habitat SDG Goal 11 Monitoring Framework|UN-Habitat. Available online: https://unhabitat.org/sdg-goal-11-monitoring-framework (accessed on 6 November 2020).
  44. Patel, A.; Joseph, G.; Shrestha, A.; Foint, Y. Measuring deprivations in the slums of Bangladesh: Implications for achieving sustainable development goals. Hous. Soc. 2019, 46, 81–109. [Google Scholar] [CrossRef]
  45. Purwanto, E.; Sugiri, A.; Novian, R. Determined Slum Upgrading: A Challenge to Participatory Planning in Nanga Bulik, Central Kalimantan, Indonesia. Sustainability 2017, 9, 1261. [Google Scholar] [CrossRef] [Green Version]
  46. Jones, P. Formalizing the informal: Understanding the position of informal settlements and slums in sustainable urbanization policies and strategies in Bandung, Indonesia. Sustainability 2017, 9, 1436. [Google Scholar] [CrossRef] [Green Version]
  47. World Bank. Population Living in Slums (% of Urban Population); The World Bank Group: Washington, DC, USA, 2015. [Google Scholar]
  48. Hofmann, P. Detecting informal settlements from IKONOS image data using methods of object oriented image analysis-an example from Cape Town (South Africa). In Remote Sensing of Urban Areas/Fernerkundung in urbanen Räumen; Jürgens, C., Ed.; DEFiNiENS AG: Munich, Germany, 2001; pp. 41–42. [Google Scholar]
  49. Amado, M.; Poggi, F.; Martins, A.; Vieira, N.; Amado, A.R. Transforming cape vert informal settlements. Sustainability 2018, 10, 2571. [Google Scholar] [CrossRef] [Green Version]
  50. UN-Habitat. The Challenge of Slums: Global Report on Human Settlements, 2003; Earthscan Publications: London, UK, 2003. [Google Scholar]
  51. Archer, D.; Luansang, C.; Boonmahathanakorn, S. Facilitating community mapping and planning for citywide upgrading: The role of community architects. Environ. Urban 2012, 24, 115–129. [Google Scholar] [CrossRef]
  52. Hasan, A. Orangi Pilot Project: The expansion of work beyond Orangi and the mapping of informal settlements and infrastructure. Environ. Urban 2006, 18, 451–480. [Google Scholar] [CrossRef]
  53. Patel, A.; Crooks, A.; Koizumi, N. Simulating Spatio-Temporal Dyanmics of Slum Formation in Ahmedabad, India. Sixth Urban Res. Knowl. Symp. 2012, 2012, 2–27. [Google Scholar]
  54. Hagen, E. Mapping change: Community information empowerment in Kibera (innovations case narrative: Map Kibera). In Innovations: Technology, Governance, Globalization; MIT Press: Cambridge, MA, USA, 2011; pp. 69–94. [Google Scholar]
  55. Kamalipour, H. Forms of Informality and Adaptations in Informal Settlements. ArchNet-IJAR 2016, 10, 60. [Google Scholar] [CrossRef]
  56. Angeles, G.; Lance, P.; Barden-O’Fallon, J.; Islam, N.; Mahbub, A.Q.M.; Nazem, N.I. The 2005 census and mapping of slums in Bangladesh: Design, select results and application. Int. J. Health Geogr. 2009, 8, 32. [Google Scholar] [CrossRef] [PubMed] [Green Version]
  57. Niebergall, S.; Loew, A.; Mauser, W. Integrative assessment of informal settlements using VHR remote sensing data—the Delhi case study. IEEE J. Sel. Top. Appl. Earth Obs. Remote Sens. 2008, 1, 193–205. [Google Scholar] [CrossRef]
  58. Rüther, H.; Martine, H.M.; Mtalo, E.G. Application of snakes and dynamic programming optimisation technique in modeling of buildings in informal settlement areas. ISPRS J. Photogramm. Remote Sens. 2002, 56, 269–282. [Google Scholar] [CrossRef]
  59. Stow, D.; Lopez, A.; Lippitt, C.; Hinton, S.; Weeks, J. Object-based classification of residential land use within Accra, Ghana based on QuickBird satellite data. Int. J. Remote Sens. 2007, 28, 5167–5173. [Google Scholar] [CrossRef] [PubMed] [Green Version]
  60. Kuffer, M.; Barrosb, J. Urban morphology of unplanned settlements: The use of spatial metrics in VHR remotely sensed images. Procedia Environ. Sci. 2011, 7, 152–157. [Google Scholar] [CrossRef] [Green Version]
  61. Mayunga, S.D.; Coleman, D.J.; Zhang, Y. A semi-automated approach for extracting buildings from QuickBird imagery applied to informal settlement mapping. Int. J. Remote Sens. 2007, 28, 2343–2357. [Google Scholar] [CrossRef]
  62. Huang, J.; Lu, X.X.; Sellers, J.M. A global comparative analysis of urban form: Applying spatial metrics and remote sensing. Landsc. Urban Plan. 2007, 82, 184–197. [Google Scholar] [CrossRef]
  63. Kuffer, M.; Pfeffer, K.; Sliuzas, R. Slums from space—15 years of slum mapping using remote sensing. Remote Sens. 2016, 8, 455. [Google Scholar] [CrossRef] [Green Version]
  64. Hofmann, P.; Strobl, J.; Blaschke, T.; Kux, H. Detecting informal settlements from QuickBird data in Rio de Janeiro using an object based approach. In Object-Based Image Analysis; Springer: Berlin/Heidelberg, Germany, 2008; pp. 531–553. [Google Scholar]
  65. Shekhar, S. Detecting slums from Quick Bird data in Pune using an object oriented approach. Int. Arch. Photogramm. Remote Sens. Spat. Inf. Sci. 2012, 39, 519–524. [Google Scholar] [CrossRef] [Green Version]
  66. Stasolla, M.; Gamba, P. Spatial indexes for the extraction of formal and informal human settlements from high-resolution SAR images. IEEE J. Sel. Top. Appl. Earth Obs. Remote Sens. 2008, 1, 98–106. [Google Scholar] [CrossRef]
  67. Wurm, M.; Taubenböck, H.; Weigand, M.; Schmitt, A. Slum mapping based on multi-scale texture features in polarimetric SAR data. Remote Sens. Environ. 2017, 194, 190–204. [Google Scholar] [CrossRef]
  68. Davis, D.S. Object-based image analysis: A review of developments and future directions of automated feature detection in landscape archaeology. Archaeol. Prospect. 2019, 26, 155–163. [Google Scholar] [CrossRef]
  69. Lasaponara, R.; Masini, N. Satellite Remote Sensing: A New Tool for Archaeology; Springer Science & Business Media: Berlin, Germany, 2012; Volume 16. [Google Scholar]
  70. Tarolli, P.; Cao, W.; Sofia, G.; Evans, D.; Ellis, E.C. From features to fingerprints: A general diagnostic framework for anthropogenic geomorphology. Prog. Phys. Geogr. Earth Environ. 2019, 43, 95–128. [Google Scholar] [CrossRef] [Green Version]
  71. Kennett, D.J.; Kennett, J.P. Early state formation in southern Mesopotamia: Sea levels, shorelines, and climate change. J. Isl. Coast. Archaeol. 2006, 1, 67–99. [Google Scholar] [CrossRef]
  72. Guedes, J.A.A.; Crabtree, S.A.; Bocinsky, R.K.; Kohler, T.A. Twenty-first century approaches to ancient problems: Climate and society. Proc. Natl. Acad. Sci. USA 2016, 113, 14483–14491. [Google Scholar] [CrossRef] [Green Version]
  73. Fallatah, A.; Jones, S.; Mitchell, D.; Kohli, D. Mapping informal settlement indicators using object-oriented analysis in the Middle East. Int. J. Digit. Earth 2019, 12, 802–824. [Google Scholar] [CrossRef]
  74. Kuffer, M.; Pfeffer, K.; Sliuzas, R.; Baud, I. Extraction of slum areas from VHR imagery using GLCM variance. IEEE J. Sel. Top. Appl. Earth Obs. Remote Sens. 2016, 9, 1830–1840. [Google Scholar] [CrossRef]
  75. Fallatah, A.; Jones, S.; Mitchell, D. Object-based random forest classification for informal settlements identification in the Middle East: Jeddah a case study. Int. J. Remote Sens. 2020, 41, 4421–4445. [Google Scholar] [CrossRef]
  76. Gram-Hansen, B.J.; Helber, P.; Varatharajan, I.; Azam, F.; Coca-Castro, A.; Kopackova, V.; Bilinski, P. Mapping informal settlements in developing countries using machine learning and low resolution multi-spectral data. In Proceedings of the Proceedings of the 2019 AAAI/ACM Conference on AI, Ethics, and Society, Honolulu, HI, USA, 27–28 January 2019; pp. 361–368. [Google Scholar]
  77. Mboga, N.; Persello, C.; Bergado, J.R.; Stein, A. Detection of informal settlements from VHR satellite images using convolutional neural networks. In Proceedings of the 2017 IEEE international geoscience and remote sensing symposium (IGARSS), Fort Worth, TX, USA, 23–28 July 2017; pp. 5169–5172. [Google Scholar]
  78. Shabat, A.M.; Tapamo, J.-R. A comparative study of the use of local directional pattern for texture-based informal settlement classification. J. Appl. Res. Technol. 2017, 15, 250–258. [Google Scholar] [CrossRef] [Green Version]
  79. Gevaert, C.M.; Persello, C.; Sliuzas, R.; Vosselman, G. Informal settlement classification using point-cloud and image-based features from UAV data. ISPRS J. Photogramm. Remote Sens. 2017, 125, 225–236. [Google Scholar] [CrossRef]
  80. Williams, N.; Quincey, D.; Stillwell, J. Automatic classification of roof objects from aerial imagery of informal settlements in Johannesburg. Appl. Spat. Anal. Policy 2016, 9, 269–281. [Google Scholar] [CrossRef] [Green Version]
  81. Taubenböck, H.; Kraff, N.J.; Wurm, M. The morphology of the Arrival City-A global categorization based on literature surveys and remotely sensed data. Appl. Geogr. 2018, 92, 150–167. [Google Scholar] [CrossRef]
  82. Barros, J.; Sobreira, F. City of Slums: Self-Organisation Across Scales. UCL Work. Pap. Ser. 2002, 55, 1–10. [Google Scholar]
  83. Kohli, D.; Sliuzas, R.; Kerle, N.; Stein, A. An ontology of slums for image-based classification. Comput. Environ. Urban Syst. 2012, 36, 154–163. [Google Scholar] [CrossRef]
  84. Baud, I.; Kuffer, M.; Pfeffer, K.; Sliuzas, R.; Karuppannan, S. Understanding heterogeneity in metropolitan India: The added value of remote sensing data for analyzing sub-standard residential areas. Int. J. Appl. Earth Obs. Geoinform. 2010, 12, 359–374. [Google Scholar] [CrossRef]
  85. Kamalipour, H. Improvising Places: The Fluidity of Space in Informal Settlements. Sustainability 2020, 12, 2293. [Google Scholar] [CrossRef] [Green Version]
  86. Hillier, B.; Greene, M.; Desyllas, J. Correspondence Self-generated Neighbourhoods: The role of urban form in the consolidation of informal settlements. Urban Des. Int. 2000, 5, 61–96. [Google Scholar] [CrossRef]
  87. Bhatt, V.; Rybczynski, W. How the other half builds. In Time-saver Standards in Urban Design; McGraw-Hill: New York, NY, USA, 2003; Volume 1. [Google Scholar]
  88. Kamalipour, H. Mapping Urban Interfaces: A Typology of Public/Private Interfaces in Informal Settlements. Spaces Flows An Int. J. Urban Extra Urban Stud. 2017, 8, 1–12. [Google Scholar] [CrossRef]
  89. Kamalipour, H.; Dovey, K. Incremental Urbanisms; Mapping Urbanities, Routledge: New York, NY, USA, 2017; pp. 249–268. [Google Scholar]
  90. Ribeiro, G. An ecological approach to the study of urban spaces: The case of a shantytown in Brasilia. J. Archit. Plan. Res. 1997, 14, 289–300. [Google Scholar]
  91. Ioannidis, C.; Psaltis, C.; Potsiou, C. Towards a strategy for control of suburban informal buildings through automatic change detection. Comput. Environ. Urban Syst. 2009, 33, 64–74. [Google Scholar] [CrossRef]
  92. IPP Data Rio. Available online: https://www.data.rio/ (accessed on 6 November 2020).
  93. MTIC Datos Abiertos Colombia. Available online: https://www.datos.gov.co/ (accessed on 6 November 2020).
  94. Gunter, A.W. Getting it for free: Using Google earthTM and IL WIS to map squatter settlements in Johannesburg. In Proceedings of the Geoscience and Remote Sensing Symposium, 2009 IEEE International, IGARSS 2009, Cape Town, South Africa, 12–17 July 2009; Volume 3, pp. III-388–III-391. [Google Scholar]
  95. Joshi, P.; Sen, S.; Hobson, J. Experiences with surveying and mapping Pune and Sangli slums on a geographical information system (GIS). Environ. Urban. 2002, 14, 225–240. [Google Scholar] [CrossRef]
  96. Fuchs, M. Slum als Projekt: Dharavi und die Falle der Marginalisierung. Mumbai–Delhi–Kolkata. Annäherungen Megastädte Indiens; Draupadi: Heidelberg, Germany, 2006; pp. 47–63. [Google Scholar]
  97. Schubert, D. Der größte Slum Asiens: Dharavi (Mumbai)–Von Fehlschlägen der "Sanierung“ zum Modellprojekt; Arbeitskreis Stadterneuerung und Institut für Stadt-und Regionalplanung, Ed.; Megacities und Stadterneuerung, Jahrbuch Stadterneuerung, Universitätsverlag der TU Berlin: Berlin, Germany, 2009; pp. 99–114. [Google Scholar]
  98. Loureiro, V.; Medeiros, V.; Guerreiro, M.R. Configuration of self-organizing informality: Socio-spatial dynamic in favelas. In Proceedings of the 11th International Space Syntax Symposium, Instituto Superior Técnico, Departamento de Engenharia Civil, Arquitetura e Georrecursos, Lisbon, Portugal, 7 July 2017; pp. 1–17. [Google Scholar]
  99. Samper, J. Atlas of Informality. Available online: www.atlasofinformality.com (accessed on 23 October 2020).
  100. Drummond, D. Architectes des Favelas; Dunod: Paris, France, 1981. [Google Scholar]
  101. Mesa Sánchez, N.E. Proceso de desarrollo de los asentamientos populares no controlados: Estudios de caso Medellín, Colombia. Escuela Hábitat 1985, 12, 1–39. [Google Scholar]
  102. ArcGIS Landsat GLS Multispectral. Available online: https://www.arcgis.com/home/item.html?id=472f1e9f630e49ccb88d639543554ef9 (accessed on 27 September 2017).
  103. Google What Are the Technical Specifications for Google Imagery?—Google Maps Data Help. Available online: https://support.google.com/mapsdata/answer/6261838?hl=en (accessed on 15 September 2020).
  104. UN, D.I.U. Unstats|Millennium Indicators. Available online: http://mdgs.un.org/unsd/mdg/SeriesDetail.aspx?srid=710 (accessed on 23 October 2020).
  105. UN-HS, U.N.H.S.P. State of the World’s Cities 2010/2011: Bridging the Urban Divide; Earthscan: London, UK, 2010. [Google Scholar]
  106. Mukhija, V.; Loukaitou-Sideris, A. The Informal American City: Beyond Taco Trucks and Day Labor; MIT Press: Cambridge, MA, USA, 2014. [Google Scholar]
  107. Pimentel Walker, A.P.; Arquero de Alarcón, M. The competing social and environmental functions of private urban land: The case of an informal land occupation in São Paulo’s south periphery. Sustainability 2018, 10, 4160. [Google Scholar] [CrossRef] [Green Version]
  108. Ciesin, I. CIAT Global rural-urban mapping project (GRUMP). In Alpha Version Popul. Grids; Center for International Earth Science Information Network: New York, NY, USA, 2004. [Google Scholar]
  109. Blei, A.M.; Angel, S.; Civco, D.L.; Liu, Y.; Zhang, X. Accuracy Assessment and Map Comparisons for Monitoring Urban Expansion: The Atlas of Urban Expansion and the Global Human Settlement Layer; Lincoln Institute of Land Policy: Cambridge, MA, USA, 2018. [Google Scholar]
  110. United Nations. 2018 Revision of World Urbanization Prospects; United Nations: New York, NY, USA, 2018. [Google Scholar]
  111. Bird, J.; Montebruno, P.; Regan, T. Life in a slum: Understanding living conditions in Nairobi’s slums across time and space. Oxf. Rev. Econ. Policy 2017, 33, 496–520. [Google Scholar] [CrossRef]
  112. Burchell, M.J. W (h) ither the Drake equation? Int. J. Astrobiol. 2006, 5, 243. [Google Scholar] [CrossRef]
  113. UN-Habitat. The Sustainable Development Goals Report 2020. In Indicator 11.1.1: Proportion of Urban Population Living in Slums, Informal Settlements or Inadequate Housing; United Nations Human Settlements Programme (UN-Habitat): New York, NY, USA, 2020. [Google Scholar]
  114. Han, Y.; Song, Y.; Burnette, L.; Lammers, D. Spatiotemporal analysis of the formation of informal settlements in a metropolitan fringe: Seoul (1950–2015). Sustainability 2017, 9, 1190. [Google Scholar] [CrossRef] [Green Version]
Figure 1. Example of the perimeter selection for settlement of Sebkha, Nouakchott, Mauritania [99].
Sustainability 12 09510 g001
Figure 2. Medellin LandsatGLS multispectral imagery from1990 to 2010—false-color [102].
Sustainability 12 09510 g002
Figure 3. Time change example of the AoI for Sebkha, Nouakchott, Mauritania. Four aerials for the same settlement from 2017, 2002, 2008, and 2002 [99].
Sustainability 12 09510 g003
Figure 4. AoI webapp screenshots panel: (a) world map with location, panel (b) zoom to city-scale (Lagos, Nigeria), and settlements [99].
Sustainability 12 09510 g004
Figure 5. Settlement growth over time: Toujoinine Trarza, Mauritania, Mokoko Lagos, Nigeria, Soweto Johannesburg, South Africa, Isla Trinitaria Guayaquil, Ecuador, Ajuro Libertador Caracas, Venezuela, Mandala, Collique Callao, Peru, Cite Soleil Port au Prince, Haiti [99].
Sustainability 12 09510 g005
Figure 6. Growth percentages in the Atlas of informality, UN HABITAT, retrieved from the United Nation’s Millennium Development Goals database [104].
Sustainability 12 09510 g006
Figure 7. Settlement area variability in the informal settlements for Mandala, Ngueli, and West Point.
Sustainability 12 09510 g007
Table 1. Informal settlements multiple definitions by authors from 1982 to 2019 [10,23,32,33,34,36,37,38,39,40,41,42,43,44].
Variables/LiteratureA. Gilbert & Gugler, 1982Singh & Kumra, 1986OECD 1997Kibwana, 2000Oxford 2000UN-Habitat 2006Hurskainen & Pellikka 2004Werthmann & Beardsleu 2008Fernandez 2011Samper 2014Taubenbock H. 2014Mukhija 2014UN-Habitat, 2016Patel et. al. 2019
Lack of safe waterx xxx xx
lack of sanitationx xxx xx
Lack of basic infrastructure and servicesxx xx
Overcrowding x x
Fragile structuresx x xx
Non-secure tenurexx x xxxxx xx
Group of buildings xx xx
Povertyx xx
Lak of quality of housing x
Illegal dwellingx x x
Self-Build x x
Unplanned settlements x xx
No building regulations compliance x x xx
Temporary shelters x
Develop irregularly x x
Developed progressively xx
insufficient living space xx
Exclusionx x
Table 2. Atlas of Informality sample distribution.
RegionNumber CasesAvg % Growth/YearMedian Area HeStandard Deviation A%G/Y
Eastern Asia6−1.32%14.752.35
Melanesia21.18%19.890.31
Southeast Asia180.63%27.492.72
Southern Asia272.48%60.692.72
Western Asia164.06%98.037.03
Asia 692.00%44.1710.38
Eastern Africa334.84%51.368.81
Western Africa315.50%55.9916.43
Southern Africa1721.76%181.6450.30
Middle Africa1122.51%78.0147.50
Northern Africa1527.93%61.1998.69
Africa 10712.46%85.6444.92
Eastern Europe10.29%58.00N/A
Southern Europe10.98%150.06N/A
Europe 20.64%104.030.49
Central America180.98%32.132.07
Caribbean111.08%36.282.70
South America5319.36%50.2987.90
Americas 8213.03%74.2471.42
World 2609.85%55.9949.75
Publisher’s Note: MDPI stays neutral with regard to jurisdictional claims in published maps and institutional affiliations.

