Reusing Newspaper Kiosks for Last-Mile Delivery in Urban Areas
by
 , , and
José M. González-Varona
1 ,
,
Félix Villafáñez
1,
Fernando Acebes
1,
Alfonso Redondo
2 and
David Poza
1,* 1
INSISOC—University of Valladolid, 47011 Valladolid, Spain
2
Department of Business Management and Market Research, University of Valladolid, 47011 Valladolid, Spain
*
Author to whom correspondence should be addressed.
Sustainability 2020, 12(22), 9770; https://0-doi-org.brum.beds.ac.uk/10.3390/su12229770
Submission received: 4 November 2020
/
Revised: 19 November 2020
/
Accepted: 22 November 2020
/
Published: 23 November 2020
(This article belongs to the Special Issue (Re)Designing Processes for Improving Supply Chain Sustainability)
Abstract
:The current increase in e-commerce is generating growing problems in urban areas in terms of both traffic flow (increasing traffic, no parking spaces) and environmental issues (noise, atmospheric pollution, etc.). In parallel, an iconic element of historic districts is disappearing: more and more newspaper kiosks are closing their business as their work dwindles. In this scenario, the objective of this paper is to propose a model for last-mile parcel delivery that exploits the current available newspaper kiosk network by using them as parcel lockers. To demonstrate the benefits of this proposal, we map the kiosk network of the city of Valladolid (Spain), and compare the environmental impact of a traditional (door-to-door) delivery and the proposed model which reuses old kiosks as parcel lockers. The necessary steps to carry out simulations are described in detail so that experiments can be replicated in other cities that face the same issues.
1. Introduction
E-commerce sale volumes have grown continuously in the last few years. Although a 20.7% global growth rate was forecast for 2020 [1], the ongoing COVID-19 pandemic is leading to substantial changes in online consumption patterns that have accelerated e-commerce growth beyond any expectations [2]. Consequently, an increasing number of vehicles are needed in downtown areas to deliver this growing volume of goods, which leads to traffic-flow problems, and also to negative health and environmental consequences (e.g., noise pollution, CO2 emissions) [3,4,5].
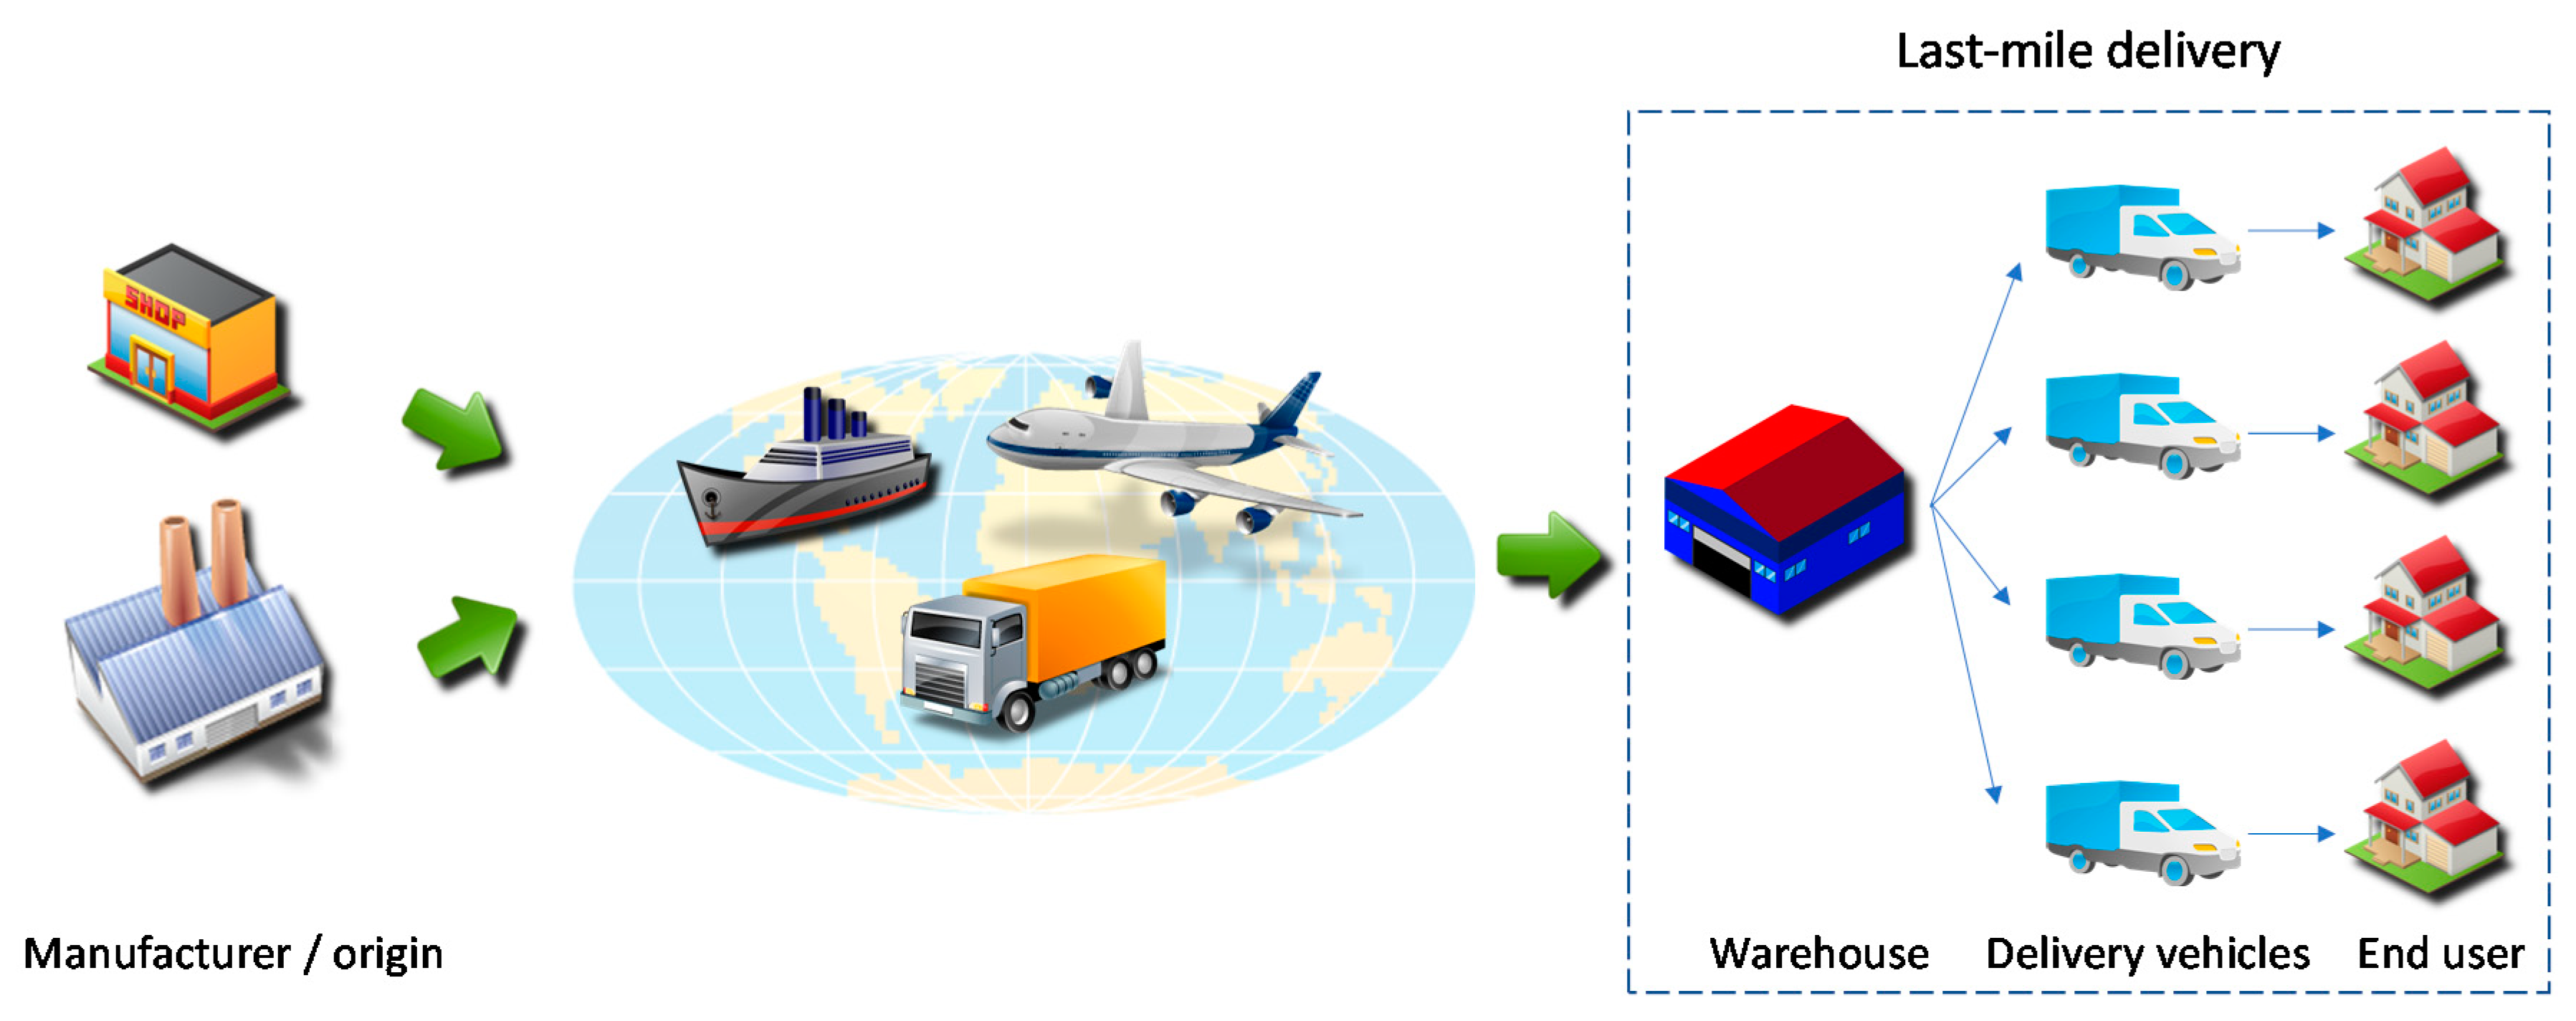
In general, while the logistics associated with freight transport have significantly improved in recent years, this cannot be stated for last-mile distribution, which is considered one of the least efficient, the most polluting and the costliest segments along the entire logistics chain [6]. Last-mile delivery is the process associated with moving goods from a courier’s warehouse to their final destination [7]. Figure 1 represents a traditional parcel delivery model. Goods are transported from their place of origin by different transportation means until they reach the courier’s local warehouse, which is usually located near the customer’s address. From this point with traditional last-mile delivery, goods are loaded on delivery vehicles that travel around the city in order to deliver the corresponding parcels to customer addresses.
The door-to-door delivery service has traditionally been the most frequent mode of delivery for the last mile (Figure 1, right). In this form, the customer simply waits at home for goods to be delivered. Apart from the above-mentioned traffic and environmental issues, this delivery method entails certain drawbacks that make last-mile delivery expensive and inefficient: difficulties in finding the exact client’s address, or no-one at home when delivery people arrive, to cite only two examples. In these situations, the customer needs to either go to the courier’s depot to pick up goods or wait for the delivery company to make a second delivery attempt.
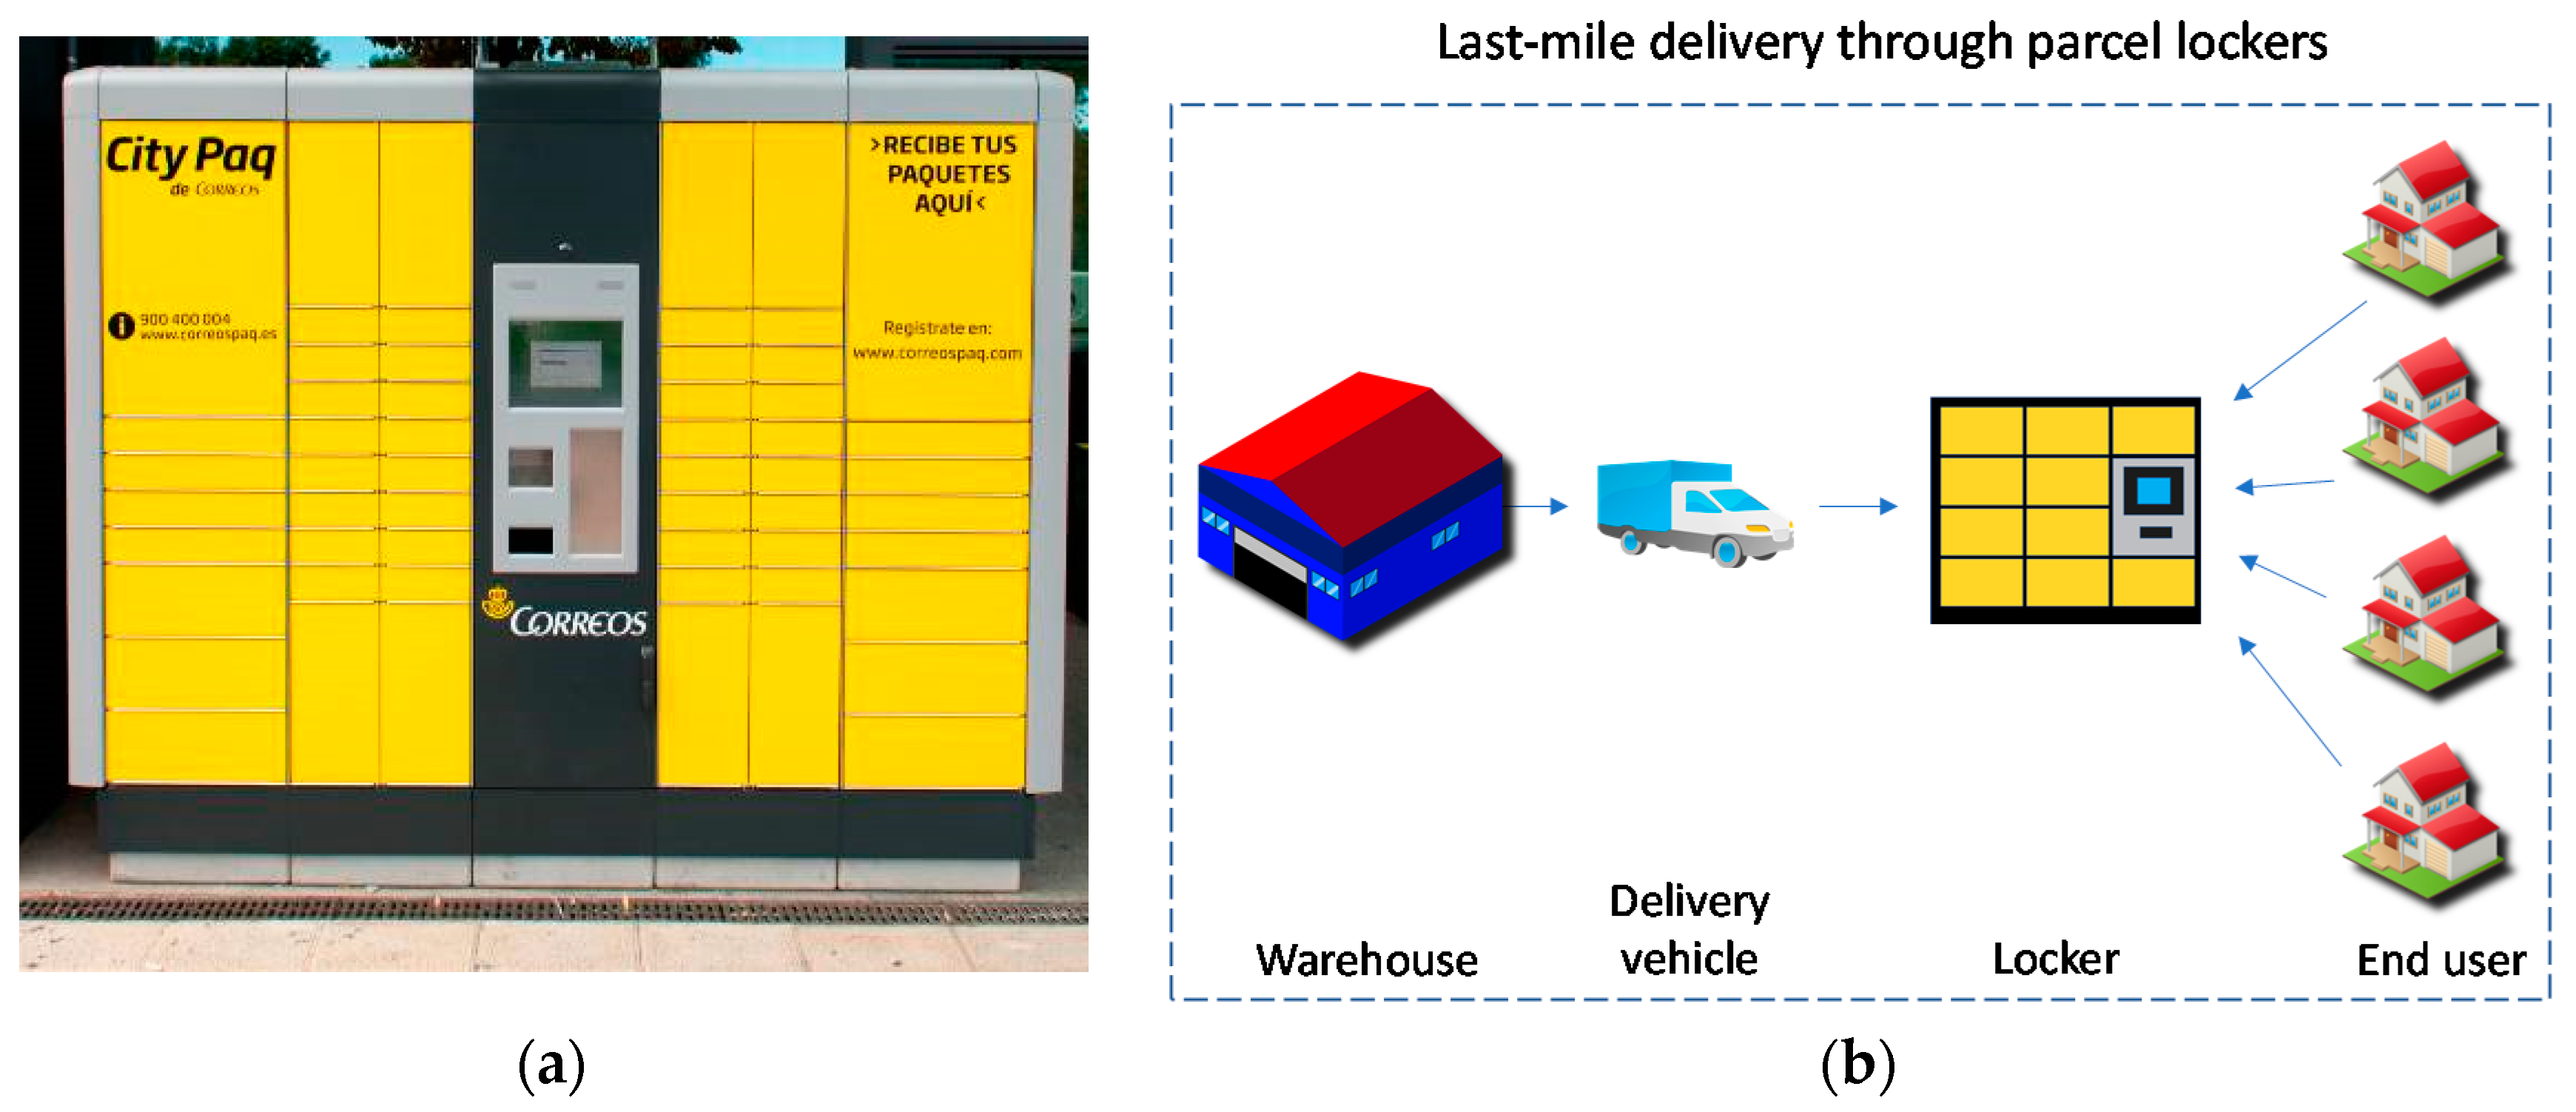
Last-mile delivery becomes particularly complex in downtown areas given their limited capacity to support increasing traffic demands [8] and parking places for delivery vehicles are often lacking [9]. To mitigate home delivery service problems, a more efficient last-mile distribution alternative has been proposed in recent years: the use of a self-collection delivery service through parcel lockers. Parcel lockers are automated machines for the delivery of goods. They are located in highly frequented areas, usually near customers’ homes (Figure 2a). Accordingly when a courier deposits goods in lockers, recipients are notified to come and pick them up (Figure 2b). An integrated terminal allows the identification of the recipient of a package and releases it.
The use of this automated system for last-mile delivery offers several advantages: it is a simple solution that does not need employees, and it reduces failed deliveries and, thus, subsequent delivery attempts. Consequently, the use of parcel lockers reduces delivery costs and handling times and can also contribute to reduce traffic density and CO2 emissions. It also reduces the risk of delivering to wrong addresses and avoids having to double-park when no spaces are available, which means a more efficient delivery process. In fact the use of automated lockers has proven especially useful for parcel delivery in large city centers [10], and has received the attention of several studies in recent years as an alternative to traditional door-to-door delivery (please see Section 2 for a literature review).
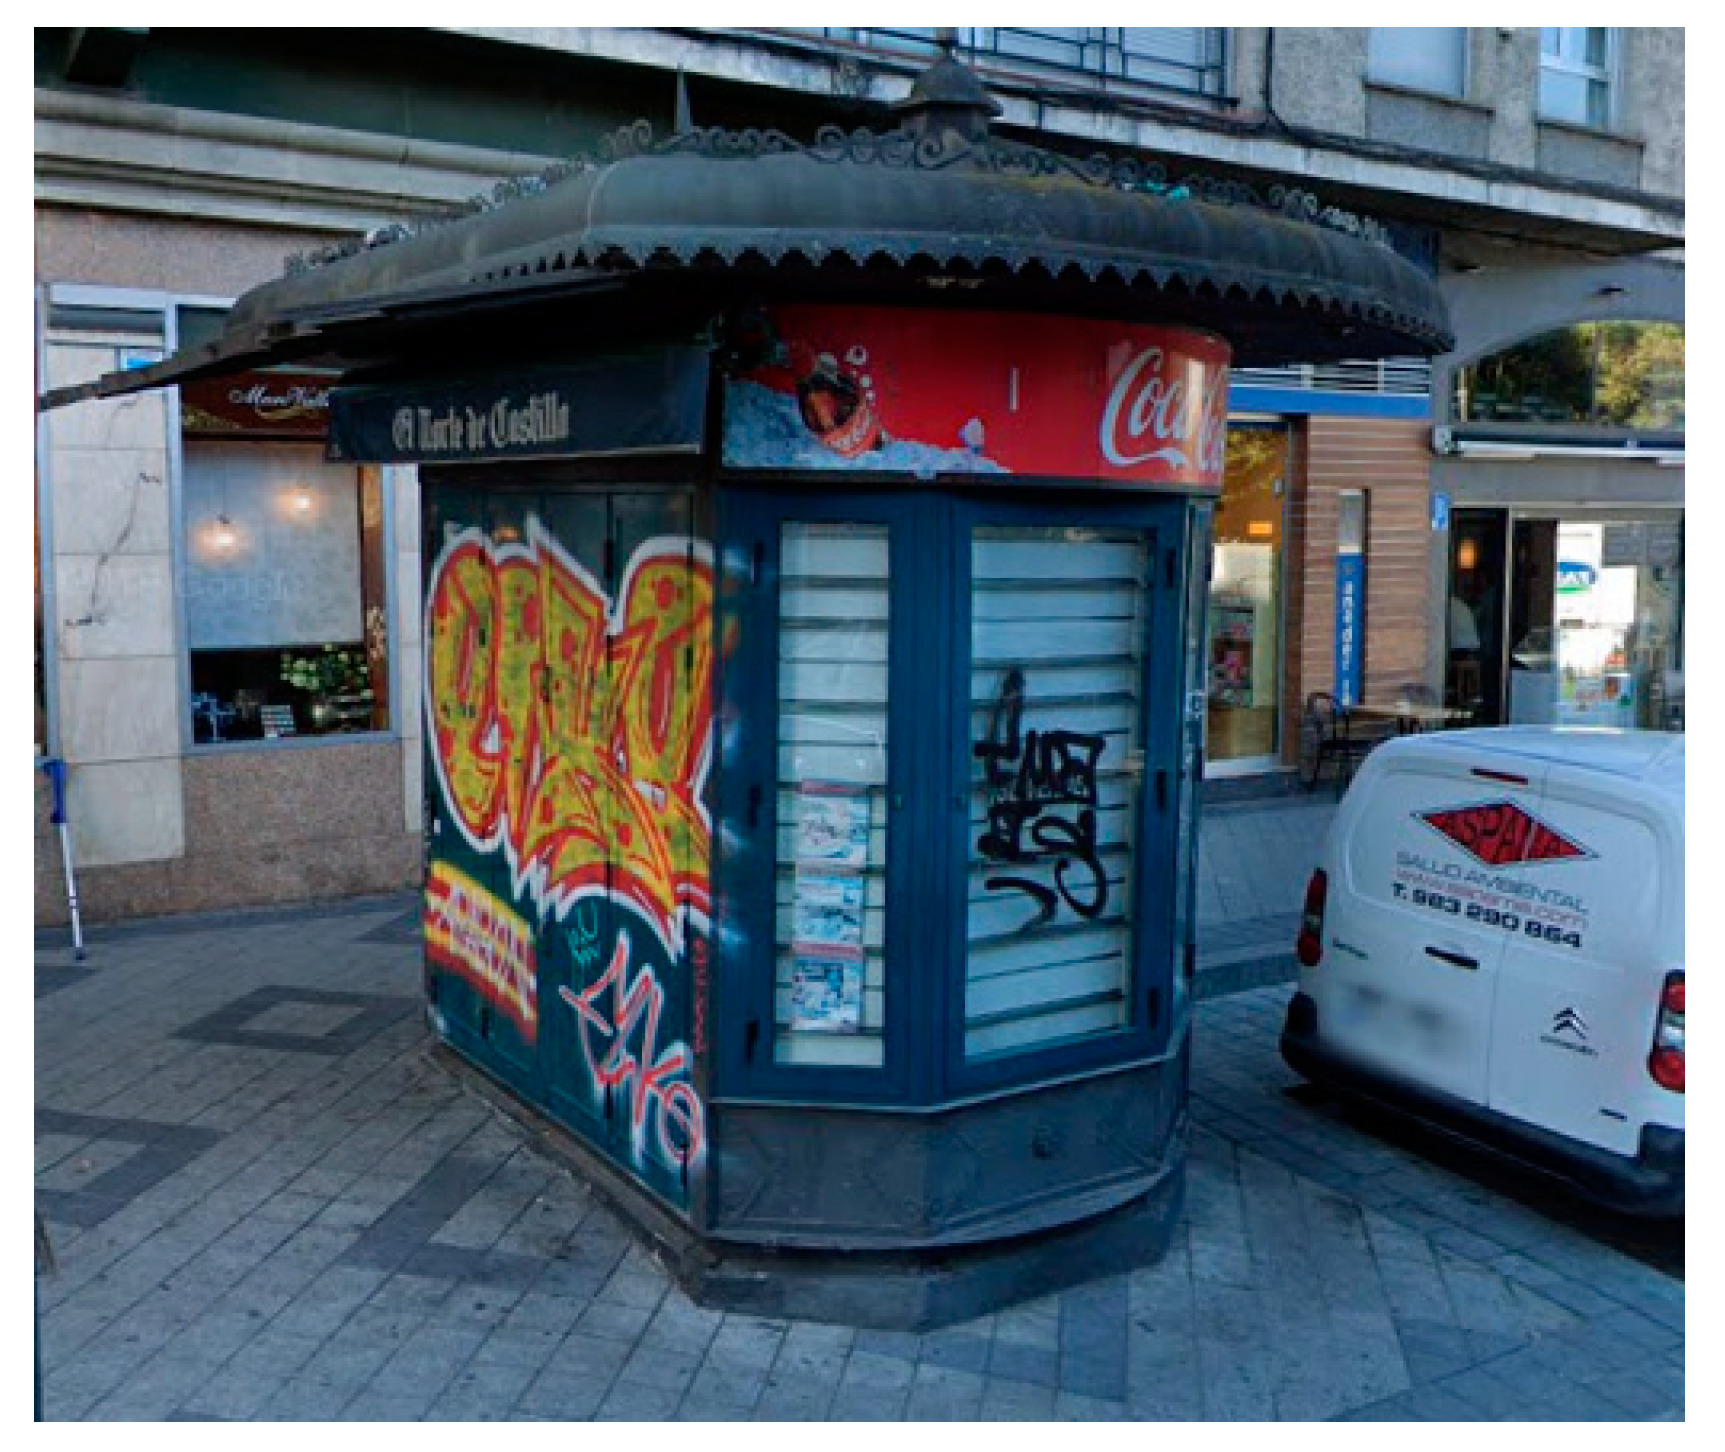
As previously mentioned, change in consumer habits and subsequent e-commerce growth are driving the need to improve delivery system efficiency in large city centers. At the same time, this change in consumer habits is also responsible for more and more newspaper kiosks currently abandoning their activity due to consumer loss of interest in their traditional activity (Figure 3).
The spaces occupied by the kiosk are owned by the City Council. At some point, the City Council made a long-term concession and allowed kiosks to be installed in these spaces. That is, kiosk operators were awarded the concession to operate a kiosk in that space for a long period of time, i.e., several decades, but not actually as a rental. After the space was licensed, operators bought and installed their own kiosks. As this is not a rental, but a concession, if and when the kiosk eventually goes out of business, the operator has two options: to try to sell the kiosk as a whole to somebody else (i.e., space plus structure); or to dismantle the whole structure and return the space in its original condition to the City Council. The second option is generally costly, which is why kiosk owners normally prefer the first option: shutdown and try to sell the kiosk to another operator. This fact explains why there are so many ‘abandoned’ kiosks throughout the city today (Figure 3). These kiosks are shut and abandoned despite them occupying privileged locations (i.e., they are easily visible and accessible, and are situated in transit areas close to other uses and services in the city, etc.). Several studies suggest that places with such characteristics are desirable as locations for parcel lockers, as choosing the appropriate location is one of the most important success factors for this delivery method [11,12,13].
In this context, the objective of this paper is to propose a last-mile delivery model that exploits the current available kiosk network by using them as parcel lockers. Our proposal consists in incorporating parcel lockers attached to each currently existing kiosk in the city (whether they are operational, or their business has ceased). To demonstrate the benefits of this proposal, we offer a case study conducted in the city of Valladolid (Spain) in which we simulate and compare the environmental impact of traditional home delivery and the proposed model that reuses old kiosks as parcel lockers. The necessary steps to carry out simulations are described in detail so that experiments can be replicated in other cities that face the same issues.
The rest of the paper is structured as follows. Section 2 provides a literature review. Section 3 describes the process followed to build the model and to design the experiments. Section 4 shows the results of simulations, which we use to compare the environmental impact of the delivery method herein proposed with traditional last-mile delivery methods. Finally, Section 5 provides discussion and conclusions.
2. Literature Review
Studies of the use of automated lockers as an alternative to home delivery have focused mainly on three topics: efficiency from the shipping company’s point of view (Table 1); optimal design/location of lockers (Table 2); consumers’ intention to use parcel lockers (Table 3).
By analyzing recently published related works, we conclude that although the proposal to use lockers for last-mile delivery is not new, it is only in the last few years that it has been paid attention to, for the advantages their use brings to large cities.
The use of lockers as a last mile-delivery method is a current global topic. However, the success of its application eventually depends on local characteristics (e.g., layout of city streets, local e-commerce demand, etc.). Therefore, it may be too early to generalize the conclusions drawn by recent literature on the topic because many of these studies have focused on specific cities. Nonetheless, we consider that complementing previous studies with the results of simulating locker-based last-mile deliveries in other cities is an important opportunity to contribute to general knowledge about the advantages of this delivery type. Hence this paper simulates last-mile delivery by considering the peculiarities of the city of Valladolid (Spain) regarding both the use of parcel lockers and traditional home delivery.
The literature shows that the location of parcel lockers is one of the key factors in their success (Table 3). In fact many studies have focused on finding the optimal locker location (Table 2). These studies propose deploying new infrastructure in the city but, to the best of our knowledge, no previous study has proposed reusing urban infrastructure to facilitate the deployment of parcel lockers. Reusing urban infrastructure is a way to achieve sustainable urban development as it avoids waste generation due to demolition, and allows a better use of embodied energy, which suggests socio-economic benefits [28]. In fact in a recent review on sustainability principles and trends in modern cities, city logistics have been identified as one emerging area of innovation towards a sustainable transportation strategy [29]. For this reason, and from our point of view, these developments need to be accompanied by improvements in last-mile delivery in the interest of urban sustainable development. Moreover, reusing the current network of newspaper kiosks could help to meet this goal.
3. Methodology and Inputs
Valladolid is a medium-sized city in northwest Spain. Its population is almost 300,000. Figure 4a is a map showing the historic district of this city. Like most European cities, the urbanization of the historic city center began in ancient times, and has resulted in characteristic narrow streets with an erratic layout. This area has traditionally suffered intense traffic because most of the city’s economic activity takes place in the historic district. In recent years, e-commerce growth has brought an increasing number of delivery vans to these streets. This fact has made the problem worse, not only due to increased traffic burden, but also to the shortage of parking spaces for delivery vehicles. Regardless of the other benefits discussed below, reusing kiosks as parcel lockers can mitigate the traffic blockage problem associated with door-to-door deliveries: double-parking issues will reduce as kiosks currently maintain their parking spaces for press delivery (Figure 4b), which could be reused by parcel delivery vehicles.
To demonstrate the environmental benefits of reusing kiosks as parcel lockers, we built a model to simulate parcel delivery in the city of Valladolid, as both traditional door-to-door delivery and by reusing the current existing kiosk networks as parcel lockers. In both scenarios, we compare the total distance traveled by delivery vehicles and subsequent CO2 emissions. The remainder of this section describes how the model was built and how simulations were designed.
3.1. Generation and Distribution of Consumer Demand
To perform simulations, we first need to estimate the number of parcels that are typically delivered in the city of Valladolid during a 1-day period and the spatial distribution of that demand. However, the actual delivery locations are sensitive information that the companies we contacted are not willing to provide, mainly for legal reasons. Consequently, we needed to find an alternative way to find out how many deliveries are made daily in each city neighborhood.
To do so, our starting point was a dataset from an official report by the Spanish National Commission of Markets and Competence [30]. This report provides statistics on the number of orders placed per person over a 6-month period in Spain as a whole. By assuming that courier companies perform deliveries seven days a week, we divided these figures by 180 and found that the average number of daily deliveries per 1000 people was approximately 15 in the whole country. We then extrapolated this information to the city of Valladolid (with a current population of 287,195) to obtain an estimation of 4321 deliveries per day. This estimate of the number of daily orders matches the information provided by the delivery companies we contacted for this study (note that we cannot make the exact information provided by courier companies public).
The next step was to distribute this demand of 4321 daily deliveries throughout the city. To do so, we hypothesized that the number of deliveries in each neighborhood would be proportional to its population.
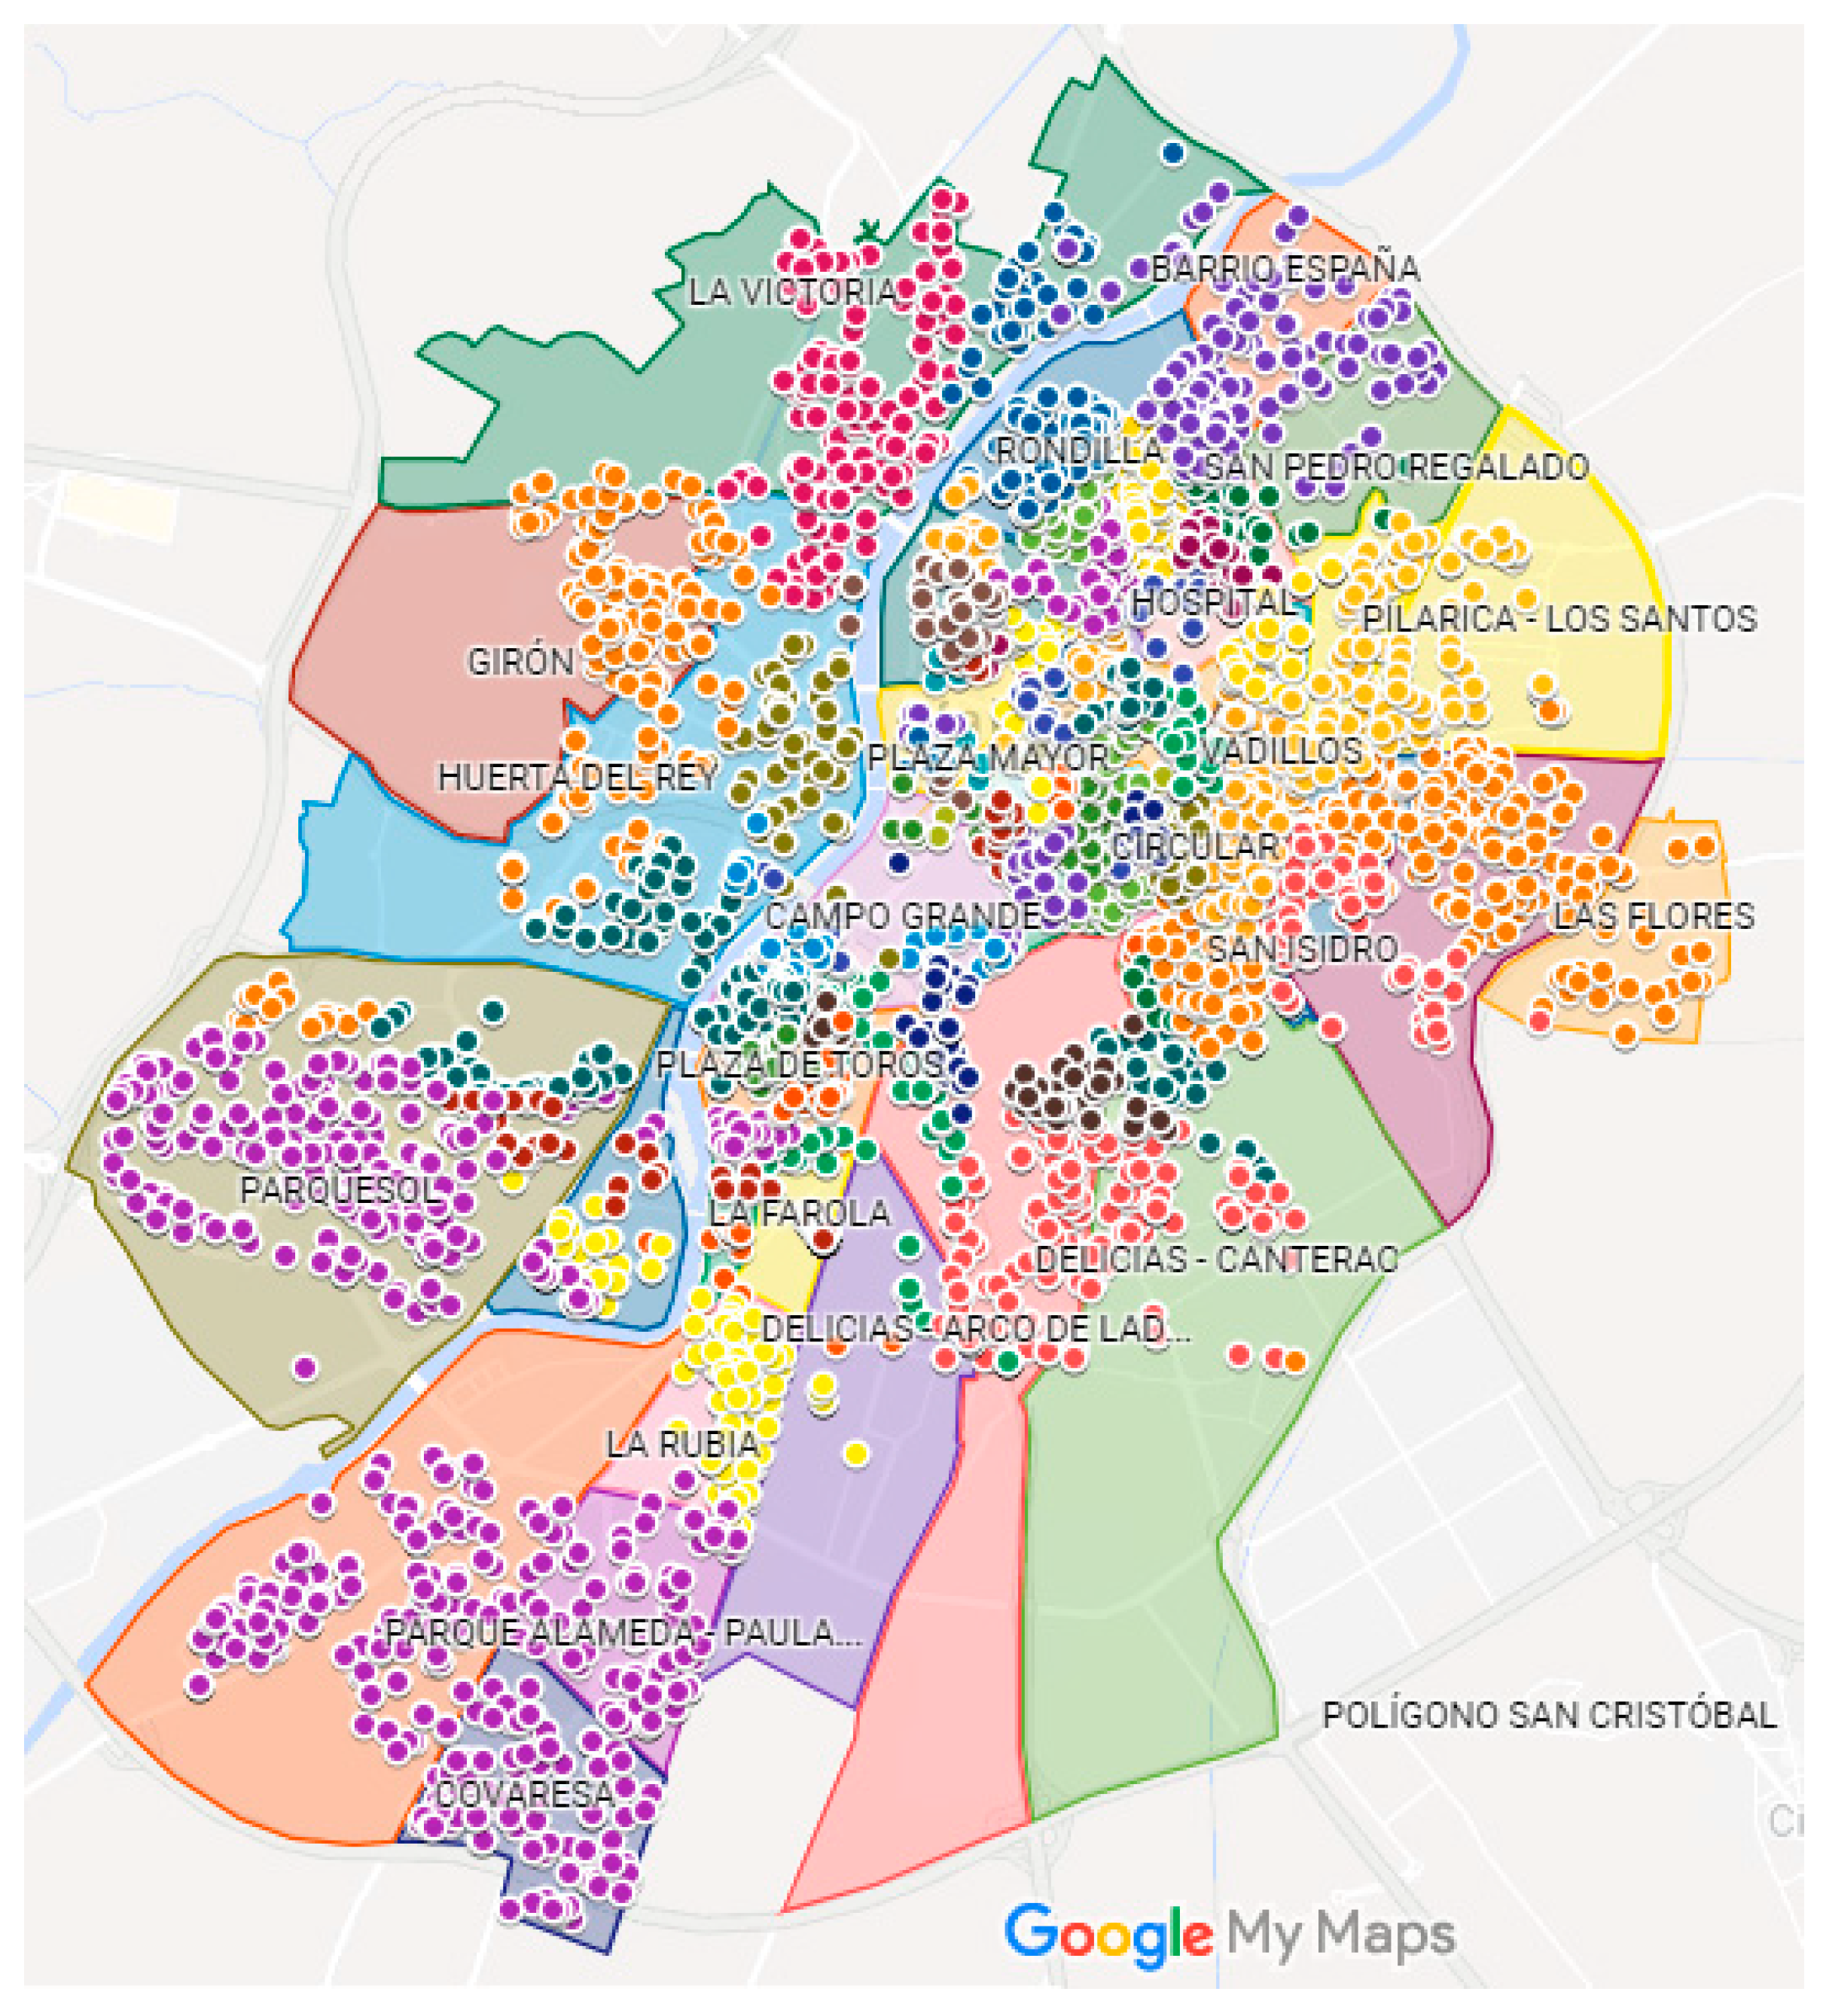
Table 4 shows the number of delivery requests per neighborhood that we considered in the simulation. The locations of these neighborhoods are shown in Figure 5.
Having obtained an estimation for the number of deliveries per neighborhood, we used a combination of Microsoft Excel and Google Maps to generate random delivery locations. In each neighborhood, we generated as many random locations (i.e., client addresses) as there were delivery requests (see Table 4). To randomly distribute requests in a neighborhood, we used Google Maps to obtain the coordinates of the square that approximately encompassed that neighborhood. Then we used Microsoft Excel to generate random locations within the coordinates of that square. These random locations represent the customers awaiting a parcel.
Note that some of the points obtained by this procedure were not valid for our study because their geographical coordinates were not appropriate for an address where delivery could be expected (e.g., rivers, parks, etc.). These were discarded.
This procedure allowed the number of delivery requests in a neighborhood to be proportional to its population. Figure 5 shows the location of the random delivery points generated for the simulation. An interactive map with this information is available at: https://www.google.com/maps/d/u/0/viewer?mid=1cLBXHpdGGSUEO5mgPpU3n_5jpcUK0WpF&ll=41.62389025336443%2C-4.653338689314721&z=13.
The number of delivery points per neighborhood corresponds to the figures in Table 4.
Regardless of the neighborhood to which each delivery location belonged, the 4321 daily orders were randomly allocated to one of the five couriers that currently operate in Valladolid. The number of parcels allocated to each company was made proportional to the company’s market share (Table 5).
3.2. Calculation of Traveled Distance and Emissions
Each company must take a route through the city to allow it to complete the deliveries assigned to it (Table 5). By calculating the total distance that needs to be traveled by all companies in order to complete all deliveries, we obtained an estimate of the total daily CO2 emission based on a delivery vehicle’s typical CO2/km emission.
We simulated the traveled distance (and the consequent CO2 emissions) in two scenarios that we later compared. In the first scenario, we simulated traditional door-to-door delivery, in which the delivery person needed to travel to recipient addresses to make deliveries. In the second scenario, we assigned a parcel locker (i.e., newspaper kiosk) to all the recipients, and the delivery person simply needed to visit a number of kiosks where parcels were delivered.
In either scenario, each company must visit a succession of locations all day long to make their deliveries (i.e., home addresses in the first scenario, newspaper kiosks in the second). To do this, for each company we calculated a route that allowed them to travel through that succession of locations in the shortest possible time. We calculated this route by applying a Traveling Salesperson Problem (TSP) [31] for each delivery company. The TSP is a classic combinatorial optimization problem whose goal is to find the lowest-cost route (in our case, the shortest time route) in which a whole succession of nodes (delivery points in our case) is visited.
To apply the TSP, we first needed to calculate the time/distance that it takes for a delivery vehicle to travel from each node (i.e., delivery point) to all the other nodes to be visited by the delivery company. We used Graphhopper for this purpose [32]. By providing Graphhopper with a matrix that contained the location of all the nodes to be visited by each company, it returned two matrices with the time/distance that it takes to travel from each node to all the other nodes that are to be visited.
Having obtained these matrices, we applied the TSP to find the route that each company might have to follow in order to complete the delivery route. To solve this optimization problem, we used the Solver tool embedded in Microsoft Excel 2019. By employing the matrices obtained from Graphhopper as input, the objective function to be minimized was the time it took to travel through all the nodes assigned to a delivery company with a condition: no nodes can be revisited, and the origin and end of the route must be the company’s warehouse. We applied this same procedure to find the best route to complete deliveries in both scenarios (i.e., home delivery and delivery with parcel lockers).
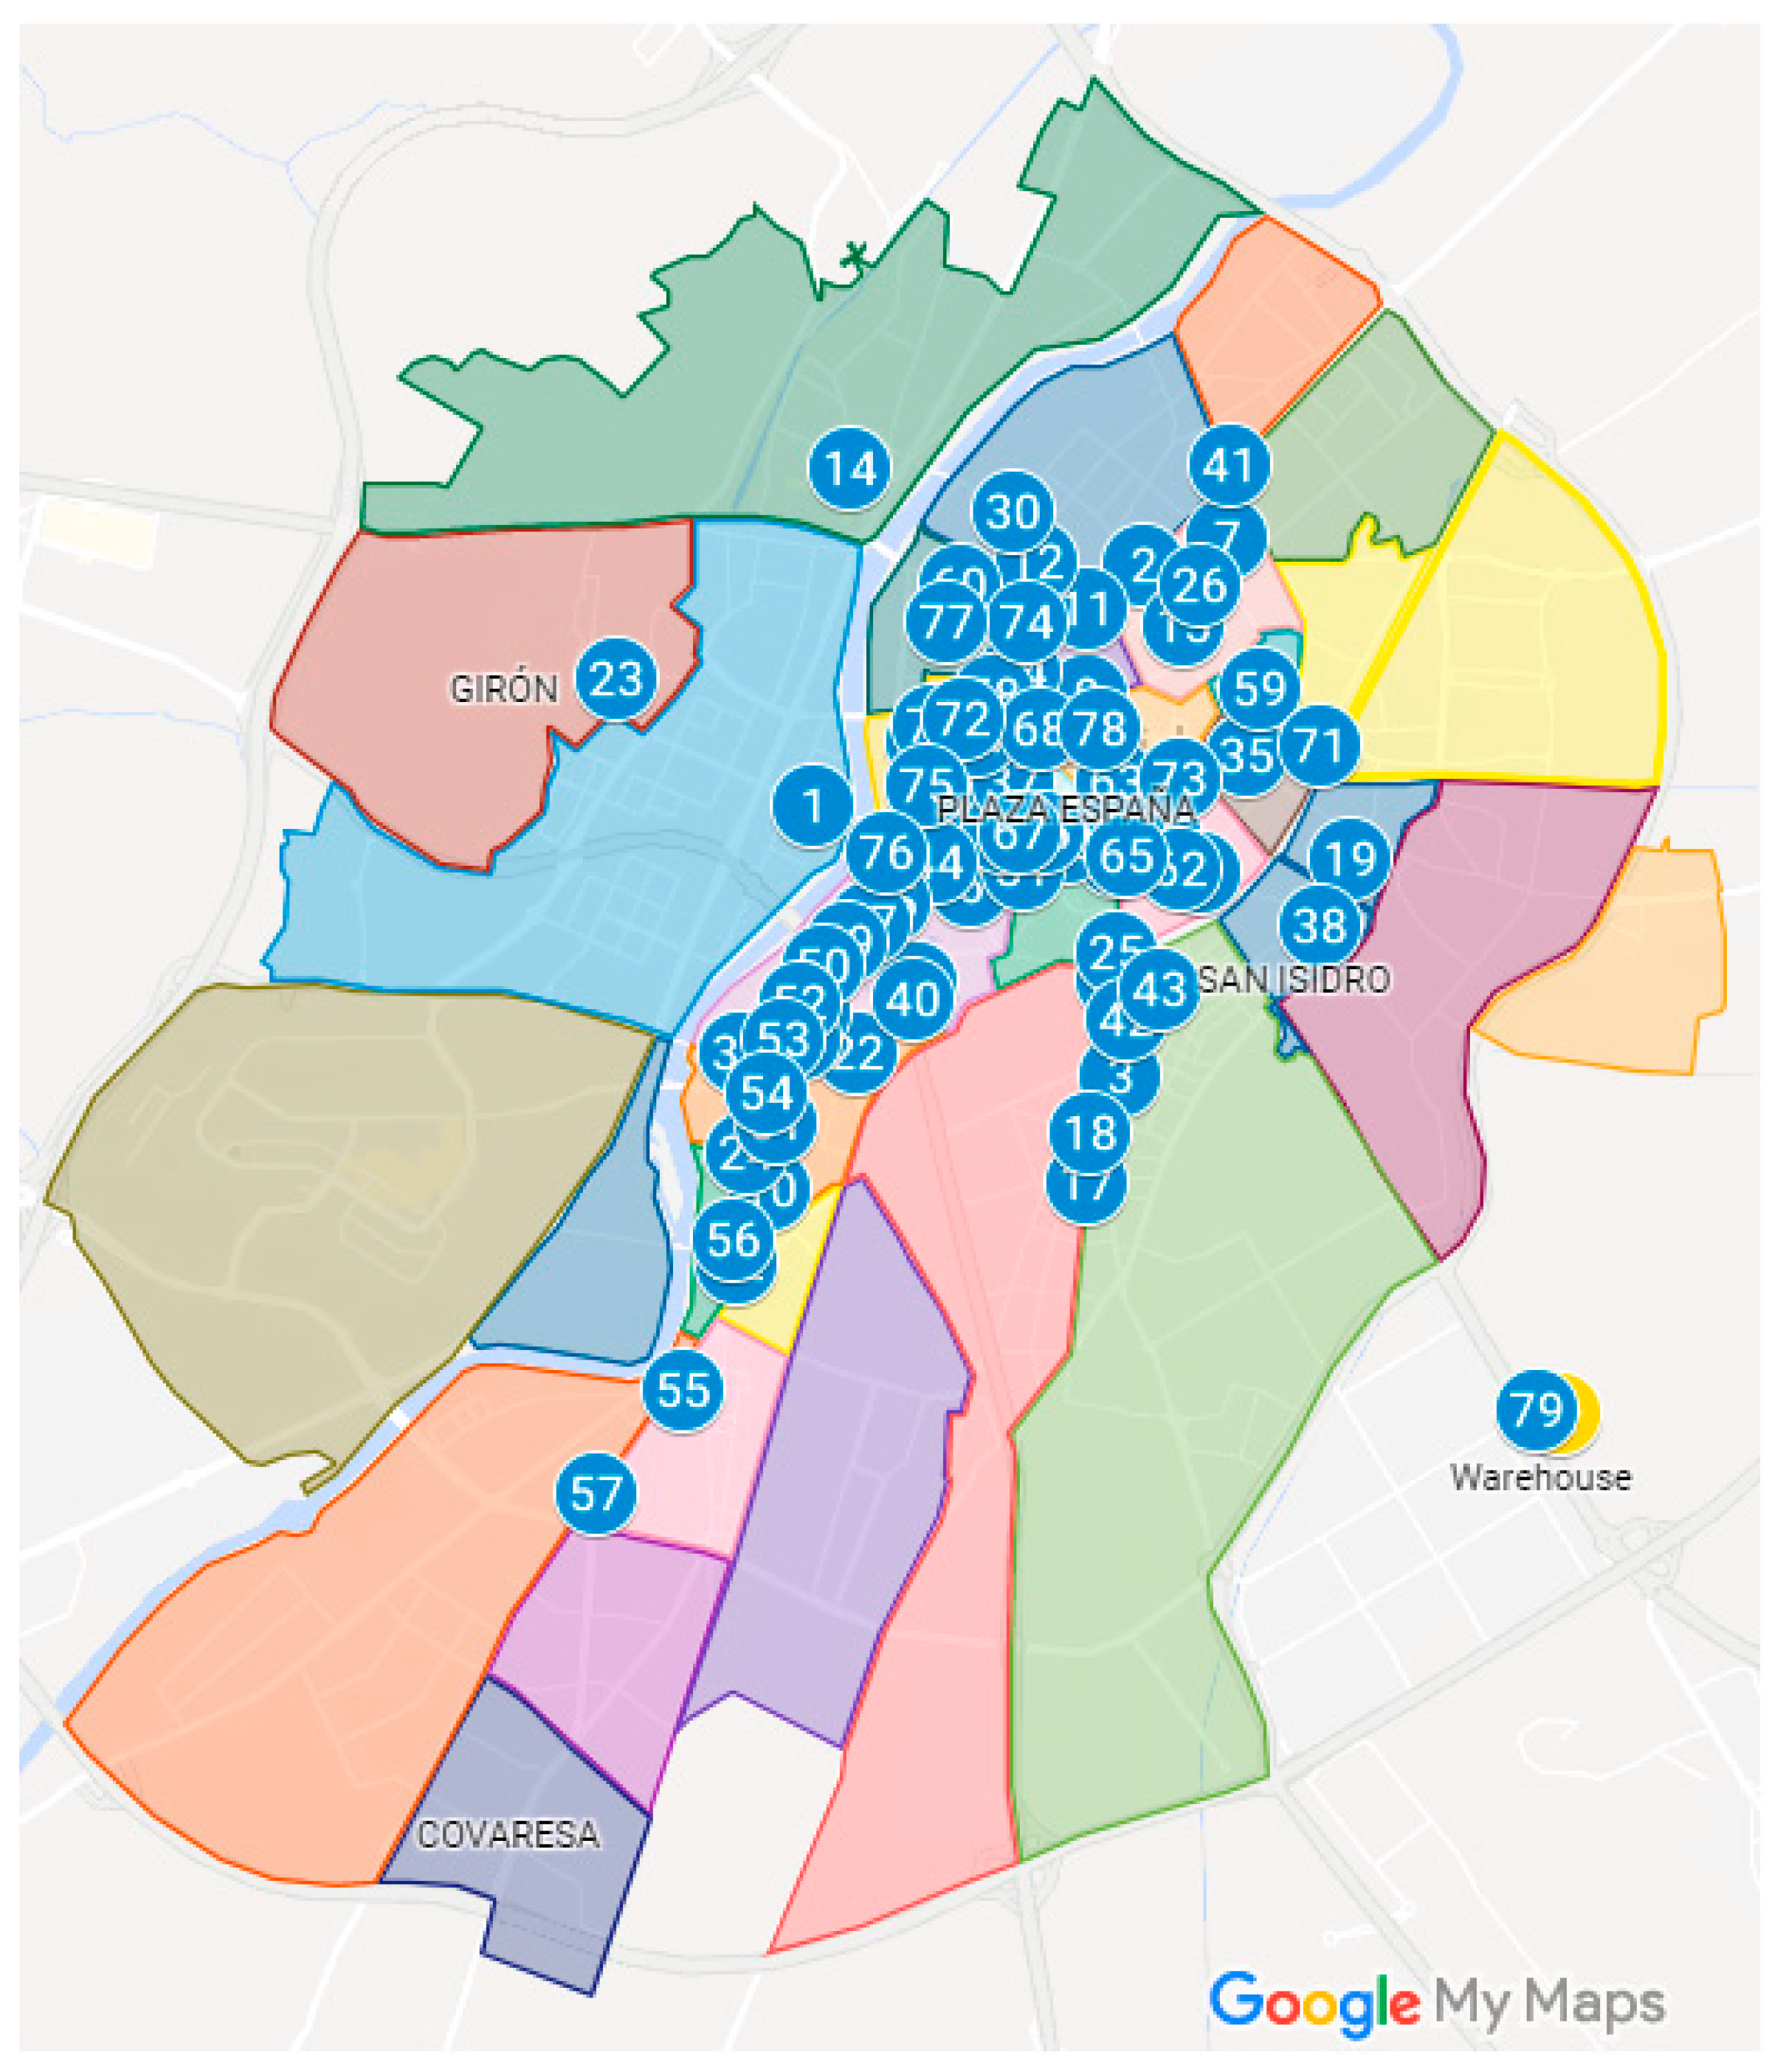
To simulate delivery with parcel lockers (i.e., kiosks), we obtained the geographic coordinates of every newspaper kiosk in Valladolid. More specifically, we searched for the exact coordinates of the loading/unloading parking spaces next to kiosks (Figure 4b) to obtain more realistic results. More often than not two kiosks are physically located close to one another, but the time it takes to drive from one to the other is long because of the particular street layout and traffic direction (e.g., two kiosks located in front of one another, but on opposite sidewalks). Therefore, it is important for the study to determine the exact coordinates of the parking space that could be used by delivery vehicles, especially for kiosks standing on corners (the commonest case).
In both scenarios (i.e., regardless of whether the delivery method is door-to-door or using lockers), the initial and end points of delivery routes were set at the entrance of the industrial park where the warehouses of all the delivery companies are located. This point and the location of the 78 newspaper kiosks currently available in Valladolid are shown in Figure 6.
For the simulation of deliveries in both scenarios, the following assumptions were made: the maximum capacity of a delivery vehicle is 300 parcels (as also considered by [15]) and delivery persons work an 8-h day. In the first scenario (home delivery), we contemplated that the average time that it takes to deliver a parcel is 5 min (this information came from the local delivery companies that we contacted).
To estimate CO2 emissions, we took the value of 147 g of CO2 per kilometer as a reference, which is the European Commission’s 2020 target for light commercial vehicles [33]. In both scenarios, once we knew the distance traveled by each company, we estimated the associated CO2 emissions by multiplying that distance (in km) by 147 g/km.
4. Results
To demonstrate the environmental benefits of reusing kiosks as parcel lockers, this section shows the results of simulating a daily parcel delivery in Valladolid in both traditional door-to-door delivery (Section 4.1) and reusing the current existing kiosk networks as parcel lockers (Section 4.2). With this information, we compared the environmental impact (measured in terms of the total distance traveled by each company and the corresponding CO2 emissions) in both scenarios.
4.1. Scenario 1: Home Delivery
In this scenario, each delivery company must visit all the random delivery locations that were assigned to them according to Table 5. As these locations are known (Figure 5), we attempted to find the optimal route that would allow each company to cover the succession of delivery locations in the shortest possible time by applying a TSP.
Afterwards, the route obtained for each company was divided into several segments (i.e., trips) by estimating the number of parcels that could be delivered by a single vehicle. Recall that we considered that a delivery person works an 8-h day. By assuming that each delivery took an average time of 5 min, the number of deliveries to be made on a working day was 96. Therefore, our simulations contemplated that the maximum number of deliveries per trip was 96. Consequently, after delivering that number of parcels, we considered that the vehicle would necessarily need to return to the company’s warehouse.
For each trip (during which up to 96 parcels are delivered), we calculated the distance it took to drive from the company’s warehouse to the first client’s address on that trip, plus the distances between the subsequent clients on that trip, plus the distance from the last client’s address on that trip to the company’s warehouse.
Table 6 shows the number of trips into which each company’s route was divided. For each trip, this table provides the number of delivered parcels, the traveled distance and CO2 emissions. The numbers indicating the trip in the second column of this table include a hyperlink to visualize the trip with OSRM (Open Source Routing Machine).
In this door-to-door delivery scenario, the simulation showed that the total distance to be covered by all five companies was 4137.2 km, which means CO2 emissions of 608.2 kg per day.
4.2. Scenario 2: Reusing Newspaper Kiosks as Parcel Lockers
By taking the same random delivery locations for the recipients generated in Scenario 1 (Figure 5), we calculated the newspaper kiosks (i.e., lockers) that were more closely located to each customer. For this purpose, we used Microsoft Excel to compute the geometric distance between each random delivery address and the 78 kiosks in the city. In this way, we allocated the closest kiosk to each costumer. Details of this allocation process are shown in Figure 7. An interactive map with this information is available at: https://www.google.com/maps/d/u/0/viewer?mid=1cLBXHpdGGSUEO5mgPpU3n_5jpcUK0WpF&ll=41.649005383764745%2C-4.692187330961466&z=13.
Note that each order was assigned to the same delivery company that it was assigned to in Scenario 1 (according to its market share; Table 5). With this client-to-kiosk allocation, and by considering the company to which each order was assigned, we obtained the list of kiosks (i.e., lockers) that each delivery company must visit and the number of parcels that have to be delivered to each locker. For each company, we performed a TSP to obtain the order in which kiosks should be visited to complete the delivery route in the shortest possible time.
Given the limited capacity of delivery vehicles, it is likely that a company cannot complete all the deliveries that were assigned to it during a single trip. Recall that we assumed that a standard delivery van can carry up to 300 parcels. Therefore, during our simulations, we considered that the maximum number of deliveries per trip was 300. Consequently, after delivering that number of parcels, we contemplated that the vehicle would necessarily need to return from the last kiosk visited to the company’s warehouse to load more parcels. From this point, the vehicle would then go to either the next kiosk on the list or the last kiosk visited during the previous trip, depending on whether all the deliveries assigned to the last visited kiosk were completed during a previous trip or not. This process continues until the company completes all the deliveries that were allocated to it.
For each trip (during which up to 300 parcels are delivered), we calculated the distance that it takes to drive from the company’s warehouse to the first kiosk on that trip, plus the distances between each kiosk and the next kiosk on the trip, plus the distance from the last kiosk on the list to the company’s warehouse. Note that it is not necessary to assume the number of vehicles owned by each company as we computed the total distance traveled by each company (and the associated emissions) based on the number of trips required to complete the deliveries allocated to each company. Therefore if, for example, a company needs to perform three trips to cover its route, we assumed that the following two situations were equivalent in terms of traveled distance and emissions, including the fact that the company deploys three vans that operate at the same, and each one covers one of the three segments of the route; and the fact that the company deploys one single van for the whole route to operate successions of three delivery trips (returning to the warehouse whenever necessary).
Table 7 shows the number of trips into which each company’s route was divided. For each trip, this table indicates the number of delivered parcels, the traveled distance and the associated CO2 emissions. The numbers indicating the trip number in the second column in this table include a hyperlink to visualize the trip by OSRM (Open Source Routing Machine). More detailed information on the route followed by the delivery vehicles on each trip is included in Appendix A.
In this delivery scenario, which reuses kiosks as parcel lockers, the total distance to be covered by all five companies was 406.36 km, which means CO2 emissions of 59.5 kg.
5. Discussion and Conclusions
E-commerce growth is leading to increasing courier company activity. The current COVID-19 pandemic is also leading to substantial changes in online consumption patterns. Recent studies show growing purchases of goods that have been traditionally acquired from local stores, but are now being purchased from online businesses, e.g., food and groceries [34,35,36,37]. It might be too soon to tell whether online consumption will return to pre-pandemic volumes or if these changes in consumer behavior are irreversible [38]. However, it seems clear that the ongoing pandemic is accelerating e-commerce growth [2]. Furthermore, with the ongoing COVID-19 pandemic, organizations need to identify new ways to deliver their products safely with minimal physical contact [39], which provides an opportunity to rethink traditional delivery channels and mechanisms [40].
As far as last-mile delivery is concerned (i.e., transporting goods from the courier’s warehouse to end user addresses), traditional door-to-door delivery leads to traffic-flow problems and health and environmental issues such as noise pollution and CO2 emissions. Furthermore, many of these deliveries fail because the recipient is not home, so they must be repeated.
This paper proposes a last-mile delivery model that uses the current network of newspaper kiosks as parcel lockers. Our proposal consists in incorporating parcel lockers attached to each currently existing kiosk in the city (whether they are operational or their business has ceased). These lockers will be shared by the different logistics companies operating in the city to perform last-mile delivery. In this model, companies simply need to use their vehicles to perform a route through a set of kiosks in a city to complete parcel deliveries.
This approach will allow kiosk operators to combine their traditional business (sale of newspapers, magazines, snacks etc.) and parcel delivery. As kiosks are already have electric supply, there is no need for work to be done in streets to provide this supply. Furthermore, the marginal electricity use required to operate the locker will be negligible compared to the total use in a newspaper kiosk.
To demonstrate the benefits of our proposal, we compared the total traveled distance and the total CO2 emissions generated during a last-mile delivery that uses kiosks as lockers to those generated by traditional door-to-door delivery. For this purpose, we mapped the current network of kiosks in Valladolid (Spain) and simulated a random daily demand of orders through this city based on each neighborhood’s population density.
When parcels were delivered to kiosks, the simulation showed that the total traveled distance by the five transport companies operating in the city was 406.36 km per day, which means daily CO2 emissions of 59.5 kg. However, the traditional door-to-door delivery simulation required a total traveled distance of 4137.2 km, which generated 608.2 kg of CO2 emissions.
The simulations herein performed revealed that if we only considered the benefits from an environmental point of view, the proposed model would involve a reduction of about 90% in the daily CO2 emissions associated with last-mile delivery in the city.
The chosen scenarios for these simulations (i.e., pure door-to-door delivery versus pure delivery through kiosks) are opposite in environmental impact terms (traveled distance and CO2 emissions). Of course, when the project is implemented, some deliveries will be made through kiosks and some will continue to be made on a door-to-door basis. Therefore, the environmental benefits after implementing the project will lie between the figures shown in Table 7 (i.e., strictly home delivery) and those shown in Table 7 (i.e., strictly delivery to kiosks).
Even so, we consider that our approach offers more environmental advantages than the solutions that are individually adopted by some delivery companies: installing their own parcel lockers in places like gas stations or shopping malls. These places are usually located far from customers’ homes, and thus often require using private cars to go to a locker and collect a parcel, which entails additional CO2 emissions. Our approach, however, proposes installing shared locker stations attached to currently existing newspaper kiosks. Given the distribution of newspaper kiosks in the central area of cities, there is a good chance that a newspaper kiosk is located at walking distance from customers’ homes. For example, in Table 8 we show the average distance/time (on foot) from customers’ homes (based on randomly generated delivery locations, Figure 5) to the closest kiosk (Figure 6). These figures were calculated by using OSRM (Open Source Routing Machine).
Using a private car to collect parcels at a kiosk is not convenient in the central city areas (i.e., most of the neighbors in Table 8) because of traffic burden, and especially due to the lack of parking places near kiosks. In suburbs, where finding a parking place is not an issue, and also in those places where kiosks are not as abundant (e.g., neighborhoods with IDs 1, 2, 10, 12, 15, 18 19, 22 or 23 in Table 8), it is reasonable to assume that some customers would decide to use their cars to collect parcels. However, according to some recent studies on customers’ usage of parcel lockers ([41,42]), many locker users would decide to collect their parcels on their way to work or while running other errands. Consequently, using a car to drive to a kiosk does not always mean increasing traffic or CO2 emissions. Table 8 can also help to determine the city areas where more kiosks/lockers should be installed to facilitate implementing parcel delivery through lockers.
Apart from the environmental advantages discussed above, reusing kiosks for last-mile delivery also offers advantages for other stakeholders:
- Users: they will be able to pick up their packages at their convenience as the kiosk network is well distributed in their city. The need to leave their home to pick up a parcel can be an inconvenience for some users. However, this can also spell some advantages: no need to worry about the time when parcel deliverers arrive (normally without warning, etc.). In some cases, users will not have to go to the locker expressly because they can pick up the package on their way to work or while running other errands.
- Logistics operators: they will reduce the number of trips. In an ideal case, if 100% deliveries were made through lockers, there would be no movements other than from warehouses to the locker network and back. The practice of driving around the city searching for an address, which has an impact on company costs, would be no longer necessary. Performing second delivery attempts as the recipient is not home would no longer be required.
- Citizens: CO2 emissions will lower thanks to the shorter traveled distances required to complete parcel delivery. Consequently, noise pollution will also lower. This will also mean a positive contribution to traffic flow in urban areas as fewer delivery vehicles mean faster moving traffic and less improper parking for deliveries.
- The municipality: it will recover an iconic element of urban equipment, which is currently in disuse, which it does not need to maintain, and currently offers a poor image for the city. The concessions and appreciations of this equipment would be reactivated with the new uses for kiosks.
- Kiosk owners (either working or shut kiosks): these assets will generate income as they will be used as parcel lockers. Note that our model contemplates the possibility of complete or partial use, which would facilitate those kiosks that still distribute press and other reading material to extend their services as a parcel delivery point.
- Local companies in the city of Valladolid: they could act as suppliers for conditioning and rehabilitating kiosks.
- Non e-commerce stores: the proposed delivery model can also be extended to incorporate the delivery of local stores (i.e., without logistics operators intervening).
Our study, however, has its limitations. The number of daily delivery requests and their distribution throughout the city are based mainly on each neighborhood’s population. This means that the simulated experiments assumed that the most populated neighborhoods would demand more deliveries, which is not necessarily true because other factors affect e-commerce demand (e.g., culture, gender, age, etc.). This study also assumes a uniform distribution of delivery requests in each neighborhood (i.e., it does not take into account which areas in each neighborhood are more likely to demand more deliveries due to, for example, more income). Although we wished to perform simulations with real data obtained from delivery companies, we found that these companies were unwilling to provide this information for legal reasons. The availability of the actual number of delivery requests per neighborhood would have allowed us to obtain more precise results about the number of required trips, total traveled distance or CO2 emissions. However, more precision in these estimations would not make much difference to the advantages of the proposed model, which have been discussed above. As the two delivery types (i.e., that proposed and based on delivery to kiosks and the traditional one based on door-to-door deliveries) were simulated and compared to the same data according to the same hypothesis, the obtained results help to illustrate the benefits of the proposed model. In any case, if this model is applied in other cities, the availability of real data for delivery demand could mean more precise results for the city to which it is applied.
We also considered an unlimited capacity for locker stations. Although the dimensions of lockers is beyond the scope of this study, we would like to highlight one aspect that should be taken into account when sizing parcel lockers: it cannot be assumed that all parcels will be collected on the same day that they are delivered to lockers by couriers. This fact reduces the locker’s practical capacity. One way of handling these issues while implementing the project is to estimate the number of consumers who will not collect their parcels within 24 h and subtract that number from the locker’s real capacity. This would give us an idea of the actual number of parcels that can be deposited daily in each locker if we assume that this proportion of customers who do not collect their parcels on the same delivery day remains constant over time.
Some results of our simulations depend on the actual values of certain parameters. For example, with home delivery, we considered an 8-h working day and an average delivery time of 5 min. We decided to use these values based on informal conversations held with local courier companies. Considering an average delivery time of 5 min means that a delivery person can handle 96 parcels, i.e., the vehicle needs to return to the warehouse after completing 96 deliveries; (Table 7). On the other hand, in the case of delivery through lockers, we assumed that the maximum capacity of a delivery vehicle is 300 parcels (as assumed also by other studies, which is also consistent with the information provided by local couriers). This means that when deliveries are made on a locker basis, the vehicles need to return to the warehouse after completing 300 deliveries (Table 7). Choosing different values for these parameters would change the results of simulations slightly (in terms of traveled distance and, consequently, CO2 emissions). For example, contemplating a shorter working day or a longer delivery time would mean that the number of parcels to be delivered on each trip would be lower than 96 in the case of home delivery (Table 7); and considering a vehicle with a smaller capacity would mean that the parcels to be delivered on each trip would be lower than 300 when kiosks are used as lockers (Table 7). Consequently, each courier would need to run more trips from the warehouse to downtown and back to complete its daily deliveries. These extra trips, however, would not mean a significant increase in traveled distance and, consequently in CO2 emissions, as the highest contribution to distance (and emissions) is due to driving around the city performing door-to-door delivery rather than driving to and from the warehouse. Nevertheless, based on the results of our study, we can easily obtain a rough estimate of the additional traveled distance/emissions associated with other values of the parameters. A longer average delivery time per parcel or a smaller vehicle size would result in additional trips for each courier. One round trip from the warehouse to downtown entails an average distance of 8 km. Consequently, each extra trip would mean an additional distance of 8 km (i.e., 1.2 kg CO2), which is reasonably negligible compared to the total traveled distance and CO2 emissions obtained in the results of our study.
Given the ongoing COVID-19 pandemic, a non face-to-face last-mile delivery based on lockers is probably safer than the traditional home-to-home delivery as it facilitates social distancing. Although locker stations would be accessed by many people, the City Council would be responible for cleaning (and also disinfecting) the surroundings of lockers (as they currently clean these surroundings), whereas kiosk operators would be responsible for cleaning inside lockers. Some logistic operators are currently performing an alternative last-mile delivery in which parcels are not directly delivered to final customers, but are left in stores/businesses located near customers’ homes. The approach that we herein present is safer from a health point of view because it does not require an employee handing out parcels to customers, which thus facilitates social distancing. Furthermore, the lockers installed and attached to kiosks would be available 24/7 and no particular security-related issues are expected because newspaper kiosks are located in transited city areas.
Currently, some logistics operators and e-commerce companies have their own developments for the last-mile delivery of goods through lockers. However, the existing newspaper kiosks network can serve several operators and take advantage of synergies. From the circular economy paradigm, the aim is to provide an integrated solution in several stages that is optimal for users (companies and customers) and Public Administrations. Given the scalability of this proposal, it can be easily replicated and applied in other cities.
Author Contributions
Conceptualization, J.M.G.-V. and A.R.; methodology, D.P. and F.V.; software, F.V.; validation, F.V., D.P., F.A., A.R. and J.M.G.-V.; formal analysis, J.M.G.-V. and F.A.; investigation, D.P., F.V. and F.A.; resources, J.M.G.-V.; data curation, F.A. and F.V.; writing—original draft preparation, D.P.; writing—review and editing, F.V., D.P., F.A., A.R. and J.M.G.-V.; visualization, F.V.; supervision, A.R. and F.A.; project administration, F.A. and A.R.; funding acquisition, J.M.G.-V. All authors have read and agreed to the published version of the manuscript.
Funding
This research was funded by Project “ABARNET”, financed by the Spanish Ministry of Economy, Industry and Competitiveness with grant number DPI2016-78902-P and by Project “Transformación Digital y Circular de los Kioscos” financed by the Valladolid City Council with grant number AI-19/2018.
Acknowledgments
The authors are grateful to Professors Cesáreo Hernández, Adolfo López-Paredes, Javier Pajares, Natalia Martín-Cruz, José Manuel Galán-Ordax, Ricardo del Olmo and José Manuel Pérez Ríos for their valuable comments. The authors would also like to thank Nuria Sáez López for her administrative work and her support in procuring the materials used in the experiments. The authors are grateful to the anonymous reviewers for carefully reading our manuscript and their many insightful comments and suggestions. The usual disclaimer applies.
Conflicts of Interest
The authors declare no conflict of interest.
Appendix A
The following five tables show the details of the trips to be followed by the five delivery companies considered herein when newspaper kiosks are reused as delivery lockers.
The numbers indicating the trip number in the first column of these tables include a hyperlink to visualize the trip by OSRM (Open Source Routing Machine). The second and third columns display the ID of the node (i.e., the 78 kiosks currently available in the city) to be visited. Note that node number 79 represents the location of the courier’s warehouse and is, consequently, the node from which each trip starts and ends. The fourth and fifth columns respectively show the distance traveled from the source node to the destination node, and the number of delivered parcels at the destination node.
For each trip, we show the sequence of visited kiosks (nodes). Please bear in mind that each vehicle has a limited space for 300 parcels. When all 300 parcels are delivered, the vehicle must return to the company’s warehouse (i.e., node 79) to load more parcels. From this point, the vehicle will then go to either the next kiosk on the list or the last visited kiosk during the previous trip, depending on whether all the deliveries assigned to the last visited kiosk were completed during the previous trip or not. This process continues until the company completes all the deliveries allocated to it. A summary of the total traveled distance and the number of delivered parcels per trip is also calculated for each trip.

Table A1.
Sequence of newspaper kiosks visited by Courier 1.
| Trip Number | Source Node | Destination Node | Distance (m) | Delivered Parcels |
|---|---|---|---|---|
| 1 | 79 | 43 | 2862 | 33 |
| 43 | 42 | 188 | 1 | |
| 42 | 18 | 582 | 28 | |
| 18 | 17 | 219 | 91 | |
| 17 | 3 | 554 | 10 | |
| 3 | 38 | 1239 | 54 | |
| 38 | 19 | 468 | 83 | |
| 19 | 79 | 3091 | - | |
| TOTAL | 9203 | 300 | ||
| 2 | 79 | 19 | 2957 | 21 |
| 19 | 69 | 3332 | 2 | |
| 69 | 70 | 399 | 5 | |
| 70 | 77 | 839 | 32 | |
| 77 | 14 | 886 | 89 | |
| 14 | 30 | 2202 | 68 | |
| 30 | 60 | 506 | 15 | |
| 60 | 74 | 402 | 12 | |
| 74 | 12 | 251 | 18 | |
| 12 | 72 | 1084 | 4 | |
| 72 | 20 | 224 | 2 | |
| 20 | 68 | 185 | 9 | |
| 68 | 34 | 405 | 13 | |
| 34 | 11 | 1079 | 10 | |
| 11 | 79 | 4604 | - | |
| TOTAL | 19,355 | 300 | ||
| 3 | 79 | 11 | 4469 | 9 |
| 11 | 15 | 487 | 10 | |
| 15 | 26 | 256 | 9 | |
| 26 | 41 | 973 | 72 | |
| 41 | 7 | 376 | 20 | |
| 7 | 2 | 772 | 47 | |
| 2 | 73 | 1027 | 16 | |
| 73 | 27 | 695 | 17 | |
| 27 | 5 | 1012 | 2 | |
| 5 | 6 | 111 | 7 | |
| 6 | 36 | 543 | 4 | |
| 36 | 37 | 190 | 1 | |
| 37 | 13 | 31 | 2 | |
| 13 | 21 | 82 | 2 | |
| 21 | 9 | 668 | 14 | |
| 9 | 8 | 257 | 3 | |
| 8 | 35 | 998 | 28 | |
| 35 | 16 | 508 | 8 | |
| 16 | 63 | 321 | 8 | |
| 63 | 78 | 246 | 11 | |
| 78 | 66 | 508 | 4 | |
| 66 | 67 | 165 | 2 | |
| 67 | 76 | 1152 | 1 | |
| 76 | 1 | 483 | 3 | |
| 1 | 79 | 5636 | - | |
| TOTAL | 21,966 | 300 | ||
| 4 | 79 | 1 | 4900 | 33 |
| 1 | 23 | 1617 | 98 | |
| 23 | 58 | 1897 | 4 | |
| 58 | 75 | 853 | 3 | |
| 75 | 29 | 156 | 2 | |
| 29 | 22 | 1826 | 22 | |
| 22 | 24 | 996 | 21 | |
| 24 | 10 | 516 | 53 | |
| 10 | 51 | 398 | 19 | |
| 51 | 45 | 1478 | 1 | |
| 45 | 50 | 1504 | 6 | |
| 50 | 52 | 524 | 23 | |
| 52 | 53 | 171 | 12 | |
| 53 | 46 | 230 | 3 | |
| 46 | 79 | 4821 | - | |
| TOTAL | 21,887 | 300 | ||
| 5 | 79 | 46 | 5051 | 6 |
| 46 | 48 | 214 | 11 | |
| 48 | 33 | 256 | 64 | |
| 33 | 54 | 409 | 12 | |
| 54 | 56 | 805 | 16 | |
| 56 | 32 | 488 | 25 | |
| 32 | 57 | 1645 | 166 | |
| 57 | 79 | 5587 | - | |
| TOTAL | 14,455 | 300 | ||
| 6 | 79 | 57 | 6207 | 109 |
| 57 | 55 | 966 | 63 | |
| 55 | 44 | 2590 | 1 | |
| 44 | 31 | 1570 | 25 | |
| 31 | 40 | 1739 | 13 | |
| 40 | 39 | 123 | 6 | |
| 39 | 25 | 1473 | 11 | |
| 25 | 4 | 101 | 2 | |
| 4 | 28 | 1149 | 11 | |
| 28 | 65 | 263 | 4 | |
| 65 | 61 | 449 | 50 | |
| 61 | 59 | 1298 | 5 | |
| 59 | 79 | 3954 | - | |
| TOTAL | 21,882 | 300 | ||
| 7 | 79 | 59 | 4077 | 19 |
| 59 | 71 | 614 | 68 | |
| 71 | 62 | 935 | 13 | |
| 62 | 79 | 2900 | - | |
| TOTAL | 8526 | 100 |
Table A2.
Sequence of newspaper kiosks visited by Courier 2.
| Trip Number | Source Node | Destination Node | Distance (m) | Delivered Parcels |
|---|---|---|---|---|
| 1 | 79 | 43 | 2862 | 10 |
| 43 | 42 | 188 | 1 | |
| 42 | 18 | 582 | 8 | |
| 18 | 17 | 219 | 30 | |
| 17 | 3 | 554 | 4 | |
| 3 | 38 | 1239 | 19 | |
| 38 | 19 | 468 | 40 | |
| 19 | 69 | 3332 | 1 | |
| 69 | 77 | 780 | 8 | |
| 77 | 14 | 886 | 35 | |
| 14 | 30 | 2202 | 21 | |
| 30 | 60 | 506 | 9 | |
| 60 | 74 | 402 | 3 | |
| 74 | 12 | 251 | 6 | |
| 12 | 72 | 1084 | 2 | |
| 72 | 68 | 410 | 2 | |
| 68 | 34 | 405 | 5 | |
| 34 | 11 | 1079 | 6 | |
| 11 | 15 | 487 | 4 | |
| 15 | 26 | 256 | 3 | |
| 26 | 41 | 973 | 22 | |
| 41 | 7 | 376 | 8 | |
| 7 | 2 | 772 | 27 | |
| 2 | 73 | 1027 | 7 | |
| 73 | 27 | 695 | 4 | |
| 27 | 5 | 1012 | 1 | |
| 5 | 36 | 654 | 1 | |
| 36 | 37 | 190 | 1 | |
| 37 | 9 | 781 | 2 | |
| 9 | 8 | 257 | 1 | |
| 8 | 35 | 998 | 7 | |
| 35 | 16 | 508 | 2 | |
| 16 | 79 | 3225 | - | |
| TOTAL | 29,660 | 300 | ||
| 2 | 79 | 16 | 3256 | 4 |
| 16 | 63 | 321 | 4 | |
| 63 | 78 | 246 | 5 | |
| 78 | 66 | 508 | 1 | |
| 66 | 1 | 1242 | 18 | |
| 1 | 23 | 1617 | 30 | |
| 23 | 58 | 1897 | 2 | |
| 58 | 75 | 853 | 1 | |
| 75 | 29 | 156 | 2 | |
| 29 | 22 | 1826 | 12 | |
| 22 | 24 | 996 | 11 | |
| 24 | 10 | 516 | 16 | |
| 10 | 51 | 398 | 12 | |
| 51 | 49 | 1484 | 2 | |
| 49 | 50 | 1242 | 2 | |
| 50 | 52 | 524 | 4 | |
| 52 | 53 | 171 | 5 | |
| 53 | 46 | 230 | 1 | |
| 46 | 48 | 214 | 2 | |
| 48 | 33 | 256 | 21 | |
| 33 | 54 | 409 | 3 | |
| 54 | 56 | 805 | 14 | |
| 56 | 32 | 488 | 9 | |
| 32 | 57 | 1645 | 101 | |
| 57 | 55 | 966 | 18 | |
| 55 | 79 | 6329 | - | |
| TOTAL | 28,595 | 300 | ||
| 3 | 79 | 55 | 6041 | 4 |
| 55 | 44 | 2590 | 1 | |
| 44 | 31 | 1570 | 9 | |
| 31 | 40 | 1739 | 5 | |
| 40 | 39 | 123 | 3 | |
| 39 | 25 | 1473 | 3 | |
| 25 | 28 | 1048 | 7 | |
| 28 | 65 | 263 | 5 | |
| 65 | 61 | 449 | 19 | |
| 61 | 59 | 1298 | 8 | |
| 59 | 71 | 614 | 24 | |
| 71 | 62 | 935 | 3 | |
| 62 | 79 | 2900 | - | |
| TOTAL | 21,043 | 91 |
Table A3.
Sequence of newspaper kiosks visited by Courier 3.
| Trip Number | Source Node | Destination Node | Distance (m) | Delivered Parcels |
|---|---|---|---|---|
| 1 | 79 | 43 | 2862 | 5 |
| 43 | 18 | 770 | 6 | |
| 18 | 17 | 219 | 19 | |
| 17 | 3 | 554 | 9 | |
| 3 | 38 | 1239 | 17 | |
| 38 | 19 | 468 | 26 | |
| 19 | 69 | 3332 | 3 | |
| 69 | 70 | 399 | 1 | |
| 70 | 77 | 839 | 10 | |
| 77 | 14 | 886 | 13 | |
| 14 | 30 | 2202 | 12 | |
| 30 | 60 | 506 | 4 | |
| 60 | 74 | 402 | 2 | |
| 74 | 12 | 251 | 7 | |
| 12 | 72 | 1084 | 1 | |
| 72 | 34 | 492 | 2 | |
| 34 | 11 | 1079 | 1 | |
| 11 | 15 | 487 | 3 | |
| 15 | 26 | 256 | 4 | |
| 26 | 41 | 973 | 18 | |
| 41 | 7 | 376 | 6 | |
| 7 | 2 | 772 | 17 | |
| 2 | 73 | 1027 | 3 | |
| 73 | 27 | 695 | 7 | |
| 27 | 6 | 1124 | 1 | |
| 6 | 37 | 733 | 1 | |
| 37 | 13 | 31 | 1 | |
| 13 | 35 | 1476 | 4 | |
| 35 | 16 | 508 | 5 | |
| 16 | 63 | 321 | 1 | |
| 63 | 78 | 246 | 8 | |
| 78 | 76 | 1543 | 2 | |
| 76 | 1 | 483 | 11 | |
| 1 | 23 | 1617 | 34 | |
| 23 | 22 | 2591 | 5 | |
| 22 | 24 | 996 | 6 | |
| 24 | 10 | 516 | 9 | |
| 10 | 51 | 398 | 4 | |
| 51 | 52 | 1543 | 3 | |
| 52 | 53 | 171 | 1 | |
| 53 | 48 | 314 | 6 | |
| 48 | 33 | 256 | 2 | |
| 33 | 79 | 5066 | - | |
| TOTAL | 42,103 | 300 | ||
| 2 | 79 | 33 | 5100 | 13 |
| 33 | 54 | 409 | 6 | |
| 54 | 56 | 805 | 7 | |
| 56 | 32 | 488 | 7 | |
| 32 | 57 | 1645 | 71 | |
| 57 | 55 | 966 | 18 | |
| 55 | 44 | 2590 | 1 | |
| 44 | 31 | 1570 | 4 | |
| 31 | 40 | 1739 | 4 | |
| 40 | 39 | 123 | 2 | |
| 39 | 25 | 1473 | 3 | |
| 25 | 28 | 1048 | 6 | |
| 28 | 61 | 712 | 11 | |
| 61 | 59 | 1298 | 9 | |
| 59 | 71 | 614 | 13 | |
| 71 | 62 | 935 | 3 | |
| 62 | 79 | 2900 | - | |
| TOTAL | 24,415 | 178 |
Table A4.
Sequence of newspaper kiosks visited by Courier 4.
| Trip Number | Source Node | Destination Node | Distance (m) | Delivered Parcels |
|---|---|---|---|---|
| 1 | 79 | 43 | 2862 | 3 |
| 43 | 42 | 188 | 2 | |
| 42 | 18 | 582 | 1 | |
| 18 | 17 | 219 | 11 | |
| 17 | 3 | 554 | 3 | |
| 3 | 38 | 1239 | 10 | |
| 38 | 19 | 468 | 14 | |
| 19 | 77 | 3754 | 8 | |
| 77 | 14 | 886 | 8 | |
| 14 | 30 | 2202 | 12 | |
| 30 | 60 | 506 | 1 | |
| 60 | 12 | 654 | 2 | |
| 12 | 20 | 1308 | 1 | |
| 20 | 68 | 185 | 2 | |
| 68 | 15 | 1208 | 2 | |
| 15 | 26 | 256 | 3 | |
| 26 | 41 | 973 | 5 | |
| 41 | 7 | 376 | 4 | |
| 7 | 2 | 772 | 8 | |
| 2 | 73 | 1027 | 1 | |
| 73 | 27 | 695 | 1 | |
| 27 | 36 | 753 | 1 | |
| 36 | 37 | 190 | 1 | |
| 37 | 21 | 113 | 1 | |
| 21 | 9 | 668 | 1 | |
| 9 | 35 | 1059 | 4 | |
| 35 | 16 | 508 | 2 | |
| 16 | 63 | 321 | 2 | |
| 63 | 78 | 246 | 1 | |
| 78 | 66 | 508 | 2 | |
| 66 | 23 | 2823 | 13 | |
| 23 | 75 | 1818 | 1 | |
| 75 | 22 | 1982 | 1 | |
| 22 | 24 | 996 | 2 | |
| 24 | 10 | 516 | 7 | |
| 10 | 51 | 398 | 2 | |
| 51 | 50 | 1858 | 2 | |
| 50 | 52 | 524 | 2 | |
| 52 | 48 | 485 | 3 | |
| 48 | 33 | 256 | 22 | |
| 33 | 54 | 409 | 3 | |
| 54 | 56 | 805 | 4 | |
| 56 | 32 | 488 | 4 | |
| 32 | 57 | 1645 | 35 | |
| 57 | 55 | 966 | 10 | |
| 55 | 31 | 3211 | 4 | |
| 31 | 40 | 1739 | 2 | |
| 40 | 39 | 123 | 1 | |
| 39 | 25 | 1473 | 1 | |
| 25 | 28 | 1048 | 3 | |
| 28 | 65 | 263 | 1 | |
| 65 | 61 | 449 | 3 | |
| 61 | 59 | 1298 | 4 | |
| 59 | 71 | 614 | 8 | |
| 71 | 62 | 935 | 4 | |
| 62 | 79 | 2900 | - | |
| TOTAL | 55,302 | 259 |
Table A5.
Sequence of newspaper kiosks visited by Courier 5.
| Trip Number | Source Node | Destination Node | Distance (m) | Delivered Parcels |
|---|---|---|---|---|
| 1 | 79 | 43 | 2862 | 11 |
| 43 | 42 | 188 | 2 | |
| 42 | 18 | 582 | 10 | |
| 18 | 17 | 219 | 49 | |
| 17 | 3 | 554 | 9 | |
| 3 | 38 | 1239 | 35 | |
| 38 | 19 | 468 | 48 | |
| 19 | 69 | 3332 | 1 | |
| 69 | 70 | 399 | 4 | |
| 70 | 77 | 839 | 12 | |
| 77 | 14 | 886 | 36 | |
| 14 | 30 | 2202 | 28 | |
| 30 | 60 | 506 | 13 | |
| 60 | 74 | 402 | 5 | |
| 74 | 12 | 251 | 16 | |
| 12 | 72 | 1084 | 1 | |
| 72 | 20 | 224 | 1 | |
| 20 | 34 | 590 | 6 | |
| 34 | 11 | 1079 | 13 | |
| 11 | 79 | 4604 | - | |
| TOTAL | 22,510 | 300 | ||
| 2 | 79 | 11 | 4469 | 1 |
| 11 | 15 | 487 | 13 | |
| 15 | 26 | 256 | 3 | |
| 26 | 41 | 973 | 31 | |
| 41 | 7 | 376 | 4 | |
| 7 | 2 | 772 | 27 | |
| 2 | 73 | 1027 | 13 | |
| 73 | 27 | 695 | 9 | |
| 27 | 6 | 1124 | 3 | |
| 6 | 36 | 543 | 2 | |
| 36 | 37 | 190 | 2 | |
| 37 | 13 | 31 | 1 | |
| 13 | 9 | 750 | 3 | |
| 9 | 35 | 1059 | 16 | |
| 35 | 16 | 508 | 9 | |
| 16 | 63 | 321 | 6 | |
| 63 | 78 | 246 | 3 | |
| 78 | 66 | 508 | 1 | |
| 66 | 67 | 165 | 1 | |
| 67 | 76 | 1152 | 2 | |
| 76 | 1 | 483 | 1 | |
| 1 | 23 | 1617 | 65 | |
| 23 | 58 | 1897 | 2 | |
| 58 | 75 | 853 | 2 | |
| 75 | 22 | 1982 | 11 | |
| 22 | 24 | 996 | 13 | |
| 24 | 10 | 516 | 23 | |
| 10 | 51 | 398 | 6 | |
| 51 | 49 | 1484 | 1 | |
| 49 | 50 | 1242 | 6 | |
| 50 | 52 | 524 | 13 | |
| 52 | 53 | 171 | 6 | |
| 53 | 46 | 230 | 1 | |
| 46 | 79 | 4821 | - | |
| TOTAL | 32,866 | 300 | ||
| 3 | 79 | 46 | 5051 | 1 |
| 46 | 48 | 214 | 2 | |
| 48 | 33 | 256 | 55 | |
| 33 | 54 | 409 | 10 | |
| 54 | 56 | 805 | 13 | |
| 56 | 32 | 488 | 16 | |
| 32 | 57 | 1645 | 145 | |
| 57 | 55 | 966 | 31 | |
| 55 | 31 | 3211 | 5 | |
| 31 | 40 | 1739 | 7 | |
| 40 | 39 | 123 | 1 | |
| 39 | 25 | 1473 | 10 | |
| 25 | 4 | 101 | 2 | |
| 4 | 28 | 1149 | 2 | |
| 28 | 79 | 3382 | - | |
| TOTAL | 21,012 | 300 | ||
| 4 | 79 | 28 | 3739 | 8 |
| 28 | 65 | 263 | 3 | |
| 65 | 61 | 449 | 25 | |
| 61 | 59 | 1298 | 14 | |
| 59 | 71 | 614 | 36 | |
| 71 | 62 | 935 | 7 | |
| 62 | 79 | 2900 | - | |
| TOTAL | 10,198 | 93 |
References
- Statista 2020. Annual Retail E-Commerce Sales Growth Worldwide from 2017 to 2023. Available online: https://0-www-statista-com.brum.beds.ac.uk/statistics/288487/forecast-of-global-b2c-e-commerce-growth/ (accessed on 16 September 2020).
- Kim, R.Y. The Impact of COVID-19 on Consumers: Preparing for Digital Sales. IEEE Eng. Manag. Rev. 2020. [Google Scholar] [CrossRef]
- Gatta, V.; Marcucci, E.; Nigro, M.; Patella, S.M.; Serafini, S. Public transport-based crowdshipping for sustainable city logistics: Assessing economic and environmental impacts. Sustainability (Switzerland) 2018, 11, 145. [Google Scholar] [CrossRef] [Green Version]
- Visser, J.; Nemoto, T.; Browne, M. Home Delivery and the Impacts on Urban Freight Transport: A Review. Procedia-Soc. Behav. Sci. 2014, 125, 15–27. [Google Scholar] [CrossRef] [Green Version]
- Lazarevic, D.; Švadlenka, L.; Radojicic, V.; Dobrodolac, M. New express delivery service and its impact on CO2 emissions. Sustainability (Switzerland) 2020, 12, 456. [Google Scholar] [CrossRef] [Green Version]
- Gevaers, R.; Van de Voorde, E.; Vanelslander, T. Cost Modelling and Simulation of Last-mile Characteristics in an Innovative B2C Supply Chain Environment with Implications on Urban Areas and Cities. Procedia-Soc. Behav. Sci. 2014, 125, 398–411. [Google Scholar] [CrossRef] [Green Version]
- Lindner, J. Last Mile Logistics Capability: A Multidimensional System Requirements Analysis for a General Modeling and Evaluation Approach. In Dipl Technical University of Munich; Available online: https://www.mendeley.com/catalogue/79479a21-813c-3a3d-be78-007e46f282fe/?utm_source=desktop&utm_medium=1.19.4&utm_campaign=open_catalog&userDocumentId=%7B3e38971e-62ac-43a9-81f8-24a870bbc2b4%7D (accessed on 20 May 2020).
- Wang, Q.; Sun, H. Traffic Structure Optimization in Historic Districts Based on Green Transportation and Sustainable Development Concept. Adv. Civ. Eng. 2019. [Google Scholar] [CrossRef]
- Amer, A.; Chow, J.Y.J. A downtown on-street parking model with urban truck delivery behavior. Transp. Res. Part A Policy Pract. 2017, 102, 51–67. [Google Scholar] [CrossRef]
- Urzúa-Morales, J.G.; Sepulveda-Rojas, J.P.; Alfaro, M.; Fuertes, G.; Ternero, R.; Vargas, M. Logistic modeling of the last mile: Case study Santiago, Chile. Sustainability (Switzerland) 2020, 12, 648. [Google Scholar] [CrossRef] [Green Version]
- De Oliveira, L.K.; Morganti, E.; Dablanc, L.; de Oliveira, R.L.M. Analysis of the potential demand of automated delivery stations for e-commerce deliveries in Belo Horizonte, Brazil. Res. Transp. Econ. 2017, 65, 34–43. [Google Scholar] [CrossRef] [Green Version]
- Kedia, A.; Kusumastuti, D.; Nicholson, A. Acceptability of collection and delivery points from consumers’ perspective: A qualitative case study of Christchurch city. Case Stud. Transp. Policy 2017, 5, 587–595. [Google Scholar] [CrossRef]
- Iwan, S.; Kijewska, K.; Lemke, J. Analysis of Parcel Lockers’ Efficiency as the Last Mile Delivery Solution—The Results of the Research in Poland. Transp. Res. Procedia 2016, 12, 644–655. [Google Scholar] [CrossRef] [Green Version]
- Alves, R.; da Lima, R.S.; de Sena, D.C.; de Pinho, A.F.; Holguín-Veras, J. Agent-based simulation model for evaluating urban freight policy to e-commerce. Sustainability (Switzerland) 2019, 11, 4020. [Google Scholar] [CrossRef] [Green Version]
- Arnold, F.; Cardenas, I.; Sörensen, K.; Dewulf, W. Simulation of B2C e-commerce distribution in Antwerp using cargo bikes and delivery points. Eur. Transp. Res. Rev. 2018, 10. [Google Scholar] [CrossRef]
- Deutsch, Y.; Golany, B. A parcel locker network as a solution to the logistics last mile problem. Int. J. Prod. Res. 2018, 56, 251–261. [Google Scholar] [CrossRef]
- Jiang, L.; Dhiaf, M.; Dong, J.; Liang, C.; Zhao, S. A traveling salesman problem with time windows for the last mile delivery in online shopping. Int. J. Prod. Res. 2019, 58, 5077–5088. [Google Scholar] [CrossRef]
- Orenstein, I.; Raviv, T.; Sadan, E. Flexible parcel delivery to automated parcel lockers: Models, solution methods and analysis. EURO J. Transp. Logist. 2019, 8, 683–711. [Google Scholar] [CrossRef]
- Refaningati, T.; Nahry Tangkudung, E.S.W.; Kusuma, A. Analysis of characteristics and efficiency of smart locker system (Case study: Jabodetabek). Evergreen 2020, 7, 111–117. [Google Scholar] [CrossRef]
- Lin, Y.H.; He, D.; Wang, Y.; Lee, L.H. Last-mile Delivery: Optimal Locker Location Under Multinomial Logit Choice Model. Transp. Res. Part E Logist. Transp. Rev. 2020, 142, 102059. Available online: http://arxiv.org/abs/2002.10153 (accessed on 15 May 2020). [CrossRef]
- Faugere, L.; Montreuil, B. Hyperconnected pickup & delivery locker networks. In Proceedings of the 4th International Physical Internet Conference; Available online: https://www.researchgate.net/profile/Louis_Faugere/publication/318260861_Hyperconnected_Pickup_Delivery_Locker_Networks/links/595f494da6fdccc9b18c5d37/Hyperconnected-Pickup-Delivery-Locker-Networks.pdf (accessed on 16 May 2020).
- Lachapelle, U.; Burke, M.; Brotherton, A.; Leung, A. Parcel locker systems in a car dominant city: Location, characterisation and potential impacts on city planning and consumer travel access. J. Transp. Geogr. 2018, 71, 1–14. [Google Scholar] [CrossRef]
- Schwerdfeger, S.; Boysen, N. Optimizing the changing locations of mobile parcel lockers in last-mile distribution. Eur. J. Oper. Res. 2020. [Google Scholar] [CrossRef]
- Chen, Y.; Yu, J.; Yang, S.; Wei, J. Consumer’s intention to use self-service parcel delivery service in online retailing: An empirical study. Internet Res. 2016, 28, 500–519. Available online: www.emeraldinsight.com (accessed on 22 May 2020). [CrossRef]
- Xu, J.J.; Hong, L. Impact factors of choosing willingness for picking up service. Res. J. Appl. Sci. Eng. Technol. 2013, 6, 2509–2513. [Google Scholar] [CrossRef]
- Yuen, K.F.; Wang, X.; Ng, L.T.W.; Wong, Y.D. An investigation of customers’ intention to use self-collection services for last-mile delivery. Transp. Policy 2018, 66, 1–8. [Google Scholar] [CrossRef]
- Zhou, M.; Zhao, L.; Kong, N. Understanding consumers’ behavior to adopt self-service parcel services for last-mile delivery. J. Retail. Consum. Serv. 2020, 52. [Google Scholar] [CrossRef]
- Yung, E.H.K.; Chan, E.H.W. Implementation challenges to the adaptive reuse of heritage buildings: Towards the goals of sustainable, low carbon cities. Habitat Int. 2012, 36, 352–361. [Google Scholar] [CrossRef]
- Sodiq, A.; Baloch, A.A.B.; Khan, S.A. Towards modern sustainable cities: Review of sustainability principles and trends. J. Clean. Prod. 2019, 227, 972–1001. [Google Scholar] [CrossRef]
- Comisión Nacional de los Mercados y la Competencia (CNMC). Informe Anual del Sector Postal; Available online: https://www.cnmc.es/sites/default/files/2765074_2.pdf (accessed on 24 June 2020).
- Dantzig, G.; Fulkerson, R.; Johnson, S. Solution of a Large-Scale Traveling-Salesman Problem. J. Oper. Res. Soc. Am. 1954, 2, 393–410. [Google Scholar] [CrossRef]
- Graphhopper. Available online: www.grahhopper.com (accessed on 12 November 2020).
- European-Commission. Reducing CO2 Emissions from Vans–Before 2020; Available online: https://ec.europa.eu/clima/policies/transport/vehicles/vans_en (accessed on 2 September 2020).
- Gao, X.; Shi, X.; Guo, H.; Liu, Y. To buy or not buy food online: The impact of the COVID-19 epidemic on the adoption of e-commerce in China. PLoS ONE 2020, 15, e0237900. [Google Scholar] [CrossRef]
- Chang, H.-H.; Meyerhoefer, C. COVID-19 and the Demand for Online Food Shopping Services: Empirical Evidence from Taiwan. Am. J. Agric. Econ. 2020. [Google Scholar] [CrossRef]
- Ben Hassen, T.; El Bilali, H.; Allahyari, M.S. Impact of COVID-19 on Food Behavior and Consumption in Qatar. Sustainability 2020, 12, 6973. [Google Scholar] [CrossRef]
- Grashuis, J.; Skevas, T.; Segovia, M.S. Grocery shopping preferences during the COVID-19 pandemic. Sustainability (Switzerland) 2020, 12, 5369. [Google Scholar] [CrossRef]
- Watanabe, T.; Omori, Y. Central Bank Communication Design working paper series Online Consumption during the COVID-19 Crisis: Evidence from Japan. JSPS Grant-in-Aid for Sci. Res. 2020, 23, 39. [Google Scholar]
- Seetharaman, P. Business models shifts: Impact of Covid-19. Int. J. Inf. Manag. 2020, 54, 102173. [Google Scholar] [CrossRef]
- González-Varona, J.M.; Poza, D.; Acebes, F.; Villafáñez, F.; Pajares, J.; López-Paredes, A. New business models for sustainable spare parts logistics: A case study. Sustainability (Switzerland) 2020, 12, 3071. [Google Scholar] [CrossRef] [Green Version]
- Van Duin, J.H.R.; Wiegmans, B.W.; van Arem, B.; van Amstel, Y. From home delivery to parcel lockers: A case study in Amsterdam. Transp. Res. Procedia 2020, 46, 37–44. [Google Scholar] [CrossRef]
- Lemke, J.; Iwan, S.; Korczak, J. Usability of the Parcel Lockers from the Customer Perspective—The Research in Polish Cities. Transp. Res. Procedia 2016, 16, 272–287. [Google Scholar] [CrossRef] [Green Version]
Figure 1.
Representation of a delivery model with traditional door-to-door last-mile delivery (right).
Figure 1.
Representation of a delivery model with traditional door-to-door last-mile delivery (right).

Figure 2.
Last-mile delivery through parcel lockers: (a): parcel locker sample; (b): schematic representation of last-mile delivery through parcel lockers.
Figure 2.
Last-mile delivery through parcel lockers: (a): parcel locker sample; (b): schematic representation of last-mile delivery through parcel lockers.

Figure 3.
Abandoned newspaper kiosk in the historic district of Valladolid, Spain. Source: Google Maps.
Figure 3.
Abandoned newspaper kiosk in the historic district of Valladolid, Spain. Source: Google Maps.

Figure 4.
(a): map of the historic district in the city of Valladolid. Source: Open Street Map; (b): parking facility for newspaper deliveries next to a kiosk. Source: Google Maps.
Figure 4.
(a): map of the historic district in the city of Valladolid. Source: Open Street Map; (b): parking facility for newspaper deliveries next to a kiosk. Source: Google Maps.

Figure 5.
Distribution of the 4321 random delivery locations (i.e., client addresses). Neighborhoods are represented by different colors. Source: Google My Maps.
Figure 5.
Distribution of the 4321 random delivery locations (i.e., client addresses). Neighborhoods are represented by different colors. Source: Google My Maps.

Figure 6.
Location of the 78 newspaper kiosks currently present in Valladolid. The item marked as 79 (bottom right in the figure) represents the entrance of the industrial park where the warehouses of the five companies are located. Source: Google My Maps.
Figure 6.
Location of the 78 newspaper kiosks currently present in Valladolid. The item marked as 79 (bottom right in the figure) represents the entrance of the industrial park where the warehouses of the five companies are located. Source: Google My Maps.

Figure 7.
Detail of the allocation of the closest parcel locker (kiosk, blue-numbered circles) to each client (colored marks) according to the random delivery locations shown in Figure 5. The marks with the same color represent the customers who have been assigned the same kiosk. Source: Google My Maps.

Table 1.
Recent studies that focus on efficiency from the shipping company’s point of view.
| Study | Methodology | Location | Main Findings |
|---|---|---|---|
| [14] | Agent-based modeling | Belo Horizonte, Brazil | Parcel lockers increase carriers’ profits (fewer vehicles required, shorter traveled distance) |
| [15] | Case study/simulation | Antwerp, Belgium | Stimulating customer self-pick up can reduce delivery companies’ operational costs |
| [16] | Mixed Integer Linear Programming | Toronto, Canada | Selecting optimal numbers, locations, and sizes of parcel lockers to maximize a company’s profits |
| [17] | Mixed Integer Linear Programming/heuristics | - | Logistics costs in last-mile delivery can be reduced by allowing customers to pick up parcels from the parcel lockers near their homes |
| [18] | Mixed-integer programming/metaheuristics | - | Lower cost/shorter time if customers accept a larger set of lockers for delivery |
| [19] | Data analysis from the travel diary data of a parcel delivery operator | Jabodetabek, Indonesia | The use of parcel lockers is more efficient in total travel length terms compared to direct delivery service |
Table 2.
Recent studies on the optimal design/location of lockers.
| Study | Methodology | Location | Main Findings |
|---|---|---|---|
| [20] | Mixed-integer linear programming/case study | Singapore | The optimal location of lockers requires considering customers’ perceived service quality |
| [21] | Conceptualization | --- | Development of several locker design options for efficient delivery service |
| [22] | Hierarchical cluster analysis | Brisbane, Australia | Importance of the optimal integration and distribution of parcel lockers across the area to meet city and transport planning objectives |
| [23] | Mixed-integer programming | --- | Minimize the company’s fleet size while offering customers a flexible service by using mobile lockers |
Table 3.
Research focused on consumers’ intention to use parcel lockers.
| Study | Methodology | Location | Main Findings |
|---|---|---|---|
| [11] | Survey | Belo Horizonte, Brazil | Users’ revealed preference shows that delivery lockers have a high potential demand from online shoppers |
| [12] | Qualitative analysis (focus groups) | Christchurch, New Zealand | Factors affecting the likelihood of customers using lockers: spatial location, parking availability, proximity to home and office, and hours and security of their operation |
| [13] | Survey | Szczecin, Poland | Importance of the parcel locker location: close location to home, on the way to work and available parking spaces |
| [24] | Questionnaire | China | Location convenience and innovation positively affect consumer’s intention to use delivery lockers |
| [25] | Questionnaire | China | Factors that affects customer willingness to use lockers: age, value of parcel, and online shopping frequency |
| [26] | Theoretical study (innovation diffusion theory) | Singapore | Relative advantage, compatibility and trialability positively impact customers’ intention to use parcel lockers |
| [27] | Questionnaires | China | Relation between psychological factors (perceived risk, perceived satisfaction) and online shoppers’ intention to use self-service delivery services |
Table 4.
Population of each neighborhood and the considered number of daily delivery requests per neighborhood.
Table 4.
Population of each neighborhood and the considered number of daily delivery requests per neighborhood.
| Neighborhood | Population | Number of Delivery Requests per Day |
|---|---|---|
| Arturo Eyríes | 4584 | 69 |
| Barrio España | 2615 | 40 |
| La Farola—C. de la Esperanza—Paseo Zorrilla | 6369 | 96 |
| Arco Ladrillo-Pza. Toros-B. G. Civil—P. Zorrilla | 26,238 | 394 |
| Caño Argales—San Andrés | 7665 | 115 |
| Pza. España—Plaza Mayor—S. Martin—S. Juan | 8979 | 135 |
| Cuatro de Marzo | 3565 | 54 |
| Girón-Villa del Prado | 8907 | 134 |
| Hospital | 7448 | 112 |
| Huerta del Rey | 15,653 | 235 |
| La Circular | 10,399 | 156 |
| La Pilarica-Santos Pilarica—Belén | 10,441 | 157 |
| La Rondilla—Santa Clara/XXV Años de Paz | 22,246 | 334 |
| La Rubia-Parque Arturo León | 6470 | 98 |
| La Victoria | 14,889 | 224 |
| Las Batallas | 3893 | 59 |
| Las Delicias | 27,538 | 414 |
| Las Flores | 2079 | 32 |
| Las Villas-P. Alameda-Covaresa-P. Arturo León | 22,848 | 343 |
| Los Vadillos | 4335 | 66 |
| Pajarillos -Páramo San Isidro-Campo de Tiro | 21,758 | 327 |
| Parquesol | 26,086 | 392 |
| Pgno. Argales-Ciudad de la Comunicación | 2340 | 36 |
| San Pablo—San Nicolás—San Miguel | 10,181 | 153 |
| San Pedro Regalado | 2730 | 41 |
| Universidad—La Antigua—Santa Cruz—San Juan | 6939 | 105 |
| Total | 287,195 | 4321 |
Table 5.
Market share of the five courier companies operating in Spain (Source: [30]). Estimation of the number of delivered parcels per day by these companies in Valladolid.
Table 5.
Market share of the five courier companies operating in Spain (Source: [30]). Estimation of the number of delivered parcels per day by these companies in Valladolid.
| Delivery Company | Market Share | Number of Delivered Parcels per Day |
|---|---|---|
| Courier 1 | 44% | 1900 |
| Courier 2 | 16% | 691 |
| Courier 3 | 11% | 478 |
| Courier 4 | 6% | 259 |
| Courier 5 | 23% | 993 |
| Total | 100% | 4321 |
Table 6.
Distance and CO2 emissions resulting from performing door-to-door delivery in Scenario 1 (door-to-door delivery).
Table 6.
Distance and CO2 emissions resulting from performing door-to-door delivery in Scenario 1 (door-to-door delivery).
| Courier | Trip Number | Delivered Parcels | Distance | Total Parcels | Total Distance | Total CO2 Emissions |
|---|---|---|---|---|---|---|
| Courier 1 | 1 | 96 | 103.1 km | 1900 | 1804.1 km | 265.2 kg |
| 2 | 96 | 77.7 km | ||||
| 3 | 96 | 78.9 km | ||||
| 4 | 96 | 82.4 km | ||||
| 5 | 96 | 117.4 km | ||||
| 6 | 96 | 83.9 km | ||||
| 7 | 96 | 88.2 km | ||||
| 8 | 96 | 104.6 km | ||||
| 9 | 96 | 113.8 km | ||||
| 10 | 96 | 63.3 km | ||||
| 11 | 96 | 50.2 km | ||||
| 12 | 96 | 80.2 km | ||||
| 13 | 96 | 83.7 km | ||||
| 14 | 96 | 82.4 km | ||||
| 15 | 96 | 80.5 km | ||||
| 16 | 96 | 150.2 km | ||||
| 17 | 96 | 90.0 km | ||||
| 18 | 96 | 74.7 km | ||||
| 19 | 96 | 115.2 km | ||||
| 20 | 76 | 83.7 km | ||||
| Courier 2 | 1 | 96 | 81.7 km | 691 | 692.3 km | 101.8 kg |
| 2 | 96 | 86.0 km | ||||
| 3 | 96 | 103.1 km | ||||
| 4 | 96 | 74.0 km | ||||
| 5 | 96 | 91.4 km | ||||
| 6 | 96 | 119.6 km | ||||
| 7 | 96 | 107.8 km | ||||
| 8 | 19 | 28.7 km | ||||
| Courier 3 | 1 | 96 | 98.5 km | 478 | 459.1 km | 67.5 kg |
| 2 | 96 | 89.0 km | ||||
| 3 | 96 | 77.3 km | ||||
| 4 | 96 | 94.1 km | ||||
| 5 | 94 | 100.2 km | ||||
| Courier 4 | 1 | 96 | 94.5 km | 259 | 261.2 km | 38.4 kg |
| 2 | 96 | 82.1 km | ||||
| 3 | 67 | 84.6 km | ||||
| Courier 5 | 1 | 96 | 101.5 km | 993 | 920.5 km | 135.3 kg |
| 2 | 96 | 83.0 km | ||||
| 3 | 96 | 108.8 km | ||||
| 4 | 96 | 87.7 km | ||||
| 5 | 96 | 61.8 km | ||||
| 6 | 96 | 51.7 km | ||||
| 7 | 96 | 85.2 km | ||||
| 8 | 96 | 96.3 km | ||||
| 9 | 96 | 119.5 km | ||||
| 10 | 96 | 88.7 km | ||||
| 11 | 33 | 36.3 km | ||||
| Total | 4321 | 4137.2 km | 4321 | 4137.2 km | 608.2 kg |
Table 7.
Summary of the results of the Scenario 2 simulation, which reuses newspaper kiosks as parcel lockers.
Table 7.
Summary of the results of the Scenario 2 simulation, which reuses newspaper kiosks as parcel lockers.
| Courier | Trip Number | Delivered Parcels | Distance | Total Parcels | Total Distance | Total CO2 Emissions |
|---|---|---|---|---|---|---|
| Courier 1 | 1 | 300 | 9.20 km | 1900 | 117.27 km | 17.2 kg |
| 2 | 300 | 19.36 km | ||||
| 3 | 300 | 21.97 km | ||||
| 4 | 300 | 21.89 km | ||||
| 5 | 300 | 14.46 km | ||||
| 6 | 300 | 21.88 km | ||||
| 7 | 100 | 8.53 km | ||||
| Courier 2 | 1 | 300 | 29.66 km | 691 | 79.3 km | 11.7 kg |
| 2 | 300 | 28.60 km | ||||
| 3 | 91 | 21.04 km | ||||
| Courier 3 | 1 | 300 | 42.1 km | 478 | 66.52 km | 9.8 kg |
| 2 | 178 | 24.42 km | ||||
| Courier 4 | 1 | 259 | 55.3 km | 259 | 55.30 km | 8.1 kg |
| Courier 5 | 1 | 300 | 22.51 km | 993 | 86.59 km | 12.7 kg |
| 2 | 300 | 32.87 km | ||||
| 3 | 300 | 21.01 km | ||||
| 4 | 93 | 10.20 km | ||||
| Total | 4321 | 406.36 km | 4321 | 406.36 km | 59.5 kg |
Table 8.
Average distance/time on foot from customers’ homes (i.e., randomly generated delivery locations) to the closest kiosk.
Table 8.
Average distance/time on foot from customers’ homes (i.e., randomly generated delivery locations) to the closest kiosk.
| N/Hood ID | Neighborhood | Avg. Distance (on Foot) | Average Time (on Foot) |
|---|---|---|---|
| 1 | Arturo Eyríes | 527 m | 20 min 42 s |
| 2 | Barrio España | 638 m | 8 min 45 s |
| 3 | La Farola—C. de la Esperanza—Paseo Zorrilla | 335 m | 4 min 35 s |
| 4 | Arco Ladrillo-Pza. Toros-B. G. Civil—P. Zorrilla | 199 m | 2 min 40 s |
| 5 | Caño Argales—San Andrés | 251 m | 3 min 25 s |
| 6 | Pza. España—Plaza Mayor—S. Martin—S. Juan | 172 m | 2 min 18 s |
| 7 | Cuatro de Marzo | 173 m | 2 min 18 s |
| 8 | Girón-Villa del Prado | 479 m | 6 min 30 s |
| 9 | Hospital | 210 m | 2 min 51 s |
| 10 | Huerta del Rey | 915 m | 12 min 26 s |
| 11 | La Circular | 185 m | 2 min 31 s |
| 12 | La Pilarica-Santos Pilarica—Belén | 702 m | 9 min 33 s |
| 13 | La Rondilla—Santa Clara/XXV Años de Paz | 343 m | 4 min 41 s |
| 14 | La Rubia-Parque Arturo León | 514 m | 7 min 8 s |
| 15 | La Victoria | 835 m | 11 min 22 s |
| 16 | Las Batallas | 250 m | 3 min 22 s |
| 17 | Las Delicias | 576 m | 7 min 50 s |
| 18 | Las Flores | 3207 m | 42 min 51 s |
| 19 | Las Villas-P. Alameda-Covaresa-P. Arturo León | 1442 m | 19 min 29 s |
| 20 | Los Vadillos | 282 m | 3 min 51 s |
| 21 | Pajarillos -Páramo San Isidro-Campo de Tiro | 545 m | 7 min 27 s |
| 22 | Parquesol | 3179 m | 33 min 25 s |
| 23 | Pgno. Argales-Ciudad de la Comunicación | 1362 m | 18 min 17 s |
| 24 | San Pablo—San Nicolás—San Miguel | 170 m | 2 min 17 s |
| 25 | San Pedro Regalado | 771 m | 10 min 29 s |
| 26 | Universidad—La Antigua—S. Cruz—San Juan | 171 m | 2 min 18 s |
Publisher’s Note: MDPI stays neutral with regard to jurisdictional claims in published maps and institutional affiliations. |
© 2020 by the authors. Licensee MDPI, Basel, Switzerland. This article is an open access article distributed under the terms and conditions of the Creative Commons Attribution (CC BY) license (http://creativecommons.org/licenses/by/4.0/).
Share and Cite
MDPI and ACS Style
González-Varona, J.M.; Villafáñez, F.; Acebes, F.; Redondo, A.; Poza, D. Reusing Newspaper Kiosks for Last-Mile Delivery in Urban Areas. Sustainability 2020, 12, 9770. https://0-doi-org.brum.beds.ac.uk/10.3390/su12229770
AMA Style
González-Varona JM, Villafáñez F, Acebes F, Redondo A, Poza D. Reusing Newspaper Kiosks for Last-Mile Delivery in Urban Areas. Sustainability. 2020; 12(22):9770. https://0-doi-org.brum.beds.ac.uk/10.3390/su12229770
Chicago/Turabian StyleGonzález-Varona, José M., Félix Villafáñez, Fernando Acebes, Alfonso Redondo, and David Poza. 2020. "Reusing Newspaper Kiosks for Last-Mile Delivery in Urban Areas" Sustainability 12, no. 22: 9770. https://0-doi-org.brum.beds.ac.uk/10.3390/su12229770
Note that from the first issue of 2016, this journal uses article numbers instead of page numbers. See further details here.