Article

Influence of Characteristics of Metropolitan Areas on the Logistics Sprawl: A Case Study for Metropolitan Areas of the State of Paraná (Brazil)

by
Luísa Tavares Muzzi de Sousa
and
Leise Kelli de Oliveira
*
Department of Transport and Geotechnical Engineering, Universidade Federal de Minas Gerais, Belo Horizonte 31515-212, Brazil
*
Author to whom correspondence should be addressed.
Sustainability 2020, 12(22), 9779; https://0-doi-org.brum.beds.ac.uk/10.3390/su12229779
Submission received: 18 November 2020 / Revised: 20 November 2020 / Accepted: 21 November 2020 / Published: 23 November 2020
(This article belongs to the Special Issue Green City Logistics)

Abstract

:
The concentration of warehouses in peripheral regions of metropolitan areas in a time period is called logistics sprawl (LS). Identifying this phenomenon could help to reduce externalities related to urban freight transport, mainly, the distance traveled. This paper examines the contribution of the characteristics of metropolitan areas on the logistics sprawl indicator. A case study was carried out considering data from eight metropolitan areas of the state of Paraná (Brazil). The research method is based on the data collection procedure proposed, centrographic method, and linear regression. The results of the centrographic method reveal a positive LS in four metropolitan areas and a negative LS in three metropolitan areas. In general, the warehouses are close to the highways that cross the metropolitan area. In addition, the size of the metropolitan area has a negative relationship with the number of warehouses and the logistics sprawl indicator. The findings highlight the importance of public policies relating to urban freight transport and land use at a metropolitan level.

1. Introduction

Logistics sprawl (LS) describes the phenomenon of logistics facilities’ concentration in peripheral regions of metropolitan areas over time [1], also defined as a land use phenomenon [2], which can be caused by the increase in population density [3], the land price in central areas, and the larger space availability in peripherical areas [4]. Identifying the LS phenomenon leads to understanding aggregated tendencies in urban freight transport and the anticipation of its impacts at a regional level [5]. Logistics sprawl has received attention from academia in recent years [6].
LS negatively affects travel time and delivery reliability due to the increase in traveled distance. On the other hand, travel time increase and speed decrease caused by congestion in central areas’ access ways contribute to fuel consumption increase and pollutant emissions [1], as well as transportation cost increases [2].
LS could support public policies related to urban freight transportation. This concept was proposed by reference [1] in 2010, with an analysis for Paris. Since then, the number of papers related to this topic increase year by year, but research is still scarce, as we will show in the literature review. We observed analyses for Europe, North America, Asia, and Latin America. Although the research method is recurrent in the literature, the data collection is specific for each study. Additionally, many studies seek to obtain the LS indicator (LSI) without exploring the variables that contribute to this phenomenon.
In this paper, we investigated the contribution of the characteristics of metropolitan areas on the logistics sprawl indicator. We chose eight metropolitan areas with different characteristics in the same region in Brazil (Apucarana, Campo Mourão, Cascavel, Curitiba, Londrina, Maringá, Toledo, and Umuarama). Since the availability of data is a challenge for studies on urban freight transport in Brazil, we have developed and tested a method based on secondary data obtained from the Internet. By considering the characteristics of the metropolitan areas, we have identified the influence the number of warehouses and the LSI have in these metropolitan areas.
Considering a metropolitan area, we obtained data regarding the location and opening year of warehouses to acquire a database from an Internet search. The LSI was obtained using the centrographic method, which measures the variation of the spatial location of warehouses over time [1]. Furthermore, we analyzed the spatial dispersion of the warehouses’ locations. Additionally, we identified the characteristics of the metropolitan areas that explain the number of warehouses and the LSI in the study area using linear regression. The results were compared to the literature to identify a tendency of the phenomenon in other metropolitan areas. The main findings are low or negative LSIs in the metropolitan areas. In addition, the size of metropolitan areas might influence the number of warehouses and the LSI in each metropolitan area.
This paper contributes in two ways. First, we have used the Internet search as a substitute for the yellow pages used by reference [1] to identify warehouses in the study area. Second, we have explored the relationship between the characteristics of the metropolitan areas, the number of warehouses, and the LSIs. Mainly for developing countries, the empirical evidence of the effects of characteristics of metropolitan areas on LS is still limited [3].

2. Logistics Sprawl: A Literature Review

The literature related to LS was identified through a systematic literature review. By using the keyword “logistics sprawl” in Google Scholar, we have identified a set of papers related to this topic. As we said, this phenomenon was analyzed in European, Asian, Oceanian, North American, and Latin-American metropolitan areas (MAs), as summarized in Table 1. 
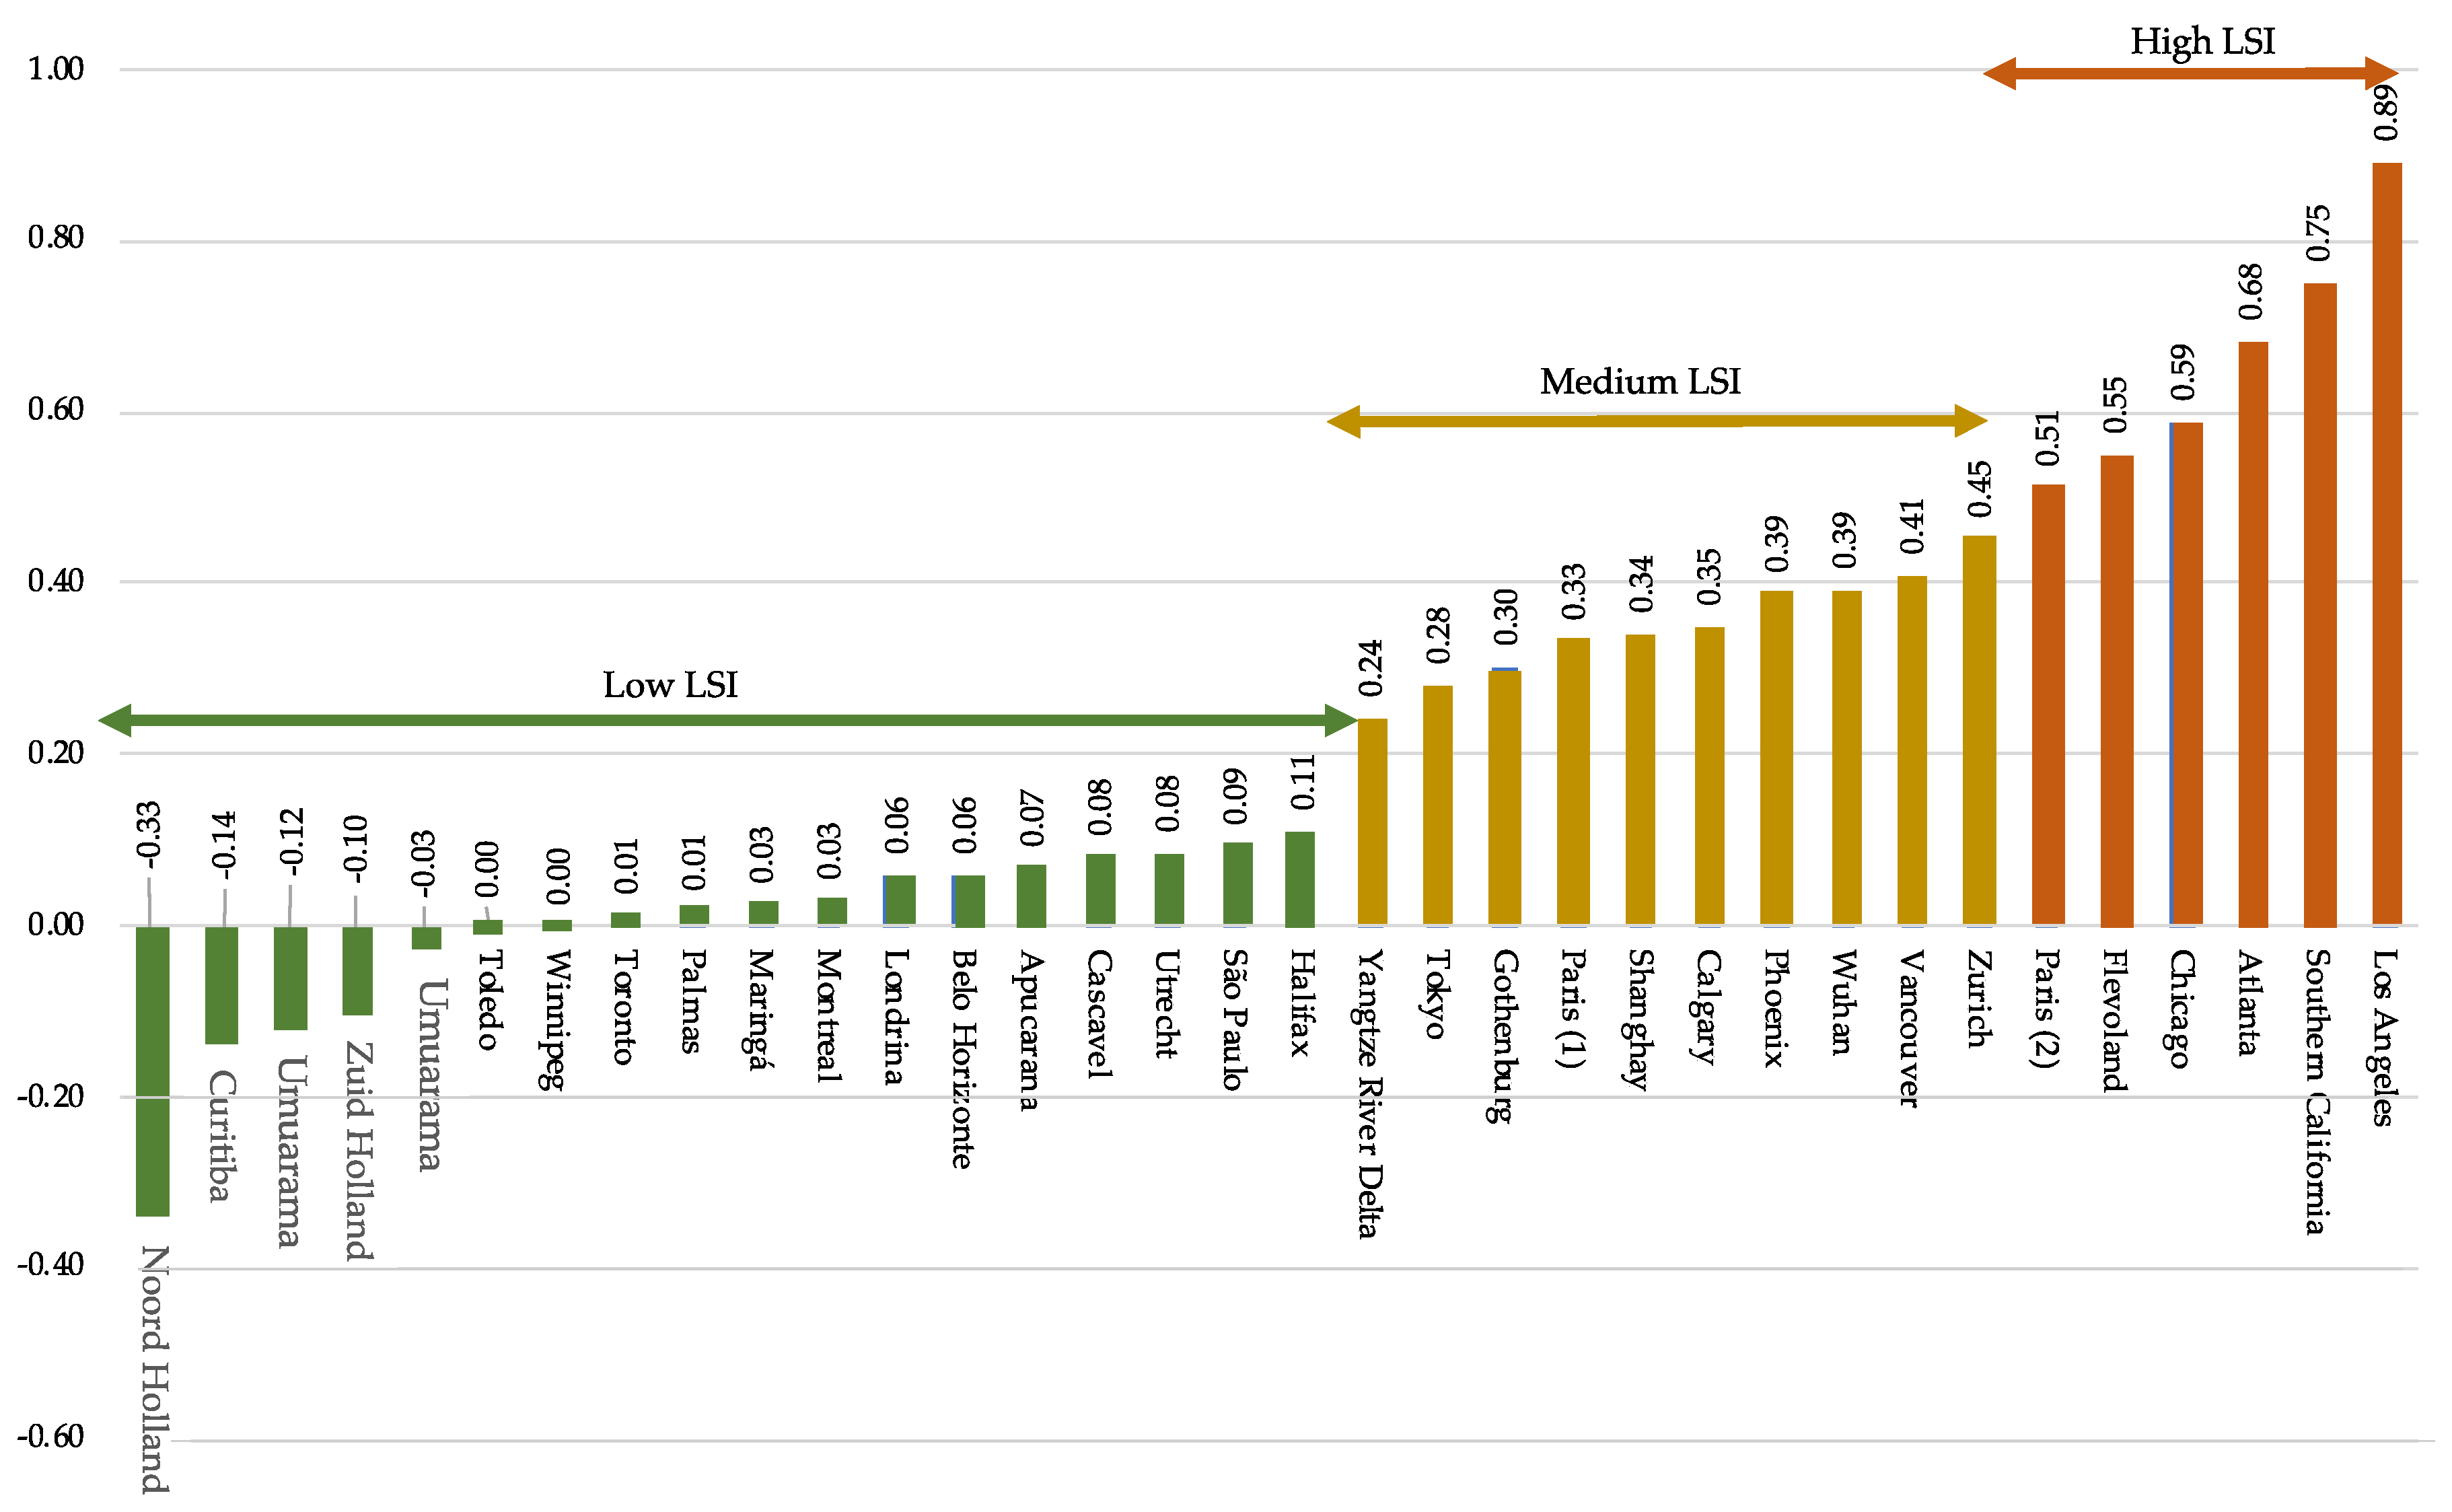
Table 1 also presents the data source, the research method, the time period of analysis, and the LSI (in kilometers). In general, the analyses of logistics sprawl computed the LSI [6,7]. A negative or close to zero LSI is desirable, which indicates that the phenomenon did not occur or occurred moderately over the time analyzed. The biggest LSI is observed in Southern California (+12 km) [8], while the smallest value is observed in Amsterdam (−2 km) [9].
LS has impacts on urban freight geography and commuting of logistics employment, contributing to increasing the distances traveled by trucks and to environmental impacts [10]. By knowing this phenomenon, it is possible to propose freight land-use strategies to reintegrate the logistics facilities in inner areas coordinated with logistics real state [10].
Concerning the data, most studies used public data. It is important to mention that obtaining data is the greatest challenge for many studies involving urban freight transport since a large amount of accurate data is necessary [7]. Despite many studies having used public data, the source influences the data collection [7]. Many times, it is necessary to use secondary data. As an example, the yellow pages were used by reference [1] to identify warehouses in Paris. Nowadays, Internet search engines can be a substitute for yellow pages. Heitz et al. [11] present a procedure to identify warehouses and logistics terminals comparing data from a public data set and satellite images and proposing a typology to classify these logistics facilities.
Regarding the research method, the studies used centrographic analysis to identify the LS indicator. Additionally, some analyses used econometric techniques to estimate the factors that explain the concentration of warehouses in the study area, as explored by references [3,8].
Table 1. Summary of literature on logistics sprawl (LS).
Metropolitan Area (Country) Data SourceResearch MethodTime PeriodLS Indicator (LSI) (km)
Atlanta (USA) [12]Public dataCentrographic analysis1998–2008+6.8
Belo Horizonte (Brazil) [13]Commercial boardCentrographic analysis1995–2015+1.2
Calgary (Canada) [14]Private dataCentrographic analysis2012–2012+3.5
Chicago (USA) [5]Public dataCentrographic analysis1998–2013+8.8
Flevoland (Netherlands) [9]Public dataCentrographic analysis2007–2013+3.3
Gothenburg (Sweden) [14]Public dataCentrographic analysis2000–2014+ 4.2
Halifax (Canada) [15]Private dataCentrographic analysis2012–2012+1.1
Los Angeles (USA) [16]Public dataCentrographic analysis1998–2009+9.8
Montreal (Canada) [15]Private dataCentrographic analysis2012–2012+0.3
Noord Holland (Netherlands) [9]Public dataCentrographic analysis2007–2013−2.0
Palmas (Brazil) [17]Public dataCentrographic analysis2002–2016+0.2
Paris (France) [1]Yellow pagesCentrographic analysis1974–2008+10
Paris (France) [9]Public dataCentrographic analysis2004–2012+4.1
Phoenix (USA) [5]Public dataCentrographic analysis1998–2015+2.7
São Paulo (Brazil) [18]Public dataCentrographic analysis2000–2017+1.6
Seattle (USA) [16]Public dataCentrographic analysis1998–2009−1.3
Shanghai (China) [7]Private dataCentrographic analysis2005–2018+3.44
Southern California (USA) [8]Public dataCentrographic analysis 1998–2014+12
Toronto (Canada) [19]Private dataCentrographic analysis2002–2012+1.3
Tokyo (Japan) [20]OD surveyAverage shipment distance1980–2003+6,4
Vancouver (Canada) [15]Private dataCentrographic analysis2012–2012+4.1
Utrecht (Netherlands) [9]Public dataCentrographic analysis2007–2013+0.5
Winnipeg (Canada) [15]Private dataCentrographic analysis2012–20120.0
Wuhan (China) [3]Public dataGeospatial1993–2014+8.2
Yangtze River Delta (China) [7]Private dataCentrographic analysis2005–2018+2.04
Zuid Holland (Netherlands) [9]Public dataCentrographic analysis2003–2013−1
Zurich (Switzerland) [2]Public dataDistance analysis1995–2012+7.7

Measuring the Logistics Sprawl

The first LS analysis was carried out in Paris [1]. By analyzing data between 1978 and 2008, the warehouses moved +10 km from the urban core, generating 6.45 million tons of CO2 each year [1]. Heitz and Dablac found a similar LSI (+0.5 km/year) analyzing data from 2000–2012 in Paris [21]. In addition, there are different spatial patterns considering the typologies of logistics facilities in Paris (as parcel terminals, groupage transport terminals, and groupage transport hubs) [22].
The difference in LS between monocentric (Paris) and polycentric metropolitan areas (Noord Holland, Zuid Holland, Flevoland, and Utrecht—all in the Netherlands) was analyzed by reference [9]. The logistics suburbanization was measured by the population density and number of warehouses and the differences between these metropolitan areas are explained by urban structure, the planning policies, and the freight hub for distribution across Europe [9].
In an analysis of the LS pattern in Gothenburg (Sweden), Heitz et al. identified the concentration of logistics facilities in the center of this metropolitan area [14]. Between 2000 and 2014, the number of warehouses increased by 56.8% and the mean distance of the center of gravity moved from +9.1 km to +13.3 km (+4.2 km). The proximity of the consumer market, the land price, the employees’ accessibility, and the accessibility of transport infrastructure are the potential factors that explain the locations of logistics facilities [14].
Todesco et al. explored the sprawling of logistics activities in the Zurich region (Switzerland), where the mean distance to the city center of Zurich increased for storage (+9.5 km), courier services firms (+7.7 km), and transportation firms (+0.7 km) between 1995 and 2012 [2]. Warehouse sprawling using employment data from the 1995–2012 period in Brussels (Belgium) was analyzed in reference [23]. The evolution of logistics facilities in Katowice (Poland) and the phenomenon defined as “anti-logistics sprawl” was considered in reference [24]. The analyses made for Brussels and Katowice did not measure the LSI.
By using data from a freight survey, Sakai et al. analyzed the spatial distribution of logistics facilities in Tokyo (Japan) [20]. The authors calculated the spread between the shipment origins and destination using average shipment distances (Euclidean distance between the facility and the origins or destinations) [20]. Results indicated spatial mismatch increase as facilities move away from the urban center. The average distance from the center moved from 26.2 km (pre-1981) to 32.6 (1991–2003) [20].
The location of the warehouse, the spatial distribution, and other factors driving the spatial distribution of warehouses were explored by reference [3], through a case study in Wuhan (China). Between 1993 and 2014, the LSI was +8.2 km (9.2 km in 1993 to 17.1 km in 2014) and the warehouses are more decentralized and concentrated [3]. The population density, land rent, and warehouse land use are the major factors contributing to the spatial distribution of warehouses in Wuhan [3]. The impacts of LS on agricultural freight were analyzed in Beijing (China) in reference [25] through traffic simulation. The authors evaluated the reallocation of all large wholesale centers from the fifth ring road of Beijing to outside the fifth ring road [25]. In Shanghai and the Yangtze River Delta (China), He et al. identified a movement of logistics enterprises to the southeast of the region, with the mean distance of the center of gravity moving from 27.57 km in 2005 to 31.59 km in 2015 in Shanghai and, from 153.99 km in 2005 to 165.63 in 2015 in the Yangtze River Delta [7]. The number of logistics enterprises increased 72.14% and 92.83% in 10 years in Shanghai and the Yangtze River Delta, respectively [7]. The public policy, land price, and technological progress could have contributed to the sprawling of the warehouses [7].
In North America, we identified studies for Atlanta, Seattle, Southern California, and Toronto. In Piedmont Atlanta Megaregion (PAM), the number of warehouses increased 203.8% between 1998 and 2008 (from 132 to 401), while the LSI increased +6.8 km in the same period [12]. Dablanc et al. compared the spatial patterns of warehouses in Los Angeles and Seattle: while the warehouses sprawled (+9.8 km) in Los Angeles, the average distance decreased (−1.3 km) in Seattle between 1998 and 2009 [16]. A similar result was found in reference [8] analyzing data between 1998 and 2014. Also, the authors found a spatial correlation between warehouses and the industries, and the number of warehouses is explained by population density [8].
In the Greater Toronto Area (GTA), the number of warehouses increased 38.2% between 2002 and 2012, and the average distance of center moved from 16.7 km to 17.9 km (+1.3 km) north of the region [19]. The low LSI could be related to the lack of land for expansion in GTA [19]. Another five Canadian metropolitan areas were analyzed in reference [15], which did not identify a trend in the spatial pattern of warehouses.
In Chicago, the average distance from the mean center for warehousing increased +8.8 km between 1998 and 2013, with the number of warehouses having increased 115% in this period (from 217 to 446) [5]. In Phoenix, between 1998 and 2015, the number of warehouses rose 346% (from 41 to 183), while the LSI increased 15% (from 17.86 km to 20.60 km) [5]. By analyzing data from 64 US metropolitan areas and using the relative distance between two activities, Kang identified that the trend of increasing the distance from the warehouse to business establishments stopped since 2008, as a consequence of the economic recession in the US [26].
In Latin America, LS studies were developed for three Brazilian metropolitan areas: Belo Horizonte, Palmas, and São Paulo. In Belo Horizonte, most of the warehouses are located in high-income areas, closer to roads and railroads [13]. Using data from a commercial board, the number of warehouses increased by 322% (95 to 401) between 1995 and 2015, and the LSI was 1.2 km [13]. In Palmas, the logistics land-use planning concentrated the warehouses closer to the city center (+6.06 km in 2002), and its location did not move in 2016 (+5.83 km in 2016). In São Paulo, the number of warehouses increased from 209 to 417 between 2000 and 2017, while the LSI was +1.6 km [18]. In Brazil, LS may be related to government investments in terms of the development of the northern region of Belo Horizonte and the public policies adopted by Belo Horizonte’s neighboring cities [13]. In Palmas, the LS has the same movement as the urban sprawl [17]. Furthermore, there may be a possible influence of taxes, such as service tax on the location of warehouses in São Paulo [18].
By using the concept of reallocation of logistics facilities, the location of the wood market in New Delhi (India) was analyzed in reference [27], where the size of the wood market measured the LSI. The fruit and vegetable wholesale market reallocation from a central suburb to a suburban area in Melbourne (Australia) was analyzed in reference [28]. From a telephone questionnaire with retailers, the delivery schemes were identified, and the market relocation increased the distance traveled by wholesalers by 31% [28]. In addition, considering a new freight village in Palmas airport, the average distance from the city center could increase by 86%, with negative impacts on urban freight transport [17].
Understanding the spatial distribution of warehouses is fundamental for effective metropolitan logistics planning [12,22]. A possible influence of the local policies regarding land use in LS was observed in Atlanta [12], reinforcing the concept presented in reference [2] that LS is a land-use phenomenon. In other metropolitan areas, the LS indicator did not present a significant value, probably due to the lack of land for warehouse expansion [19]. Land use also seems to have influenced the location of warehouses in Southern California since they are close to road infrastructure and intermodal facilities [8].
The lack of logistics policies associated with the lack of logistics land use could have contributed to the logistics sprawl in many metropolitan areas, favoring the increase of land price in the core of these metropolitan areas [29]. In this way, logistics land use coordinated with infrastructure accessibility, employee accessibility, and population density are elements that could lead to a spatial pattern of less decentralized warehouses that do not contribute to logistics sprawl. For this, it is important to know the LSI for the development of public policies.

3. Research Method

The analysis method used in this paper consists of three steps: (i) data collection, (ii) centrographic analysis, and (iii) econometric analysis, illustrated in Figure 1.

3.1. Data Collection

Data were obtained from Internet search engines using the terms “distribution center” and “warehouse” in Portuguese since the analysis is from a study area in Brazil. The existence of a distribution center, its location data, and the opening year at that location were identified and checked in satellite images, as proposed in reference [11]. It is acknowledged that this method might not be the most efficient for identifying all logistics facilities since most of them might not have information available on the Internet.
This procedure was chosen as data availability is incipient in Brazil. The Access to Information Law allowed researchers to have access to public data (as is the case for warehouse data). However, identifying the responsible department is still a complex and arduous process. Moreover, the lack of data standardization and the time of access to information are factors that encourage the use of secondary data in transport analysis, as reported in this paper. Although it is impossible to analyze the accuracy of the database, the authors believe that this method is one alternative to obtaining the data at a low cost. It is worth mentioning that a similar method (search of the yellow pages) was used in reference [1]. Therefore, it could be interesting to verify if the use of the Internet can be expanded to other metropolitan areas.
Additionally, socioeconomic data provided by the public agency [30] was obtained for each city of the metropolitan areas of the study area for the most recent year. The socioeconomic data were used to characterize the metropolitan areas and to identify the factors which influence the number of warehouses.

3.2. Measuring the Logistics Sprawl Indicator

Since the warehouse location data were obtained in a text file, the first step was organizing these data points in spreadsheets. These data points were exported to the Google My Maps application, which allows the user to save multiple addresses and create a personalized map. After that, the maps created for each metropolitan region of interest were saved in KMZ format—KMZ is a compressed version of the KML (Keyhole Markup Language) format, and it is used to save geographic information. Next, each KMZ file was separately uploaded into geographic information system software and converted to the shapefile format. A shapefile is a file format that allows information to be attached to geometric features (dots, lines, or polygons). Finally, a geographic coordinate system (UTM 22S) was chosen, and the data were converted to this system to perform the centrographic method.
The centrographic method allows us to measure the changes in the distribution of warehouses in space and over time, through the use of indicators as the mean center, relative distance, and standard deviational ellipse [9]. The mean center identifies the center of concentration for a set of warehouses. The set of warehouses is composed of warehouses installed in a metropolitan area, in one decade. LSI is obtained from the relative distance. The standard deviational ellipse was calculated to plot the direction of the displacement of warehouses by the mean center. The standard deviational ellipse is a spatial region around the mean center in which all warehouses are within one standard deviation of the mean center.
The LSI and the standard deviational ellipse were obtained for each metropolitan area, for each period of analysis. Details about the centrographic method are available in reference [31].

3.3. Factors Influencing the Number of Warehouses

Lastly, the influence between socioeconomic data, the LSI, and the number of warehouses were evaluated by linear regression. For this, a linear model was estimated to identify the relationship between these variables. The findings were compared with the literature. Details about linear regression are available in reference [32].

4. Results

Brazil has 35 metropolitan areas; eight are located in the state of Paraná: Apucarana, Campo Mourão, Cascavel, Curitiba, Londrina, Maringá, Toledo, and Umuarama [33]. Except for Curitiba, the metropolitan areas are contiguous and can influence one another concerning urban freight transport. Figure 2 shows the location of the state of Paraná in Brazil and the location of the metropolitan areas in Paraná.
The state of Paraná has a recent history. As an example, its capital, Curitiba, was founded in 1842, and its metropolitan area of Curitiba was created in 1973, being the oldest metropolitan area in the state of Paraná. The metropolitan area of Curitiba has an industrial park, and its regional economy is based on industry, trade, and service. The metropolitan areas of Maringá and Londrina were created in 1998. The regional economy is based on agribusiness and industry in Londrina, and in agribusiness and services in Maringá. In 2015, the metropolitan areas of Apucarana, Campo Mourão, Cascavel, and Toledo were created. The regional economy is based on services in Apucarana; on agribusiness, trade, and services in Cascavel; and agribusiness in Campo Mourão and Toledo.
Table 2 presents the socioeconomic information about our study area. These metropolitan areas are formed by 48% of the cities in the state, which occupy 41% of the area of the state, where 65% of the population lives. Regarding the economic sector that generates freight trips, 33% of the establishments are retail businesses.
The number of warehouses is presented in Table 3. The socio-economic development and productive restructuring in Paraná took place in the 1990s and can be seen in the growing number of warehouses, especially in Curitiba. In 2018, from all 924 warehouses, 52% initiated their activities after the 2000s.

4.1. Centrographic Analysis

Table 4 presents the results of the relative distance. In Curitiba, the warehouses are close to the mean center, and the relative distance has been reducing each decade. On the other hand, warehouses are located more than 40 km away from the mean center in Toledo. Campo Mourão stands out due to the small number of warehouses (only six), which are located in the urban area. The same phenomenon occurs in Umuarama, with only nine warehouses in the analyzed period, located distant from the mean center of the metropolitan area.
Figure 3 shows the representation of the relative distance per decade. The warehouses are located along the highways (red lines). Despite the increasing number of warehouses observed between the 2000s and 2010s, the relative distances changed only slightly, which indicates that the warehouses are located in the same cluster of each metropolitan area. In Curitiba’s case, it is noticeable that the warehouses are located close to the mean center. In Campo Mourão, the warehouses are located at the intersections of the highways, which also correspond to the location of the main city of the metropolitan region. The warehouses are more disperse in Apucarana and Toledo.
Figure 4 shows the deviational ellipses, indicating the direction of the sprawling of the warehouses per decade. In Apucarana, Maringá, Toledo, and Umuarama, the deviational ellipses show a similar direction to that of the highways that cross these metropolitan areas. The same is observed for the 1970s’ ellipse in Curitiba. Furthermore, Apucarana’s ellipse is directed towards Londrina.
Table 5 presents the LSI in the metropolitan areas of Paraná. These results lead to concluding that the LS is nearly non-existent in these metropolitan areas. A similar tendency was observed in other metropolitan regions, as seen in the literature review.
In Apucarana, the LSI was 3.2 km, and most warehouses were located near the highways that cross the metropolitan area. A similar result was obtained in Cascavel, with an LSI of 3.9 km in 48 years. However, in the most recent period (the 2000s–2010s), a decreasing tendency in the LSI (−1.5 km) was observed, and most warehouses were located along the highways. The municipality of Cascavel, metropolitan area headquarters, has a dry port, which might explain the increase in the number of warehouses, mainly closer to the dry port, and the LSI retraction between the 2000s and 2010s. However, the economy based on agribusiness might be related to the low number of warehouses in this metropolitan area. In Londrina, a low spread of 2.7 km was observed, which began in the 1990s. We also observed a cluster of warehouses closer to the highways. The same was observed in Maringá, in which the LSI was 1.2 km.
In Curitiba, decade by decade, the warehouses are closer to the mean center, especially near the highways that cross the metropolitan area. Over the decades, the most significant retraction occurred between the 1980s and 1990s and became less over the next decades. This phenomenon might be due to two hypotheses. The first one is the data collection method, which depends on the establishments being registered on Google Maps or yellow page websites, which might have limited obtaining the data. The more recent information (the 1990s onwards) might have been more easily available on Internet websites, influencing the results; since the 1990s, more distribution centers were identified than before. Another possible hypothesis is the growth of the services sector in the 1990s in the metropolitan area being related. As an example, the city of Curitiba was responsible for more than half of the commercial sector’s aggregate value in the 2000s. Finally, the city of Curitiba might have had an influence on the location of warehouses with its urban planning and sustainable transportation policies that started in the 1970s. This relation between public policies and the location of the warehouses could be explored in future studies.
In Toledo, it sprawling of the warehouses was not observed, with a small approximation (+0.2 km) of them to the mean center. The same phenomenon was observed in Umuarama, with an approximation of 1.3 km to the mean center of this metropolitan area. It was not possible to calculate the LSI in Campo Mourão due to insufficient data. It is assumed that the low number of warehouses found might be related to the limitations of the data collection method, which depends on the distribution centers being available on Google Maps or on the online yellow pages.
Moreover, the regional economy in the metropolitan area might influence the number of warehouses in Paraná. Toledo, Campo Mourão, and Umuarama are important grain production regions in Brazil. Since the information about storage silos was not collected (this type of storage is not focused on in this study), these areas presented low numbers of warehouses and low LSI. Furthermore, the commercial establishments of the cities in these metropolitan areas are formed by nanostores (small independent stores) that, in general, buy products from distributors and the products come from bigger cities such as Curitiba or São Paulo.

4.2. Relationship between Characteristics of the Metropolitan Area, Number of Warehouses, and LSI

The regression model aimed to identify the variables that influence the number of warehouses and the LSI in a metropolitan area. The 2018 data were used in these models. The results presented in Table 6 indicate some relationship for the number of warehouses. Firstly, it demonstrates the negative relationship between the number of warehouses and the area. In the case under study, many metropolitan areas have a large territorial surface dedicated to agriculture. Thus, the influence of economic activities in the metropolitan area seems to influence land use and, consequently, the number of warehouses. In addition, although the territorial area is not always directly related to the number of municipalities that make up a metropolitan area, in this study, the number of municipalities has a negative relationship with the number of warehouses. It is worth noting that few Brazilian cities concentrate most warehouses [13,18]. Thus, this relationship needs to be explored from the spatial point of view, as done in references [8,15], including the influence of the characteristics of the urban space on the number of warehouses. Furthermore, the number of retail business establishments has a positive relationship with the number of warehouses in a metropolitan area, which could be explained by the importance of the warehouse to urban deliveries.
On the other hand, it is observed that the size of the metropolitan area has a negative relationship with the LSI. In fact, the existence of land in regions far from consumer centers (in many cases, the headquarters of the metropolitan area) stimulates the location of warehouses in these places, mainly due to the low cost of land. Thus, the size of a metropolitan area will always stimulate the location of warehouses in the most peripheral areas, contributing negatively to the LSI. Other variables are not statistically significant for the case under study.

5. Discussion

Our results present a similar trend as others in Brazil, even the largest, as is the case in São Paulo. Figure 5 compares the LSI by year for all Brazilian metropolitan areas. We normalized the LSI by the number of years in the period considered, creating an indicator between −1 and 1. The warehouses move to the mean center in Curitiba and Umuarama and sprawl slowly in other metropolitan areas. Therefore, there is a trend in the logistics sprawl in Brazilian metropolitan areas. Still, although the size of the metropolitan areas has a relationship with the number of warehouses in the metropolitan regions of Paraná, it seems that the area of the metropolitan area does not have the same effect on the logistics sprawl.
We did a similar analysis considering all LSIs identified in the literature and reported in Table 1. Figure 6 shows this comparison. The warehouses did not spread in 54% of metropolitan areas. On the other hand, the spread of warehouses was high in 18% of metropolitan regions, being more than 0.5 km/year. This result also seems to confirm that the size of a metropolitan area is not related to the logistic sprawl indicator, contradicting the hypothesis proposed in reference [16], that the logistics sprawl is characteristic of large metropolitan areas, which serve as a freight hub for regional and national distribution. Thus, more important than measuring the LSI is identifying the variables that explain the location of warehouses in some zones of the metropolitan area. To this end, complementary studies that explore the relationship between urban factors and the location of warehouses are fundamental for the design of freight transportation public policies.
In this paper, similar to what was analyzed in references [3,8], we identified the relationship between the number of warehouses and the LSI and characteristics of metropolitan areas (as size, number of cities, and number of retail businesses). The different variables considered in these studies do not allow comparison. Still, it can be concluded that there are variables that influence the number of warehouses in a metropolitan region. Our results provide a more global view of the phenomenon. Thus, we suggest analyzing the spatial correlation of these variables, at the city level, to identify the characteristics of cities that influence the number of warehouses.
These findings highlight the importance of freight transportation planning at a metropolitan level. Regardless of the fact that freight transportation is neglected in municipal public policies [34], it is essential to rethink the logistics planning process, including cargo mobility. Hereupon, warehouses, important logistical infrastructure for urban distribution, should not be considered just as large infrastructure with negative impacts on the surroundings, but they must be considered as factors of efficiency of freight transportation that can provide an improvement in the quality of life for residents and help economic development.

6. Conclusions

In this paper, we measured the logistics sprawl in the metropolitan areas of the state of Paraná (Brazil), and we evaluated the influence of characteristics of metropolitan areas on the logistics sprawl. It is known that the occurrence of LS can contribute to negative impacts, such as the increase in travel distances and travel time, which increases fuel consumption and emissions. Therefore, the local and regional administrators must consider the LS while developing public policies related to urban freight transportation to minimize these negative impacts.
One of the contributions of this paper is a procedure for data collection. The studies conducted for Paris show that data have an influence on the LSI results. In other words, the amount of data collected, and the time period analyzed can influence the measures for the phenomenon. In our data collection procedure, we identified the importance of selecting keywords and defining the study area. In addition, just using Google Maps is not sufficient; it is important to check if businesses exist on the websites. Finally, it is crucial to check the existence and functioning of the establishment, since many companies may not have updated information on homepages. These verification steps are important because the process is manual and it is a time-consuming job to ensure that the database obtained reflects the reality of the analyzed phenomenon. Therefore, it is important to standardize the data collection method to allow more realistic comparisons or to use indicators. The method used in this study was shown to be efficient. However, many establishments, especially family businesses, may not present their services on online platforms, which creates a limitation for this data collection method. Thus, to avoid a biased analysis, it is important to adopt the method used in reference [11], which uses updated databases to verify the location and operation of the logistics facilities.
Moreover, the relationship between the size of the metropolitan area and the number of warehouses still needs to be better understood [10,14]. In this study, it was identified that the size and the number of retail businesses are the variables that influence the number of warehouses. Finally, the size has a negative influence on the LSI. However, we suggest using spatial analysis to investigate this in more depth.

Author Contributions

Conceptualization, L.T.M.d.S. and L.K.d.O.; methodology, L.T.M.d.S. and L.K.d.O.; formal analysis, L.T.M.d.S. and L.K.d.O.; investigation, L.T.M.d.S. and L.K.d.O.; data curation, L.T.M.d.S.; writing—original draft preparation, L.T.M.S. and L.K.O.; writing—review and editing, L.T.M.d.S. and L.K.d.O.; supervision, L.K.d.O. Both authors have read and agreed to the published version of the manuscript.

Funding

This research was funded by Conselho Nacional de Desenvolvimento Científico e Tecnológico grant number 303026/2017-0.

Acknowledgments

The authors would like to thank CNPq and CAPES for the research support.

Conflicts of Interest

The authors declare no conflict of interest.

References

  1. Dablanc, L.; Rakotonarivo, D. The impacts of logistics sprawl: How does the location of parcel transport terminals affect the energy efficiency of goods’ movements in Paris and what can we do about it? Procedia Soc. Behav. Sci. 2010, 2, 6087–6096. [Google Scholar] [CrossRef] [Green Version]
  2. Todesco, P.; Weidmann, U.; Haefeli, U. Logistics sprawl in the Region of Zurich. In Proceedings of the 16th Swiss Transport Research Conference, Acona, Switzerland, 18–20 May 2016. [Google Scholar]
  3. Yuan, Q.; Zhu, J. Logistics sprawl in Chinese metropolises: Evidence from Wuhan. J. Transp. Geogr. 2019, 74, 242–252. [Google Scholar] [CrossRef]
  4. Taniguchi, E.; Thompson, R.G.; Yamada, T. New opportunities and challenges for city logistics. Transp. Res. Procedia 2016, 12, 5–13. [Google Scholar] [CrossRef] [Green Version]
  5. Dubie, M.; Kuo, K.C.; Giron-Valderrama, G.; Goodchild, A. An evaluation of logistics sprawl in Chicago and Phoenix. J. Transp. Geogr. 2020, 88, 102298. [Google Scholar] [CrossRef]
  6. He, M.; Shen, J.; Wu, X.; Luo, J. Logistics Space: A Literature Review from the Sustainability Perspective. Sustainability 2018, 10, 2815. [Google Scholar] [CrossRef] [Green Version]
  7. He, M.; Zeng, L.; Wu, X.; Luo, J. The Spatial and Temporal Evolution of Logistics Enterprises in the Yangtze River Delta. Sustainability 2019, 11, 5318. [Google Scholar] [CrossRef] [Green Version]
  8. Jaller, M.; Pineda, L.; Phong, D. Spatial Analysis of Warehouses and Distribution Centers in Southern California. Transp. Res. Rec. J. Transp. Res. Board 2017, 2610, 44–53. [Google Scholar] [CrossRef]
  9. Heitz, A.; Dablanc, L.; Tavasszy, L.A. Logistics sprawl in monocentric and polycentric metropolitan areas: The cases of Paris, France, and the Randstad, the Netherlands. Region 2017, 4, 93–107. [Google Scholar] [CrossRef] [Green Version]
  10. Aljohani, K.; Thompson, R.G. Impacts of logistics sprawl on the urban environment and logistics: Taxonomy and review of literature. J. Transp. Geogr. 2016, 57, 255–263. [Google Scholar] [CrossRef]
  11. Heitz, A.; Launay, P.; Beziat, A. Rethinking Data Collection on Logistics Facilities. Transp. Res. Rec. J. Transp. Res. Board 2017, 2609, 67–76. [Google Scholar] [CrossRef]
  12. Dablanc, L.; Ross, C. Atlanta: A mega logistics center in the Piedmont Atlantic Megaregion (PAM). J. Transp. Geogr. 2012, 24, 432–442. [Google Scholar] [CrossRef] [Green Version]
  13. Oliveira, L.K.; Santos, O.R.; Oliveira, R.L.M.; Nóbrega, R.A.A. Is the location of Warehouses Changing in the Belo Horizonte Metropolitan Area (Brazil)? A logistics sprawl analysis in a Latin American Context. Urban Sci. 2018, 2, 43. [Google Scholar] [CrossRef] [Green Version]
  14. Heitz, A.; Dablanc, L.; Olsson, J.; Sanchez-Diaz, I.; Woxenius, J. Spatial patterns of logistics facilities in Gothenburg, Sweden. J. Transp. Geogr. 2020, 88, 102191. [Google Scholar] [CrossRef]
  15. Woudsma, C.; Jakubicekb, P. Logistics land use patterns in metropolitan Canada. J. Transp. Geogr. 2020, 88, 102381. [Google Scholar] [CrossRef]
  16. Dablanc, L.; Ogilvie, S.; Goodchild, A. Logistics Sprawl: Differential Warehousing Development Patterns in Los Angeles, California, and Seattle, Washington. Transp. Res. Rec. J. Transp. Res. Board 2014, 2410, 105–112. [Google Scholar] [CrossRef] [Green Version]
  17. Bracarense, L.S.F.P.; Assis, T.A.; Oliveira, L.K.; Oliveira, R.L.M. Logistics Sprawl Assessment Applied to Locational Planning: A Case Study in Palmas (Brazil). In City Logistics 2: Modeling and Planning Initiatives; Taniguchi, E., Thompson, R.G., Eds.; ISTE Ltd and John Wiley & Sons, Inc.: London, UK, 2018; Volume 2, pp. 333–349. [Google Scholar]
  18. Guerin, L.; Vieira, J.G.V. Logistics Sprawl in São Paulo Metro Area. In Logistics 4.0 and Sustainable Supply Chain Management: Innovative Solutions for Logistics and Sustainable Supply Chain Management in the Context of Industry 4.0, Proceedings of the Hamburg International Conference of Logistics (HICL), Hamburg, Germany, 13–14 September 2018; Jahan, C., Kersten, W., Ringle, C.M., Eds.; Hamburg University of Technology: Hamburg, Germany, 2018; Volume 26, pp. 147–165. [Google Scholar]
  19. Woudsma, C.; Jakubicekb, P.; Dablanc, L. Logistics sprawl in North America: Methodological issues and a case study in Toronto. Transp. Res. Procedia 2016, 12, 474–488. [Google Scholar] [CrossRef] [Green Version]
  20. Sakai, T.; Kawamura, K.; Hyodo, T. Locational dynamics of logistics facilities: Evidence from Tokyo. J. Transp. Geogr. 2015, 46, 10–19. [Google Scholar] [CrossRef]
  21. Heitz, A.; Dablanc, L. Logistics Spatial Patterns in Paris: Rise of Paris Basin as Logistics Megaregion. Transp. Res. Rec. J. Transp. Res. Board 2015, 2477, 76–84. [Google Scholar] [CrossRef]
  22. Heitz, A.; Launay, P.; Beziat, A. Heterogeneity of logistics facilities: An issue for a better understanding and planning of the location of logistics facilities. Eur. Transp. Res. Rev. 2019, 11. [Google Scholar] [CrossRef] [Green Version]
  23. Strale, M. Logistics sprawl in the Brussels metropolitan area: Toward a socio-geographic typology. J. Transp. Geogr. 2020, 88, 102372. [Google Scholar] [CrossRef]
  24. Krzysztofik, R.; Kantor-Pietraga, I.; Spórna, T.; Dragan, W.; Mihaylov, V. Beyond ‘logistics sprawl’ and ‘logistics anti-sprawl’. Case of the Katowice region, Poland. Eur. Plan. Stud. 2019, 27, 1646–1660. [Google Scholar] [CrossRef]
  25. Zhao, B.; Zhang, J.; Wei, W. Impact of Time Restriction and Logistics Sprawl on Urban Freight and Environment: The Case of Beijing Agricultural Freight. Sustainability 2019, 11, 3675. [Google Scholar] [CrossRef] [Green Version]
  26. Kang, S. Relative logistics sprawl: Measuring changes in the relative distribution from warehouses to logistics businesses and the general population. J. Transp. Geogr. 2020, 83, 102636. [Google Scholar] [CrossRef]
  27. Gupta, S.; Garima. Logistics Sprawl in Timber Markets and its Impact on Freight in Metropolitan City of Delhi, India. Transp. Res. Procedia 2017, 25, 965–977. [Google Scholar] [CrossRef]
  28. Aljohani, K.; Thompson, R.G. The impacts of relocating a logistics facility on last food miles—The case of Melbourne’s fruit & vegetable wholesale market. Case Study Transp. Policy 2018, 6, 279–288. [Google Scholar] [CrossRef]
  29. Diziain, D.; Ripert, C.; Dablanc, L. How can we bring logistics back into cities? The case of Paris metropolitan area. Procedia Soc. Behav. Sci. 2012, 39, 269–281. [Google Scholar] [CrossRef] [Green Version]
  30. Paraná. Perfil das Regiões Metropolitanas. Available online: www.ipardes.gov.br (accessed on 15 July 2020). (In Portuguese)
  31. Mitchell, A. The ESRI Guide to GIS Analysis Volume 2: Spatial Measurements & Statistics; ESRI Press: Redlands, CA, USA, 2005. [Google Scholar]
  32. Washington, S.; Karlaftis, M.; Mannering, F. Statistical and Econometric Methods for Transportation Data Analysis; Chapman & Hall/CRC: Boca Raton, FL, USA, 2011. [Google Scholar]
  33. IBGE. Regiões Metropolitanas, Aglomerações Urbanas e Regiões Integradas de Desenvolvimento; Instituto Brasileiro de Geografia e Estatística: Brasília, Brazil, 2018. (In Portuguese) [Google Scholar]
  34. Dias, J.M.; Sobanski, G.B.; Silva, J.E.A.R.; Oliveira, L.K.; Vieira, J.G.V. Are Brazilian cities ready to develop an efficient urban freight mobility plan? URBE Rev. Bras. Gest. Urbana 2018, 10, 587–599. [Google Scholar] [CrossRef]
Figure 1. Steps of the research method. KMZ = compressed Keyhole Markup Language.
Sustainability 12 09779 g001
Figure 2. Location of Paraná in Brazil and of metropolitan areas in Paraná.
Sustainability 12 09779 g002
Figure 3. Representation of the logistics sprawl in the metropolitan areas of Paraná.
Sustainability 12 09779 g003
Figure 4. Representation of the deviational ellipses in the metropolitan areas of Paraná.
Sustainability 12 09779 g004
Figure 5. Comparison of logistics sprawl indicator by year in Brazilian metropolitan areas.
Sustainability 12 09779 g005
Figure 6. Comparison of logistics sprawl indicator by year among the studies identified in the literature.
Sustainability 12 09779 g006
Table 2. Socioeconomic information of metropolitan areas [30].
Metropolitan AreaNumber of CitiesArea (km2)PopulationEmployed PopulationNumber of Retail Businesses
Apucarana236836.19299,359149,6302763
Campo Mourão2511,937.56330,164161,7933276
Cascavel2311,270.46526,893258,9005377
Curitiba2916,627.213,615,0271,681,45429,483
Londrina259069.051,101,595510,72410,514
Maringá265979.34810,774381,2748792
Toledo188161.27394,784197,8844298
Umuarama2412,099.07312,883151,3333139
Paraná399199,880.2011,348,9375,307,831103,674
Table 3. Number of warehouses by metropolitan area.
Metropolitan Area (MA)1960s1970s1980s1990s2000s2010s
Apucarana---122632
Campo Mourão----24
Cascavel-124910
Curitiba-61343117141
Londrina114112632
Maringá-1482027
Toledo-3361313
Umuarama----45
Table 4. The relative distance to the mean center of the metropolitan area (in km).
MA1970–19791980–19891990–19992000–20092010–2018
Apucarana--33.735.936.9
Campo Mourão---*2.3
Cascavel**28.333.732.2
Curitiba19.716.313.211.811.4
Londrina*13.412.614.816.2
Maringá*22.125.620.523.3
Toledo41.241.241.341.041.0
Umuarama---26.325.0
* It was not possible to calculate due to insufficient amount of data (minimum sample of four warehouses).
Table 5. Logistics sprawl indicator, per decade.
Metropolitan Area1970–19801980–19901990–20002000–20101970–2018
Apucarana--2.21.03.2
Campo Mourão-----
Cascavel--5.4−1.53.9
Curitiba−1.6−3.1−1.4−0.3−6.5
Londrina-−0.92.21.42.7
Maringá-3.6−5.22.81.2
Toledo0.00.1−0.30.0−0.2
Umuarama---−1.3−1.3
Table 6. Relationship between characteristics of metropolitan area, number of warehouses, and LSI.
Independent VariableDependent VariableCoefficientt-Value or Z-Valuep-Value
ln(number of warehouses)Intercept5.7649.287<2 × 10–16 ***
Number of cities−6.751 × 10⁻²−2.6300.0086 **
Size of metropolitan area−1.651 × 10⁻⁴−6.7881.14 × 10-11***
Retail business1.592 × 10–412.711<2 × 10–16 ***
LSIIntercept7.572.6340.0388 *
Area−0.0007−2.6260.0393 *
Significance code: *** 0.001; ** 0.01; * 0.05.
Publisher’s Note: MDPI stays neutral with regard to jurisdictional claims in published maps and institutional affiliations.

