Investigating Paradigm Shift from Price to Value in the Air Cargo Market

Graduate School of Logistics, Inha University, Incheon 22212, Korea
*
Author to whom correspondence should be addressed.
Sustainability 2020, 12(23), 10202; https://0-doi-org.brum.beds.ac.uk/10.3390/su122310202
Submission received: 29 October 2020
/
Revised: 2 December 2020
/
Accepted: 3 December 2020
/
Published: 7 December 2020
(This article belongs to the Special Issue Technologies and Innovations for Sustainable Air Transportation)
Abstract
:This study presents a paradigm shift in the air cargo market based on Korea and Incheon Airport’s empirical data. The air cargo market has traditionally handled expensive items and has been a supplier-oriented market. There has been little room for individual customers in this market. However, “value” gradually replaces “price” in this market. The value depending on consumer preferences significantly impact air cargo demand. Consequently, items transported by air cargo are changing, and airlines and other market participants are revising operation policy. Economic growth may be losing its dominant power as the main growth engine in the air cargo market. This study identifies the weakened link between air cargo increase and economic growth based on the Granger causality test. COVID-19 calls for a deeper understanding of the paradigm shift in the market for sustainable air transport because COVID-19 will further stimulate it. In this regard, the air cargo business, which maintains a stable trend even during COVID-19, is seen as a new opportunity for the aviation industry. Since sustainable air transport requires an accurate understanding of the paradigm shift in the air cargo market, this study enhances our knowledge of the paradigm shift and provides significant implications for sustainable air transport.
1. Introduction
There are several fundamental beliefs in the air cargo market. A widely accepted truth is that air cargo service is expensive. Since air freight is more expensive than other transport fares, transporting expensive products through air transport has been a natural result. Therefore, the air cargo market has been led by large suppliers or companies that can afford high transport costs. The price-oriented paradigm has also affected the decisions of air cargo market participants. The airline’s cargo aircraft operation policy is usually to operate point-to-point to production bases in different parts of the world to satisfy demand. It is because it is economically advantageous to load as many expensive products as possible, given the aircraft’s operating cost.
However, signs of change are being detected in the paradigm of “price”, which seemed stable in the air cargo market. For example, Korean Air, one of the world’s largest cargo airlines, flies empty planes to eastern Canada instead of spending time filling the load space. It is to transport live lobsters. The lobsters’ value decreases sharply according to time delays. The Lululemon t-shirt, famous for its yoga attire, sells for $19 online, but consumers who want to wear it right now are willing to pay $5 to $10 for air cargo. These examples show that consumers’ taste for eating live lobsters and consumers’ preferences for Lululemon T-shirts affect demand in the air cargo market.
There was little room for consumer tastes or preferences to be involved in the air cargo market in which the price-oriented paradigm was dominant. However, the impact of subjective “value” in the air cargo market, which depends on consumers’ preferences and tastes, is gradually expanding. The air freight market no longer seems limited to the B2B market. Some consumers are willing to pay air cargo fares to meet their needs. The paradigm shift in demand is also causing a paradigm shift in supply. The air cargo market has been strongly dependent on economic growth and increased trade volume. In other words, increasing trade volume centered on large companies and suppliers has been a strong supplier of the air cargo market. However, the growing involvement of consumer preferences in the air cargo market may also change the relationship between economic growth and increased air cargo. The recent COVID-19 pandemic is a good example. The global economy is shrinking in the aftermath of the COVID-19 pandemic, but the air cargo market has maintained a relatively stable trend, worldwide air passenger traffic dropped 58.5% year-on-year in the first half of 2020, but global air cargo traffic dropped 12.3% over the same period (ACI, 2020 [1]).
To identify the paradigm shift in the air cargo market, this study raises the following two research questions: The first question is whether consumers’ preferences and tastes significantly affect the demand for air cargo. The second question is whether the link between economic growth and the increase in air cargo remains strong. We apply the case of Incheon International Airport (ICN) and South Korea for empirical research on the paradigm shifts in demand and supply in the air cargo market.
Understanding a new paradigm of “value” rather than “price” can provide market participants with significant implications. Retailers and large suppliers can approach fast delivery through air transport from a product competitiveness perspective instead of a transport choice perspective. Technologies such as cold chains, block chains, and big data can be leveraged as a channel for consumers to express their tastes and preferences.
2. Literature Review
This study focuses on the two areas of the literature; transport mode selection and the link between economic growth and air cargo quantity. The following sections provide a detailed review of these two strands of literature.
2.1. Transport Mode Selection
This study is interested in mode selection because air transport advantages compared to other transport modes play a significant role in understanding recent changes in the air cargo market. Studies of transport mode selection have been conducted largely on choosing between railways and roads (Jiang et al., 1999 [2]; Brooks and Trifts, 2008 [3]; Shinghal and Fowkes, 2002 [4]; Choi et al., 2008 [5]; Norojono et al., 2003 [6]). Based on discussions on the selection criteria and transport processes, significant studies have been conducted on decision-making between sea and air transport. Puckett et al. (2011) [7] demonstrated shippers have a strong willingness to pay for high-frequencies, offsetting sea transport mode’s disadvantages such as longer traveling time. De Jong and Ben-Akiva (2007) [8] suggested that unobserved factors, such as reliability of travel time and flexibility in reacting quickly to unforeseen demands, can significantly affect mode selection decisions over the explicit logistics costs. These previous studies commonly observe transport mode selection from the perspectives of commodity characteristics, customer characteristics, and modal characteristics (Mitra and M.Leon, 2014 [9]). Most of these studies have focused on modal characteristics, suggesting the main criteria for selecting transport follows cost, time, and reliability. Ultimately, it is of primary concern to reduce overall costs in transport mode choice, given that time and reliability can also be translated into costs (Demir et al., 2015 [10]). It is also important to take into account not only explicit internal transport costs (e.g., fuel economy, driver wages) but also invisible external costs such as the environmental and resource issues (Greene and Wegener, 1997 [11]), the well-being of society, congestion, and the reduction of reputation due to delivery errors (Forkenbrock, 1999 [12]; 2001 [13]).
Some studies define cost more in detail related to time, such as distance-based link cost, time-based link cost, loading and unloading time, access and egress cost, and trans-shipment cost (De Jong and Ben-Akiva, 2007 [8]). Reliability is an emerging concept in describing transport mode selection. Reliability is expanding into larger concepts beyond stability for modes such as punctuality and credibility. For instance, environmental issues, including air pollution, carbon emissions, noise, water pollution, and congestion, are emerging in this domain (Blum, 1998 [14]; Levinson et al., 1998 [15]; Santos et al., 2010 [16]). In the past, internal and external standards, such as speed and accuracy, have served as the main criteria that significantly affect the decision to choose the transport mode. These criteria have recently diversified and seem to be becoming more value-oriented.
Moreover, as trade patterns and types of demand vary, the choice of transport modes needs to consider individual circumstances (e.g., distance traveled, the purpose of travel, time and location constraints, and regional transport infrastructure). As a result, the choice of transport mode had occupied a lower position in the supplier’s supply chain, but now the scope of importance is expanding to the competitive point of view of commodity sales (Demir et al., 2015 [10]).
The comparative advantage of air transport as a transport mode can also be discussed at this point. Air transport fares are generally estimated to be 4 to 5 times more expensive than land transport and 12 to 16 times more expensive than sea transport (World Bank, 2009 [17]). Air transport sets much higher fares than other means of transport, but there is room for a significant impact on product competitiveness. Park et al. (2009) [18] suggest a strong need for speed and reliability in supply chain management. They estimate that air transport is the fastest-growing sector in the cargo industry due to its speed and reliability. Zhang (2003) [19] also presents speed as the biggest advantage of air transport and suggests the need for comprehensive estimation of costs associated with air transport, such as airport usage fees, terminal and ground operation costs, and logistics facility operating costs. In particular, market growth through the combination of multi-transport modes, enhanced connectivity, and the expansion of open skies policy can be an opportunity to overcome the limitations of high air freight costs and maximize the advantages of air transport. Air transport may be more economical than other transport modes, considering the overall distribution cost from production base to consumption channel. The invisible elements of air transport, such as stability, ease of door to door transport, speed, and punctuality especially enhance service satisfaction and flexible adaptability to changing demand.
In addition, air cargo can respond flexibly to changes in circumstances. For example, airlines can use cargo planes or belly spaces depending on demand and urgency for cargo loading (Feng et al., 2015 [20]). Chu (2014) [21] discusses the carrier and route preferences of freight forwarders in Taiwan. This study suggests that the advantages of selecting air transport include reliability, on-time services, and the possibility of express shipments. It also minimizes the externality of mode selection by providing efficient cargo handling and customs clearance services at the destination airport due to the quality of service and airlines seeking to enhance their reputation. Zhang (2003) [19] distinguishes between local cargo, gateway cargo, and hub cargo. Based on hub air cargo operations, the transshipment of air-to-air, air-to-rail, or air-to-sea becomes a lot easier, and shippers have advantages to quickly change decisions and respond to environmental changes. As competition between airlines and airports intensifies, air cargo handling experience is accumulated, and cost competitiveness increases, including ground handling charges (Kupfer et al., 2011 [22]). Most network carriers operate multi-modal networks, such as road feeder networks, away from their respective hub operations, ensuring safe and prompt delivery to final destinations (Boonekamp and Burghouwt, 2017 [23]). These studies suggest that, while the explicit costs for air transport are generally high, other attributes reduce externality and increase reliability. These strengths of air transport provide significant implications to meet the growing consumers’ preferences and tastes.
2.2. The Link between Economic Growth and Air Cargo Increase
Many previous studies have presented economic growth as the most important variable in determining air transport volume and have suggested a positive correlation between economic growth and air transport volume. Kasarda and Green (2005) [24] revealed that there are strong correlations between the increase in air cargo and the GDP and per capita GDP. Meersman and Nazemzadeh (2017) [25] suggested that efficient freight transport activity can become a strong driving force for economic growth. Dobruszkes et al. (2011) [26] presented GDP as a major variable in determining air transport volume in the European aviation market, suggesting that GDP is suitable as a proxy variable to measure the degree of economic development. Using panel data from China’s aviation market, Yao and Yang (2012) [27] found that growth in the air transport market is correlated with economic growth. Due to the close relationship between economic growth and the air transport market, air traffic volume has also been sensitive to events or risks such as cyclical or seasonal fluctuations and external economic shocks (Dewulf, 2014 [28]).
However, since a significant correlation does not explain the direction of causality, there have been additional studies on the causality between the two variables. Fernandes and Pacheco (2010) [29] identified a causal relationship between the degree of economic development and passenger growth in the domestic aviation market through a wide range of time-series data analyses from 1966 to 2006. Chang and Chang (2009) [30] found a bi-directional causal relationship between air cargo expansion and economic growth in Taiwan’s case, based on the Granger causality approach. Maparu and Mazumder (2017) [31] showed the existence of long-run causality from economic development to transport infrastructure expansion. Bofinger (2009) [32] revealed Granger causality from GDP to RPK (route passenger-kilometers as a proxy for demand), based on Brazil domestic market data.
However, some studies have recently questioned the solid link between aviation demand, including air cargo, and economic growth. Zhu et al. (2020) [33] analyzed decoupling between freight transport and economic growth in China, revealing that between 1997 and 2017, there were 14 weak decouplings and two strong decouplings. Hu et al. (2015) [34] stated that causality did not exist for GDP to air traffic in the short-run, while there exists a long-run bi-directional causality between real GDP and air traffic. This implies that GDP might not be a good predictor to forecast air traffic, at least in the short term. The current situation in South Korea supports this approach. Although Korea’s economic growth rate is far from the high-growth era, in which it grew by 5~6% per year, air traffic volume grew at an unprecedented rate. The quarterly CAGR of real GDP was 0.8% from 2011 Q3 to 2018 Q4, when the economic crisis was resolved, while the CAGR of international passengers was 2.2%, nearly tripled. The CAGR for international cargo is also 1.8 %, higher than the quarterly CAGR of real GDP. Besides, the air freight market has remained stable despite the economic slowdown caused by the COVID-19 outbreak. In the second quarter of 2020, when the COVID-19 crisis broke out, the number of passengers at ICN dropped 98% year-on-year, but air cargo dropped only 5%.
Off-shoring is another important factor that weakens the link. For example, Samsung Electronics, the biggest manufacturer in South Korea, has operated mobile phone plants at the Yen Phong Industrial Zone in Vietnam since 2009. It leads Samsung’s overseas mobile phone plants in production volume, pumping out 150 million units per year. Samsung has adopted a policy to export mobile phones directly from its production plants in Vietnam to consumer destinations. As a result, while increased mobile phone sales increase Samsung Electronics’ profits and affect domestic economic growth, there is less room for this growth to increase domestic air cargo.
3. Paradigm Change in the Air Cargo Market
3.1. Research Design and Methodology
This study explores the paradigm shift in the air cargo market in terms of demand and supply. The changes on the demand-side are diagnosed with various empirical data. The empirical data shows that time sensitivity and personal preferences, as a key driver, result in changes in transported items in the air cargo market. It also affects airlines’ operation policies accordingly. The empirical data demonstrates a paradigm on the demand-side is shifting from price to value.
This study employs the Granger causality test to explore the changes on the supply-side. The Granger causality analysis is one of the general and concise approaches used to verify causality between variables (Granger, 1969 [35]; 1980 [36]). For regression analysis, between the cause variables (independent variables, explanatory variables) and the result variables (dependent variables), it is generally assumed that the causal relationship has already been determined following the existing economic theory, and then the causal relationship is identified. However, it is not possible to conclude that there is a clear causality between the two variables when the cause and result are unclear. A simple test method for verifying causes and results using the distributed lag model was developed by C.W.J. Granger to solve these problems. The distributed lag model defines and describes the dependent variable by including the historically observed values of the dependent variable in the regression model, as shown in Equation (1).
where 𝑛 ≥ 1 and 𝑡 ≥ 𝑛 + 1.
The model starts with the approach that, to estimate , the combination of the historical value of with the historical value of y is more accurate than the time-series approach that uses only the historical values of y, and that the causal relationship from x to y can be demonstrated. Similarly, this can be used equally to demonstrate the existence of a reverse direction, i.e., a causal direction from y to x. The Granger causality test refers to verifying the null hypothesis (H0: β1 = β2 = … = βn = 0) that one variable does not help predict another variable and includes the following Equation (2) to verify the causal relationship from x to y. Similarly, it can be used equally to demonstrate the existence of a reverse direction, i.e., a causal direction from y to x. This is shown in Equation (3) as follows:
where .
As with other time-series analysis methods, the first step is to verify whether the time-series data has stationarity. In this study, the augmented Dicky–Fuller tests (ADF) method is adopted to verify the data integrity (Dicky and Fuller, 1981 [37]). The ADF method tests the null hypothesis that a unit root is present in a time series data. If the time series has a unit root characteristic, the lagged level of the series (yt−1) will provide no relevant information in predicting the change in yt except the lagged changes (∆yt−k). Thus, the robust results of causal verification cannot be obtained with the unit root problem. The ADF statistic is a negative number. If the absolute value of the statistic is large enough to reject the null hypothesis (i.e., the p-value for the statistic is less than a significant level), then it can be determined that there is no unit root problem in the time series and that the data have stationarity. If a time-series data has the unit root problem, the first difference of time-series can be a solution. In this case, the first difference of time-series data is the series of changes from one period to the next. For example, if yt represents a time-series y value at t-time, the first difference is yt–yt−1. When the first differencing series remains non-stationary, the solution can be the second differencing series. Since stationary data has a constant mean and variance, stationarity can be identified by graphical representation and the ADF method.
The second step is that the Granger causal test is sensitive to the number of selected trailing lags. Thus, it is necessary to choose the optimal lag lengths. In general, it is assessed that, for the monthly data, the appropriate terms of trailing lags can be selected from 1, 4, 6, 12, 24 and above, and for the quarterly data, 1, 2, 4, 8, 12 and above terms are sufficient. This study chooses the optimal lag lengths selected by a majority of the four methods of prediction error (FPE), Akaike information criterion (AIC), Hannan–Quinn information parameters (HQIC), and Schwarz information criterion (SBIC). If it is impossible to follow the majority decision principle, this study follows the AIC result as the following Equation (4).
where represents the variance estimate of the error term, T represents the number of observations, and k represents the number of parameters to be estimated.
3.2. Changes on Demand-Side
3.2.1. Empirical Analysis on Transported Item Changes
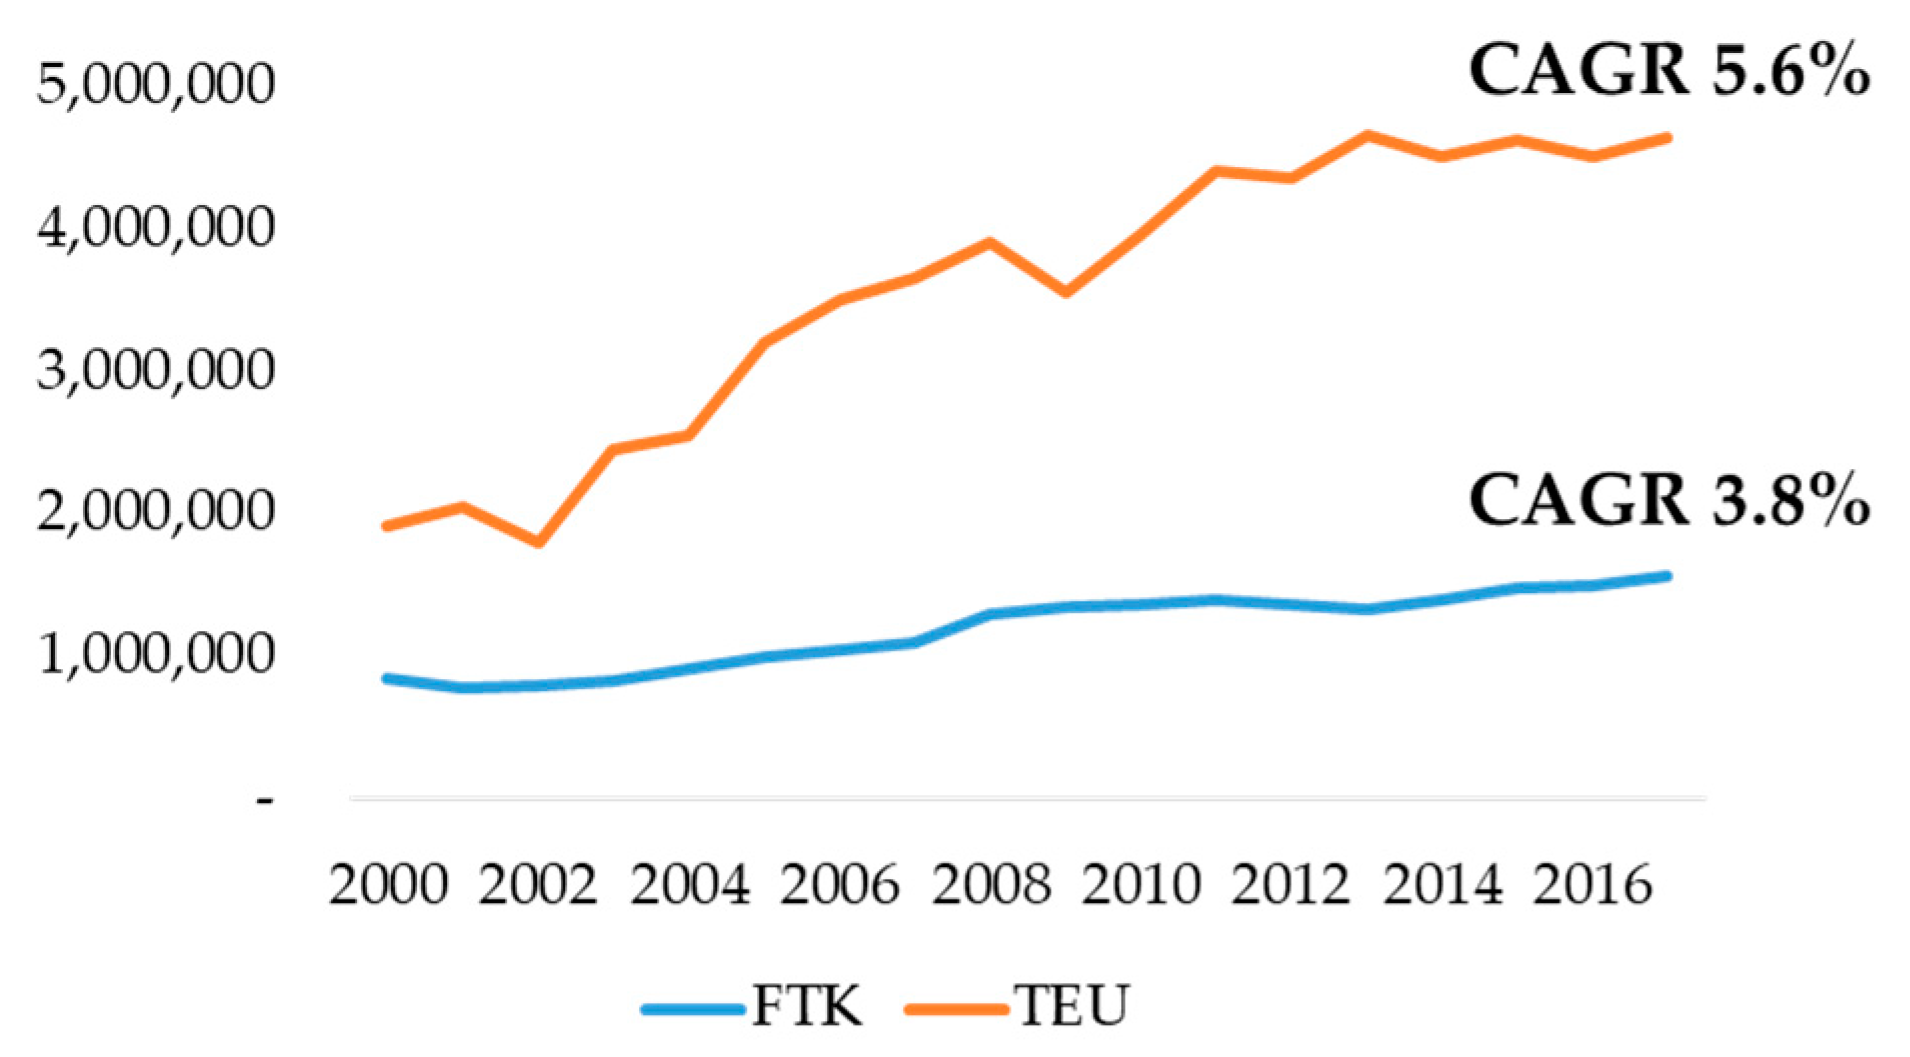
Traditionally, air freight growth has been slower than that of sea freight, as shown in Figure 1. Sea transport has offered lower fares than air transport, and it has been less sensitive to economic fluctuation. Moreover, with improved reliability, sea transport is expanding its business area into more expensive goods, which have been considered as an area of air transport (Milewski and Milewska, 2018 [38]; Paixao and Marlow, 2005 [39]). Increasingly, “simply expensive” cargo is not a sufficient reason for shippers to choose air transport over sea transport.
The items that consumers of the air cargo market want are no longer only expensive, heavy, and large-scale goods. Instead, cold-chain items such as fresh food and medicine, e-commerce, parts, equipment requiring high stability, and high-priced art and luxuries have become the leading transport items for air cargo. As shown in Figure 2, the cross-border e-commerce market’s explosive growth clearly illustrates this change. Sales in the global e-commerce market are expected to increase more than 20% annually by mid-2020 (eMarketer, 2019 [40]). The value of e-commerce companies is rising due to the recent outbreak of COVID-19. Customers who choose air transport are rapidly expanding from large suppliers or companies who want to transport high-priced products in large quantities to individual customers who purchase medicines, clothing, or electronics through e-commerce. Hong et al. (2018) [41] pointed out that the air cargo industry may not continue the benefits from globalization and international trade accelerating if it fails to respond to these new demands flexibly.
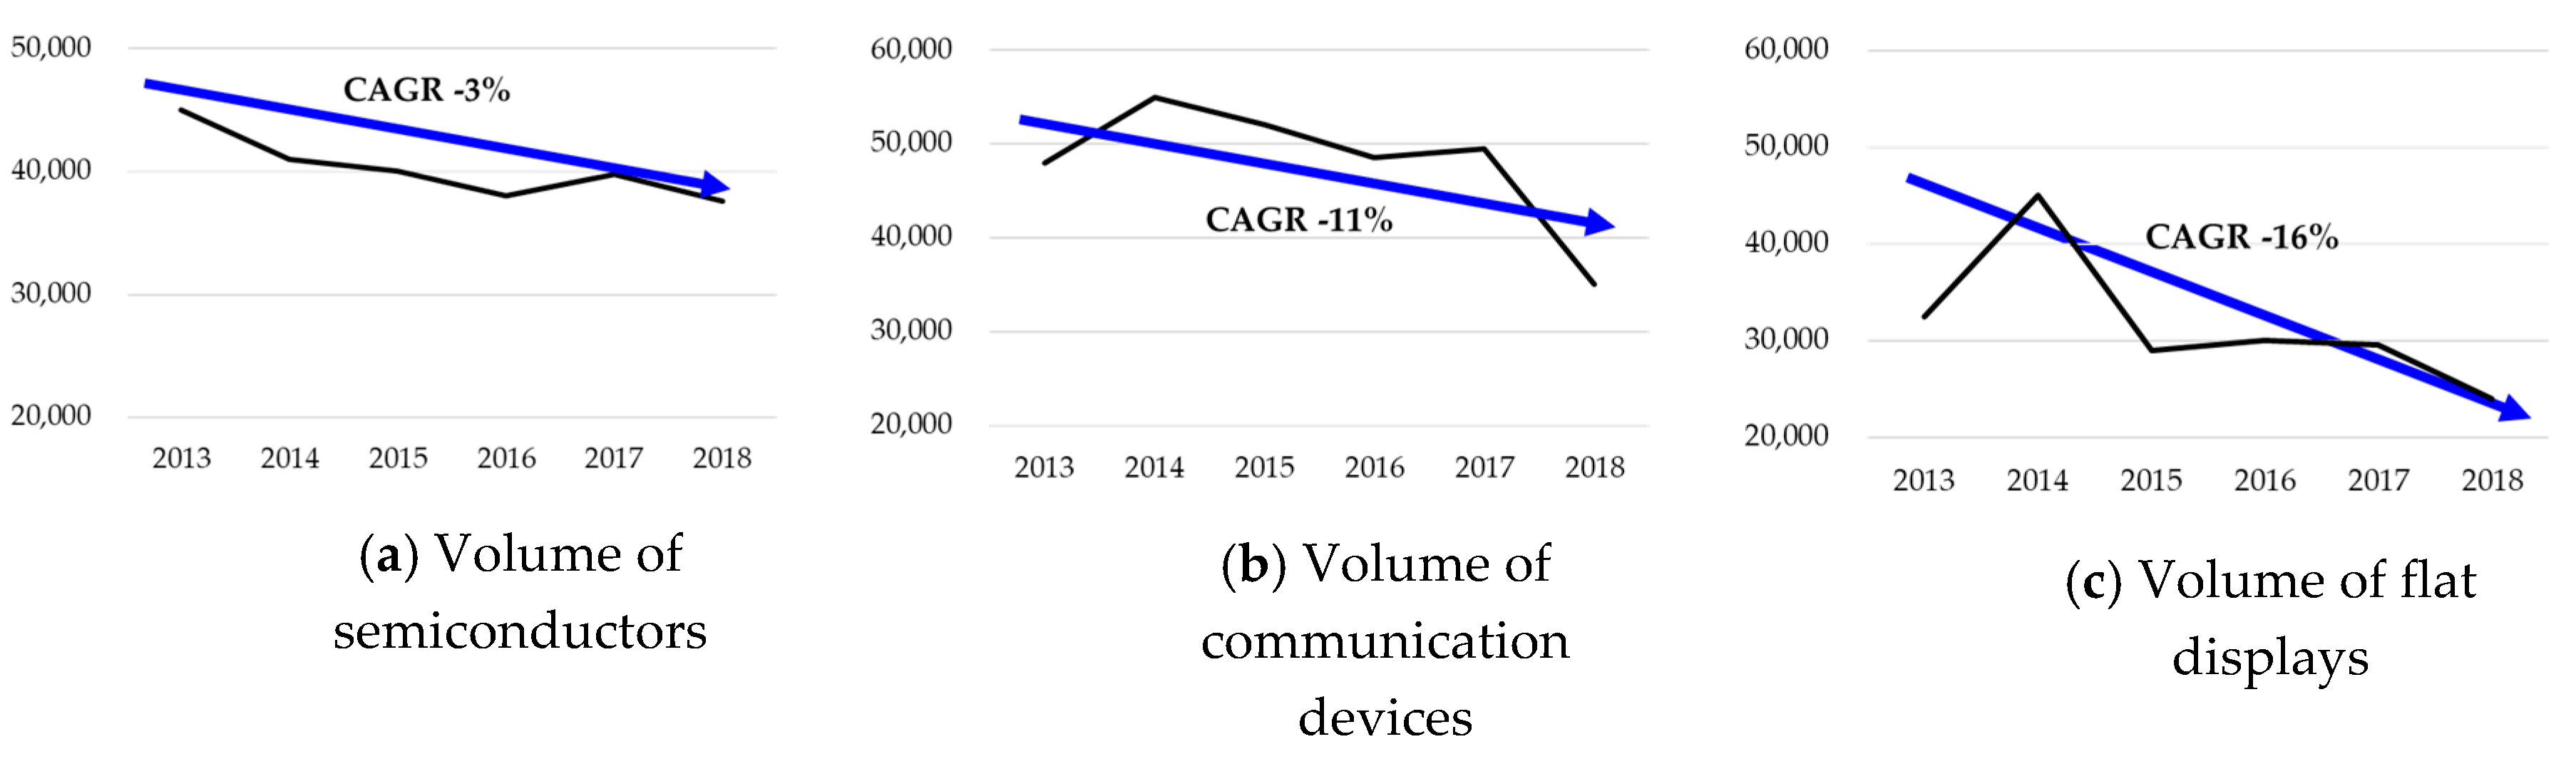
The situation in South Korea and ICN is not significantly different from global market trends. According to Figure 3, the volume of semiconductors, wireless communication devices, and flat displays, which were major products handled at ICN, has continuously decreased over the past five years. Table 1 shows the ranking of air transport products for 2013 and 2018 released by the Korea Customs Service. Three items, which were ranked high in the table in 2013, ranked much lower in 2018. Besides, flat-panel display panels disappeared from the table altogether.
Cargo space is no longer filled with exclusively expensive products. The impact of consumer preferences and tastes on air transport demand is growing. Table 2 illustrates this change in transported goods. Packaged food, cosmetics, and clothes are the top-ranked express shipping items at ICN. Table 3 also shows that express shipping has been rising sharply over the past three years.
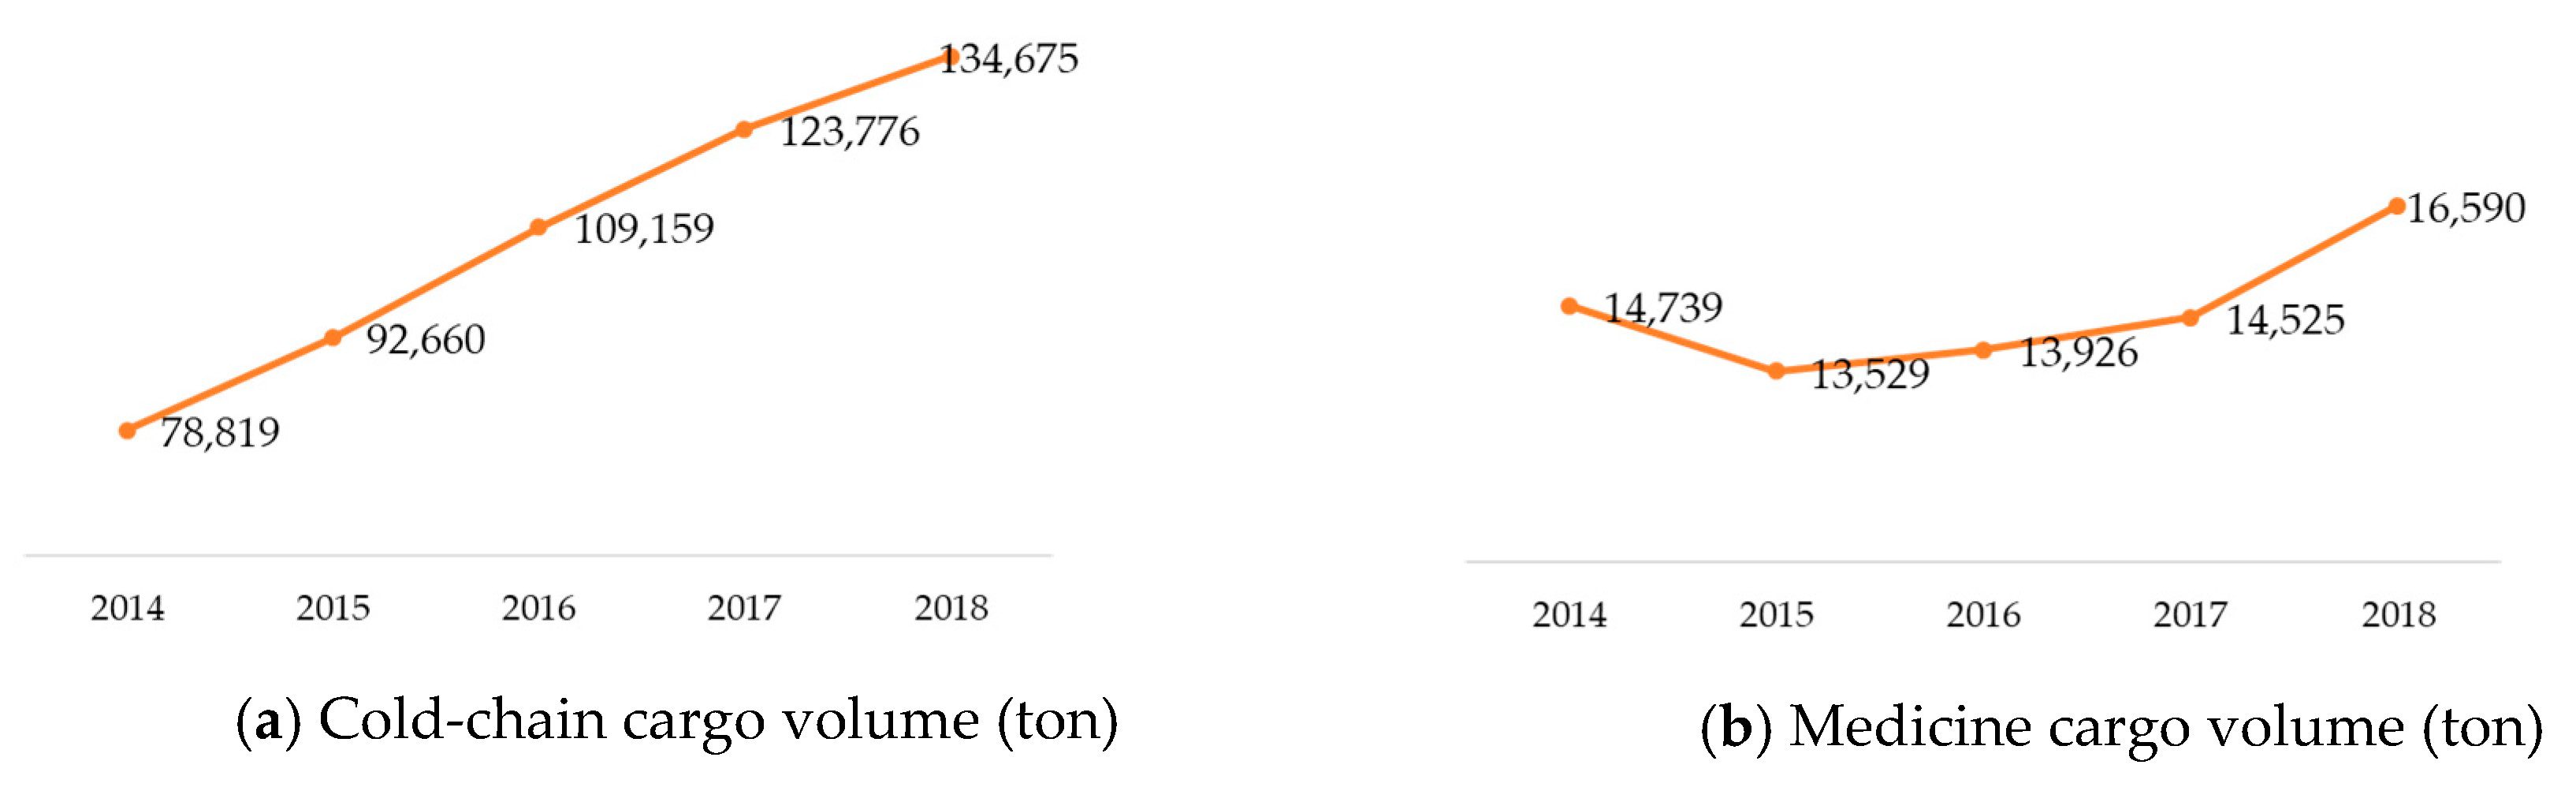
According to Figure 4, the cold-chain cargo volume at ICN grew from 78,819 tons in 2014 to 134,675 tons as of 2018, with an average annual growth rate of 14.3%. The volume of medicine shipments is also showing stable growth.
As a result, items being transported by air cargo are being smaller and diversified, as shown in Table 4. According to Table 3, weight increased by an average of 1.2% per year over the period while the number of shipments increased by 14.3%. The number of e-commerce shipments rose 12.6% during the same period.
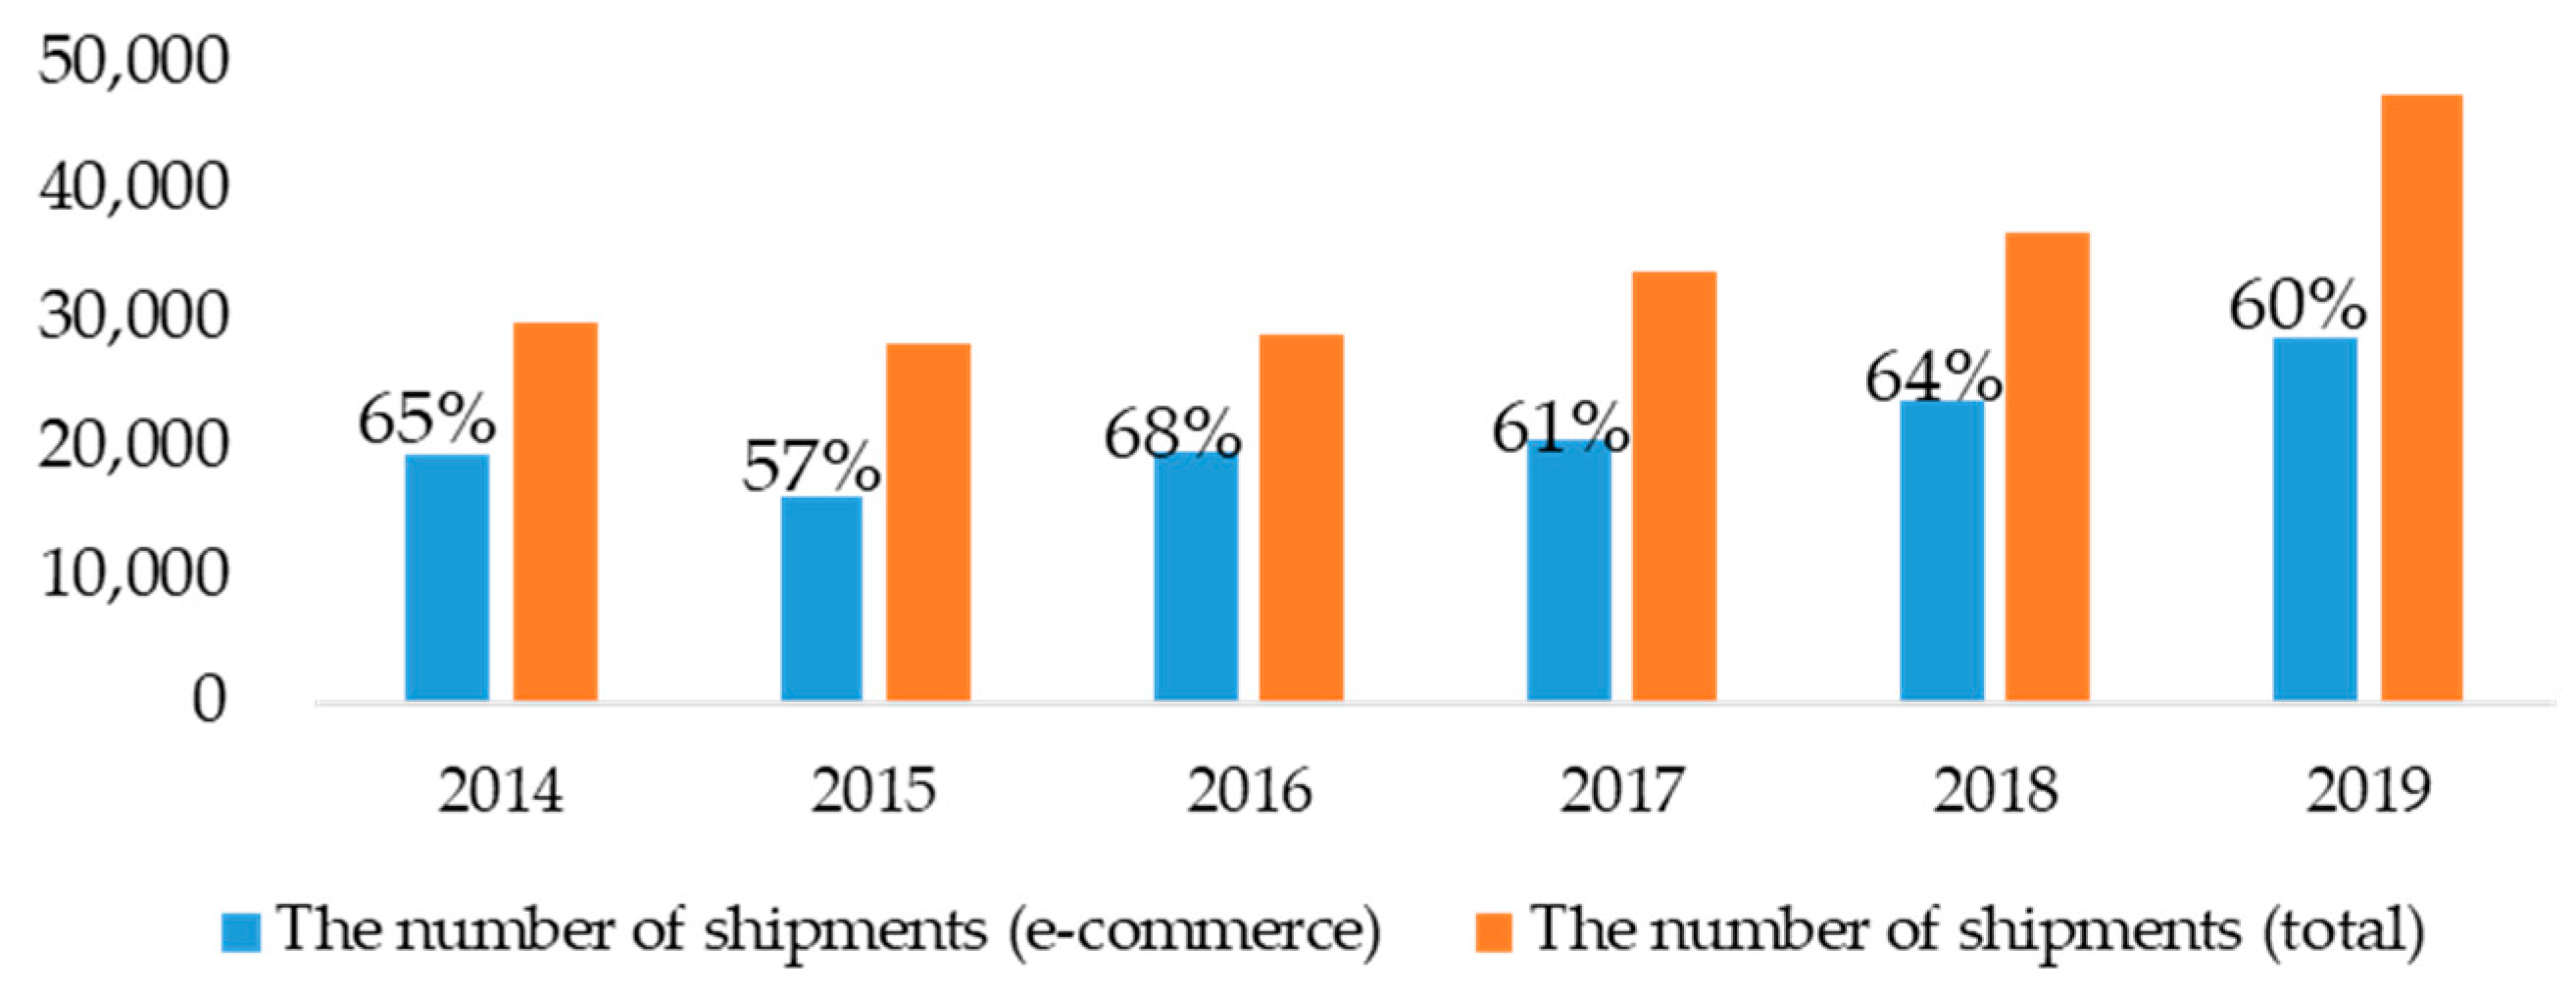
The number of e-commerce shipments at ICN has accounted for about 60 percent of the total number of shipments since 2014, as shown in Figure 5.
3.2.2. Empirical Analysis on Market Participant’s Behavior
Market participants are actively changing their operation policies to respond to growing consumer preferences and taste effectively. The airlines’ conventional model relying on wide-bodied DFA (dedicated freighter aircraft) cannot effectively respond to the current, the more customer-centric supply chain needs. Freighters, which have to fly long-haul and increase one-way frequencies to balance the load, have limitations in meeting the emerging values such as quick response, visibility, and speed (Hong et al., 2018 [41]).
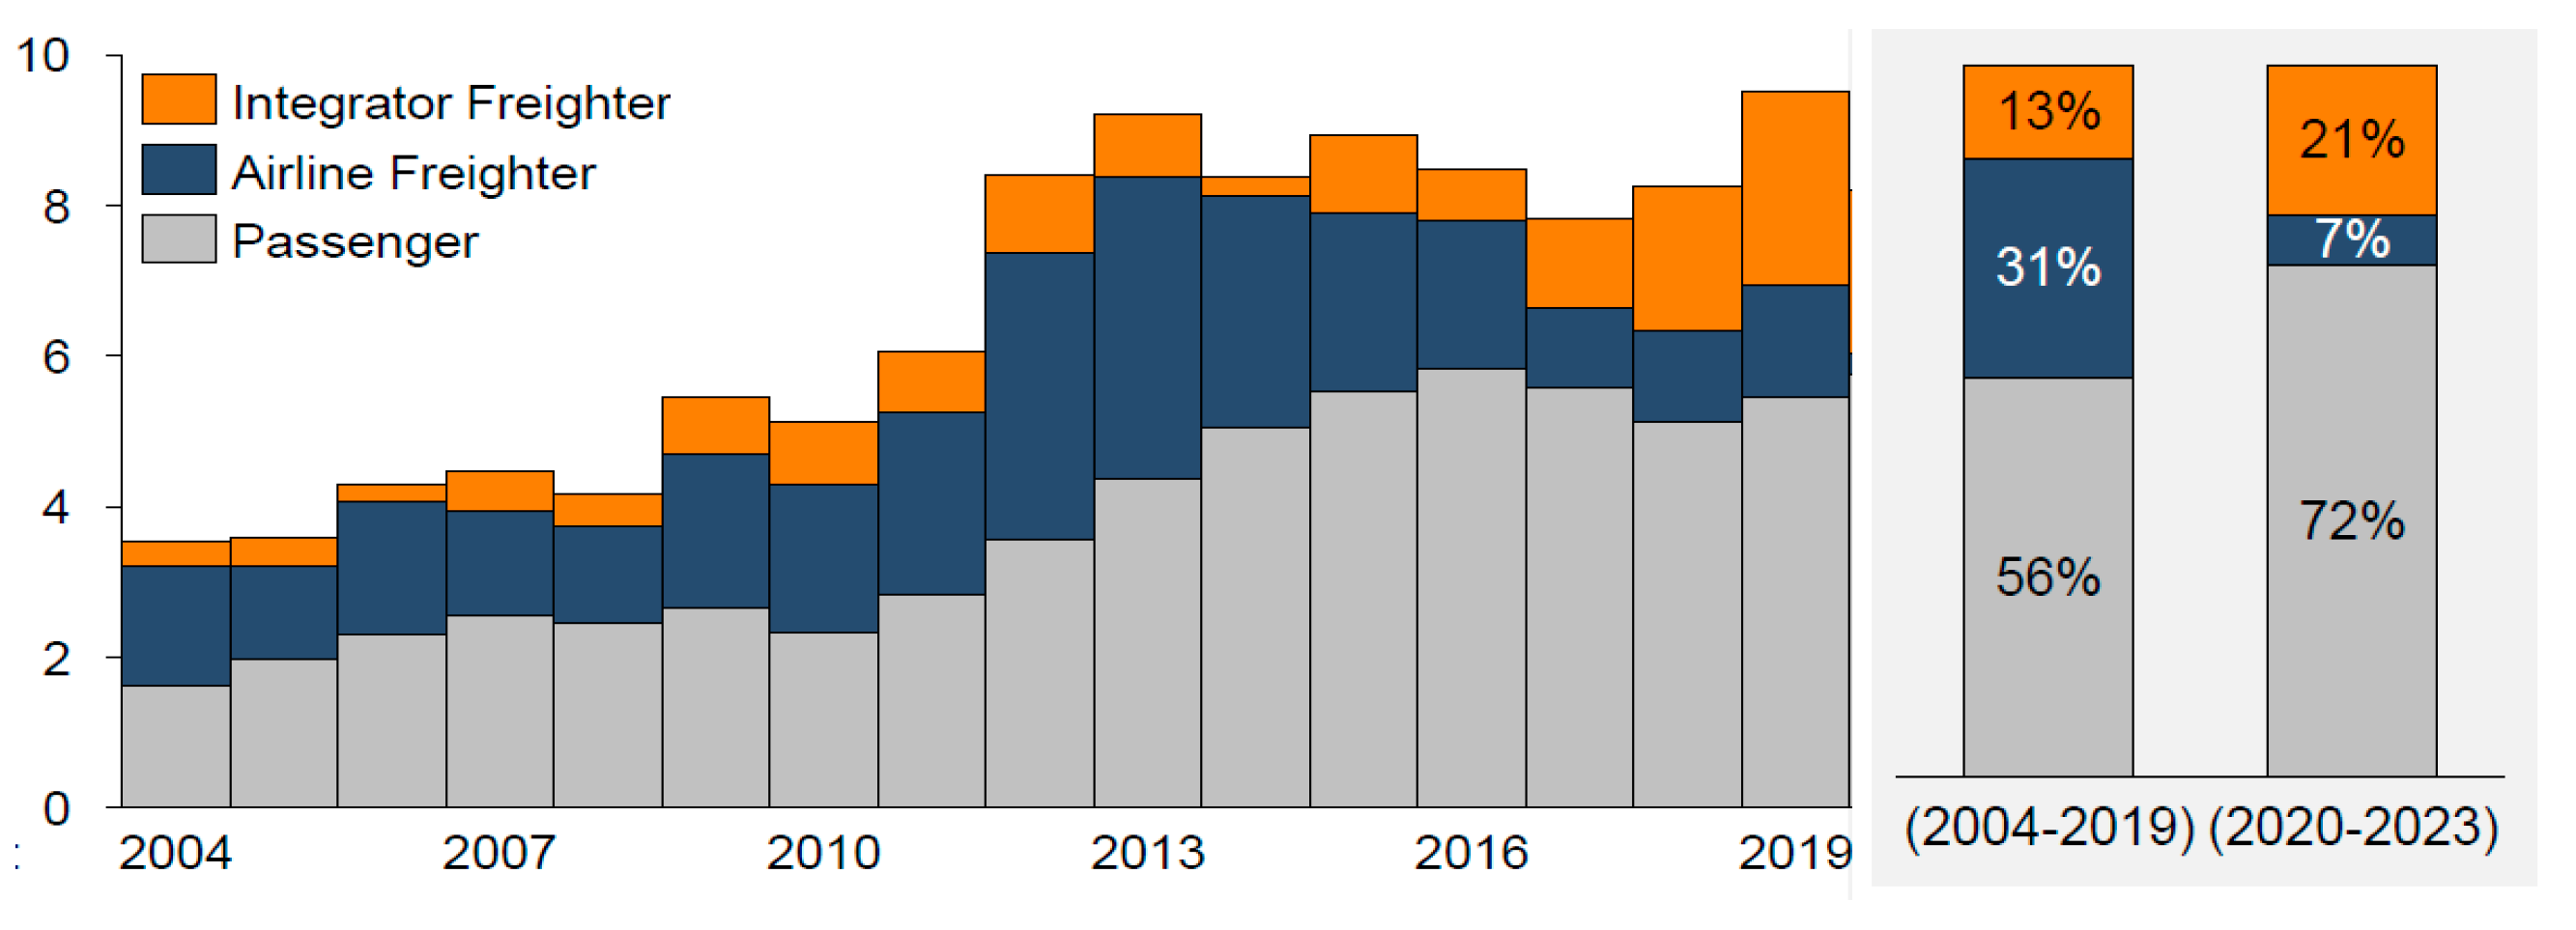
Major airlines in North America and Europe have already decreased cargo flights and instead expanded belly cargo operations. This is not only because they want to reduce costs by efficiently utilizing space in passenger planes, but also because cargo planes flying through multiple routes to fill space have clear limitations in responding to time-sensitive demands. According to Figure 6, 72% of the world’s air cargo throughput is expected to be handled through belly cargo in 2023.
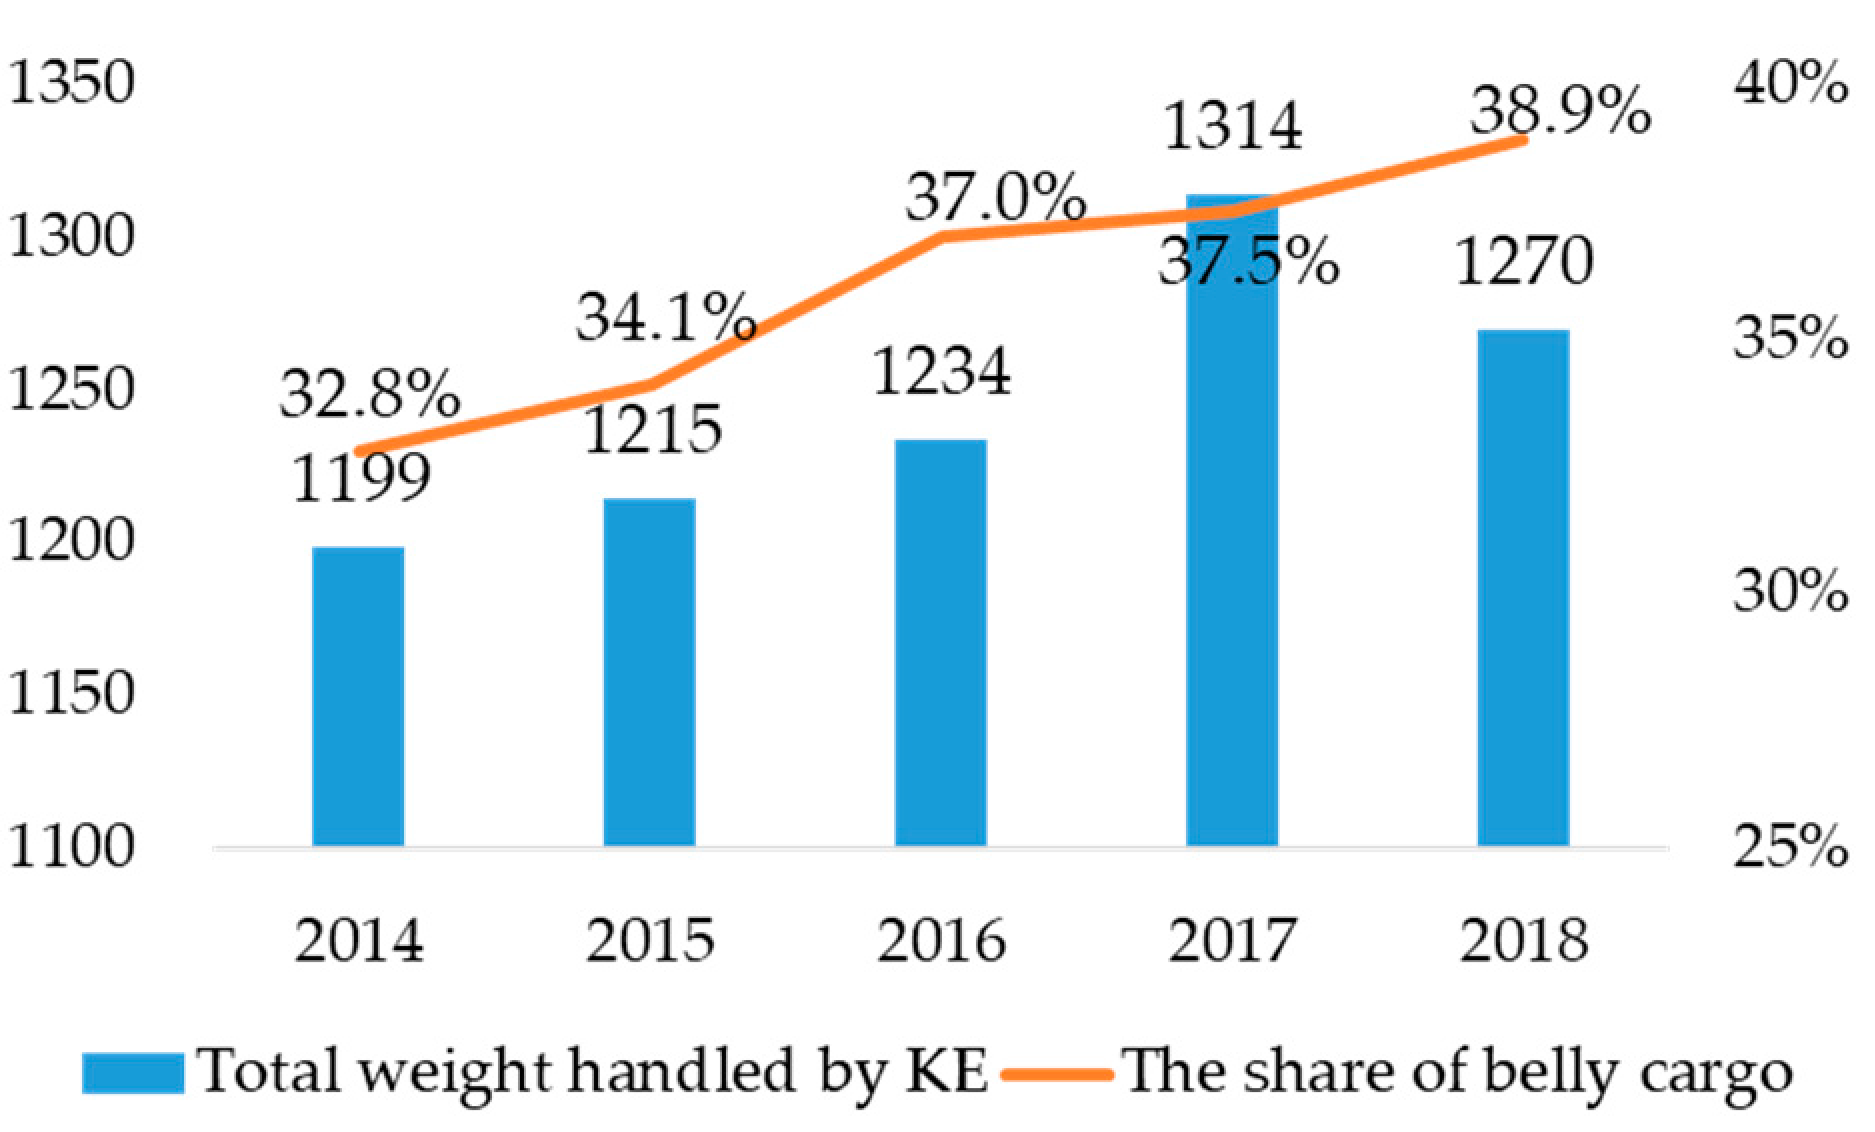
Korean Air, ICN’s hub carrier and the world’s fifth-largest cargo carrier, has sold eight cargo aircraft since 2016, as shown in Table 4, to counter changes in air cargo products. Instead, Korean Air increases supply capacity through belly cargo, as shown in Figure 7. The airline also acknowledges that traditional bulky and heavy items are no longer attractive targets for air cargo operations.
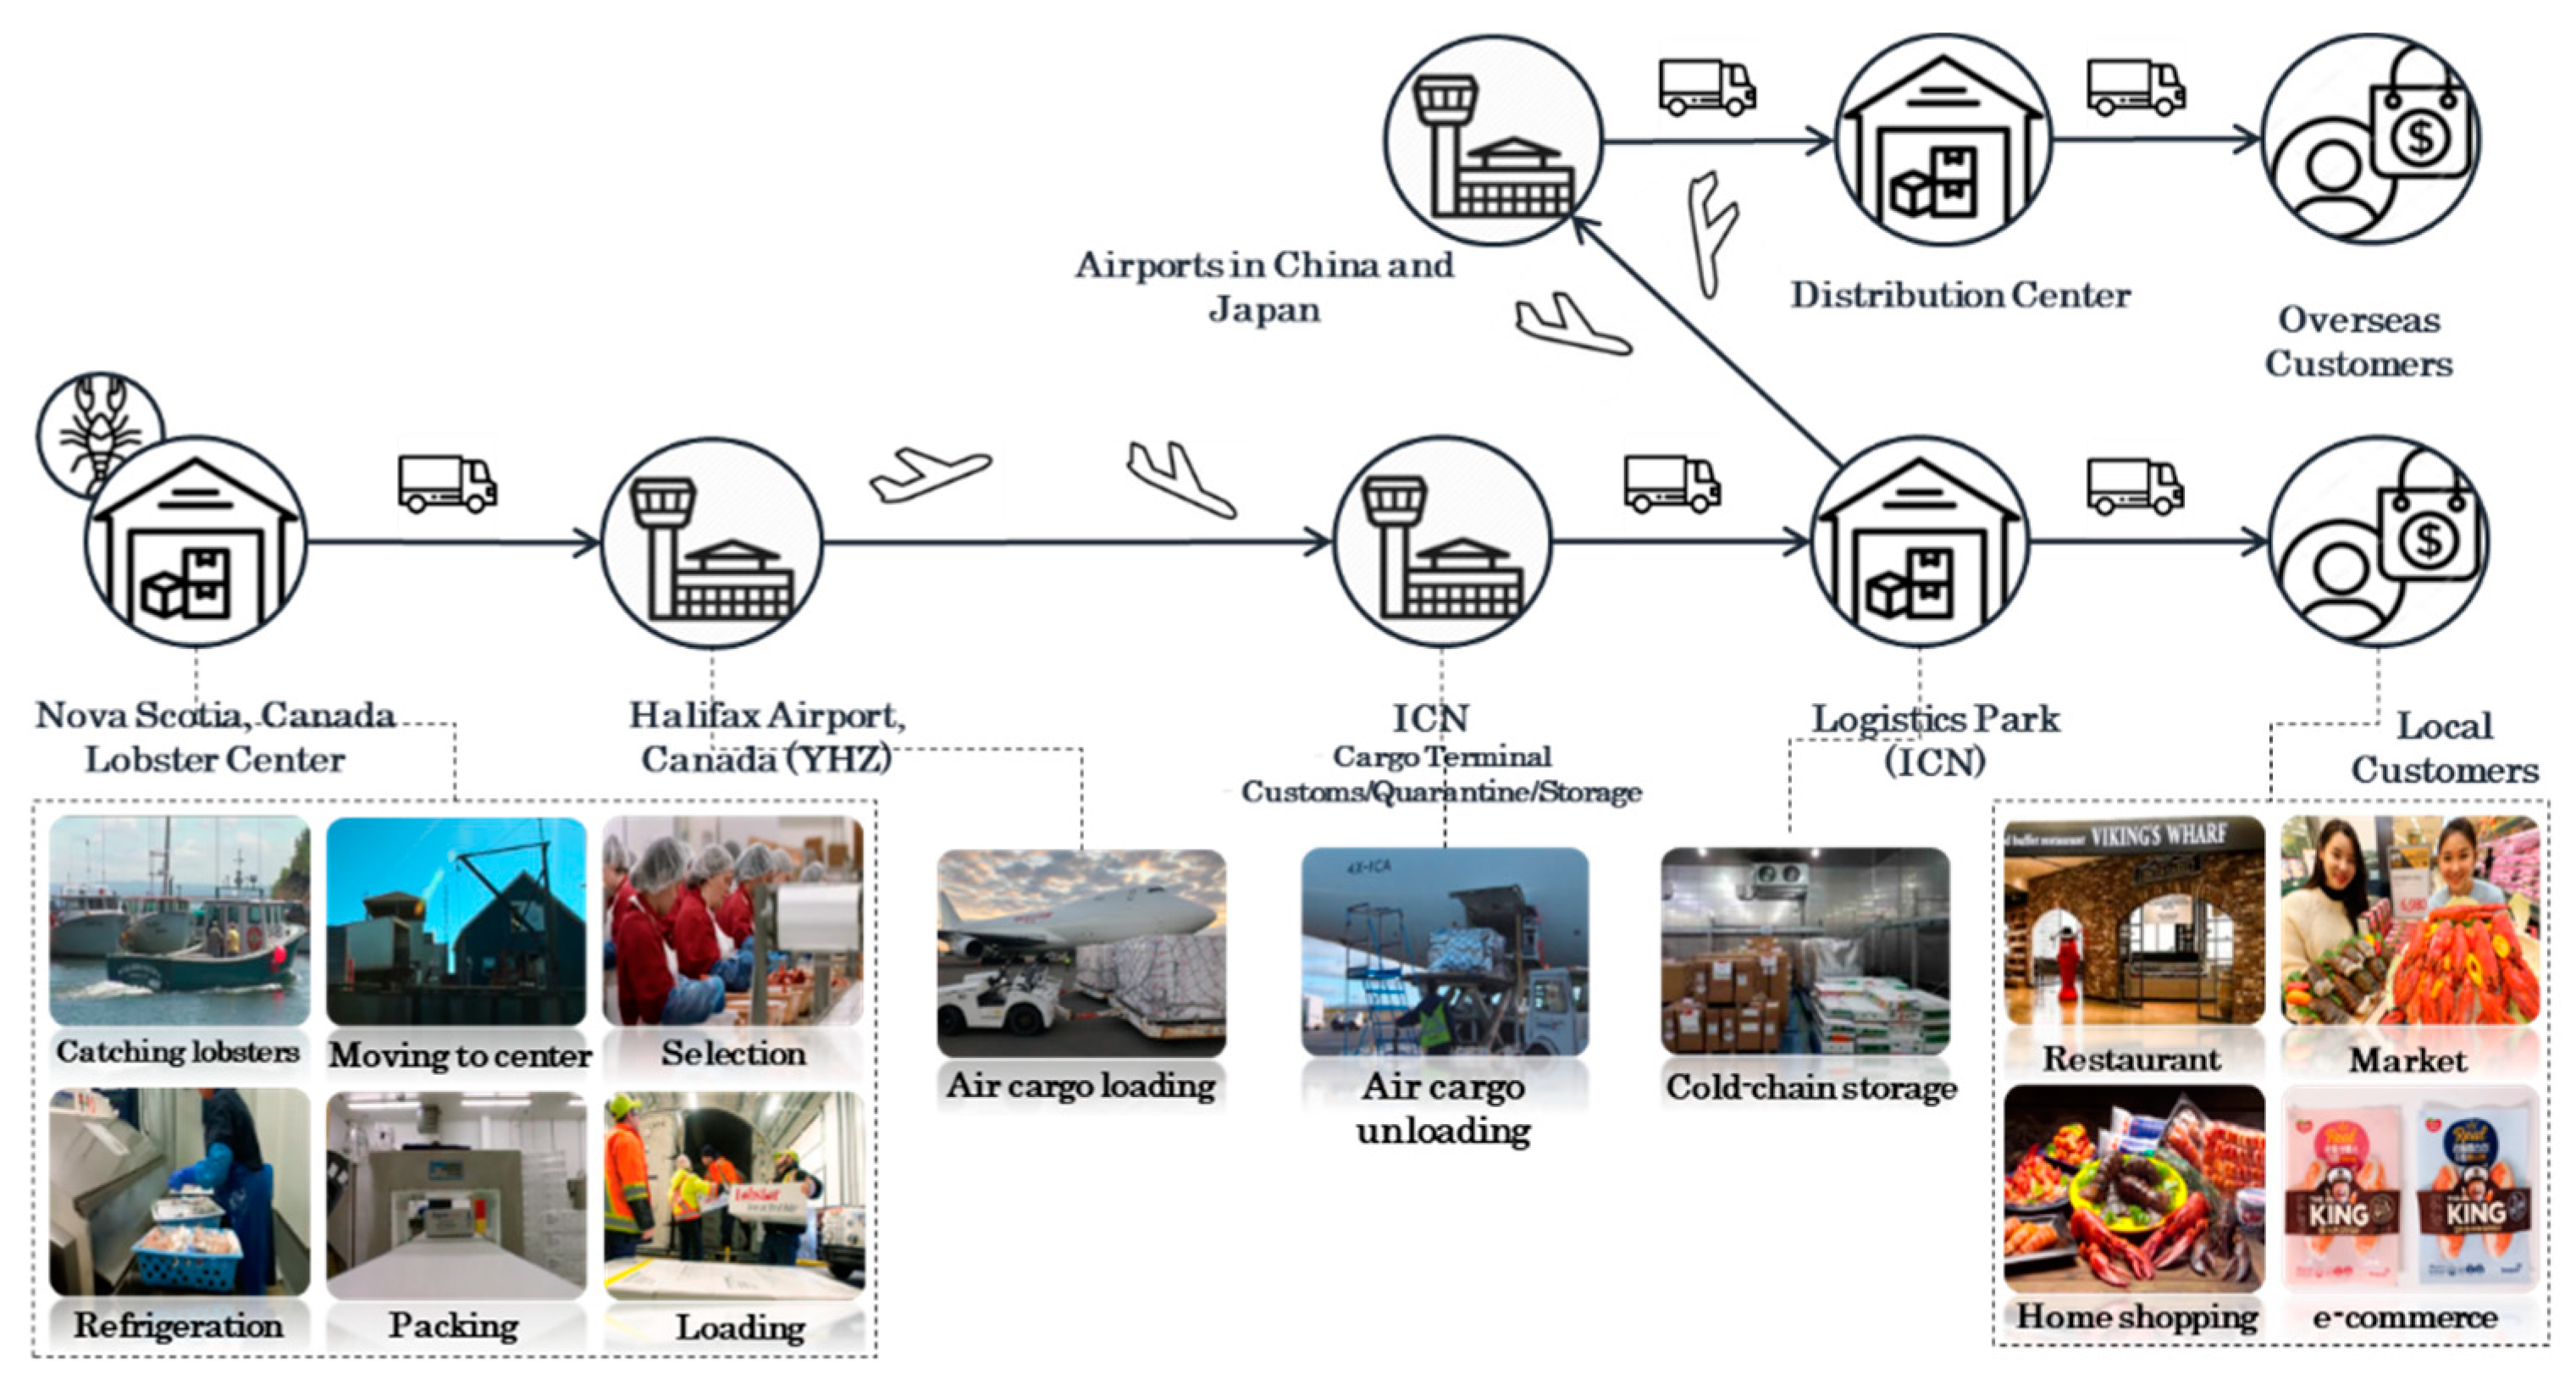
The result is that many logistics companies have invested in cold-chain facilities, and we are observing remarkable growth in the e-commerce industry. Figure 8 shows how air cargo maintains the marketability of lobsters with cold-chain technology. This also shows how advances in technology can contribute to transporting high-end products prone to corruption or damage.
3.3. Changes on Supply-Side
As time sensitivity, value consumption based on personal preferences, e-commerce, and cold-chain cargo are emerging factors on the demand-side, the changes on the supply-side are also being detected. This section examines the relationship between economic growth and the increase in air cargo volume, based on the Granger causality model. This paper uses the quarterly panel data from South Korea and ICN from 2001 Q1 to 2018 Q4 to examine this causal relationship.
3.3.1. Data Description
Our empirical analysis uses quarterly data on the real GDP growth rate of South Korea and the increased rate of air cargo traffic at ICN for the period of 2001 Q1 to 2018 Q4. GDP statistics were obtained from the Korean Statistical Information Service (KOSIS). Air traffic data was collected from the Korean Air Portal. To adjust for seasonality, this study calculates the rate of increase and decrease compared to the data for the same period of the previous year. The summary statistics are collated in Table 5.
The causal relationship between the two variables is investigated for two periods, 2001–2009 and 2010–2018. This is to measure whether a change has occurred by comparing the results of the two periods.
3.3.2. Model Specification
In this study, to identify the causal relationship between the real GDP growth and the increase in air cargo volume, the following two vector autoregressive (VAR) analysis models are established (Tse and Zhao, 2012 [42]; Kang, 2017 [43]).
Coefficient constraints test the causal relationship between variables. For example, the causality between GDP growth and air cargo increase is verified by values of coefficients (γi) in Equation (5) and Equation (6). The null hypothesis is that the coefficient values are all equal to zero. If the null hypothesis can be statistically rejected, the causal relationship between the two variables can be interpreted as significant.
3.3.3. Results
Table 6 presents the ADF test results for 2001 to 2009. The results show that GDP_rate and Cargo_rate are non-stationary in levels because the p-value is larger than 0.05, the level of significance. However, the results of the first difference show that GDP_rate and Cargo_rate are stationary in the first difference. The p-value for GDP_rate and Cargo_rate in the first difference is less than 0.05. Accordingly, the results suggest that the first difference is used for the causality test. Analog to Table 6 and Table 7 presents the ADF test results from 2010 to 2018. The results show that GDP_rate and Cargo_rate are stationary in levels at the 5% level of significance.
Table 8 and Table 9 represent the results for lag selection. As discussed, to select the optimal lags for VAR, this study follows the majority rule. As a result, eight lags are chosen from 2001 to 2009, while four lags are selected from 2010 to 2018.
Table 10 represents the estimation result of the Granger causality test based on the VAR model. As per Table 10, the null hypothesis that “GDP growth increase does not cause air cargo increase” can be rejected at the 5% level of significance between 2001 and 2009. However, from 2010 to 2018, the null hypothesis cannot be rejected, as the corresponding p-value (0.721) is greater than 0.05. It indicates that there might not be a causal relationship between GDP growth and air cargo expansion from 2010 to 2018 in South Korea.
This result provides quite interesting implications. In the past, South Korea’s air cargo volume has been largely dependent on trade volume, and thus, has been significantly affected by the economic cycle. The estimation from 2001 to 2009 clearly reflects this aspect. However, the 2010–2018 estimation suggests that the link between economic growth and air cargo expansion may be different from before.
4. Managerial Implications
This study implies that a paradigm change on the demand-side of the air cargo market has resulted in a paradigm change on the supply-side. “Value” based on consumers’ preferences and tastes in the air cargo market is playing a role in lowering the market’s economic sensitivity. Paradoxically, as economic conditions become worse, price-sensitive consumers may prefer e-commerce that offers competitive prices. Consumers who want to overcome their boring routine with COVID-19 may also spend extra money on online shopping.
Table 11 shows the correlation between real GDP growth rate and the Freight-Ton-Kilometers increase rate in OECD (Organization for Economic Co-operation and Development) and non-OECD countries. The correlation sign of OECD countries is negative, while the sign of non-OECD countries is positive. This appears to be the result of a weak link between economic growth and air cargo fluctuations in developed economies, as discussed earlier. For example, consumption based on personal preferences and tastes (Wong and Ahuvia, 1998 [44]), and increased acceptability of air cargo fare for individual consumers and off-shoring are likely to become more active as the economy develops.
Air transport has also emerged as a key factor that determines the competitiveness of product sales. LVMH, a global high-end fashion company that includes brands such as Louis Vuitton, has revived its online site for the first time in more than a decade (www.24s.com), and in Korea, it offers door-to-door delivery for free if you purchase more than about 300 USD. Besides the high-end brands, a European children’s clothing shop brand, Baby Shop (www.babyshop.com), also offers air transport services for free for more than 99 Euros. To actively reflect individual values in decision-making and win consumers’ hearts who prefer time-sensitive delivery, large companies and online platforms are increasingly offering air transport as a default, which significantly impacts the demand-side.
Besides, the market shares of express shipping carriers (integrators) are rapidly increasing. Amazon’s Prime Air, which handles only Amazon’s e-commerce volume, is growing rapidly as a top 10 air cargo handler globally, as shown in Figure 9. Logistics was once an area of outsourcing in corporate management, but large retailers are quickly internalizing logistics and attempting to create differentiated competitiveness.
5. Conclusions
This study examines paradigm changes in the demand and supply-side of the air cargo market. For a long time, the air cargo market has handled mainly expensive items and has been a supplier-oriented market. There has been little room for individual customers to get involved in this market. However, “value” is gradually replacing “price” in this market. The value that depends on consumer preferences and tastes significantly affects the demand-side of the market. As a result, items transported by air cargo are changing, airlines and other market participants are revising their operation policy, and air cargo is positioned as one of the core competitiveness factors for businesses to sell products to consumers. As a result, economic growth may be losing its dominant power as the main growth engine for the air cargo market.
COVID-19 will further stimulate this paradigm shift in the air cargo market. For example, consumers who did not use e-commerce have joined e-commerce platforms and now enjoy online shopping. Well-developed technologies such as product tracking, cold-chain technology, and faster delivery of courier services also accelerate this change. COVID-19, in particular, changed market participants’ views of the air cargo business (Please see the link at: https://www.koreatimes.co.kr/www/tech/2020/07/774_293258.html). In the past, for airlines and airport operators, the air cargo business was only a subsidiary business dependent on the passenger business. However, now, the air cargo industry, which has maintained a stable growth trend even during COVID-19, is seen as a new opportunity. Moreover, the more limited the recovery in passenger demand, the greater the air cargo growth is expected. Thus, it may be difficult for both airlines and airport operators to achieve a sustainable industry without strategic access to the air freight business and seeking an active role.
This study has limitations in applying the findings directly to all airports and countries because it is based on an analysis of Korea and Incheon Airport cases. The study would be more reliable if available to compare our results with more cross-analysis involving additional countries and airports. Nevertheless, we also think it is significant that this study raises the opportunity to discuss a paradigm shift in the air cargo market. A deep understanding of the paradigm shift in the air cargo market is required so that the aviation industry can respond flexibly to achieving sustainable air transport. Hopefully, this study will allow us to increase our knowledge of the air cargo market and provide significant implications for market participants.
Author Contributions
J.H.C. collected and analyzed data on the research, and Y.P. suggested research methods and revised the results. All authors have read and agreed to the published version of the manuscript.
Funding
This research was supported by INHA University research fund.
Acknowledgments
We are very grateful to three anonymous referees whose comments have led to a significant improvement of the paper.
Conflicts of Interest
The authors declare no conflict of interest.
References
- ACI Website. Available online: https://asianaviation.com/aci-world-data-shows-covid-19-pandemic-continues-to-devastate-international-air-traffic/ (accessed on 8 August 2020).
- Jiang, F.; Johnson, P.; Calzada, C. Freight Demand Characteristics and Mode Choice: An Analysis of the Results of Modeling with Disaggregate Revealed Preference Data; Bureau of Transportation Statistics: Washington, DC, USA, 1999.
- Brooks, M.R.; Trifts, V. Short sea shipping in North America: Understanding the requirements of Atlantic Canadian shippers. Marit. Policy Manag. 2008, 35, 145–158. [Google Scholar] [CrossRef]
- Shinghal, N.; Fowkes, T. Freight mode choice and adaptive stated preferences. Transp. Res. Part E Logist. Transp. Rev. 2002, 38, 367–378. [Google Scholar] [CrossRef] [Green Version]
- Choi, C.H.; Shin, S.J.; Park, D.J.; Kim, H.S.; Jin, J.W. Mode choice characteristics of rail freight transportation. J. Korean Soc. Railw. 2008, 11, 588–595. [Google Scholar]
- Norojono, O.; Young, W. A stated preference freight mode choice model. Transp. Plan. Technol. 2003, 26, 1. [Google Scholar] [CrossRef]
- Puckett, S.M.; Hensher, D.A.; Brooks, M.R.; Trifts, V. Preferences for alternative short sea shipping opportunities. Transp. Res. Part E Logist. Transp. Rev. 2011, 47, 182–189. [Google Scholar] [CrossRef]
- De Jong, G.; Ben-Akiva, M. A micro-simulation model of shipment size and transport chain choice. Transp. Res. Part B Methodol. 2007, 41, 950–965. [Google Scholar] [CrossRef]
- Mitra, S.; Leon, S.M. Discrete choice model for air-cargo mode selection. Int. J. Logist. Manag. 2014, 25, 656–672. [Google Scholar] [CrossRef]
- Demir, E.E.; Huang, Y.; Scholts, S.S.; Van Woensel, T.T. A selected review on the negative externalities of the freight transportation: Modeling and pricing. Transp. Res. Part E Logist. Transp. Rev. 2015, 77, 95–114. [Google Scholar] [CrossRef]
- Greene, D.L.; Wegener, M. Sustainable transport. J. Transp. Geogr. 1997, 5, 177–190. [Google Scholar] [CrossRef]
- Forkenbrock, D.J. External costs of intercity truck freight transportation. Transp. Res. Part A Policy Pr. 1999, 33, 505–526. [Google Scholar] [CrossRef]
- Forkenbrock, D.J. Comparison of external costs of rail and truck freight transportation. Transp. Res. Part A Policy Pr. 2001, 35, 321–337. [Google Scholar] [CrossRef]
- Blum, U. Positive externalities and the public provision of transportation infrastructure: An evolutionary perspective. J. Transp. Stat. 1998, 1, 81–88. [Google Scholar]
- Levinson, D.M.; Gillen, D.; Kanafani, A. The social costs of intercity transportation: A review and comparison of air and highway. Transp. Rev. 1998, 18, 215–240. [Google Scholar] [CrossRef]
- Santos, G.; Behrendt, H.; Maconi, L.; Shirvani, T.; Teytelboym, A. Part I: Externalities and economic policies in road transport. Res. Transp. Econ. 2010, 28, 2–45. [Google Scholar] [CrossRef]
- World Bank. Air Freight: A Market Study with Implications for Landlocked Countries; World Bank: Washington, DC, USA, 2009. [Google Scholar]
- Park, Y.; Choi, J.K.; Zhang, A. Evaluating competitiveness of air cargo express services. Transp. Res. Part E Logist. Transp. Rev. 2009, 45, 321–334. [Google Scholar] [CrossRef]
- Zhang, A. Analysis of an international air-cargo hub: The case of Hong Kong. J. Air Transp. Manag. 2003, 9, 123–138. [Google Scholar] [CrossRef]
- Feng, B.; Li, Y.; Shen, Z.-J.M. Air cargo operations: Literature review and comparison with practices. Transp. Res. Part C Emerg. Technol. 2015, 56, 263–280. [Google Scholar] [CrossRef]
- Chu, H.-C. Exploring preference heterogeneity of air freight forwarders in the choices of carriers and routes. J. Air Transp. Manag. 2014, 37, 45–52. [Google Scholar] [CrossRef]
- Kupfer, F.; Goos, P.; Kessels, R.; Van de Voorde, E.; Verhetsel, A. The airport choices in the air cargo sector: A discrete choice analysis of freighter operations. In Proceedings of the European Transport Conference 2011 Association for European Transport (AET) Transportation Research Board, Glasgow, UK, 10–12 October 2011. [Google Scholar]
- Boonekamp, T.; Burghouwt, G. Measuring connectivity in the air freight industry. J. Air Transp. Manag. 2017, 61, 81–94. [Google Scholar] [CrossRef]
- Kasarda, J.D.; Green, J.D. Air cargo as an economic development engine: A note on opportunities and constraints. J. Air Transp. Manag. 2005, 11, 459–462. [Google Scholar] [CrossRef]
- Meersman, H.; Nazemzadeh, M. The contribution of transport infrastructure to economic activity: The case of Belgium. Case Stud. Transp. Policy 2017, 5, 316–324. [Google Scholar] [CrossRef]
- Dobruszkes, F.; Lennert, M.; Van Hamme, G. An analysis of the determinants of air traffic volume for European metropolitan areas. J. Transp. Geogr. 2011, 19, 755–762. [Google Scholar] [CrossRef]
- Yao, S.; Yang, X. Air transport and regional economic growth in China. Asia-Pac. J. Account. Econ. 2012, 19, 318–329. [Google Scholar] [CrossRef]
- Dewulf, W.; Meersman, H.; Van De Voorde, E. From carpet sellers to cargo stars: Analyzing strategies of air cargo carriers. J. Air Transp. Stud. 2014, 5, 96–119. [Google Scholar] [CrossRef]
- Fernandes, E.; Pacheco, R.R. The causal relationship between GDP and domestic air passenger traffic in Brazil. Transp. Plan. Technol. 2010, 33, 569–581. [Google Scholar] [CrossRef]
- Chang, Y.-H. Air cargo expansion and economic growth: Finding the empirical link. J. Air Transp. Manag. 2009, 15, 264–265. [Google Scholar] [CrossRef]
- Maparu, T.S.; Mazumder, T.N. Transport infrastructure, economic development and urbanization in India (1990–2011): Is there any causal relationship? Transp. Res. Part A Policy Pr. 2017, 100, 319–336. [Google Scholar] [CrossRef]
- Bofinger, H.C. Air Transport: Challenges to Growth; The World Bank: Washington, DC, USA, 2009; pp. 1–108. [Google Scholar]
- Zhu, F.; Wu, X.; Gao, Y. Decomposition analysis of decoupling freight transport from economic growth in China. Transp. Res. Part D Transp. Environ. 2020, 78, 102201. [Google Scholar] [CrossRef]
- Hu, Y.; Xiao, J.; Deng, Y.; Xiao, Y.; Wang, S. Domestic air passenger traffic and economic growth in China: Evidence from heterogeneous panel models. J. Air Transp. Manag. 2015, 42, 95–100. [Google Scholar] [CrossRef]
- Granger, C.W.J. Investigating Causal Relations by Econometric Models and Cross-spectral Methods. Econometrica 1969, 37, 424. [Google Scholar] [CrossRef]
- Granger, C.W.J. Testing for Causality. Multivar. Tests Time Series Models 2012, 4, 33–55. [Google Scholar] [CrossRef]
- Dickey, D.A.; Fuller, W.A. Likelihood Ratio Statistics for Autoregressive Time Series with a Unit Root. Econometrica 1981, 49, 1057. [Google Scholar] [CrossRef]
- Milewski, D.; Milewska, B.; Milewski, D. The efficiency of a supply chain with the use of maritime transport on the example of the apparel industry. In SHS Web of Conferences; EDP Sciences: Les Ulis, France, 2018; Volume 58, p. 01019. [Google Scholar]
- Casaca, A.C.P.; Marlow, P.B. The competitiveness of short sea shipping in multimodal logistics supply chains: Service attributes. Marit. Policy Manag. 2005, 32, 363–382. [Google Scholar] [CrossRef]
- eMarketer Website. Available online: https://www.emarketer.com/content/global-ecommerce-2019 (accessed on 5 July 2020).
- Hong, S.J.; Randall, W.; Han, K.; Malhan, A.S. Estimation viability of dedicated freighter aircraft of combination carriers: A data envelopment and principal component analysis. Int. J. Prod. Econ. 2018, 202, 12–20. [Google Scholar] [CrossRef]
- Tse, Y.; Zhao, L. The relationship between currency carry trades and U.S. stocks. J. Futur. Mark. 2011, 32, 252–271. [Google Scholar] [CrossRef]
- Kang, S.-K. The Impact of the Euro Carry Trade on the Korea Stock Price Volatility: Granger Causality Test. JEJU Natl. Univ. Tour. Bus. Econ. Res. Inst. 2017, 37, 33–38. [Google Scholar] [CrossRef]
- Wong, N.Y.; Ahuvia, A.C. Personal taste and family face: Luxury consumption in Confucian and Western societies. Psychol. Mark. 1998, 15, 423–441. [Google Scholar] [CrossRef]
Figure 1.
Air transport, freight (million ton-km), Container port traffic (TEU). Source: World Bank (2000–2017).
Figure 1.
Air transport, freight (million ton-km), Container port traffic (TEU). Source: World Bank (2000–2017).

Figure 2.
Retail Ecommerce Sales Forecast (trillions, % change and % of total retail sales) Source: Global E-commerce Forecast, eMarketer (2019).
Figure 2.
Retail Ecommerce Sales Forecast (trillions, % change and % of total retail sales) Source: Global E-commerce Forecast, eMarketer (2019).

Figure 3.
Volume of semiconductors, wireless devices, and flat displays processed through ICN. Source: Trade Statistics, Korea Customs Service.
Figure 3.
Volume of semiconductors, wireless devices, and flat displays processed through ICN. Source: Trade Statistics, Korea Customs Service.

Figure 4.
Cold-chain and medicine cargo growth trend at ICN. Source: Trade Statistics, Korea International Trade Association.
Figure 4.
Cold-chain and medicine cargo growth trend at ICN. Source: Trade Statistics, Korea International Trade Association.

Figure 5.
Share of e-commerce freights at ICN (based on number of shipments). Source: Incheon Airport Internal Data.
Figure 5.
Share of e-commerce freights at ICN (based on number of shipments). Source: Incheon Airport Internal Data.

Figure 6.
Freighter and belly capacity (thousand tons). Source: Global Air Cargo and E-commerce Growth Trends, Seabury (2019).
Figure 6.
Freighter and belly capacity (thousand tons). Source: Global Air Cargo and E-commerce Growth Trends, Seabury (2019).

Figure 7.
Share of belly cargo of Korean Air. Source: Incheon Airport Internal Data.

Figure 8.
Cold-chain handling process of lobster at ICN. Source: Incheon Airport Internal Data.

Figure 9.
Top operators by freight cargo capacity (million tons) as of 2018. Source: Global Air Cargo and E-commerce Growth Trends, Seabury (2019).
Figure 9.
Top operators by freight cargo capacity (million tons) as of 2018. Source: Global Air Cargo and E-commerce Growth Trends, Seabury (2019).


Table 1.
Rank of freight items handled at ICN (by weight), 2013 vs. 2018.
| Year | 2013 | 2018 | ||
|---|---|---|---|---|
| Rank | Item | Tons | Item | Tons |
| 1 | Clothes | 47,114 | Plastics | 66,344 |
| 2 | Wireless communication devices | 46,783 | Clothes | 65,322 |
| 3 | Plastics | 45,372 | Auto parts | 47,028 |
| 4 | Semiconductors | 44,887 | Cosmetics, amenities | 43,120 |
| 5 | Mechanical component | 40,050 | Motors and pumps | 40,436 |
| 6 | Auto parts | 35,819 | Grains, packaged food | 39,103 |
| 7 | Flat display panel | 34,072 | Semiconductors | 37,538 |
| 8 | Computer | 32,335 | Machinery | 37,250 |
| 9 | Machinery | 27,768 | Mechanical component | 35,343 |
| 10 | Motors and pumps | 26,360 | Wireless communication devices | 34,957 |
Source: Trade Statistics, Korea Customs Service.
Table 2.
Inbound freight handled by express shipping at Incheon International Airport (ICN).
| Items | 2016 | 2017 | 2018 | Year-on-Year | ||||
|---|---|---|---|---|---|---|---|---|
| Share (%) | Share (%) | Share (%) | ||||||
| Packed food | No. | 7514 | 40.6 | 10,017 | 45.2 | 12,260 | 48.3 | 22.4 |
| Amount | 374 | 2.9 | 479 | 3.5 | 580 | 3.9 | 21.0 | |
| Cosmetics | No. | 3895 | 21.0 | 3793 | 17.1 | 3619 | 14.3 | Δ4.6 |
| Amount | 107 | 0.8 | 111 | 0.8 | 113 | 0.8 | 1.8 | |
| Electronics | No. | 1171 | 6.3 | 1409 | 6.4 | 1600 | 6.3 | 13.5 |
| Amount | 4948 | 38.9 | 5984 | 43.5 | 6307 | 42.4 | 5.1 | |
| Texture, Clothes | No. | 828 | 4.5 | 944 | 4.3 | 1078 | 4.2 | 14.2 |
| Amount | 303 | 2.4 | 345 | 2.5 | 413 | 2.8 | 19.5 | |
| Feather goods | No. | 264 | 1.4 | 336 | 1.5 | 418 | 1.6 | 24.5 |
| Amount | 125 | 1.0 | 177 | 1.3 | 228 | 1.5 | 28.5 | |
| Others | No. | 4836 | 26.2 | 5643 | 25.5 | 6393 | 25.3 | 13.3 |
| Amount | 6851 | 54.0 | 6649 | 48.4 | 7229 | 48.6 | 8.8 | |
| Sum | No. | 18,508 | 100 | 22,142 | 100 | 25,368 | 100 | 14.6 |
| Amount | 12,708 | 100 | 13,745 | 100 | 14,869 | 100 | 8.1 | |
Source: Trade Statistics, Korea Customs Service.
Table 3.
Export-Import cargo characteristics of ICN.
| Year | Weight (Thousand Ton) | Number of Shipments (Thousand) | Number of E-Commerce Shipments (Thousand) |
|---|---|---|---|
| 2014 | 2475 | 29,545 | 19,204 |
| 2019 | 2623 | 57,640 | 34,699 |
| CAGR | 1.2% | 14.3% | 12.6% |
Source: Incheon Airport Internal Data.
Table 4.
Number of cargo fleets operated by Korean Air.
| Fleet Type | 2016 | 2017 | 2018 | 2019 |
|---|---|---|---|---|
| B747F | 13 | 9 | 6 | 4 |
| B747-8F | 7 | 7 | 7 | 7 |
| B777F | 11 | 12 | 12 | 12 |
| Sum | 31 | 28 | 25 | 23 |
Source: Korean Air Internal Data.
Table 5.
Summary statistics.
| Variables | GDP_Rate | Cargo_Rate |
|---|---|---|
| Mean | 0.0395 | 0.0464 |
| Std. Dev. | 0.0200 | 0.0818 |
| Max | 0.0977 | 0.25224 |
| Min | −0.0116 | −0.18269 |
| Observations | 72 | 72 |
| Correlation | ||
| GDP_rate | 1 | 0.643 |
| Cargo_rate | 0.643 | 1 |
Table 6.
Results of Dicky–Fuller tests (ADF) test (2001–2009).
| Variables | GDP_Rate | Cargo_Rate | ||
|---|---|---|---|---|
| Z(t) | p-Value | Z(t) | p-Value | |
| Levels | −3.125 | 0.101 | −2.018 | 0.5914 |
| The first difference | −5.964 | 0.000 | −3.509 | 0.0385 |
Table 7.
Results of ADF test (2010–2018).
| Variables | GDP_Rate | Cargo_Rate | ||
|---|---|---|---|---|
| Z(t) | p-Value | Z(t) | p-Value | |
| Levels | −10.331 | 0.000 | −3.934 | 0.011 |
Table 8.
Results for lag selection parameters for GDP_rate and Cargo_rate (2001–2009).
| Lag | FPE | AIC | HQIC | SBIC |
|---|---|---|---|---|
| 0 | 0.00000 | −7.16499 | −7.13645 | −7.06901 |
| 1 | 0.00000 | −8.83018 | −8.74455 | −8.54221 * |
| 2 | 0.00000 | −8.90906 | −8.76634 | −8.42912 |
| 3 | 0.00000 | −8.78177 | −8.58198 | −8.10986 |
| 4 | 0.00000 | −8.83604 | −8.57916 | −7.97215 |
| 5 | 0.00000 | −8.73896 | −8.42500 | −7.68309 |
| 6 | 0.00000 | −8.52027 | −8.14922 | −7.27242 |
| 7 | 0.00000 | −9.06262 | −8.63449 | −7.62280 |
| 8 | 0.00000 * | −9.39853 * | −8.91331 * | −7.76673 |
Note: * stands for an optimal lag.
Table 9.
Results for lag selection parameters for GDP_rate and Cargo_rate (2010–2018).
| Lag | FPE | AIC | HQIC | SBIC |
|---|---|---|---|---|
| 0 | 0.00000 | −7.14606 | −7.11697 | −7.05090 |
| 1 | 0.00000 | −8.00973 | −7.92246 | −7.72426 |
| 2 | 0.00000 | −7.89058 | −7.74513 | −7.41479 |
| 3 | 0.00000 | −10.7975 | −10.5939 * | −10.1314 |
| 4 | 0.00000 * | −10.64060 * | −10.37870 * | −9.78415 * |
| 5 | 0.00000 | −10.48230 | −10.16230 | −9.43554 |
| 6 | 0.00000 | −10.31330 | −9.93515 | −9.07628 |
| 7 | 0.00000 | −10.46410 | −10.02780 | −9.03677 |
| 8 | 0.00000 | −10.58370 | −10.08920 | −8.96606 |
Note: * stands for an optimal lag.
Table 10.
Granger causality test.
| Test Hypothesis | 2001–2009 | 2010–2018 | ||
|---|---|---|---|---|
| F-Statistics | p-Value | F-Statistics | p-Value | |
| GDP ≠> Cargo | 31.726 | 0.000 | 1.3335 | 0.721 |
Note: ≠> stands for the null hypothesis that the preceding variable does not cause the trailing variable.
Table 11.
Correlation between real GDP growth rate and FTKs increase rate (2001–2018).
| Correlation | OECD Countries | Non-OECD Countries |
|---|---|---|
| Real GDP growth rate- FTK increase rate | −0.0169 | 0.2671 |
Source: World Bank, IMF.
Publisher’s Note: MDPI stays neutral with regard to jurisdictional claims in published maps and institutional affiliations. |
© 2020 by the authors. Licensee MDPI, Basel, Switzerland. This article is an open access article distributed under the terms and conditions of the Creative Commons Attribution (CC BY) license (http://creativecommons.org/licenses/by/4.0/).
Share and Cite
MDPI and ACS Style
Choi, J.H.; Park, Y.H. Investigating Paradigm Shift from Price to Value in the Air Cargo Market. Sustainability 2020, 12, 10202. https://0-doi-org.brum.beds.ac.uk/10.3390/su122310202
AMA Style
Choi JH, Park YH. Investigating Paradigm Shift from Price to Value in the Air Cargo Market. Sustainability. 2020; 12(23):10202. https://0-doi-org.brum.beds.ac.uk/10.3390/su122310202
Chicago/Turabian StyleChoi, Jong Hae, and Yong Hwa Park. 2020. "Investigating Paradigm Shift from Price to Value in the Air Cargo Market" Sustainability 12, no. 23: 10202. https://0-doi-org.brum.beds.ac.uk/10.3390/su122310202
Note that from the first issue of 2016, this journal uses article numbers instead of page numbers. See further details here.