1. Introduction
Sustainable development principles are widely used to guide plans, policies and programs across different scales [
1,
2]. The term sustainable development (SD) entails the balancing of meeting humankind’s present demands while protecting the environment within multiple approaches to ensure the fulfillment of future generations’ rights and needs. The overall goal of SD is to apply a long-term stability policy integrated with economic and environmental protection rules. Such an approach can be obtained through the integration of economic, social and environmental concerns as a basis for more informed decision-making processes. The SD approach is a contested concept which has been subjected to many debates and challenges. A review of research indicates that the SD has attracted significant attention over the past three decades [
3].
Based on its critical role for decision-making and regional planning, the growing human population and its demands on Earth’s resources imply a need for sustainable practices. Technically speaking, the SD is considered a very complex issue and its assessment requires taking account of a variety of indicators and indexes within an integrated approach [
4]. The SD approach is essentially known as an integrated approach of three pillars, including economic, social and environmental perspectives [
5]. These indicators need to be integrated for delivering the best final decisions in coordination with societal demands without undermining the integrity and stability of the natural systems. In addition, these different considerations and interests turn the planning steps into very complex processes with conflicting interests in the decision-making. Due to the complexity of sustainable development, implementing these practices often requires a significant collaboration between different organizations. In this context, the term sustainable development assessment (SDA) aims to determine the actions or decisions which contribute to realizing sustainable development. The SDA demands evaluating, defining and figuring out of its contributing categories [
6]. It can be considered as an early warning indicator to prevent economic, social and environmental setbacks. The expected results of a SDA are also critical in communicating ideas, thoughts and values [
7].
The SDA is indeed one of the most complicated types of appraisal methodologies. According to Boggia et al. [
2], a SDA can be organized based on different approaches depending on the objectives, the scale and the scope. However, due to the multi-dimensional concept of SDA, the assessment of sustainability based on a set of indicators is more straightforward [
2]. In this regard, Multicriteria Decision Analysis (MCDA) can be considered an efficient methodology for SDA. The MCDA techniques have become increasingly widespread in strategic environmental planning and decision-making [
8]. An integrated approach of Geographical Information System (GIS) and MCDA methods provides a sufficient framework that can be applied for handling different views and compositions of the elements of complex decision issues [
9]. Due to the multiple demands of SDA, integration of GIS with MCDA reduces the complex nature in the planning process and allows stakeholders to reach a general conclusion [
6]. GIS-based MCDA leads to the integration of information related to numerous criteria into a single evaluation index. Thus, it can be considered a key technology employed in assessment, prioritization, mitigation, planning, science and training. Such procedures employ geographical data, consider the user’s preferences and set preferences according to specified decision rules [
9,
10].
In terms of SDA, the GIS-based MCDA leads to developing interoperable technology and sets the stage for establishing interactions between relevant organizations. Economic inequality, social instability and environmental degradation are common features of unsustainable development. The GIS-MCDA approach has the capability to be employed for developing planning support systems and decision-making frameworks that enable integration of computer science and information technology. This, in turn, can support the computer-based visualization and decision-making techniques. In the context of SDA, a GIS-based MCDA can, therefore, be developed for integrating a variety of relevant indicators, such as economic data and models, physical and social parameters and reference thresholds to present a unique reference agenda [
4]. GIS-based spatial decision making systems (SDMS) are, accordingly, increasingly being developed to be employed with georeferenced spatial data. The GIS-based SDMS leads to combine socio-economic and biophysical data that can be employed to present an alternative strategy for decision makers to deal with complex and multi-dimensional spatial issues [
4]. In order to make use of the capability of GIS-MCDA for multiple SDA, the main objective of this paper is to provide a model and analyze the degree of sustainable development in East Azerbaijan Province (EAP) in Iran; EAP is known as one the most important states in Iran, which has become unbalanced over the past decades. EAP has been known as critical for the state of the economy of the country, it is located in the northwest and it has four neighboring countries. Hence, the results of this research will be of importance for decision makers and authorities for developing a sustainable development program for EAP.
2. Study Area
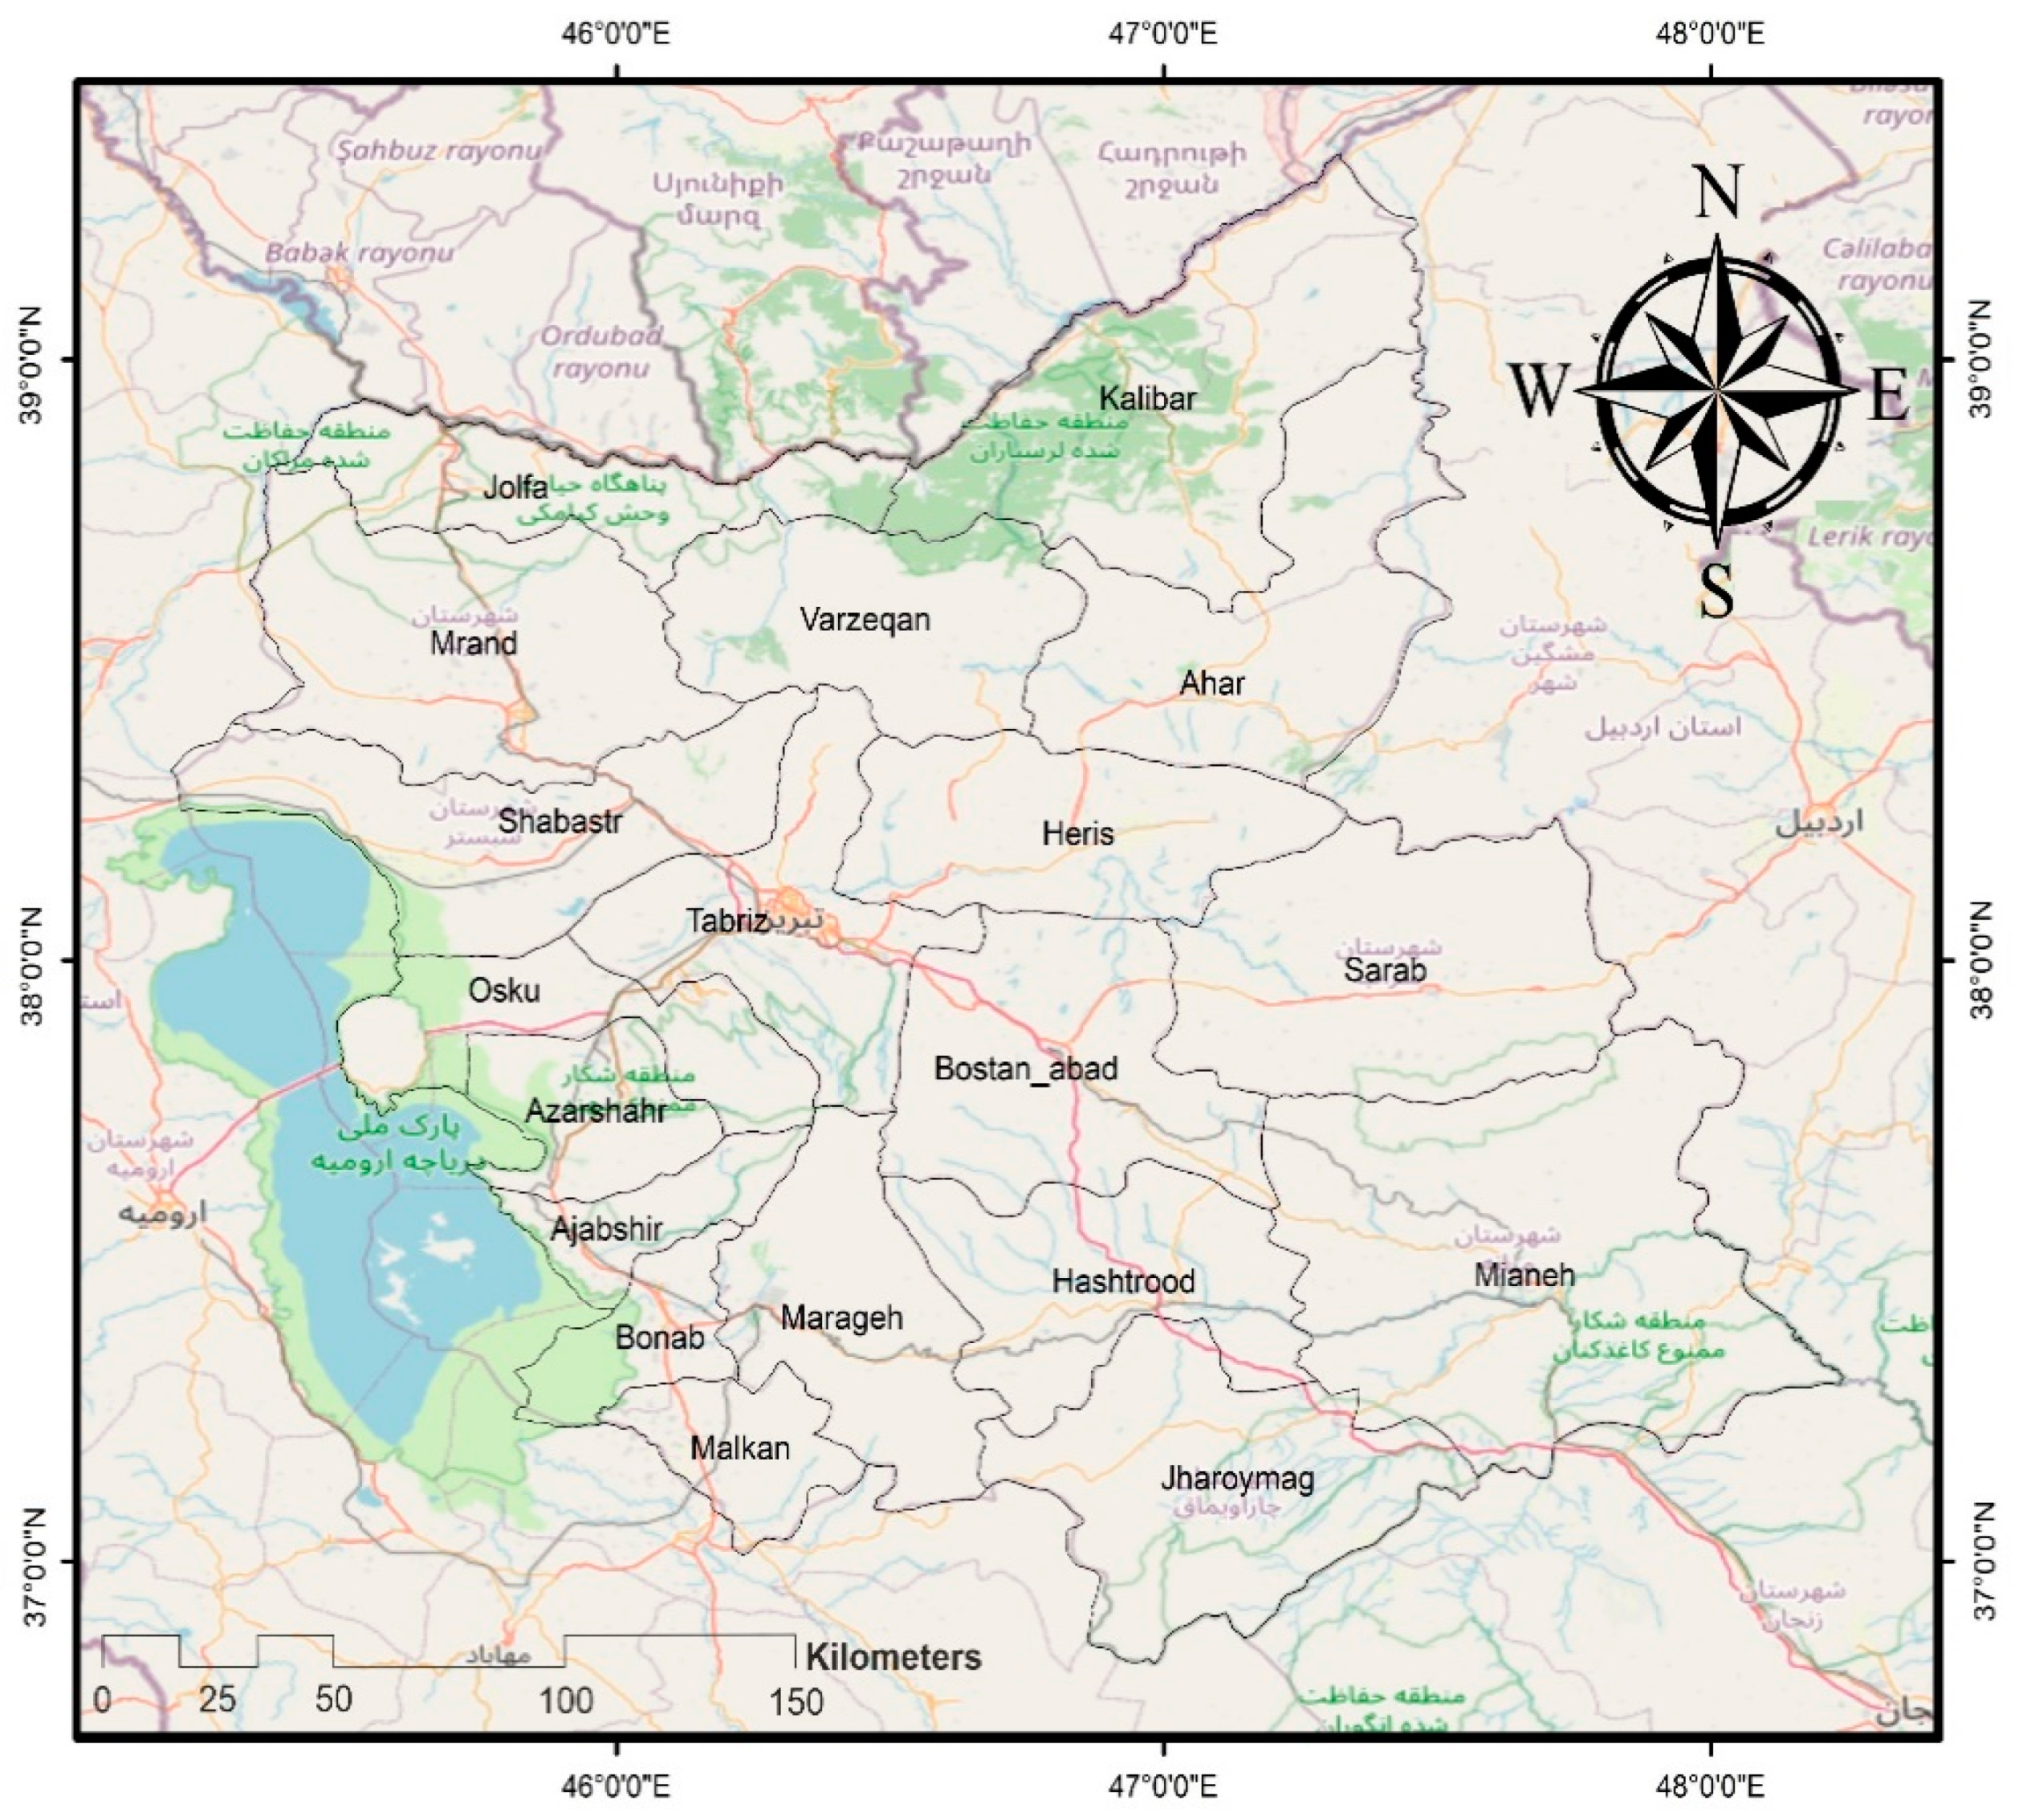
The study area is East Azerbaijan Province (EAP) located in the northwest of Iran (
Figure 1). EAP covers 45,491 km
2 and contains 21 counties, 57 cities and 3094 villages. According to the Statistical Center of Iran, EAP has 3,909,652 inhabitants; roughly 5% of the country’s population [
7]. Agricultural and industrial activities are the main sources of income. There are 5000 manufacturing units in the province, making it one of the major industrial areas of Iran. EAP also has an excellent position in the handicraft industry of Iran with about 66,000 carpet production units and about 200,000 employees. Based on the official report issued by the Organization of Planning and Management of East Azerbaijan Province (OPM-EAP), about 35% of all Iranian carpets are produced in EAP [
8]. EAP makes a significant contribution to the Iranian economy by operating as one the main destinations for imports and exports from neighboring countries (e.g., Turkey, Armenia, Iraq, Azerbaijan and Russia). EAP, with 180 mines, is also known as one of the richest provinces in Iran. Further, agricultural activities are one of the main sources of income in the province. It features very productive orchards (walnut, apple, grape, etc.) and croplands (wheat, tomato, onion, etc.) together with widespread pasture lands in the Sahand Mountains. However, as a consequence of the Urmia Lake droughts and their respective environmental issues (e.g., dust salt storms and extensive soil salinization), the study area is currently experiencing very critical environmental conditions. Thus, analyzing the level of sustainable development is critical for regional development and identifying the potential of each area for sustainable development.
3. Materials and Methods
3.1. Selecting Indicators and Dataset
For GIS-based SDA modelling, it is necessary to consider the relevant indicators as casual criteria which need to be prepared as a GIS dataset. Technically speaking, selecting appropriate and efficient indicators leads to accurate decisions and effective actions by means of clarifying, outlining and delivering valuable information available to authorities and decision makers. Sustainable development indicators aim to determine the level of sustainable development in its entirety by means of taking into account the multi-dimensional and integrated nature of the concept [
10]. In the context of a GIS-based modeling task, selection of the casual criteria is the most critical step which impacts the final outcome directly. Thus, clear and appropriate indicators can support incorporating physical and social science knowledge into decision-making, which accordingly assists with measuring and calibrating progress toward sustainable development goals and objectives [
10]. In order to select efficient indicators and assess progress in sustainable development, it is essential to identify the main issues and target sectors for which indicators are to be evaluated. Review of research background also indicated that the pressure-state-response (PSR) and the driving forces-pressure-state-impact-response (DPSIR) are two major frameworks that are mainly employed for SDA. These frameworks were basically proposed by the European Commission, the European Environment Agency, the OECD and the World Bank. In case of the current research, selection of the relevant criteria and indicators was based on a review of research and related literature [
1,
2,
3,
4,
5,
6,
7,
8,
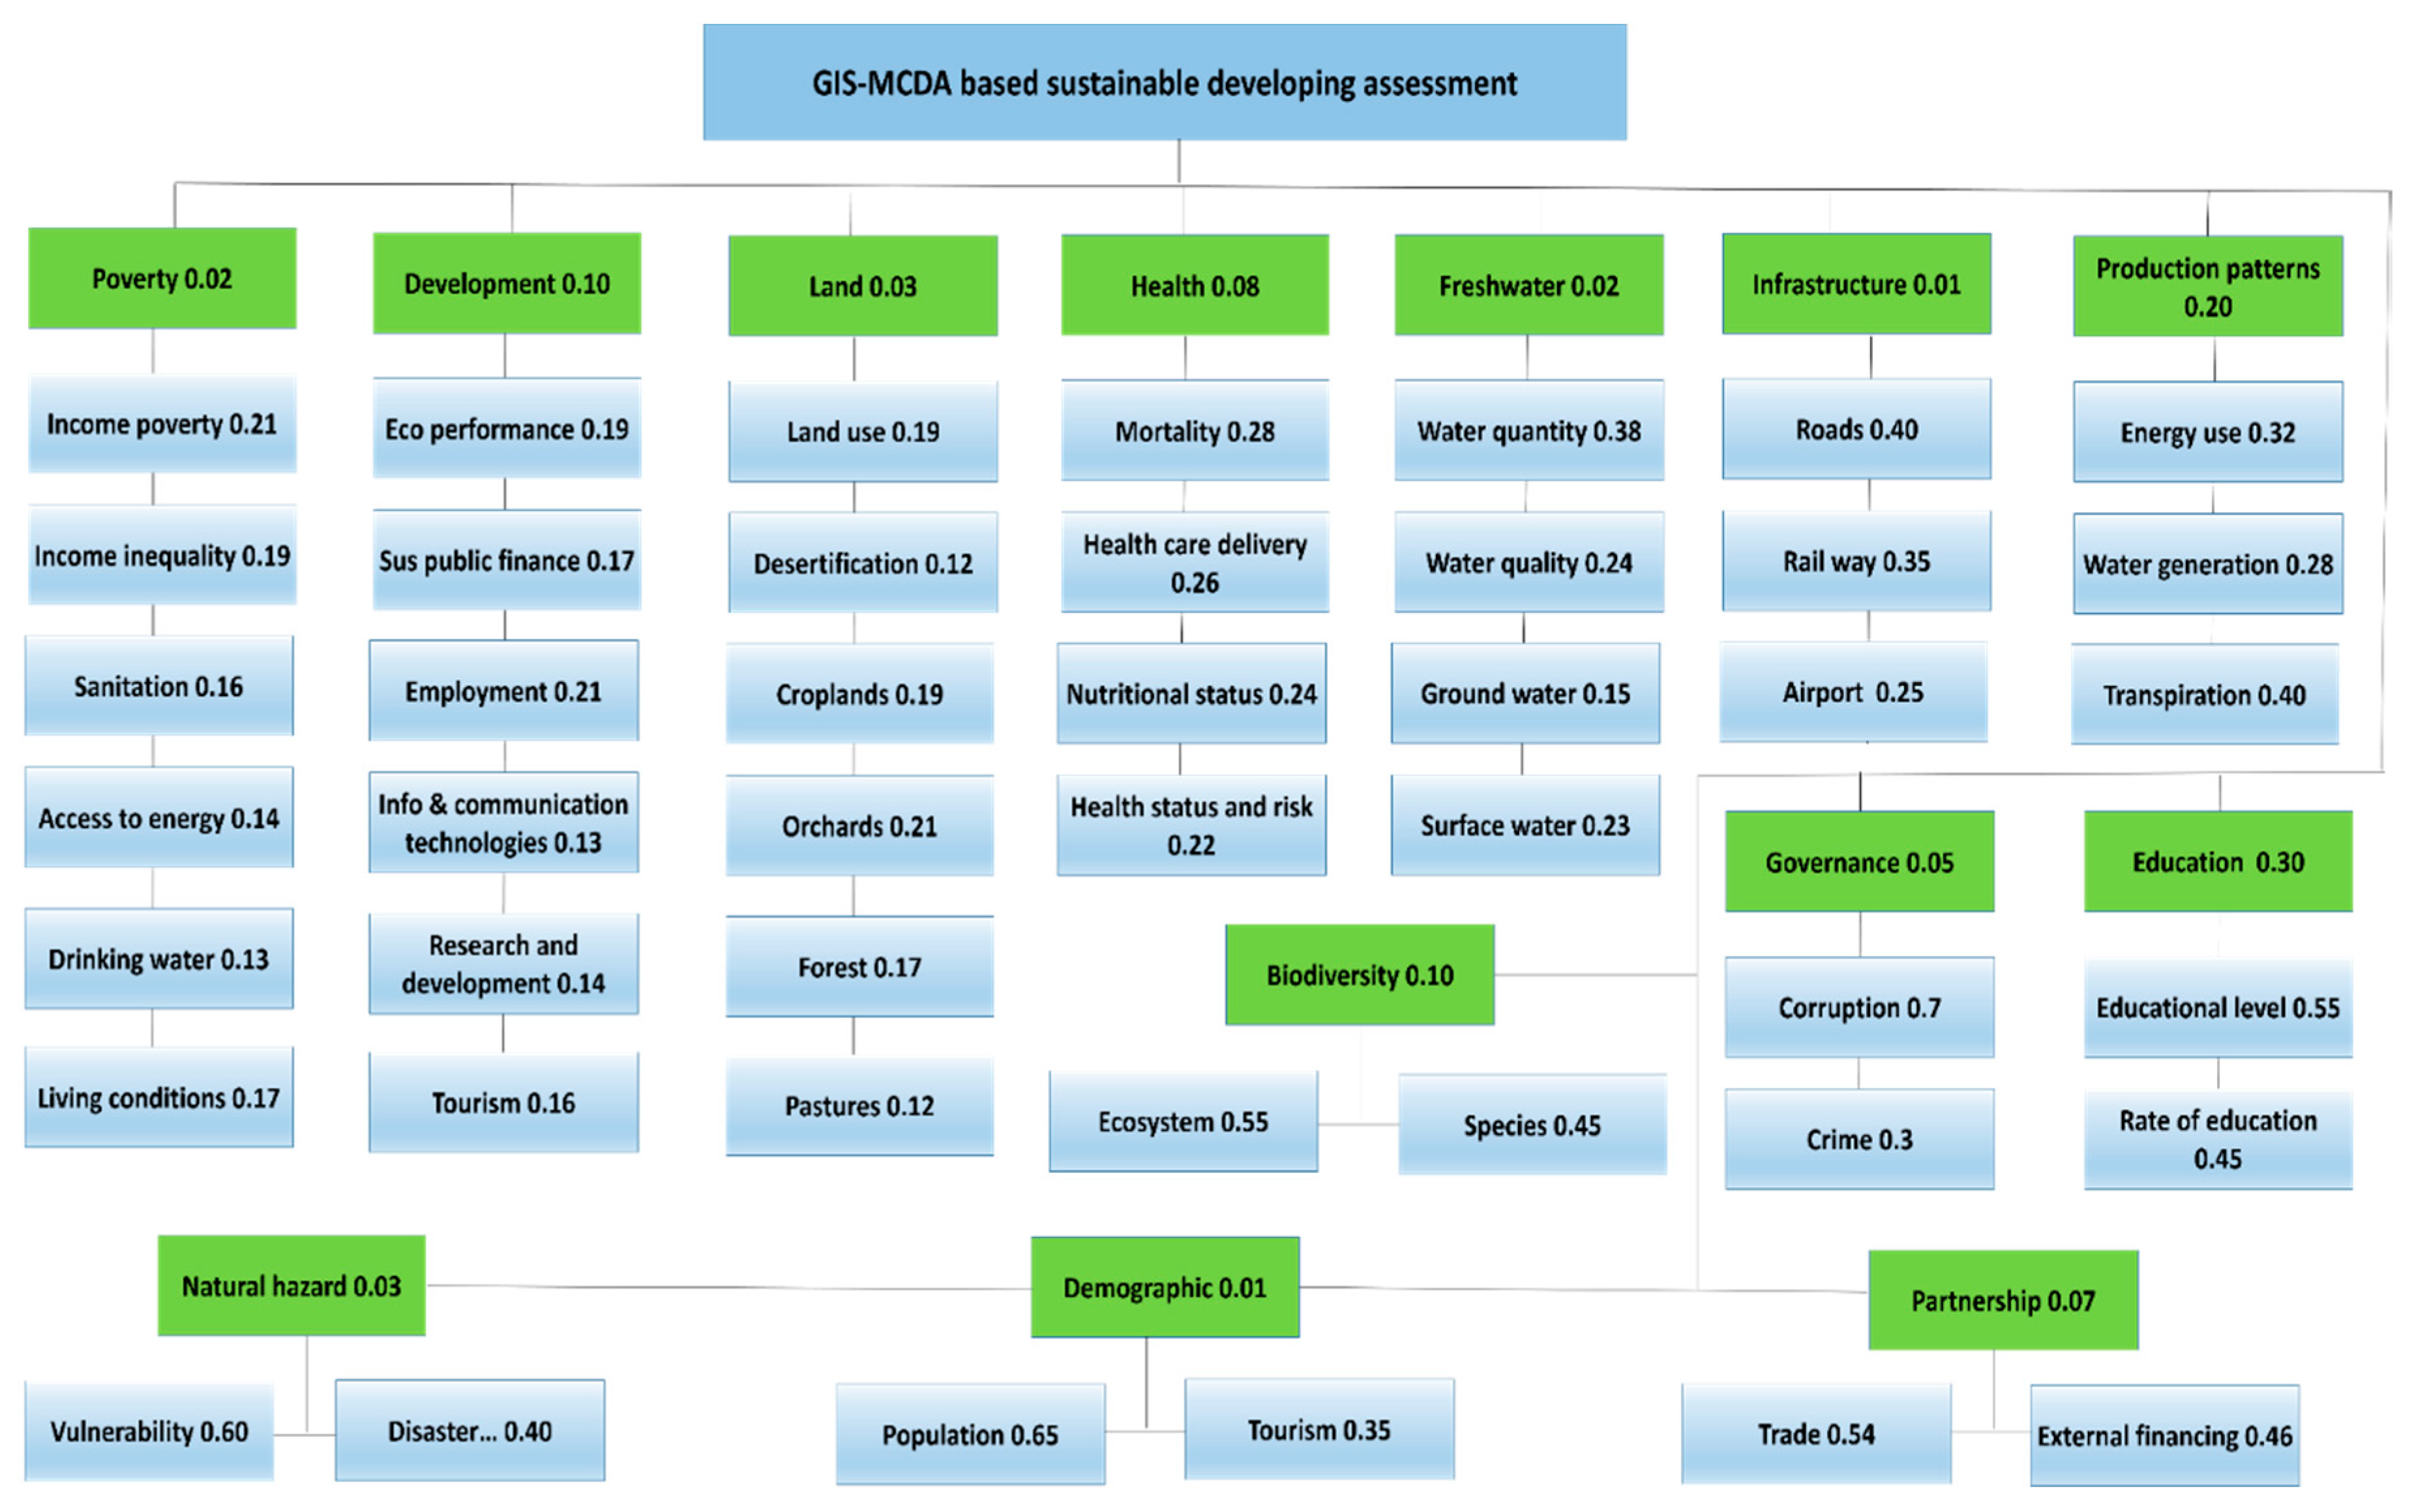
10]; considering the two framework proposed by European Environment Agency (PSR and DPSIR); and interviews with experts in the Department of Economic Science at the University of Tabriz, local stakeholders, decision makers and authorities in governance of EAP. Accordingly, we employed 13 main indicators and 44 sub-criteria for SDA modeling in EAP that are listed in
Table 1. The selection of indicators was performed based on related literature [
10,
11,
12]; interviews with local experts in the Department of Economic Science at the University of Tabriz, decision makers and authorities in OPM-EAP and the government of EAP; and the data availability.
After the relevant and appropriate indicators were identified, data related to them were collected and added to GIS dataset. In light of the research objectives, the first step was to establish a spatial database for the spatially explicit analysis of the degree of sustainable development. For this purpose, the following GIS analytical techniques were used:
Data and statistics for poverty, economic development, governance, demographics, economic partnership, education and consumption and production patterns were gathered from the Organization of Planning and Management for East Azerbaijan Province [
8].
Topographic indicators, roads, infrastructure, drainage and freshwater network data were extracted from a topographical map of the area at a scale of 1:25,000, which were obtained from the national cartographic center.
Lithology, natural hazard and relevant maps derived from geological maps 1:100,000 that were acquired from the national geology organization.
Land use/and land cover (LULC) maps were derived from Landsat ETM+ satellite images—2019 through image processing techniques based on the object based image analysis techniques. This process was developed by selecting the land use/cover classes and producing the LULC though image segmentation and classification. The rule-based classification was organized using object-based training data, object features and nearest neighbor classification. Accordingly, the supervised classification was applied to classify the objects into the LULC class. The resulting map was also exported into a GIS environment and the final LULC map was obtained.
For spatial modelling of SDA, all indicators were prepared and stored as a GIS dataset. For this goal, during the data preparation step, the required geometric thematic edits and improvements were applied. Finally, in order to apply GIS-MCDA aggregation functions, all vector layers were exported into raster format with 20 m spatial resolution. This spatial resolution was identified as an optimistic resolution for all dataset. It has to be indicated that within this research, some of our dataset was initially obtained as a GIS raster dataset (e.g freshwater and population density) in the predefined spatial resolution. Thus, in order to unify all data for the aggregate step, we standardized all raster data in the scale of 20 m spatial resolution. Accordingly, the standardized data were imported into GIS-Geodatabase for further analysis.
3.2. GIS-MCDA-Based SDA
GIS-MCDA is considered a powerful methodology for modelling tasks in the domain of GIS science. The integrated approach of GIS and MCDA has been applied to solve components of complex issues in many fields (natural hazards, site selection, suitability assessment, modelling, etc.). Technically speaking, GIS-MCDA aims to combine the data from a number of spatial indicators to make a single index of evaluation [
9,
13,
14]. GIS-MCDA also offers a framework for handling different views and compositions of the components in light of analyzing the spatial decision issues. In addition, MCDA evaluates the relationships between the components of a complex issues [
14,
15]. Therefore, it is an efficient and powerful methodology for sustainable development mapping and determining where many criteria can be taken into account, and covers all involved aspects [
6]. In light of GIS-MCDA-based sustainability assessment, a review of GIS-MCDA research revealed a variety of methods employed earlier by researchers, such as the fuzzy analytical network process (FANP) [
16,
17], GIS-MCDA-based sensitivity and uncertainty analysis [
18,
19,
20,
21]), GIS-MCDA with techniques for ordering preferences by similarity to ideal solution-TOPSIS [
21] and integration of empirical models of benchmark with GIS-MCDA methods [
22]. Some researchers also compared results of fuzzy based GIS-MCDA with traditional approaches for deriving more accurate results [
17,
23,
24,
25]. Based on this review, we employed an integrated approach of the fuzzy analytical network process (FANP) for criteria weighting. However, in order to analyze the sensitivity and uncertainty in FANP weights, we also applied Monte Carlo simulations and global sensitivity and uncertainty analysis for tackling the uncertainty issue and determining the uncertain weights. The ordered weighted average (OWA) was applied as the GIS aggregation function for deriving the final SDA map.
3.3. Criteria Standardization and Weighting
3.3.1. Standardization
SDA indicators often have different measuring scales. In order to perform MCDA analysis, standardization approaches are applied for transformation of attributes into a common suitability index [
18,
26]. This method is an extension of the classic binary logic, which assists in determining sets without sharp boundaries and allows components to be partially allotted to a specific set. This step is essentially based on the applying of the fuzzy membership value, which leads to unifying the indicators in the same scale. This standardization is based on the cost and benefit context of the indictors, which accordingly leads to minimizing or maximizing the indictors based on their values and their significance for the objective of sustainability assessment. Within this approach, all GIS operators for data were standardized in the GIS environment using the liner membership function with the scale of 0–1 [
27,
28].
3.3.2. Weighting
In the GIS–MCDA process all criteria are integrated based on their own weights, which are derived from weighting functions or expert knowledge. Thus, deriving weights is the most important and critical step for any GIS-MCDA-based modelling, which makes their contribution to the final results significant [
20]. The fuzzy analytical network process (FANP) method is an effective approach which is proposed as an extensive and complementary technique for criteria weighting [
13]. According to Saaty [
29], the FANP is a logical way to deal with dependence. Thus, FANP is supposed to solve more complex issues against the other conventional MCDA-weighting models (e.g., analytic hierarchy process, ranking sum and technique for order of preference by similarity to ideal solution (TOPSIS) [
30]. According to Saaty [
31], the FANP is a logical approach to deal with dependence. In our research we employed the FANP methods for criteria ranking and weighting based on the outcome of our earlier research and a review of the related literature [
13,
15,
18,
23]. The FANP method is subdivided into three different stages based on their principle purposes, including: (a) identifying the most efficient alternative with conflicting and interrelated criteria, (b) ranking the interrelated criteria through a network-based framework and (c) assessing indirect impacts of different criteria and their respective significance [
32]. In addition, since FANP is known as a mathematical approach, it can methodically overcome all issues of dependencies. For this to happen, within the first step this technique makes a number of pairwise comparison matrices of the criteria. Therefore, a relative significance value can be given through a scale of 1–9 (see
Table 2) for ranking the significance of each criterion in the decision matrix [
29,
32].
This method represents a network from the scale of small to big matrices and alternatives which are accordingly grouped into clusters (both of them called elements). Several relations can be considered within any possible connection of the network. It has to be indicated that this network encloses reaction and interdependence connections within and among clusters [
33]. The significance of each pairwise comparison matrix is computed individually. Accordingly, the results derived from all distinct pairwise comparison matrices can be allocated into an overall super matrix (1) as parts of the columns in light of assessing the final weights of elements [
31]. As indicated in Equation (1), the super matrix W represents the significance values of each element for other elements within the network system [
33]. Our objective by applying the FANP method was to derive the significance of each criterion for SDA, which accordingly demanded computing weights from a limit super matrix and evaluating them based on the importance of the criteria. Wij component of the Supermatrix is as Equation (1).
In order to compute the criteria’s weights, we developed a questionnaire based on the considered criteria. Accordingly, 35 questionnaires were completed during the interviews with local experts in OPM-EAP with backgrounds in economics; PhD students and academic members at the Department of Economic Sciences, University of Tabriz; and local stakeholders and decision makers and authorities in the governance of EAP. The questionnaires were developed according to the research questions and objectives of the research for ranking the significance of each indictor for the SDA modeling. For this goal, the FANP’s scale of evolution from equal importance to extreme importance (1–9) was used in the questionnaires. Accordingly, experts were asked to rank each indictor as being of equal importance (1), less to moderate importance (2–5) or moderate to high importance (6–9) according the FANP’s evaluation scale. In doing so, the FANP super decision matrix was adapted and the importance of each criterion for SDA was obtained through FANP super matrix [
34,
35]. We organized the FANP decision matrix for both main and sub-criteria. The obtained concinnity ratio (CR) for this matrix was 0.07, which is very reasonable, and it means that the derived weights can be employed for SDA modeling under high confidence. Regarding the CR value, it has to indicate that the CR value is basically on the scale of 0 to 1. A reasonable CR is supposed to be less than 0.1, and if the FANP super matrix contains a value less than 0.1, the obtained weights can be used. Otherwise, the matrix has to be recomputed.
3.4. Uncertainty and Sensitivity in FANP Weights
3.4.1. Monte Carlo Simulation
Due to the multiple nature of the sustainable development studies, the uncertainties are associated with similar modeling tasks. According to Feizizadeh and Blaschke [
30], criteria weighting and ranking make significant contributions for the GIS-MCDA uncertainty. In the context of GIS-MCDA methods, the FANP is indeed known as one of the most effective and consistent methods for criteria weighting. This approach relies on expert knowledge and a decision matrix for criteria weighting through fuzzy membership functions. Obviously, using expert opinions leads to some sort of subjectivity and uncertainty in the decision matrix. Thus, it is understood that the FANP method leads some level of bias and some ambiguities in the pairwise decision matrix. Accordingly, any inaccuracy can be simply conveyed in the FANP based criteria weighting [
30]. A review of related literature in GIS-MCDA [
30,
36,
37,
38,
39] acknowledged that integrating the Monte Carlo simulation (MCS) and GIS-MCDA weighting methods (e.g., FANP) leads to minimizing the chance of error and presents a robust and efficient approach. Technically speaking, such an integration makes use of the probabilistic description of the pairwise judgements for undertaking the uncertainty [
19,
40,
41]. Thus, within this research, an integrated approach of MCS and GIS-MCDA was applied to compute the inherent uncertainty integrated with FANP’s weights. Subsequently, the imprecision in the input data and respective results (weights) can be determined as probability distributions using the FANP-MCS approach. Even though there are several statistical sampling techniques for uncertainty analysis in the context of GIS-MCDA models, the MCS method is known as one of the most robust and efficient methods which has been introduced so far [
42].
The simulation approach is indeed known as one of the most efficient methods to determine the vagueness propagation associated with spatial models (e.g., GIS-MCDA). This approach is still sufficient, even without having a lot of information about the imprecisions [
43]. In our research the integrated approach of FANP-MCS was applied to analyze the uncertainty associated with criteria weighting. For this goal, we employed the 52 sample points as the most sustainable developed area in the study area for training data. These sample data were selected based on the statements of the OPM-EAP experts in identifying the most sustainable developed areas in EAP. Based on the annual economic report of EAP [
8], these 52 points are developed sustainably. In addition, our analysis of the economic situations (e.g., life quality of inhabitation, job opportunities, number of centers and local GDP) of these sample sites acknowledges the performance of SDA indictors. Accordingly, the initial weights derived from the FANP method were employed as basic weights for the MCS. The simulation process was processed as N = 10,000. Outcomes derived from this step are the spatial mapping of the sustainable development area and simulations of the computed errors, including the minimum rank, maximum rank, average rank and standard deviation rank.
3.4.2. Variance-Based Global Sensitivity Analysis
In the context of GIS sensitivity and uncertainty analysis, variance-based global sensitivity analysis (GSA) is an efficient technique, which leads to computing the significance of input variables in a decision-making system [
37,
42]. According to GSA functionality, by contributing error to the input data, the model results can be impacted easily. In this context, the GSA approach computes the responses of the model’s results, which accordingly allows one to order the criteria based on the importance of model input variables. However, it is understood that such an ordering allows one to outline the unknown parameters and minimize the uncertain scope of response that is required to compute acceptable uncertain response values [
44,
45,
46,
47]. For this to happen, the GSA identifies the most critical input variables that are essential in the variability of results and computes the significant factors for making the variance of agent disutility and the uncertainty of pattern fragmentation [
48]. So far, the variance-based GIS approaches have been applied to a number of MCDA-based problems. Earlier research [
49,
50,
51] acknowledged the GSA technique as very efficient in the domain of GIS-based sensitivity and uncertainty analysis. It is believed that the variance-based GSA leads to diagnosing the weights and might have significant impacts on criteria weighting and ranking step. For this goal, two sensitivity measures including (a) first order (S) and (b) total effect (ST) sensitivity index were to be investigated by GSA. Essentially, the GSA approach can be considered a method which measures the interactive impact in relation to number of indicators in the complicated decision-making system. Principally, this method benefits from considering training data in the investigation in order to address the decision problem, and obtains an acceptable compromise between sample size and formativeness of the outputs [
52,
53,
54]. In order to compute the GSA, we employed the locations of 52 points of the most sustainable developed areas in EAP as training data. We also used the initial weights derived from FANP as reference weights, and accordingly the sensitivity of FANP weights were obtained by applying the GSA approach. For further details regarding GSA and its implementation we refer to Feizizadeh et al. [
20] and Feizizadeh and Kienberger [
21].
4. Results
4.1. Criteria Weighting
Results of criteria ranking and computing the significance of each criterion are represented in
Table 3 and
Figure 2.
4.2. Sensitivity Analysis
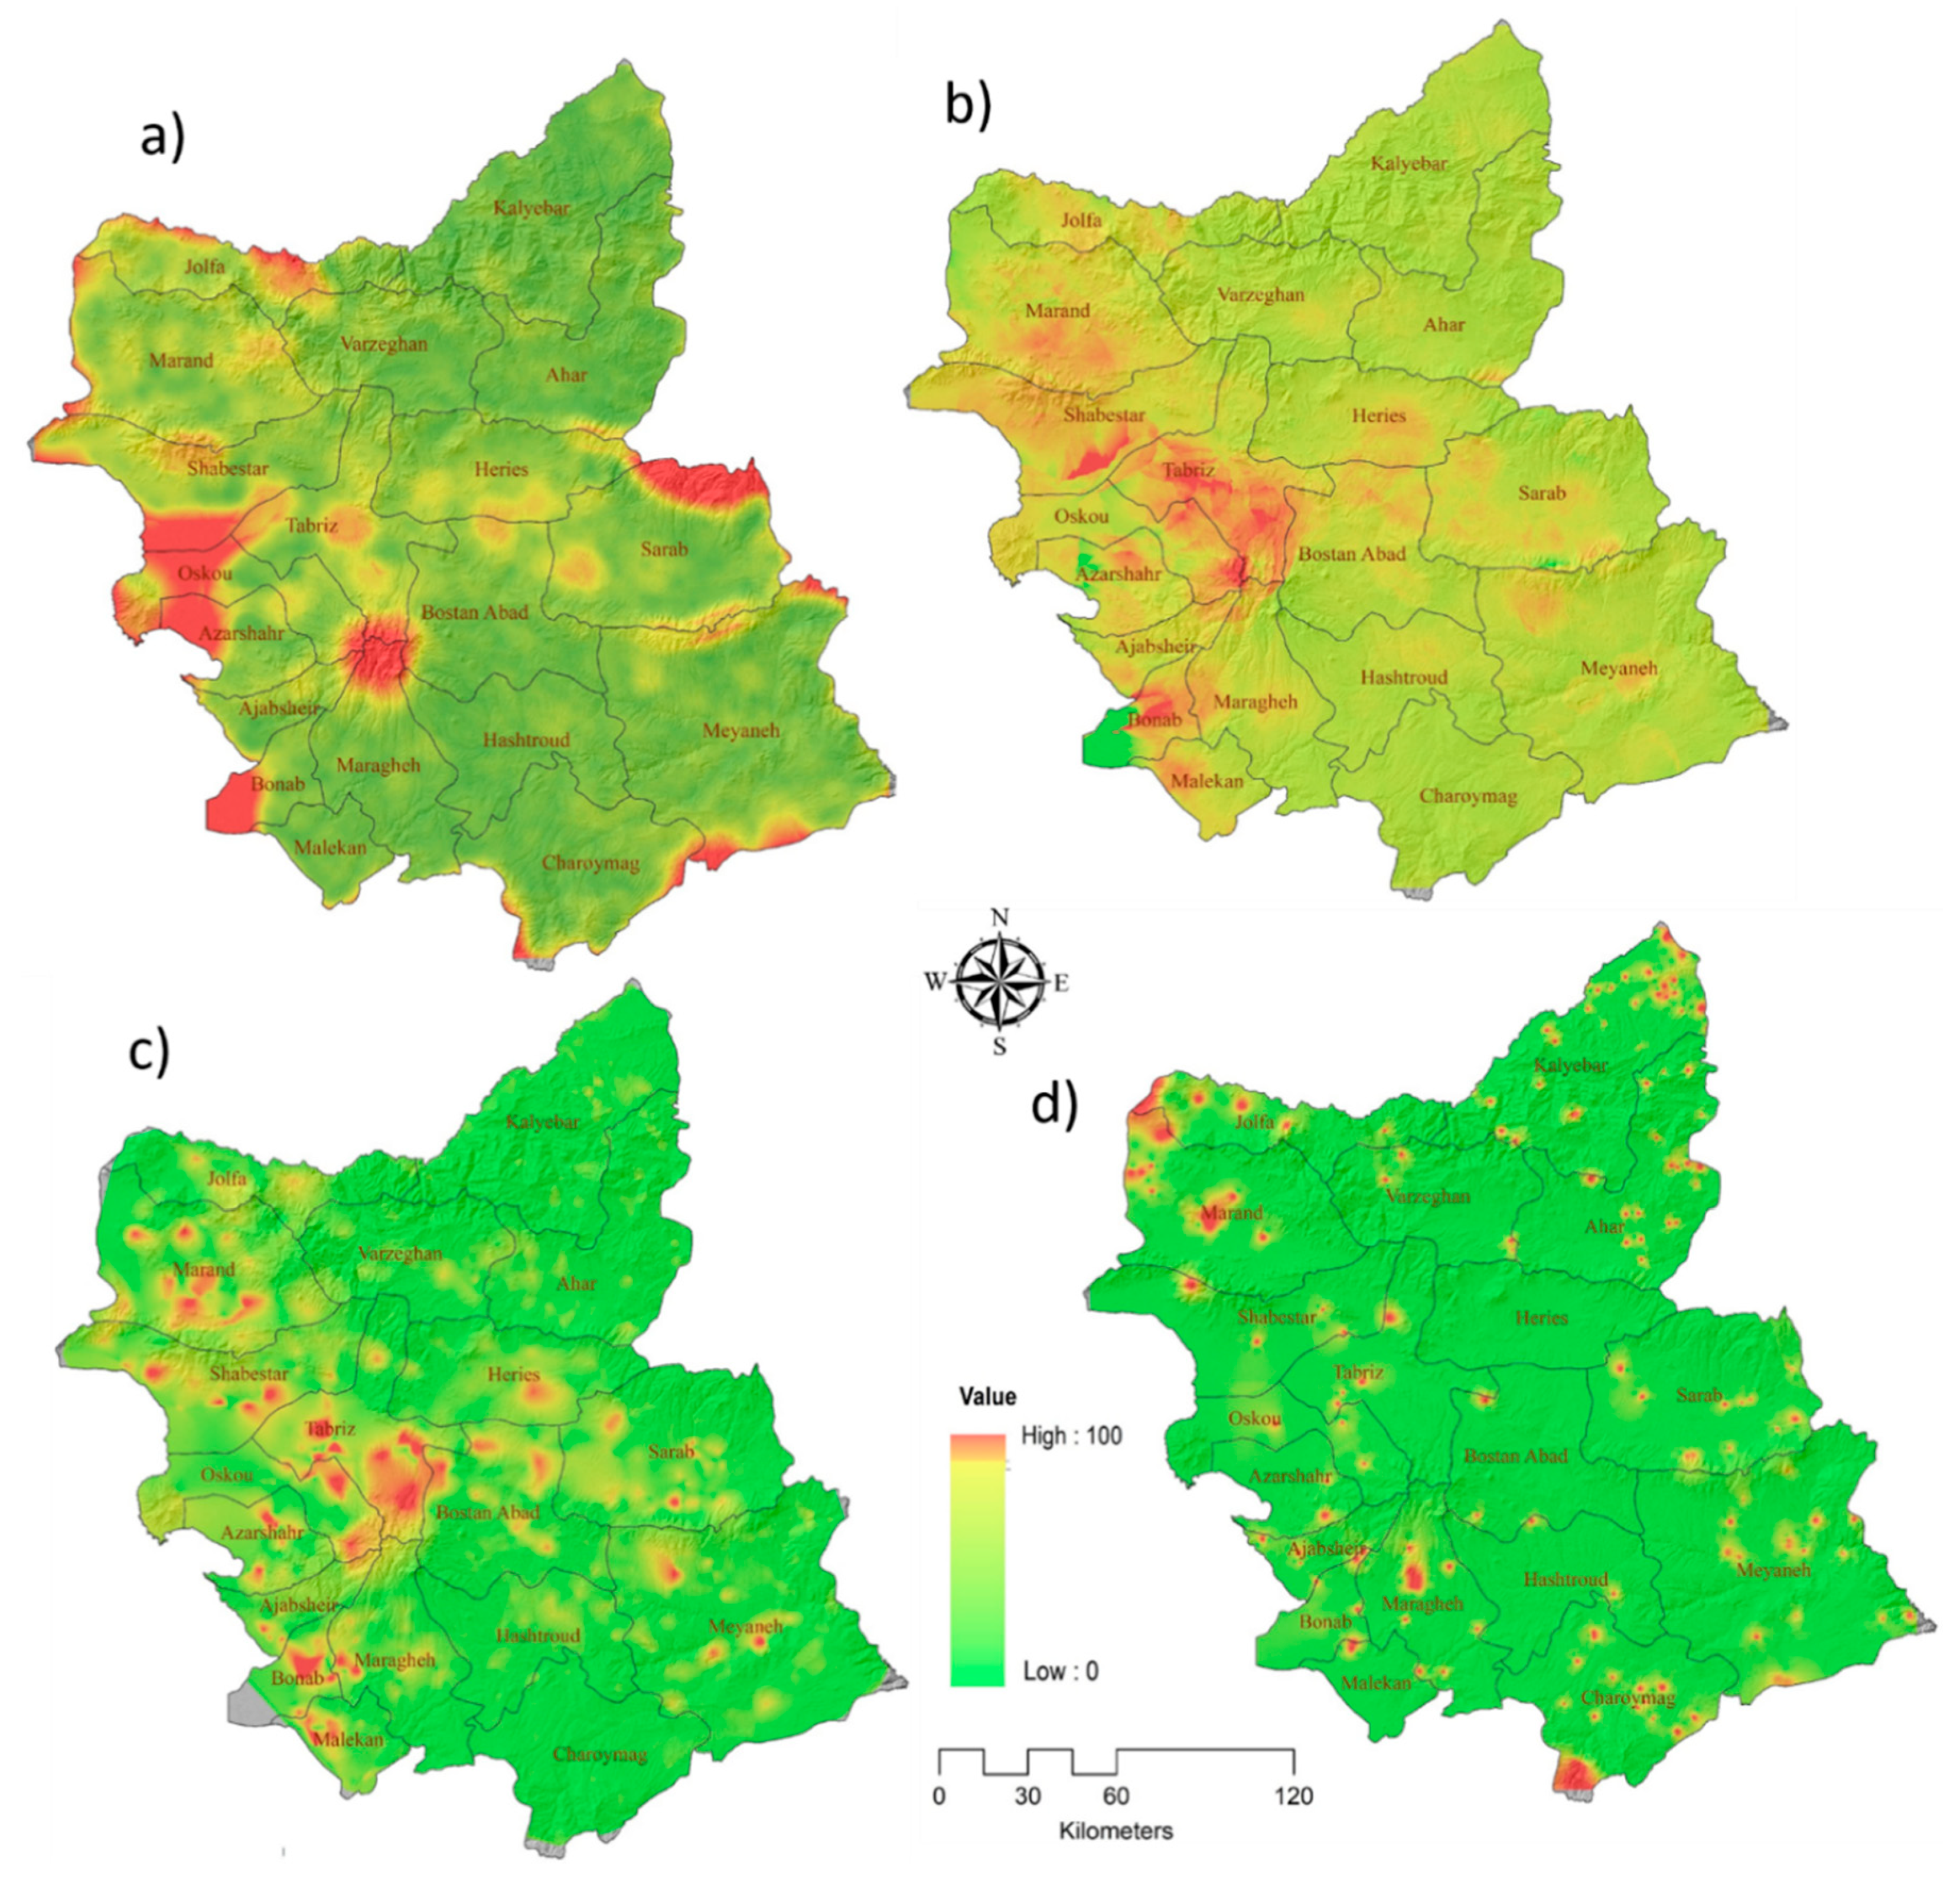
As indicated in the methodology section, in order to minimize the chance of error in weighting the SDA indicators, we aimed to apply the MCS for computing the inherent errors associated with the FANP weights.
Figure 3 shows results of MCS as computed errors, including the minimum rank (3a), maximum rank (3b), average rank (3c) and standard deviation rank (3d).
Table 3 shows the results of GSA for computing S and ST. As indicated in
Table 3, poverty was the most important criterion; natural hazard was identified as less important. The significance of other criteria for SDA is indicated in column (ST%). Results of this simulation indicated the optimized weights of FANP, which accordingly were employed for developing the SD map.
4.3. Producing the SDA Map
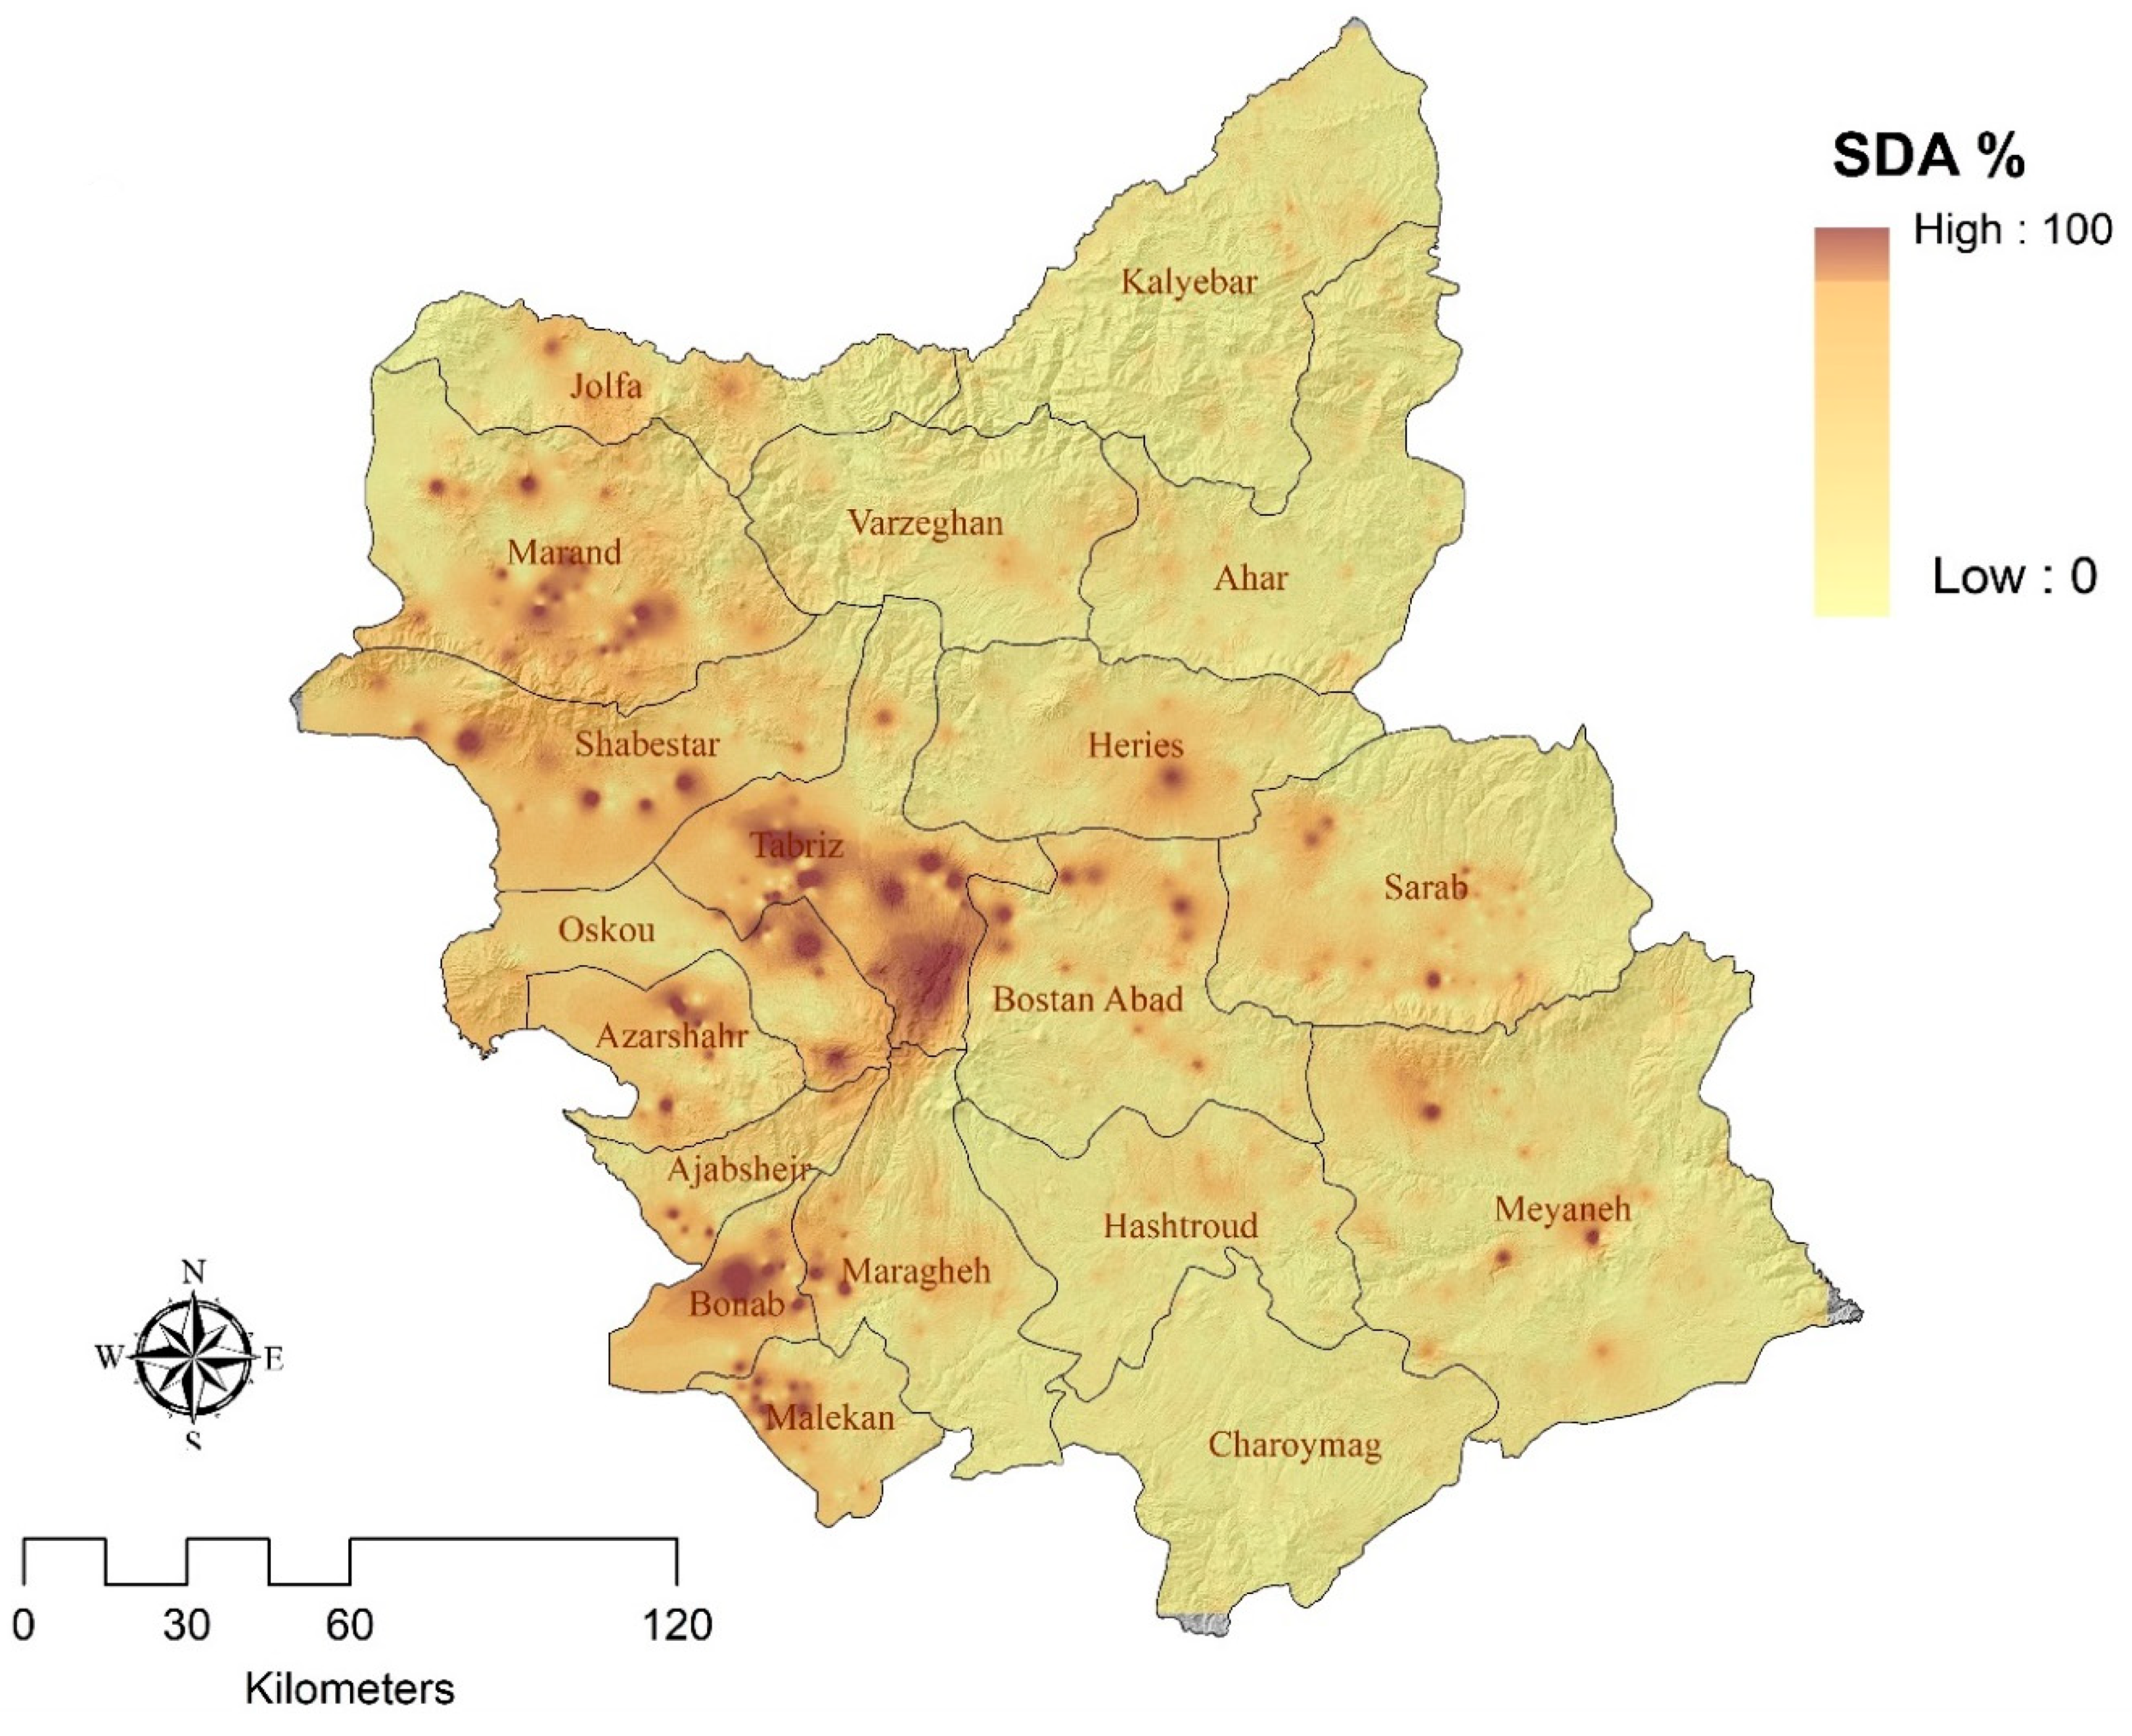
In order to develop the SDA map, all identified main and sub-indicators were integrated based on GIS-MCDA aggregation functions by considering the optimized weights through the MCS. For this goal, we employed the ordered weighted average (OWA) for aggregating the SDA indicators. Technically speaking, the OWA method aims to reorder and shift criterion parameters that one can use to produce a range of different solution maps and efficient scenarios [
26,
30]. This approach takes advantage of fuzzy based operators as efficient techniques for criteria ranking and minimizing the inherent uncertainty associated with their interactions [
55]. In this research, for applying the OWA approach and producing the SDA map, the OWA function was employed.
Figure 4 shows the final results of our sustainable development assessment in East Azerbaijan Province (EAP). According to the final map, there is unbalanced development in EAP; while some counties are being developed in a sustainable manner, most of the counties are not well developed or are less developed.
5. Discussion
According to the obtained SDA map, Tabriz County is the most developed area in EAP, which is closely followed by Bonab County. Our results pointed out that these two counties are known as the most developed with heavy industrial and commercial activities. Detailed results show that about 6% of the industrial activity of the country is located in Tabriz and Bonab counties. With about 2 million inhabitants (57% of whole state), these two combined constitute the most highly populated area of EAP. The historical background of Tabriz city, as the capital of Iran during some previous dynasties, together with its geographical location and its current status as one of the four largest cities in Iran, resulted in Tabriz being developed significantly [
56,
57]. Tabriz is also known as the center of commerce and trade in the northwest of Iran. Historically speaking, Tabriz has been acting as the second capital of Iran for many years. Tabriz’s historical bazar with an area of 50 hectares is the largest covered bazar in Iran, which is inscribed as a UNESCO world heritage site [
58].
Being the largest city of Iran in the neighborhood of Turkey, Azerbaijan, Armenia and Iraq has helped Tabriz to be a center of national and international trade in Iran. Geographical location together with commercial and trade functionality over the centuries, and heavy industrial activity, has turned Tabriz to one of the most developed cities in Iran and the most developed city in northwest of Iran. Based on the obtained results, Bonab is the second most developed county in EAP. This county with a population of about 189,000 is the main industrial center of the country, and hosts several critical industries, such as Sahnad Thermal Power Station, steelmaking and over hundred food industries. Technically speaking, Bonab is a county with an area of 805 KM2 with limited resources and properties located in the eastern part of the Urmia Lake. However, this county has significantly developed in recent years (basically since 1990). Extensive investments based on governmental support and heavy industrialization caused this county to be developed essentially within the past two decades.
The SDA map also indicates that Oskuo, Azarshahr, Marand, Marageh, Jolfa, Ajbashir and Malekan are developed in a somewhat sustainable manner. The economies of these areas were developed based on agricultural and related industrial activities. However, these counties are still undeveloped based on the considerable potentialities for sustainable development. In terms of Jolfa County, it should be mentioned that the recent developments in this county have been based on the development of the Aras Free Trade Industrial Zone (AFTZ) which was initiated in 2004. The AFTZ is a government-based organization that supports trade and industrial activates as tax free in northwest of Iran and neighboring countries (basically Turkey and Azerbaijan). Based on the tax-free policy, Jolfa has started to experience significant levels of development over that last decade. Several industrial unities and commercial centers have been developed in Jolfa and it is anticipated to be one the most developed counties in EAP in the near feature. According to the results, Heris, Ahar, Boastan Abad and Sarab counties are relatively developed, while Charoymag, Hashtrud, Meyaneh and Kalyebar counties are classified as less developed counties. The economies of these areas are basically based on the agricultural and animal husbandry activities. These areas mostly cover the southern part of the Sahand Mountains, where the mountainous landscape renders the development of irrigated agriculture systems challenging. Thus, the rainfed agriculture system has developed in most parts of these areas. It has to be indicated that EAP features a semi-arid climate that poses limitations for developing agricultural activities. There are no considerable industrial activities in these counties, and basically cities are developed in traditional systems only based on the increasing population. More balanced policies towards development of these areas are needed to avoid excessive immigration to Tabriz and other major cities in the region that may lead to significant socio-economic and environmental ramifications.
6. Conclusions
The main objective of this research was to apply GIS-MCDA methods for assessing and analyzing the degree of sustainable development in East Azerbaijan Province. For this purpose, the FANP method was applied to derive the criteria weights. The OWA approach was also applied to aggregate the indicators and develop the SDA map. According to results, GIS-MCDA proved to be a powerful methodology for sustainable development studies, and it allows one to employ a variety of indicators with different scales of evaluation. According to the results, the FANP can be considered an efficient method for ranking SDA indicators. As the results pointed out, applying the GSA approach leads to determining the uncertain weights and enhancing the robustness of the functionality of the GIS-MCDA model. In terms of the SDA map, results indicated that Tabriz County has developed significantly, which clearly addresses the importance of provincial capitals for development. Based on the results, the OWA also turned out to be an effective approach for dealing with inherent uncertainty with employed fuzzy membership values and order weights. The results acknowledged that the OWA leads to establishing a number of decision strategies showing extreme pessimism (the minimum-type) based on the logical “AND” operator. This process runs through a transitional neutral-toward-risk strategy, to an enormously optimistic strategy which is actually the maximum-type strategy by applying the logical “OR” operator [
30,
58,
59,
60,
61,
62,
63,
64,
65,
66,
67]. Based on this statement, it is to be acknowledged that OWA can be considered as an extension and a generalization of the conventional combination procedures in GIS, which was also pointed out in earlier research.
This research lays the groundwork for a detailed and in-depth analysis of how to further the sustainable development in EAP, in Iran and beyond. Additional research could focus on developing certain areas or counties based on local preferences and lessening the spatial variation in the degree of sustainable development between those areas. Additionally, socioeconomic indicators and data could be applied for welfare assessments of changes. Within this research, we applied GIS-MCDA-based methods for a sustainable assessment which is important for decision makers and authorities. In terms of SDA, the research outcome could deliver the confident sustainability map which is essential for sustainable development programs. The resulting map developed based on GIS-MCDA provides the possibility of arranging and integrating the spatial criteria from a variety of locations and description viewpoints which eventually support decision makers and authorities to organize sustainable development plans for the study area.
The results obtained by integrating SDA indicators show the overall sustainable degree in each part of the province. Based on the results, it can be stated that industrial-based economy, employment, education level, infrastructure, poverty and demography are the main indicators impacting sustainable development in East Azerbaijan Province. The results also acknowledged the asymmetric development in East Azerbaijan Province with Tabriz city and its suburb area dominating the scale. According to results, it can be concluded that the obtained SDA map provides valuable information for comparing sustainable development in the study area and can be used as a basis for decision-making and regional planning for East Azerbaijan Province. We also conclude that the proposed GIS-MCDA-based approach turned out to be an efficient and effective approach that can be applied for sustainable development assessments in other case studies. Thus, results of this research are also of great importance for future research in the domain of economic sciences and GIS sciences by means of introducing a sufficient methodology for GIS-MCDA and economic development assessment.
Author Contributions
P.M., conceptualization, methodology, software and writing; S.P., data curation, writing—original draft preparation; B.F., writing GIS analysis and organizing the modelling tasks; A.S., supervision, and writing—reviewing, editing and improving; M.V.-S., improving and revising. All authors have read and agreed to the published version of the manuscript.
Funding
This research received no external funding.
Conflicts of Interest
The authors declare no conflict of interest.
References
- Griggs, D.; Stafford-Smith, M.; Gaffney, O.; Rockström, J.C.; Öhman, M.; Shyamsundar, P.; Steffen, W.; Glaser, G.; Kanie, N.; Noble, I.; et al. Policy: Sustainable development goals for people and planet. Nature 2013, 495, 305–307. [Google Scholar] [CrossRef] [PubMed]
- Boggia, A.; Massei, G.; Pace, E.; Rocchi, L.; Paolotti, L.; Attard, M. Spatial multicriteria analysis for sustainability assessment: A new model for decision making. Land Use Policy 2018, 71, 281–292. [Google Scholar] [CrossRef] [Green Version]
- Tuokuu, F.X.D.; Kpinpuo, S.D.; Hinson, R.E. Sustainable development in Ghana’s gold mines: Clarifying the stakeholder’s perspective. J. Sustain. Min. 2019, 18, 84–88. [Google Scholar]
- European Parliament. GIS for Sustainability Assessment, Directorate General for Research-Directorate A STOA—Scientific and Technological Options Assessment Riefing Note No. 06/2017. Available online: https://www.google.com.hk/url?sa=t&rct=j&q=&esrc=s&source=web&cd=&ved=2ahUKEwjE2r3MvMftAhWewosBHSUWDU4QFjABegQIAxAC&url=https%3A%2F%2Fwww.europarl.europa.eu%2FRegData%2Fetudes%2Fetudes%2Fjoin%2F2001%2F297571%2FDG-4-JOIN_ET(2001)297571_EN.pdf&usg=AOvVaw0aexlh9QOPRf64XHICHQVp (accessed on 10 September 2020).
- Giddings, B.; Hopwood, B.; O’Brien, G. Environment, economy and society: Fitting them together into sustainable development. Sustain. Dev. 2002, 10, 187–196. [Google Scholar] [CrossRef]
- Burgass, M.J.; Halpern, B.S.; Nicholson, E.; Milner-Gulland, E.J. Navigating uncertainty in environmental composite indicators. Ecol. Indic. 2017, 75, 268–278. [Google Scholar] [CrossRef]
- Statistical Center of Iran. 2020. Available online: https://www.amar.org.ir (accessed on 10 September 2020).
- Organization of Planning and Management of East Azerbaijan Province. Annual Economic Progress of Report of East Azerbaijan Province. 2019. Available online: https://azsharghi.mporg.ir/ (accessed on 15 September 2020).
- Chen, Y.; Khan, S.; Paydar, Z. To retire or expand? A fuzzy GIS-based spatial multi-criteria evaluation framework for irrigated agriculture. Irrig. Drain. 2009, 59, 178–188. [Google Scholar] [CrossRef]
- United Nations. Indicators of Sustainable Development: Guidelines and Methodologies; United Nations: New York, NY, USA, 2007; ISBN 978-92-1-104577-2. [Google Scholar]
- Effat, H.A.; Hegazy, M.N. A Multidisciplinary Approach to Mapping Potential Urban Development Zones in Sinai Peninsula, Egypt Using Remote Sensing and GIS. J. Geogr. Inf. Syst. 2013, 5, 567–583. [Google Scholar] [CrossRef] [Green Version]
- Vogdrup-Schmidt, M.; Strange, N.; Olsen, S.B.; Thorsen, B.J. Trade-off analysis of ecosystem service provision in nature networks. Ecosyst. Serv. 2017, 23, 165–173. [Google Scholar] [CrossRef]
- Ghorbanzadeh, O.; Feizizadeh, B.; Blaschke, T. Multi-criteria risk evaluation by integrating an analytical network process approach into GIS-based sensitivity and uncertainty analyses. Geomatics, Nat. Hazards Risk 2018, 9, 127–151. [Google Scholar] [CrossRef] [Green Version]
- Malczewski, J. Multi criteria-based decision analysis: A survey of the literature. Int. J. Geogr. Inf. Sci. 2006, 20, 703–726. [Google Scholar] [CrossRef]
- Feizizadeh, B.; Jankowski, P.; Blaschke, T. A GIS based spatially-explicit sensitivity and uncertainty analysis approach for multi-criteria decision analysis. Comput. Geosci. 2014, 64, 81–95. [Google Scholar] [CrossRef] [PubMed] [Green Version]
- Neaupane, K.M.; Achet, S.H.; Piantanakulchai, M. Landslide Hazard Assessment: A Qualitative and a Knowledge-Based Technique. GeoCongress 2008, 870–877. [Google Scholar] [CrossRef]
- Neaupane, K.M.; Piantanakulchai, M. Analytic network process model for landslide hazard zonation. Eng. Geol. 2006, 85, 281–294. [Google Scholar] [CrossRef]
- Feizizadeh, B.; Blaschke, T. Land suitability analysis for Tabriz County, Iran: A multi-criteria evaluation approach using GIS. J. Environ. Plan. Manag. 2014, 56, 1–23. [Google Scholar] [CrossRef]
- Feizizadeh, B.; Blaschke, T. An uncertainty and sensitivity analysis approach for GIS-based multicriteria landslide susceptibility mapping. Int. J. Geogr. Inf. Sci. 2014, 28, 610–638. [Google Scholar] [CrossRef] [PubMed] [Green Version]
- Feizizadeh, B.; Roodposhti, M.S.; Jankowski, P.; Blaschke, T. A GIS-based extended fuzzy multi-criteria evaluation for landslide susceptibility mapping. Comput. Geosci. 2014, 73, 208–221. [Google Scholar] [CrossRef] [PubMed] [Green Version]
- Feizizadeh, B.; Kienberger, S. Spatially explicit sensitivity and uncertainty analysis for multicriteria-based vulnerability assessment. J. Environ. Plan. Manag. 2017, 60, 2013–2035. [Google Scholar] [CrossRef]
- Xu, Z.; Li, Q. Integrating the empirical models of benchmark land price and GIS technology for sustainability analysis of urban residential development. Habitat Int. 2014, 44, 79–92. [Google Scholar] [CrossRef]
- Malmir, M.; Zarkesh, M.M.K.; Monavari, S.M.; Jozi, S.A.; Sharifi, E. Analysis of land suitability for urban development in Ahwaz County in southwestern Iran using fuzzy logic and analytic network process (ANP). Environ. Monit. Assess. 2016, 188. [Google Scholar] [CrossRef]
- Razavitoosi, S.; Samani, J. Evaluating water management strategies in watersheds by new hybrid Fuzzy Analytical Network Process (FANP) methods. J. Hydrol. 2016, 534, 364–376. [Google Scholar] [CrossRef]
- Valmohammadi, C.; Ghassemi, A. Identification and prioritization of the barriers of knowledge management implementation using fuzzy analytical network process. VINE J. Inf. Knowl. Manag. Syst. 2016, 46, 319–337. [Google Scholar] [CrossRef]
- Gorsevski, P.V.; Donevska, K.R.; Mitrovski, C.D.; Frizado, J.P. Integrating Multi-criteria Evaluation Techniques with Geographic Information Systems for Landfill Site Selection: A Case Study Using OrderedWeighted Average. J. Waste Manag. 2012, 32, 287–296. [Google Scholar] [CrossRef] [PubMed]
- Malczewski, J. GIS-based land-use suitability analysis: A critical overview. Prog. Plan. 2004, 62, 3–65. [Google Scholar] [CrossRef]
- Gheshlaghi, H.A.; Feizizadeh, B. An integrated approach of analytical network process and fuzzy based spatial decision making systems applied to landslide risk mapping. J. Afr. Earth Sci. 2017, 133, 15–24. [Google Scholar] [CrossRef]
- Saaty, T.L. Decision Making with Dependence and Feedback: Analytic Network Process; RWS Publications: Pittsburgh, PA, USA, 1996. [Google Scholar]
- Feizizadeh, B.; Blaschke, T. GIS-multicriteria decision analysis for landslide susceptibility mapping: Comparing three methods for the Urmia lake basin, Iran. Nat. Hazards 2013, 65, 2105–2128. [Google Scholar] [CrossRef]
- Saaty, T.L. The Analytic Network Process. Iran. J. Oper. Res. 2008, 1, 1–27. [Google Scholar]
- Zabihi, H.; Ahmad, A.; Vogeler, I.; Said, M.N.; Golmohammadi, M.; Golein, B.; Nilashi, M. Land suitability procedure for sustainable citrus planning using the application of the analytical network process approach and GIS. Comput. Electron. Agric. 2015, 117, 114–126. [Google Scholar] [CrossRef]
- Aragones-Beltran, P.; Aznar, J.; Ferrı´s-Onate, J.; Garcıa-Melon, M. Valuation of urban industrial land: An analytic network process approach. Eur. J. of Oper. Res. 2008, 185, 322–339. [Google Scholar] [CrossRef]
- Tupenaite, L.T.; Lill, I.; Geipele, I.; Naimaviciene, J. Ranking of Sustainability Indicators for Assessment of the New Housing Development Projects: Case of the Baltic States. Resources 2017, 6, 55. [Google Scholar] [CrossRef] [Green Version]
- Guimarães, J.L.D.S.; Salomon, V.A.P. ANP Applied to the Evaluation of Performance Indicators of Reverse Logistics in Footwear Industry. Procedia Comput. Sci. 2015, 55, 139–148. [Google Scholar] [CrossRef] [Green Version]
- Benke, K.K.; Lowell, K.E.; Hamilton, A.J. Parameter uncertainty, sensitivity analysis and prediction error in a water-balance hydrological model. Math. Comput. Model. 2008, 47, 1134–1149. [Google Scholar] [CrossRef]
- Benke, K.K.; Pelizaro, C. Aspatial-Statistical approach to the visualization of uncertainty in land suitability analysis. J. Spat. Sci. 2010, 55, 257–272. [Google Scholar] [CrossRef]
- Kritikos, T.R.; Davies, T.R. GIS-based Multi-Criteria Decision Analysis for landslide susceptibility mapping at northern Evia, Greece. Z. Dtsch. Ges. Geowiss. 2011, 162, 421–434. [Google Scholar] [CrossRef]
- Shokati, B.; Feizizadeh, B. Sensitivity and uncertainty analysis of agro-ecological modeling for saffron plant cultivation using GIS spatial decision-making methods. J. Environ. Plan. Manag. 2018, 62, 517–533. [Google Scholar] [CrossRef]
- Bemmaor, A.C.; Wagner, U. A Multiple-Item Model of Paired Comparisons: Separating Chance from Latent Preference. J. Mark. Res. 2000, 37, 514–524. [Google Scholar] [CrossRef]
- Hahn, E.D. Decision Making with Uncertain Judgments: A Stochastic Formulation of the Analytic Hierarchy Process. Decis. Sci. 2003, 34, 443–466. [Google Scholar] [CrossRef]
- Chen, H.; Wood, M.D.; Linstead, C.; Maltby, E. Uncertainty analysis in a GIS-based multi-criteria analysis tool for river catchment management. Environ. Model. Softw. 2011, 26, 395–405. [Google Scholar] [CrossRef]
- Tenerelli, P.; Carver, S. Multi-criteria, multi-objective and uncertainty analysis for agro-energy spatial modelling. Appl. Geogr. 2012, 32, 724–736. [Google Scholar] [CrossRef]
- Guo, J.; Du, X. Sensitivity Analysis with Mixture of Epistemic and Aleatory Uncertainties. Am. Inst. Aeronaut. Astronaut. 2007, 45, 2337–2349. [Google Scholar] [CrossRef]
- Xu, C.; Gertner, G.Z. Uncertainty and sensitivity analysis for models with correlated parameters. Reliab. Eng. Syst. Saf. 2008, 93, 1563–1573. [Google Scholar] [CrossRef]
- Aven, T.; Nøkland, T.E. On the use of uncertainty importance measures in reliability and risk analysis. Reliab. Eng. Syst. Saf. 2010, 95, 127–133. [Google Scholar] [CrossRef]
- Hao, W.; Lu, Z.; Wei, P.; Feng, J.; Wang, B. A new method on ANN for variance based importance measure analysis of correlated input variables. Struct. Saf. 2012, 38, 56–63. [Google Scholar] [CrossRef]
- Ligmann-Zielinska, A.; Jankowski, P. Impact of proximity-adjusted preferences on rank-order stability in geographical multi criteria decision analysis. J. Geogr. Syst. 2012, 14, 167–187. [Google Scholar] [CrossRef]
- Vogdrup-Schmidt, M.; Olsen, S.B.; Dubgaard, A.; Kristensen, I.T.; Jørgensen, L.B.; Normander, B.; Ege, C.; Dalgaard, T. Using spatial multi-criteria decision analysis to develop new and sustainable directions for the future use of agricultural land in Denmark. Ecol. Indic. 2019, 103, 34–42. [Google Scholar] [CrossRef]
- Saltelli, A.; Tarantola, S.; Campolongo, F. Sensitivity analysis as an ingredient of modelling. J. Stat. Sci. 2000, 15, 377–395. [Google Scholar]
- Saisana, M.; Saltelli, A.; Tarantola, S. Uncertainty and sensitivity analysis techniques as tools for the quality assessment of composite indicators. J. Stat. Sci. 2005, 168, 307–323. [Google Scholar] [CrossRef]
- Kleijnen, J.P.C. An overview of the design and analysis of simulation experiments for sensitivity analysis. Eur. J. Oper. Res. 2005, 164, 287–300. [Google Scholar] [CrossRef] [Green Version]
- Saltelli, A.; Ratto, M.; Andres, T.; Campolongo, F.; Cariboni, J.; Gatelli, D.; Saisana, M.; Tarantola, S. Global Sensitivity Analysis: The Primer; Wiley: Chichester, UK, 2008. [Google Scholar]
- Norton, J. An introduction to sensitivity assessment of simulation models. Environ. Model. Softw. 2015, 69, 166–174. [Google Scholar] [CrossRef]
- Gheshlaghi, H.A.; Feizizadeh, B.; Blaschke, T. GIS-based forest fire risk mapping using the analytical network process and fuzzy logic. J. Environ. Plan. Manag. 2020, 63, 481–499. [Google Scholar] [CrossRef]
- Pourmoradian, S. Tourism Policy Assessment for UNESCO World Heritage of Tabriz Bazar. Ph.D. Thesis, University of Salzburg, Salzburg, Austria, 2018. [Google Scholar]
- Feizizadeh, B.; Ronagh, Z.; Pourmoradian, S.; Gheshlaghi, H.A.; Lakes, T.; Blaschke, T. An efficient GIS-based approach for sustainability assessment of urban drinking water consumption patterns: A study in Tabriz city, Iran. Sustain. Cities Soc. 2020, 64. [Google Scholar] [CrossRef]
- Jiang, H.; Eastman, J.R. Application of fuzzy measures in multi-criteria evaluation in GIS. Int. J. Geogr. Inf. Sci. 2000, 14, 173–184. [Google Scholar] [CrossRef]
- Ebrahimy, H.; Feizizadeh, B.; Salmani, S.; Azadi, H. A comparative study of land subsidence susceptibility mapping of Tasuj plane, Iran, using boosted regression tree, random forest and classification and regression tree methods. Environ. Earth Sci. 2020, 79, 1–12. [Google Scholar] [CrossRef]
- Ghorbanzadeh, O.; Pourmoradian, S.; Blaschke, T.; Feizizadeh, B. Mapping potential nature-based tourism areas by applying GIS-decision making systems in East Azerbaijan Province, Iran. J. Ecotourism 2019, 18, 261–283. [Google Scholar] [CrossRef]
- Naboureh, A.; Feizizadeh, B.; Bian, J.; Blaschke, T.; Ghorbanzadeh, O.; Moharrami, M. Traffic Accident Spatial Simulation Modeling for Planning of Road Emergency Services. ISPRS Int. J. Geo Inf. 2019, 8, 371. [Google Scholar] [CrossRef] [Green Version]
- Najafi, P.; Navid, H.; Feizizadeh, B.; Eskandari, I.; Blaschke, T. Fuzzy Object-Based Image Analysis Methods Using Sentinel-2A and Landsat-8 Data to Map and Characterize Soil Surface Residue. Remote Sens. 2019, 11, 2583. [Google Scholar] [CrossRef] [Green Version]
- Nazmfar, H.; Alavi, S.; Feizizadeh, B.; Masodifar, R.; Eshghei, A. Spatial Analysis of Security and Insecurity in Urban Parks: A Case Study of Tehran, Iran. Prof. Geogr. 2020, 72, 383–397. [Google Scholar] [CrossRef]
- Feizizadeh, B. A Novel Approach of Fuzzy Dempster–Shafer Theory for Spatial Uncertainty Analysis and Accuracy Assessment of Object-Based Image Classification. IEEE Geosci. Remote Sens. Lett. 2017, 15, 18–22. [Google Scholar] [CrossRef]
- Behboudi, D.; Mohamadzade, P.; Feizizadeh, B.; Pooranvari, A. Multi-criteria Based Readiness Assessment for Developing Spatial Data Infrastructures in East Azerbaijan Province, Iran. GI_Forum 2018, 1, 322–333. [Google Scholar] [CrossRef] [Green Version]
- Naboureh, A.; Moghaddam, M.H.R.; Feizizadeh, B.; Blaschke, T. An integrated object-based image analysis and CA-Markov model approach for modeling land use/land cover trends in the Sarab plain. Arab. J. Geosci. 2017, 10, 259. [Google Scholar] [CrossRef]
- Feizizadeh, B.; Roodposhti, M.S.; Blaschke, T.; Aryal, J. Comparing support vector machine kernel functions for GIS-based landslide susceptibility mapping. J. Arab. Geosci. 2017, 10, 122. [Google Scholar] [CrossRef]
| Publisher’s Note: MDPI stays neutral with regard to jurisdictional claims in published maps and institutional affiliations. |
© 2020 by the authors. Licensee MDPI, Basel, Switzerland. This article is an open access article distributed under the terms and conditions of the Creative Commons Attribution (CC BY) license (http://creativecommons.org/licenses/by/4.0/).

 ,
, 


