Analysis of Incentives to Eco-Driving for Car Rental Companies’ Customers


1
Faculty of Management and Logistics, Poznan School of Logistics, 6 Estkowskiego Street, 61-755 Poznan, Poland
2
Faculty of Engineering Management, Poznan University of Technology, 2 J, Rychlewskiego Street, 60-965 Poznan, Poland
3
Rentis S.A., 204 Krakowska Avenue, 02-219 Warsaw, Poland
*
Author to whom correspondence should be addressed.
Sustainability 2020, 12(24), 10579; https://0-doi-org.brum.beds.ac.uk/10.3390/su122410579
Submission received: 30 October 2020
/
Revised: 25 November 2020
/
Accepted: 14 December 2020
/
Published: 17 December 2020
(This article belongs to the Special Issue The Future of Smart Cities and Urban Logistic: An Application to Last-Mile Delivery)
Abstract
:The problem of road traffic is one of the key challenges that cities will have to deal with in the future. It is also a problem directly related to the concept of sustainable development. Reducing the negative impact of road traffic in future cities can be achieved through cooperation in the following areas: social—shaping customer behavior and habits, economic—changing attitudes towards owning a car, and environmental—aimed at reducing the vehicle’s impact on the natural environment. A literature review was used to identify the research gap concerning the impact of the incentive system on increasing the environmental performance of drivers under short-term rental. Referring to the research gap, the main goal of the article is to identify the attractiveness of eco-driving incentives for drivers under short-term rental. The study used the survey method. The study was based on 323 completed questionnaires (female—122 and male—201). The following methods were also used in the analysis of the results: Anderson–Darling, Mood’s Median test and Kruskal Wallis multiple pairwise comparisons. The evaluation of the attractiveness of the incentive to eco-driving depends on the characteristic of the client who rents the car. Thus, it is possible to shape incentive systems for car rental customers that can shape their positive behavior on the road. Among the most attractive incentives for eco-driving in a rented car are: the possibility of upgrading a car in the next rental, discount for future rental and free car-wash.
1. Introduction
The high intensity of car traffic in modern cities is a challenge not only in terms of spatial shaping of cities, but also shaping people’s behavior as well as technical and business solutions to support the reduction of the negative impact of road traffic. The stronger and faster the cars move, the more dangerous (e.g., in terms of ignoring traffic regulations) they become as far as negative consequences of heavy car traffic are concerned. This not only increases the risk of an accident, but also increases fuel consumption and emissions of CO2 and other pollutants into the atmosphere. One way of reducing traffic is to change the way one uses a car—from own to rental. Car rental is becoming more and more popular not only from the market point of view but also as an area of scientific research. The combination of the two outlined areas made the team define the scientific goal of the research.
Due to the obvious harmfulness of road transport to the natural environment indicated, for example, in the documents prepared by the European Commission, it is necessary to reduce the impact of, in particular, passenger cars on the amount of CO2 and noise levels. The reduction of the harmfulness of transport will, thus, allow the fulfillment of the postulates of sustainable development relating to three economic, environmental and social aspects [1].
Due to the fact that passenger cars emit the largest amount of greenhouse gases and are the source of increased noise intensity in cities, which has been proven in many studies, e.g., [2,3,4], reducing the number of private sector vehicles driving on the streets of large agglomerations could serve as an opportunity of reducing the harmfulness of road transport to the environment.
When analyzing the literature related to the subject of car rental, the authors noticed that one of the ways of reducing harmful effects of exhaust emissions and noise, which is one of the postulates of sustainable transport, is the intensification of the car rental sector, in particular in large cities. This action, presented, for example, in papers [5,6,7], allowed for the reduction in the use of private cars and contributed to the reduction of the number of private vehicles owned by large cities inhabitants.
On the grounds of the small percentage of papers examining the impact of the incentive system on increasing the use of car rental, the authors decided to analyze this issue in terms of the group of incentives that can realistically contribute to reducing the use of the number of private sector vehicles in favor of cars offered under Mobility on Demand [8]. According to the authors, this relationship may also contribute to lowering the noise intensity and the amount of exhaust gases generated in the future, not only due to the reduction of the number of private vehicles [9,10], but also to a real increase in the environmental performance and safe driving. The literature analysis also confirmed the assumption that car rental contributes to the reduction of the use of private vehicles. From the perspective of reducing the harmfulness of road transport with the use of the proposed incentive system, it is an additional advantage in favor of the need of addressing this topic in terms of sustainable development.
To sum up, the main goal of the article is to identify the attractiveness of eco-driving incentives for drivers under short-term rental. The research problem relates to the aim of the study is to recognize the attitude of car renters to material, non-material and social incentives to improve their eco-driving skills. To detail the research problem, the following hypothesis was developed: attractiveness of an incentive depends on the respondent’s characteristics (age, gender, driving experience, driving license category, type of customer, car rental frequency). The study analyzed incentives to improve the driving style of drivers of rented vehicles. Incentives that fit into the three pillars of sustainable development were selected. Social incentives include: reducing the risk of an accident, gamification, eco-driver certificate. Economic incentives, which are: reduction of fuel consumption, discount on current rental, discount for future rental, car upgrade, free from car-wash, prizes (gifts, vouchers). Environmental incentives such as: reducing emissions, reduction of fuel consumption.
The article was organized according to the following structure: literature review (with identification of literature gap), research study (methodology, analysis of result), discussion and conclusions (summary, limitation of the research and further research).
The results of the conducted research may be used by car rental companies to develop incentive systems for their customers, systems encouraging eco-driving which will also reduce the emission of harmful gases into the atmosphere and increase road safety.
2. Literature Review
2.1. The Concept of Sustainable Development in the Context of Transport
Proper understanding of the importance of the car rental sector in the context of sustainable development requires, first of all, a proper definition of this concept, as well as presenting it in the context of road transport. Sustainable development can be identified using the definition provided by the Brundtland Commission in 1987. According to this, sustainable development can be defined as an activity based on meeting the needs and expectations of society without losing the ability to meet the same needs in the future. Sustainable development, therefore, involves using the achievements of mankind and natural resources and leaving them in the same condition for the next generations. Sustainable development relates to three dimensions, which include: (1) Society—within which access to natural resources should be ensured for present and future generations, (2) Economy—which uses available resources to implement increasingly cost-effective processes, and (3) Environment—within which consumption and rational disposal of available resources should be taken into account, including their “footprints” [11]. Due to the need to preserve the environment in a state that enables the life of society in the future, an important term directly related to sustainable development is CO2 emission and its harmful impact on the natural environment. In reference to the statistics provided by the European Commission in the document “A European Strategy for Low-Emission Mobility”, road transport is the sector with the highest emission of harmful substances [1,12], therefore, it requires optimization measures to enable the implementation of sustainable development postulates. It is obvious that transport and its impact on the environment are not sustainable. Defining sustainable transport requires, first of all, relating it to the three aspects of sustainable development, i.e., society, economy and the environment [11]. Thisaiveerasingam and Jayaweera Bandara considered sustainability in relation to transport in the context of five dimensions corresponding to the three aspects indicated above. The dimensions include: (1) Access/Accessibility for individual passengers and the whole society considered in the context of ensuring full accessibility to various means of transport, which is the basis for creating sustainable urban agglomerations. One of the reasons for lowering transport accessibility was traffic congestions. (2) Affordability considered in the context of the economy of individual and collective passengers, enabling the use of various transport solutions. The key factor here seems to be the cost factor of eco-friendly solutions in the context of the use of various means of transport by individual members of the entire society. (3) Safety, which is a very important aspect of sustainable transport due to the high accident rate depending on the behavior of drivers, the level of infrastructure or the level and safety standards of vehicles used by members of urban centers. (4) Security—which is the purpose to secure transport and the community using it, but not in the context of accident rate. (5) Environmental impact—the aim of which is to mitigate the harmful impact of transport on the environment, e.g., by reducing the emissions of motor vehicles, creating vehicles powered in a different (resignation from petrol and diesel oil), zero-emission way [13].
Gebresselassie and Sanchez indicate that sustainable development in the context of transport focuses on making transport decisions, which also relate to the previously discussed aspects, i.e., society, economy and the natural environment. These decisions provide mobility to members of the community both now and in the long-term use of multimodal transport. Solutions, the use of which also allows for the fulfilment of the demands of sustainable transport, are largely based on tools and applications that cooperate in a technologically advanced manner with the existing infrastructure, thus contributing to the increase in the mobility of drivers, especially in large cities, known as smart cities [14].
Referring to the EU program, “The European Green Deal”, activities aimed at fulfilling the postulates of sustainable development include reducing the emission of transport by 90% by 2050. In addition, the European Commission assumes that the methods to reduce the harmfulness of various modes of transport are primarily: (1) increasing emphasis on multimodality of transport, enabling the selection of less harmful means of transport, (2) increasing the environmental performance of vehicles by using zero-emission cars, (3) using digital solutions enabling real-time traffic management or (4) intelligent applications that allow the use of vehicles in large cities as part of solutions Mobility as a Service [1].
2.2. The Impact of Road Transport on Increased Traffic, Increased Environmental Pollution and Noise Intensity
Road transport, the most frequently chosen means of transport among the inhabitants of large cities, ensures a high level of their mobility [15]. However, it is also the source of many inconveniences, among which, as Jacyna et al. [2] indicated in their publication, we can include excessive traffic, a large percentage of emissions of environmentally harmful substances and noise. The authors pay special attention to the harmful effects of noise, especially from road traffic, on the health and life of over 210 million people in Europe. Reducing the harmful effects of road transport, including the level of noise and pollution, is one of the key trends and demands for sustainable development in the European Union [2,16]. Road transport is indicated by the EU as the only means of transport whose use in recent decades is characterized by an increase in carbon dioxide emissions to the atmosphere [17].
The faster and faster development of cities is the reason for the increase in the number of vehicles traveling on city streets. This problem is a huge barrier to social and economic development, in particular in fully developed countries, where population size determines a much higher intensity of street traffic. In addition to the obvious effects such as a growth in pollution and noise, this phenomenon is also responsible for lowering the quality of life caused by the need to spend extra time in traffic jams and a high accident rate [18]. Moreover, the increasing number of private cars in cities is also the cause of the uncontrolled growth of cities, which contributes to extending the distance covered by passengers, and ultimately to an increase in travel costs. What is more, this phenomenon contributes to the increase in traffic intensity not only in the centers of large urban agglomerations, but also in the suburbs, becoming one of the more serious causes of road congestion also outside the city boundaries [19].
As Murat and Ebru [20] indicate in relation to WHO, noise is the third most harmful kind of pollution in the world, only after air and water pollution. Traffic in the most developed cities in the world is a huge problem for society, generating an increase in air pollution and a growth in noise levels, significantly and drastically affecting the health and life of residents of large urban agglomerations. Moreover, it should be noted here that this impact does not coincide with the assumptions of sustainable development [20].
Passenger cars and trucks are responsible to the greatest extent for the increase in road traffic in large cities. At the same time, this phenomenon increases the noise level that is unbearable for residents and costs resulting from delays caused by traffic jams and excessive fuel consumption. Increased fuel consumption is also responsible for the growth in exhaust emissions, which in the case of passenger cars is 10 times greater than that of vans and about three times greater than that of trucks [2]. The largest amount of environmentally harmful substances is emitted when the car is parked with the engine running, e.g., when parked in a traffic jam, while regular driving, acceleration or deceleration are characterized by lower exhaust emissions [3]. Passenger cars traveling mainly on the streets of very crowded urban agglomerations account for about 60–70% of sources of air pollution, which, with a very dynamic boost in the number of vehicles (about 19 million annually), contributes to an increasing intensity on roads and more frequent traffic jams which are the source of a huge amount of pollution and noise harmful to society. In addition, in the case of high traffic intensity, it is not difficult to find minor road events, which in turn are the cause of subsequent traffic jams, constituting a kind of a loop [21]. In Europe, road transport is responsible for as much as 75% of CO2 emissions, 40% of HC emissions and 48% of NOx emissions to the atmosphere, while in the USA, despite the reduction in CO emissions, the transport sector is most responsible for the amount of emissions into the atmosphere: carbon monoxide (CO), hydrocarbons (HC) and nitrogen oxides (NOx). Research carried out in Brazil has shown that high traffic intensity caused by the very large number of cars driving on the streets of large cities is responsible for around 90% of CO emissions and from 80% to 90% of HC and NOx emissions [4].
In studies by Murat and Ebru, traffic noise levels ranged from 52 to 76 dB (A), while noise levels of 30–65 dB (A) caused discomfort, anger, sleep and attention disorders, and in the range of 65–90 is responsible for increase of blood pressure, the acceleration of the heartbeat and respiration [20]. Montes-González [22] in their considerations drew attention to the fact that road noise generated by excessive road traffic is responsible for the noise intensity at the level of 67 dB (A), which in turn largely translates into a growth in civilization diseases, the causes of which are very often found in busy life in urban agglomerations. These values were also confirmed by Jacyna et al., who indicated the noise level in the city at an average level of 55 dB (A) [2]. As Jakovljevic et al. [23] stated, noise levels in cities may fluctuate in the range of 40–99 dB (A). Research conducted in Iran confirms that noise standards are significantly exceeded in cities, ranging from 70.9 to 80.7 dB (A) [17], which allows us to conclude that in most large cities this level is significantly above the norm, thus contributing to a significant negative impact on the health and life of inhabitants of large urban agglomerations.
The above examples, relating both to the increase in traffic intensity due to the growth in the use of private vehicles and the growing problem of road congestion, also result in a number of consequences for the inhabitants of large cities. In addition to the increase in costs, accidents and time spent moving around the city, the key factors having a negative impact on society have become the growth in the emission of harmful substances and the increase in noise, which are the cause of many civilization diseases. This situation poses challenges to sustainable development, the task of which is to ensure economic, social and environmental development while maintaining the possibility of using these goods for future generations.
2.3. Relationship between Age, Gender, Drivers’ Experience and the Accident Rate
One of the dimensions of sustainable transport, according to [13], is to ensure road safety for drivers who are members of a community. In addition to aspects such as the intensity of road traffic, appropriate road infrastructure or the safety index of currently manufactured vehicles, it is also necessary to indicate the human factor, i.e., the behavior of drivers, their predispositions, age and experience, as an equally important factor affecting road safety. It is estimated that 82% of accidents are caused by drivers, 81% of which are drivers of passenger cars [24].
Literature analysis allowed to identify those human factors that have the greatest impact on increasing the accident rate in road traffic. However, before the authors of this publication refer to the aspects strictly dependent on human behavior, it should be noted that according to Pino, Baldari, Pelosi and Giucastro [25], the largest number of road accidents occur in urban traffic. Moreover, car drivers constitute the largest group of people involved in road incidents. It should be noted that men cause accidents in as many as 76% of cases. These statistics allows us to conclude that gender predisposition plays an important role not only in the context of driving skills, but also in the awareness of risks associated with road traffic, in particular in large urban agglomerations. Yet another factor indicated by the authors is the age of drivers. The largest percentage of drivers causing road incidents are allocated in the age groups 26–35 and 36–45, while the smallest can be recorded under the age of 18 and 56–65. While the accident rate for the average age under 18 may be caused by the lack of a driving license, the age range 56–65 may reflect another aspect affecting road safety, i.e., the experience of drivers [25]. These values are also confirmed by the Annual Accident Report prepared by the European Union. According to the statistics included in it, over 86% of the males are the perpetrators of accidents. The age group constituting the largest percentage of road accidents perpetrators is the age group 25–49, which is nearly 37% [26].
Bener et al. [27] among the human factors affecting the accident rate, they indicate age, gender, experience of drivers, road aggression and distraction, e.g., caused by using a mobile phone while driving. In their publication, they confirm that men constitute a larger group among the perpetrators of road accidents. Rhodes and Pivik [28] in their research confirmed the hypothesis that adolescent males show a much higher tendency to downplay road risk than older females, which may be the reason for a higher accident rate in this group. The level of risk awareness depending on the predisposition of specific social groups may, therefore, be another factor influencing accident rate [28]. Males are also more prone to speeding, which is one of the most common causes of road accidents, while females are slightly more likely to reach for a mobile phone while driving. Females are also much less prone to risky driving style than men [29]. Sabbour and Ibrahim [30] also indicate excessive speed as one of the main causes of road accidents (more than 70% of cases) and non-compliance with road regulations (about 13% of cases). Ozkan and Lajunen [31] in their research referred to the relationship between gender and self-perception as good and safe drivers. Males tend to perceive their driving skills as good, while women rather see themselves as more aware, safe drivers, which confirms the assumption that gender plays a key role in road safety. Studies by Al-Balbissi [32] also indicate that the males are more likely to cause road accidents. Among men, the age group 18–25 shows the greatest incidence of accidents, while in the general study of drivers (females and males), most road incidents are caused by people aged 36–50.
The experience of drivers is also an important factor in road incidents. In their publication, they emphasize that drivers with less than 1 year of experience are responsible for as much as 30% of road incidents. The longer the experience, the lower the age-dependent accident rate [33]. This aspect was also touched upon by Guého, Granié and Apostolidis, who indicated the impact of gender, age, driving experience and the number of kilometers travelled on accidents rate [34]. Research by Rolison et al. [35] included the analysis of police statistics and public opinion in terms of factors affecting the accident rate in the UK. The factors most frequently cited by police officers included speeding, drug use and age. Moreover, the experience of drivers was indicated as a significant factor for both genders in terms of accident rate. In case of the public, the driving experience has a greater impact on the female gender. In both cases, the accident rate decreases as experience increases.
2.4. Car Rental as a Way of Reducing Road Traffic and Its Consequences
The concept of sustainable transport requires, first of all, to provide society with fully accessible, especially in large cities, undisturbed, and also economically acceptable mobility. A large number of vehicles moving around large urban agglomerations is the cause of, among others, the formation of transport congestion, a large amount of exhaust fumes or a high noise level. Due to the fact that private vehicles used by residents of large communities stand idle most of the day, e.g., while working or shopping. The class or dimensions of private vehicles very often exceed the requirements and needs of city residents, whose cars should be small, and be characterized by low fuel consumption. The higher the vehicle class, size and engine capacity, the higher the insurance and operating fees. A solution that allows to increase the mobility of urban communities is the use of vehicles rented for a specified period, also for minutes, as part of the share mobility concept [36,37]. Such solutions allow, among other things, to replace a significant part of private vehicles, the use of which can be covered with rented cars of the class and size that are needed in specific situations (e.g., city travel, highway travel). The use of car or vehicle rentals offered under car sharing will allow not only to reduce the number of vehicles traveling in urban agglomerations, but also contribute to reducing the emissions (by proposing new, ecological friendly vehicles) of used cars, and will also be an economically viable solution for residents of large communities (e.g., no insurance costs). Such action fully corresponds to the postulates of sustainable transport and meets the postulates of sustainable transport [38]. Ensuring the required mobility is related to the adaptation of the appropriate urban infrastructure as well as ensuring the appropriate number of vehicles needed to cover the demand for mobility of residents of large urban communities [8].
The examples of car rental solutions used in large European cities are evidence of the increase in the mobility level of inhabitants of large cities [39]. In a study conducted in Rome in 2012, the growth in the availability of car sharing solutions allowed for a reduction in the number of private vehicles used or a reduction in the occupancy rate of parking spaces and the city area. In addition, cars available in rental companies, usually younger and more environmentally friendly (e.g., hybrid or electric) than private ones, guaranteed the reduction of substances harmful to the atmosphere by nearly 50% [40]. Research in Lisbon showed that the use of car sharing contributed to the reduction of the use of private vehicles among 8% of surveyed citizens. In addition, the use of taxis decreased by 17%, and moreover, 21% of respondents decided to switch from having a private vehicle to another means of transport. Among the people participating in the survey there were also those who declared a change of means of transport (21%) or resignation from having a private vehicle (4%) in the future. Choosing the other transport alternative has also contributed to the reduction of harmful emissions [5]. The research conducted in the Netherlands proved that the provision of car rental solutions led to a reduction in the number of vehicles owned by about 30% and a reduction in the number of kilometers driven by private vehicles by 15–20%. Such results also contributed to the reduction of exhaust emissions. It should be noted, however, that mainly the second and third cars in the household were replaced [6]. Research carried out in Germany proved that the availability of short-term car rental led to a reduction in the use of private vehicles by about 12%, while about 27% of respondents declared that they would not use their own vehicle in the future [7].
2.5. Rental Incentive Schemes as a Way of Reducing the Use of Private Sector Vehicles
A key factor in the success of Mobility on Demand services, which certainly include both carsharing and car rental, is the maximum use of vehicles available to drivers of large urban agglomerations. Short-term rental will be able to realistically reduce the number of private vehicles in the city only if the resignation from owned car will not mean a loss of mobility for residents of large cities. A sufficient number of vehicles and attractive economic conditions of such solutions are factors that will certainly largely affect the loyalty of shared economy customers. Customer loyalty, considered in the context of loyalty programs as well as incentive programs aimed at intensifying the use of rented vehicles in order to replace the use of private sector cars, seems to be an important factor here. Loyalty programs are designed to encourage customers to use the organization’s products or services as well as maintain sales relationships with loyal customers by, for example, collecting points and redeeming them for rewards, promotional price reductions or offering additional services to a limited group of customers [9]. Hofman-Kohlmeyer [10] in her publication indicates that customer loyalty is created as a result of establishing a longer relationship between sellers of products or services and their recipients. Loyalty programs have been in existence for over 30 years and are based on the statement that the customers of the organization are divided into groups that cannot be treated in the same way. Initially, loyalty programs were used only in case of airlines, later they were extended to such industries as hotel industry, restaurants, car rental or financial services [41]. Some audiences are more prone to marketing activities and have a higher tendency to subscribe to loyalty programs for additional benefits. The publication also covers the conditions for the functioning of loyalty programs, which include a positive attitude to the program of both parties, satisfaction for both program suppliers and recipients, a high level of trust and commitment of participants and suppliers [10].
The types of loyalty programs include: (1) Members receive additional discount for registration, (2) Members receive one free when they purchase n units, (3) Members receive rebates or points based on cumulative purchases, (4) Members receive targeted offers and mailings [42].
Loyalty programs bring not only benefits for customers in the form of advantages or savings opportunities, but also for the organization in the form of short-term effects (e.g., re-purchase of a product or service) or long-term (e.g., increased customer loyalty and multiple purchases of products or services offered by the company). Both short-term and long-term effects of using loyalty programs translate into an improvement in the company’s marketing image or an increase in sales and profits [43]. The most common benefits of implementing loyalty programs for their providers include: (1) increase in the company’s reputation by 73%, (2) increase in profits by 77%, (3) increase in turnover by 100% and (4) increase in the re-purchase rate by 95% [10].
Research carried out in Milan has shown that the use of an incentive system, e.g., in the form of selecting preferred vehicles (more attractive in terms of price, in order to relocate them to areas of the city with more driver interest) resulted in an increase in the rate of renting vehicles from much less frequented zones, away from the city center. The growth in vehicle rentals was also due to the offering of bonus minutes to drivers, which also allowed the reduction of the rental cost. Incentives in the form of a reduced rental rate or bonus minutes contributed to a better distribution of vehicles in the city and thus to an increased degree of mobility of its inhabitants. It should also be noted here that the incentive system proposed in the article contributed to an increase in the rental rate by 8% [44]. Gavalas, Konstantopoulos and Pantziou [45] in their publication also consider the relationship between the incentive system and the growth in the use of car rental vehicles. They indicate a positive impact on the increase in the number of rentals as well as the possibility of better distribution of vehicles in the network as a result of the incentive system. In addition, they prove that the incentive system used in case of car rental is an indispensable element of the Mobility on Demand philosophy and is one of the factors in its development.
Mobility on Demand can significantly contribute to reducing the use of private vehicles, decreasing the need for parking spaces or minimizing the likelihood of road congestion. However, this action requires providing drivers with an economically attractive and organizational alternative that does not affect their level of mobility [8]. Vehicles usually offered by car rentals or carsharing are new vehicles, the age of which does not exceed 3 years, and a significant part of them are hybrid or electric vehicles, which also translates into a growth in the environmental performance of the transport sector in large cities [46].
In the opinion of the authors of this publication, building a loyalty system, a system of incentives for people using car rentals, requires an effective back-up facility in terms of the number of vehicles and a gratification for program members. This can further translate into intensified rental vehicle use under Mobility on Demand as a result of resigning from the use of private vehicles. Only an economically attractive program of incentives can make it possible. This can exert influence upon the behavior of drivers and shape their preferences also in relation to the change of driving style to a more economic or ecological one. Reducing the number of private vehicles will contribute to reducing the amount of harmful substances emitted into the atmosphere or the level of noise observed especially in large urban agglomerations.
2.6. Literature Gap and Research Problem
Literature analysis was carried out on the basis of publications in the Web of Science and Scopus databases related to the research area of this article. The papers related to the subject of increasing mobility, reducing the number of vehicles and CO2 emissions as a result of using shared mobility, incentive systems, car rental and car sharing, as well as eco-driving were analyzed. The list of analyzed articles in terms of research areas is presented in Table 1.
Table 1 shows that some articles address the issue of the impact of car rental or car sharing only in terms of increasing the mobility of residents of large cities [8,36] or the relationship between the use of short-term car rentals and the reduction in the number of private sector vehicles used, contributing to the reduction of the emissions of car transport in large cities [5,6,39,40,46].
Moreover, among the publications listed in Table 1, four papers refer only to the issues of incentive systems as well as their impact on customer loyalty and changes in their behavior and habits. [9,10,41,43]. The authors of publication [44] refer to the identification of factors under the incentive program, which will ensure an increase in the number of rentals in areas far away from the city center, improving the efficiency of short-term cars distribution system. Similar results were achieved by the authors of publication [45], examining the impact of the incentive system on increasing the intensity of vehicle rentals from areas with much lower interest and their returns in the indicated zone, near the city center. Both papers, therefore, refer to research aimed at identifying those factors that may contribute to an increase in the number of car rentals outside the city center and the improvement of vehicle distribution systems.
G. Santos [7] analyzes the system of incentives increasing the number of car rentals, which in turn will contribute to reducing the number of private sector vehicles and CO2 emissions. The incentive system therefore generally concerns the increase in the use of shared mobility solutions in large cities.
Y. Wang and A. Boggio-Marzet [37] in their publication indicate the effectiveness of using the principles of eco-driving and the selection of an appropriate route in terms of reducing CO2 emissions by vehicles operating in large urban agglomerations. For the research the authors used two car sharing vehicles equipped with GPS sensors.
In one of their previous publications [38], the authors referred to such aspects as the impact of car rental on the increase in the mobility of urban residents, reducing the number of private sector vehicles, reducing carbon dioxide emissions and increasing the eco-friendliness of car renters.
Summarizing the analysis presented in Table 1, it should be noted that none of the above publications refers to the study of the effectiveness of the impact of the incentive system under car rental on increasing the environmental performance of short-term car renters. According to the authors, this area constitutes a research gap that should be analyzed in this article.
On the basis of the identified research gap, the authors also formulated a research problem that will be considered in the following chapters. The research problem relates to the aim of the study, which is to recognize the attitude of car renters to material, non-material and social incentives to improve their eco-driving skills. According to the authors, the significant impact of car sharing and car rental on increasing the mobility of residents of large cities, reducing the number of private sector vehicles and reducing carbon dioxide emissions is a research area that meets the requirements of sustainable development. However, due to a lack of availability of publications, this area should be extended to the identification of factors inducing drivers to change their habits and driving style, guaranteeing an increase in the environmental performance of short-term vehicle rental solutions, and thus, meeting the requirements of sustainable development to a much greater extent.
3. Research Study
3.1. Research Methodology
The aim of the research was to identify factors that could encourage customers, who rent cars, to improve their driving habits (increase safety, reduce fuel consumption and reduce CO2 emissions).
The research was conducted from March to October 2020 among people renting passenger cars in Poland. The study was conducted using a paper and electronic questionnaire. The car renter completed the questionnaire before starting the car rental.
When calculating the size of the research sample, a number of assumptions were made. It was estimated that annually 650,000 customers use car rental in Poland (data for 2019). In 2020, in which the study was conducted, the number of rentals is lower due to the restrictions and economic slowdown caused by the COVID-19 pandemic. However, the number of rentals was not possible to estimate at this point in time (the year is not over yet). One can only estimate the decrease in the number of customers by about 15%. When calculating the size of the research sample, a significance level of 95% and an error of 5% were assumed. With these assumptions, the size of the research sample should be 384 people. The study collected a total of 323 correctly completed questionnaires, which, assuming the correction resulting from a lower number of rentals, may constitute a representative sample for the customer population of car rental companies. Table 2 presents the characteristics of the tested sample.
The survey also contained a question concerning the respondent’s nationality. Nevertheless, due to the fact that only 6 (out of 323) responses given by people from outside Poland, it was decided not to select this factor as important for the research.
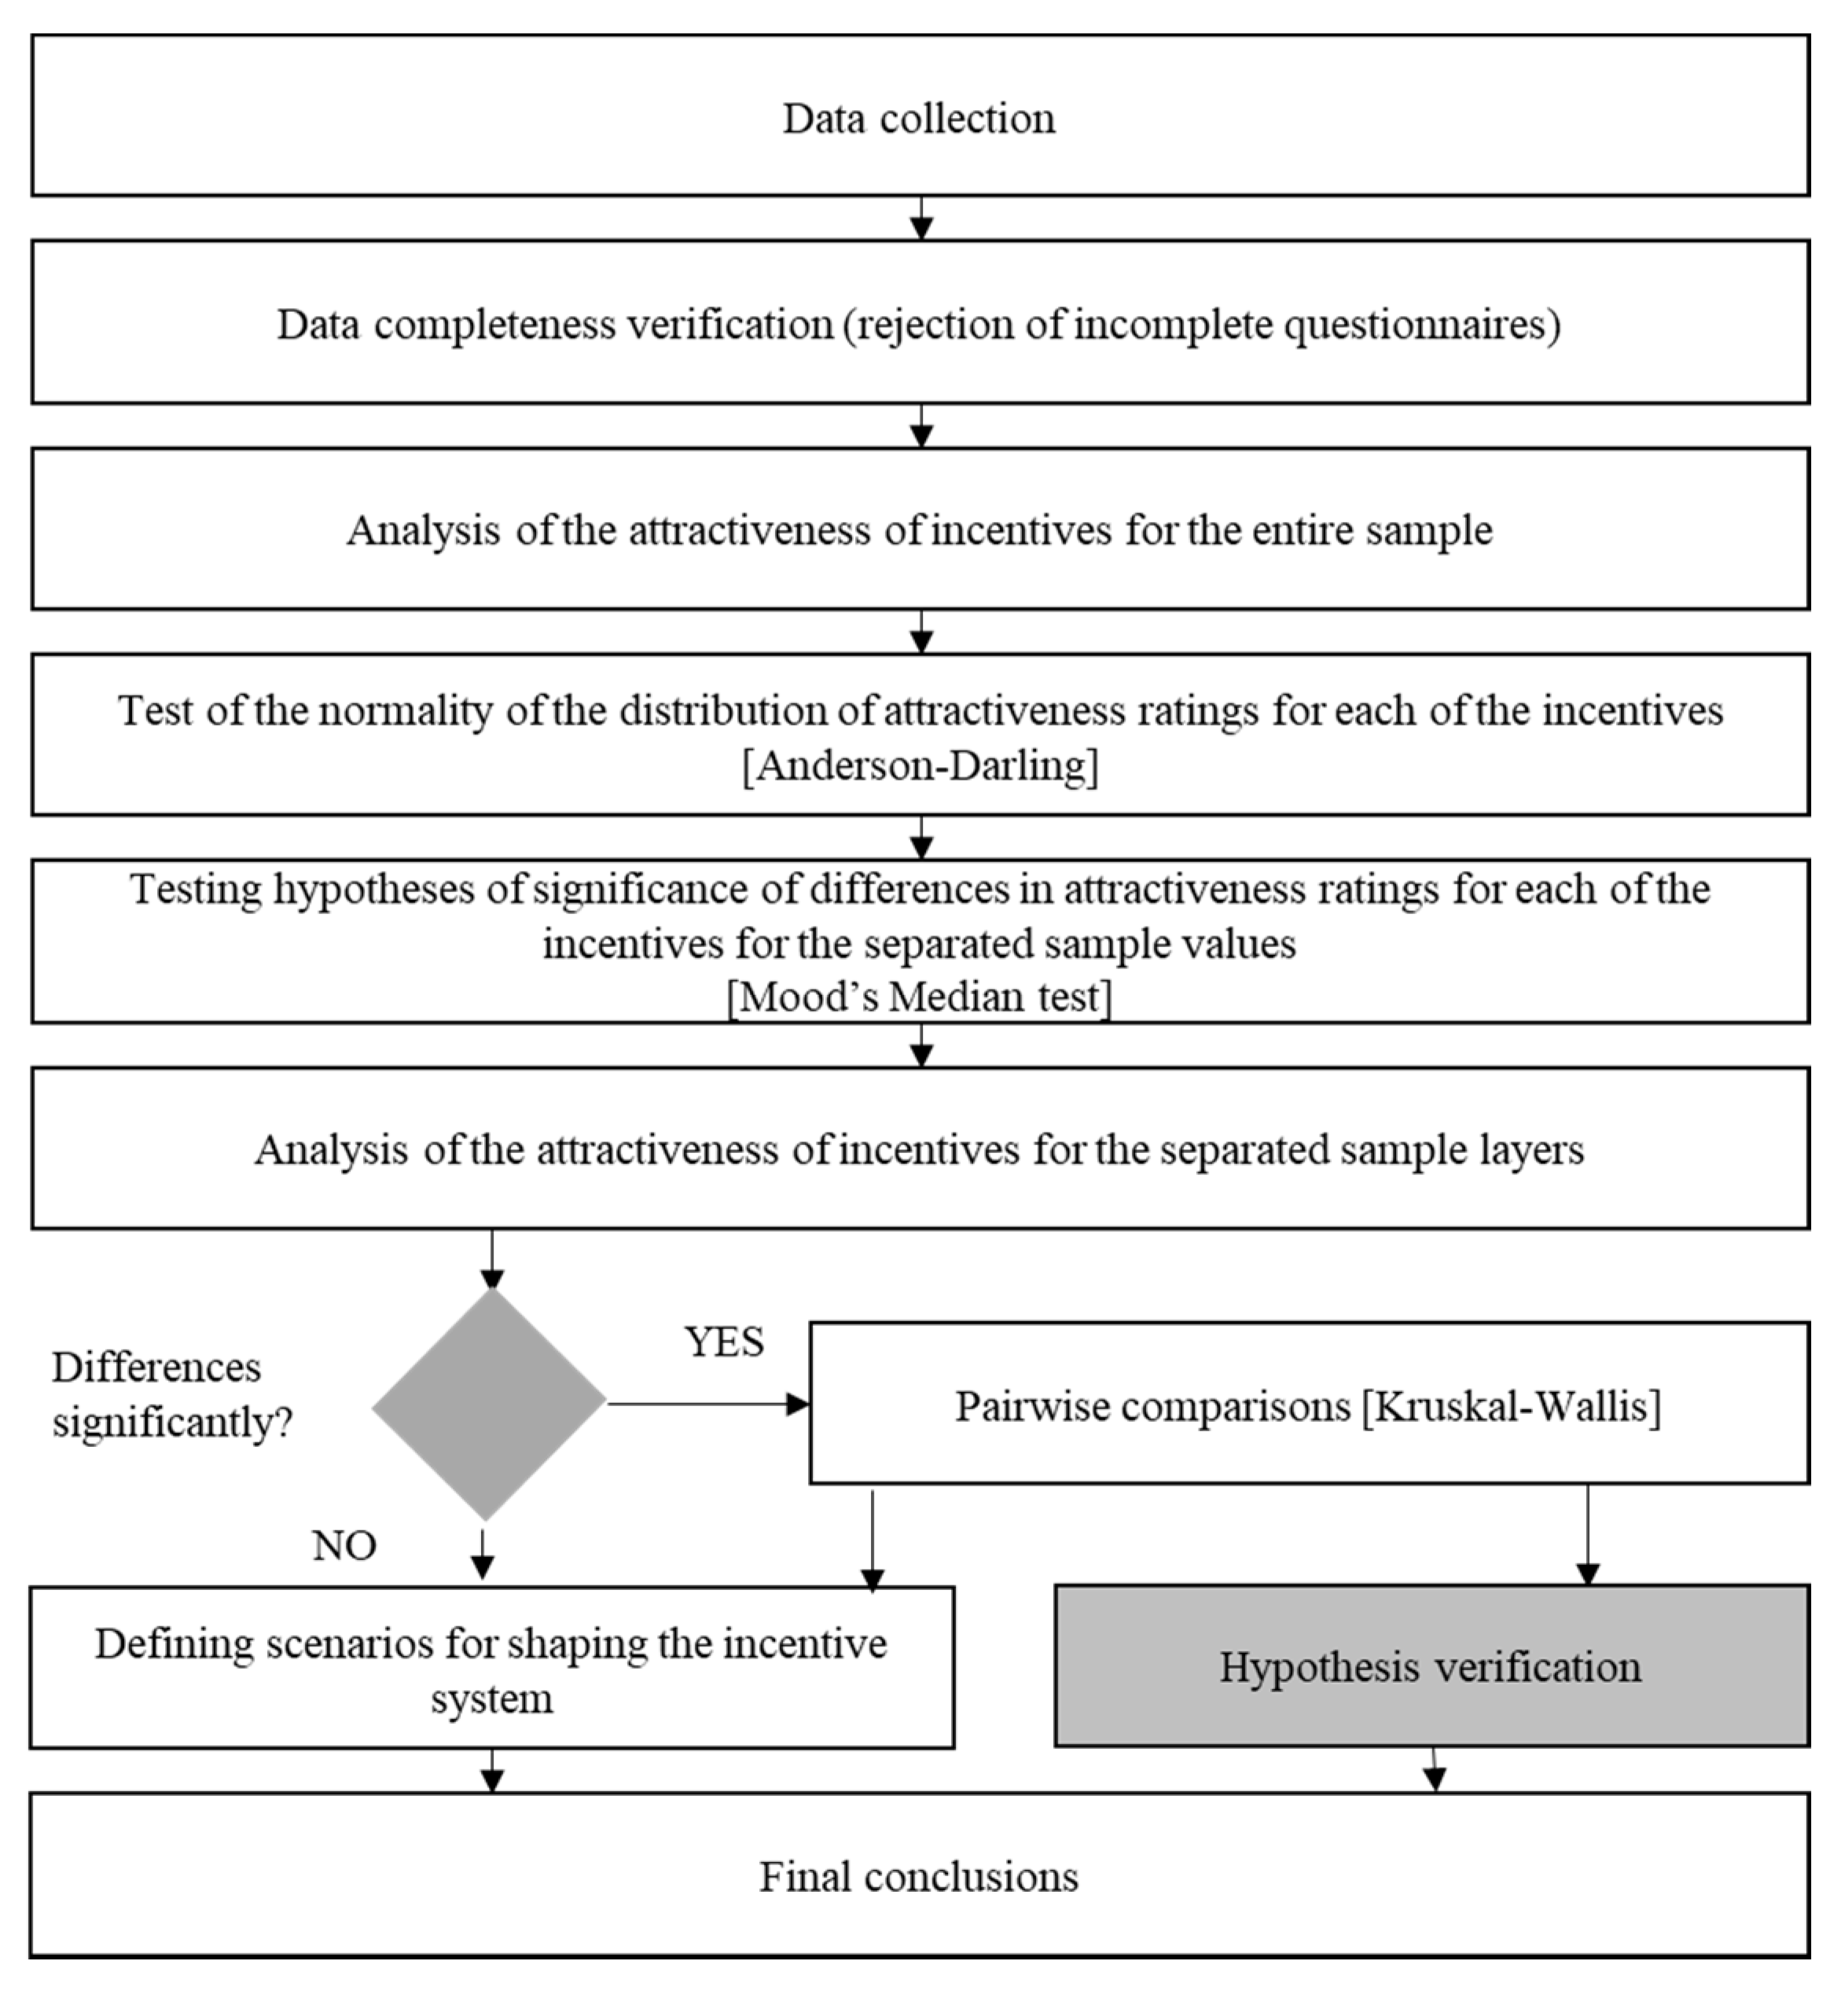
The methodology of the conducted research is presented in Figure 1.
In the analysis of the results, apart from the data visualization methods, there were also used such methods as:
- Anderson–Darling—in order to check the normality of the distribution of assessments of attractiveness of individual incentives,
- Mood’s Median test—to check the statistical significance of differences in the assessment of the attractiveness of an incentive by people with different characteristics,
- Kruskal Wallis multiple pairwise comparisons—in order to check and compare the statistical significance in pairs of differences in the assessment of attractiveness of an incentive by people with different characteristics.
A detailed description of the study results is presented in Section 3.2 Results analysis.
3.2. Results Analysis
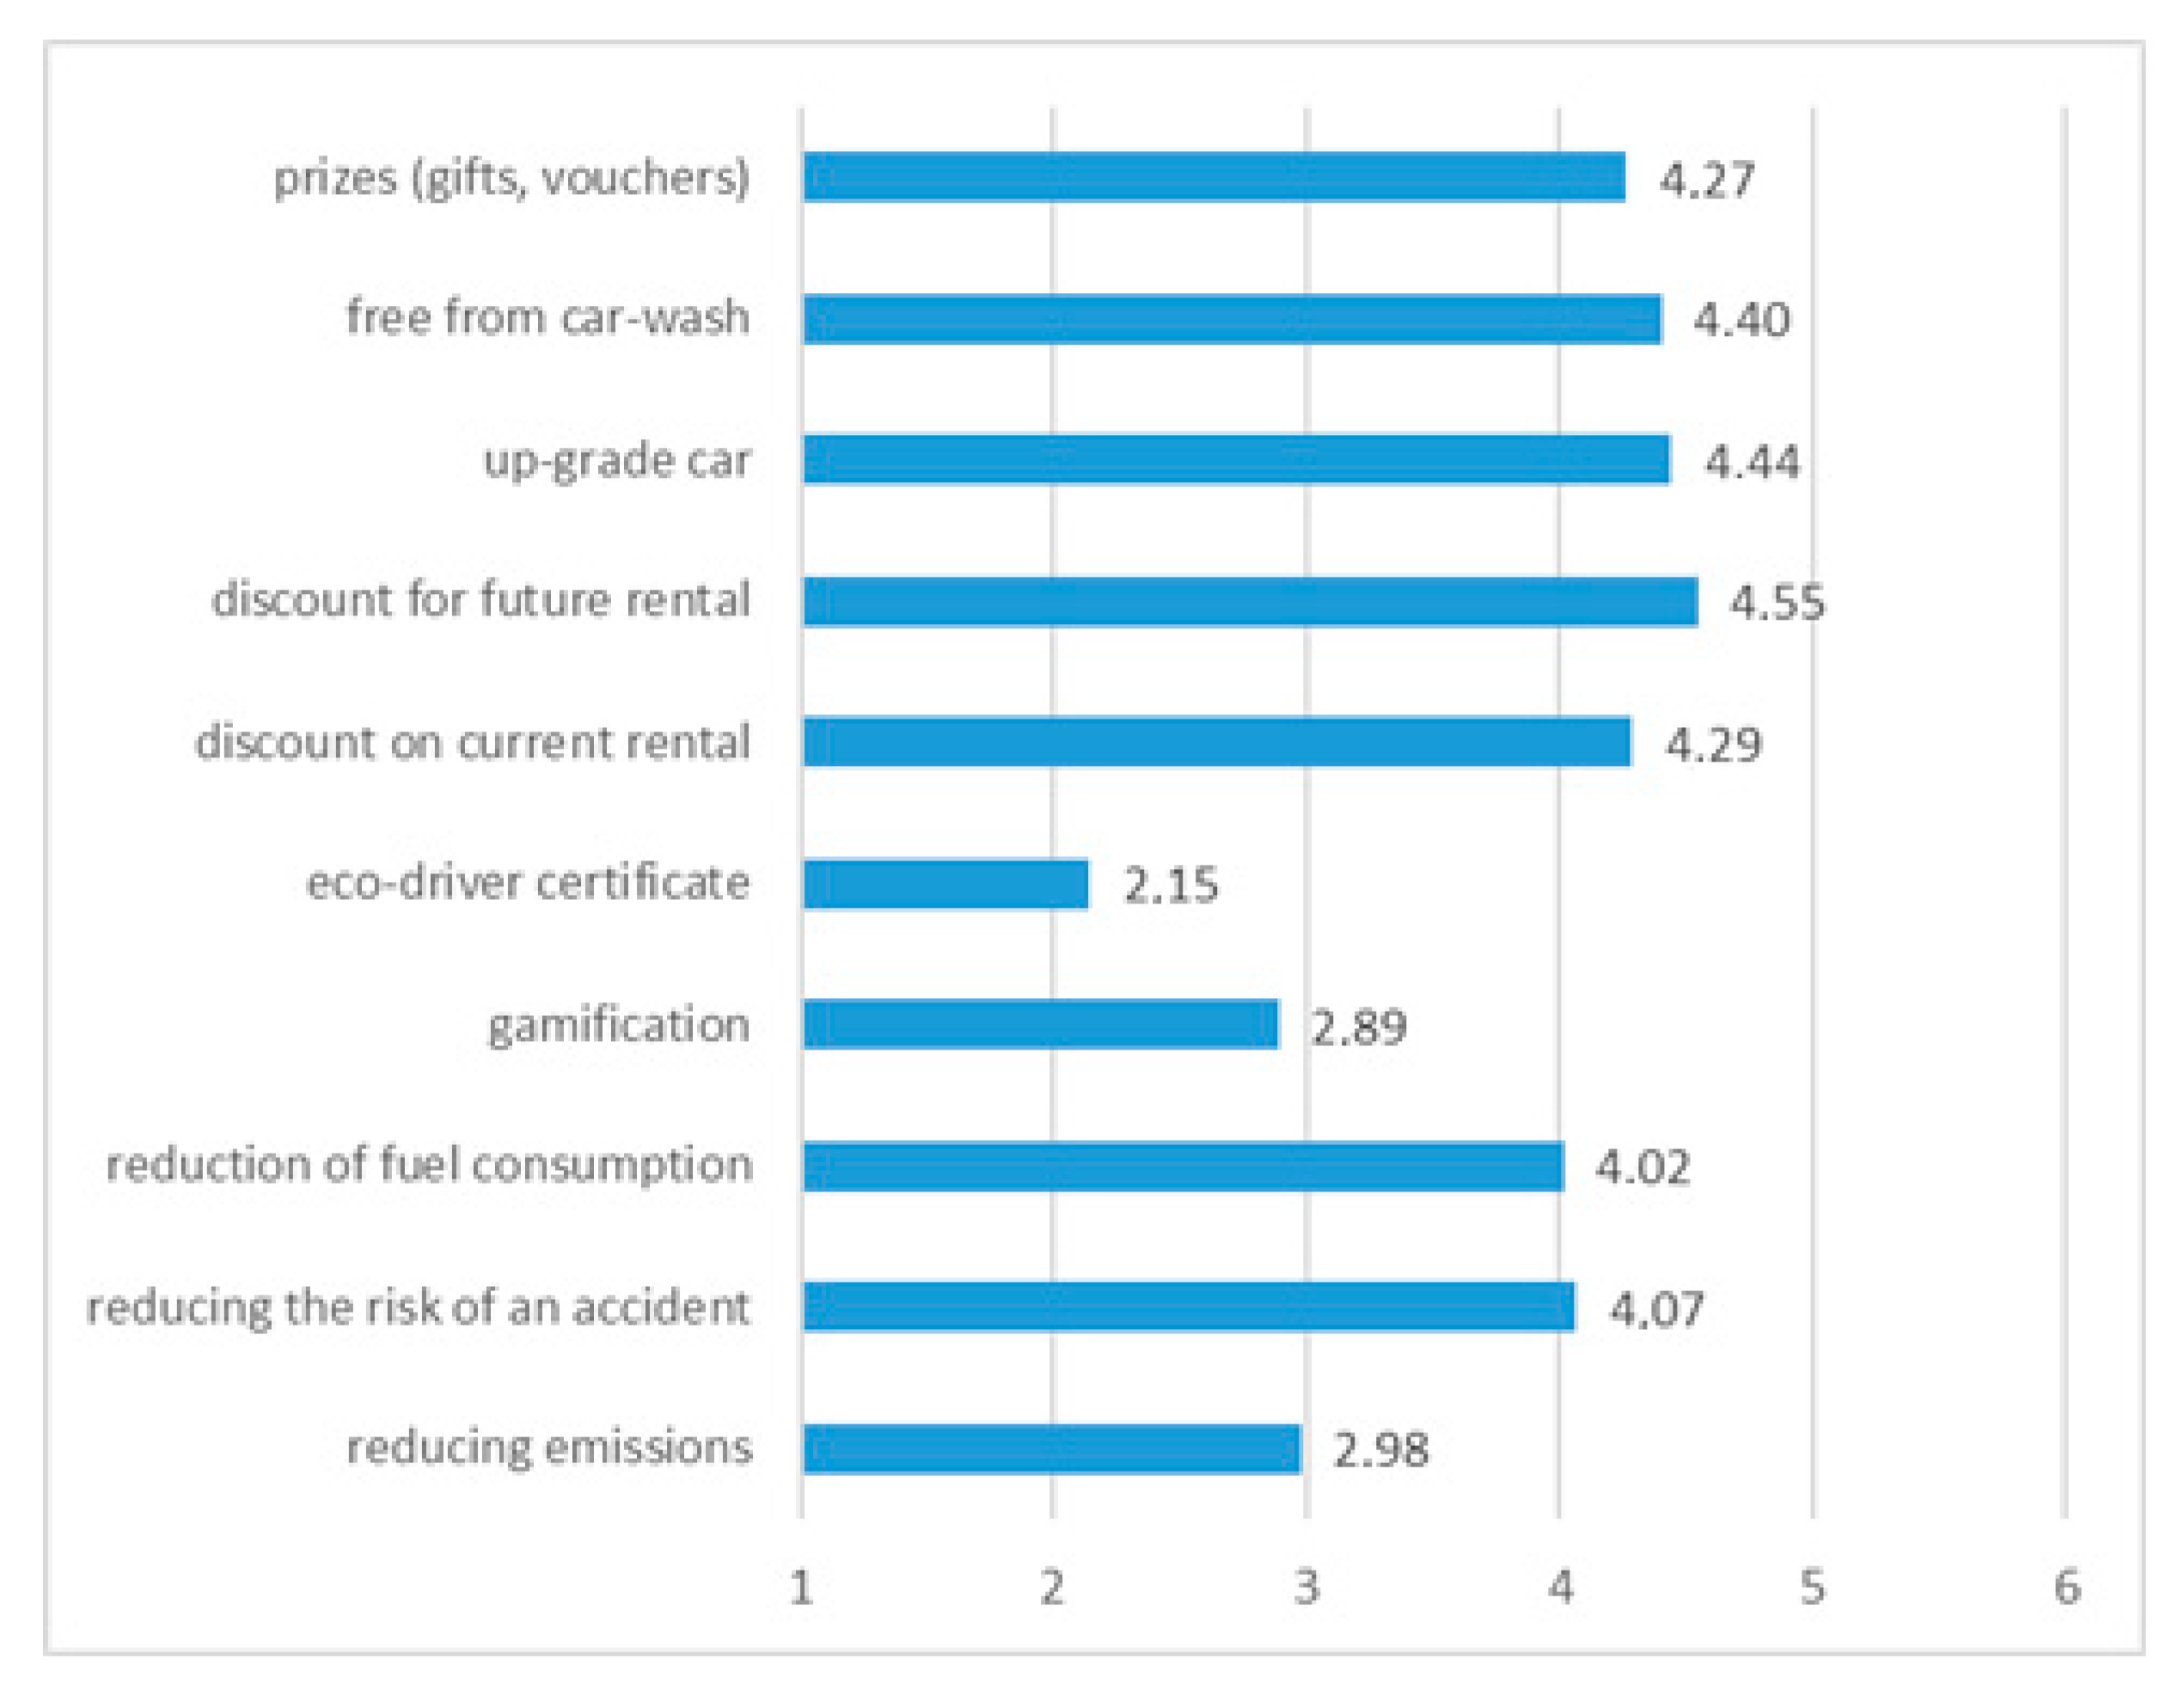
According to the developed methodology, the analysis of the results was started by checking the average value of the attractiveness ratings of the analyzed incentives).
As shown in Figure 2, as many as 7 out of 10 tested incentives achieved a result above 4.0. The eco-driving certificate, gamification and reducing emissions, i.e., those related to the competition with other drivers and the impact on the environment, were considered much less attractive (<3). Motivators with high scores have a much greater direct impact on people participating in the program—they generate material profit (discount for current or future rental, reduction of fuel consumption, prizes), save time and money (free from car wash), and give savings and greater comfort as well as safety (upgrade car, reducing the risk of an accident).
To enable a more detailed analysis of the results, it was necessary to check the distribution of ratings for the attractiveness of individual incentives. This analysis allowed for the selection of a hypothesis testing method. The normality test was performed using the Anderson–Darling method with the assumption of significance level α = 0.05. Several statistical hypotheses were made for each set of assessments (each of the incentives):
Hypothesis 0 (H0).
The data follow a normal distribution.
Hypothesis 1 (H1).
The data do not follow a normal distribution.
The results of the normality test are presented in Table 3.
The p-Value for each pair of statistical hypotheses was lower than the assumed significance level, which meant that the null hypothesis of the normal distribution should be rejected in favor of the alternative hypothesis. Thus, the distribution of grades was not a normal distribution and it was necessary to use nonparametric tests in further analyzes.
In order to check whether the evaluation of the attractiveness of an incentive depends on the respondent’s characteristics, understood as his position in the layer distinguished under each factor, the hypothesis was tested using the Mood’s Median method, assuming significance level α = 0.05. For each of the incentives and each of the factors, several statistical hypotheses were put forward:
Hypothesis 0 (H0).
The population medians are all equal.
Hypothesis 1 (H1).
The population medians are not all equal.
The results of the hypothesis tests are presented in Table 4.
In accordance with the research methodology, in the next stage, the evaluation of the attractiveness of individual incentives was analyzed, taking into account the layers of the tested sample. Paying attention to the results of the tests of significance of differences presented in Table 4, when the differences between the layers were statistically significant, Kruskal–Wallis pairwise comparisons were also performed to check the significance of differences between the assessments determined by people from different layers of the sample.
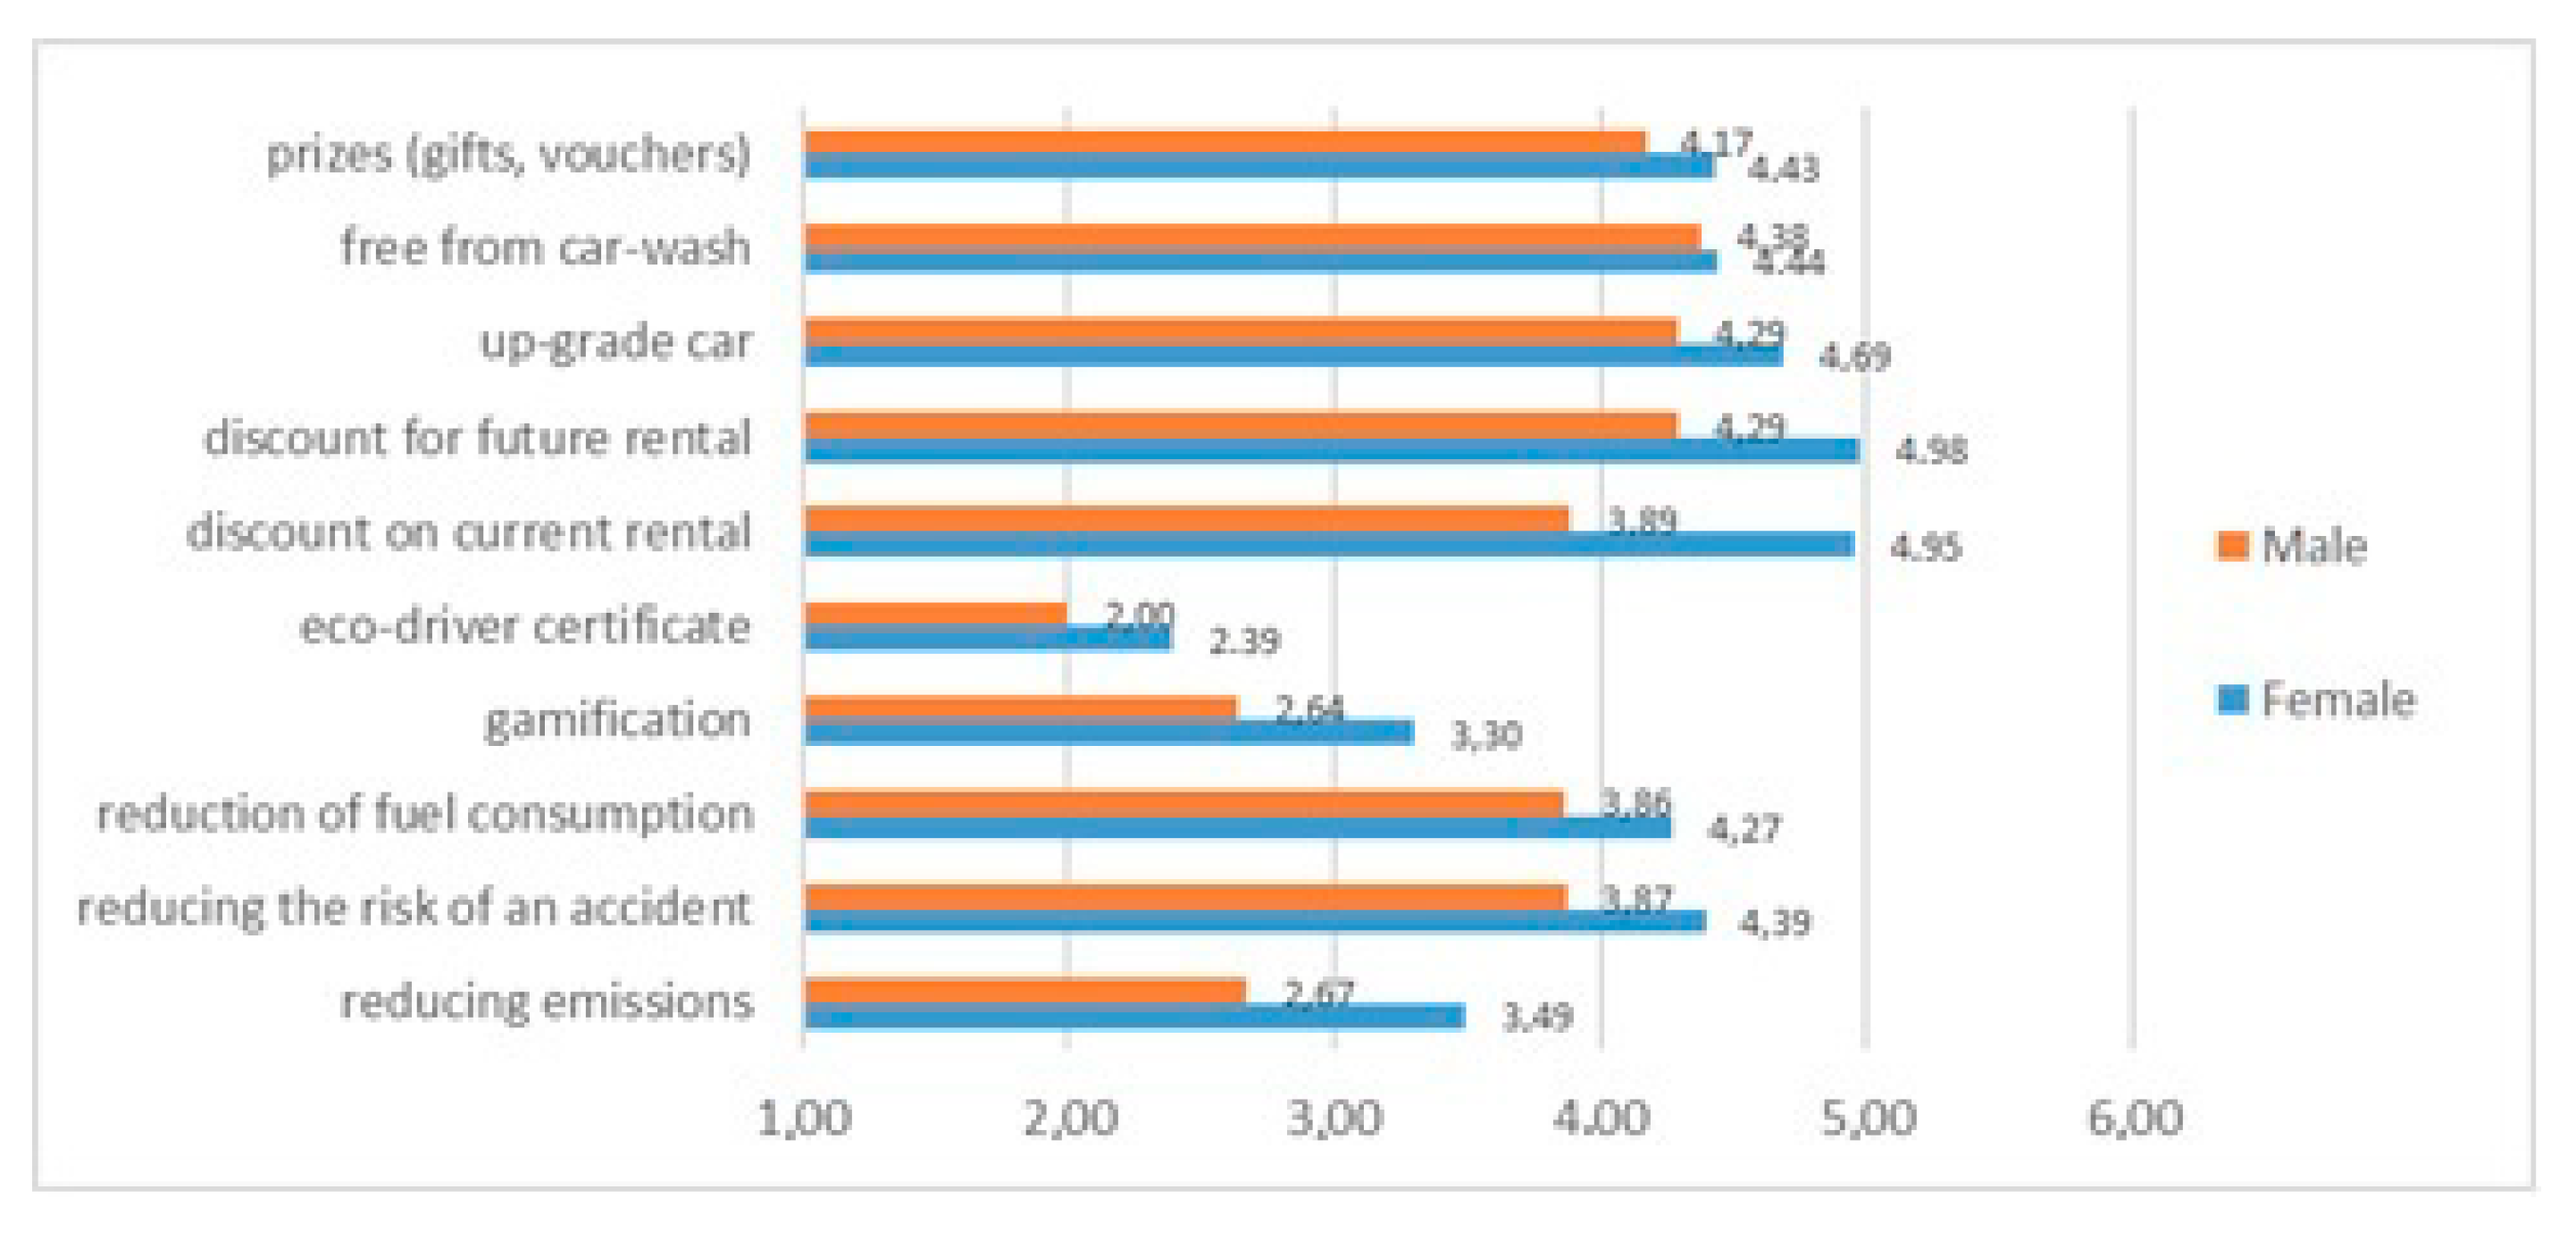
Gender is of great importance in assessing the attractiveness of incentives. Figure 3 shows that each of the proposed incentives was rated higher by women. However, not all of these differences are statistically significant. The Mood’s Median test presented in Table 4 shows that gender differentiates the respondents in the assessment of reducing emission, gamification eco-driver certificate, i.e., those with the lowest scores by all respondents, but also higher ratings for both price reductions (future and current) seemed to be more important for women.
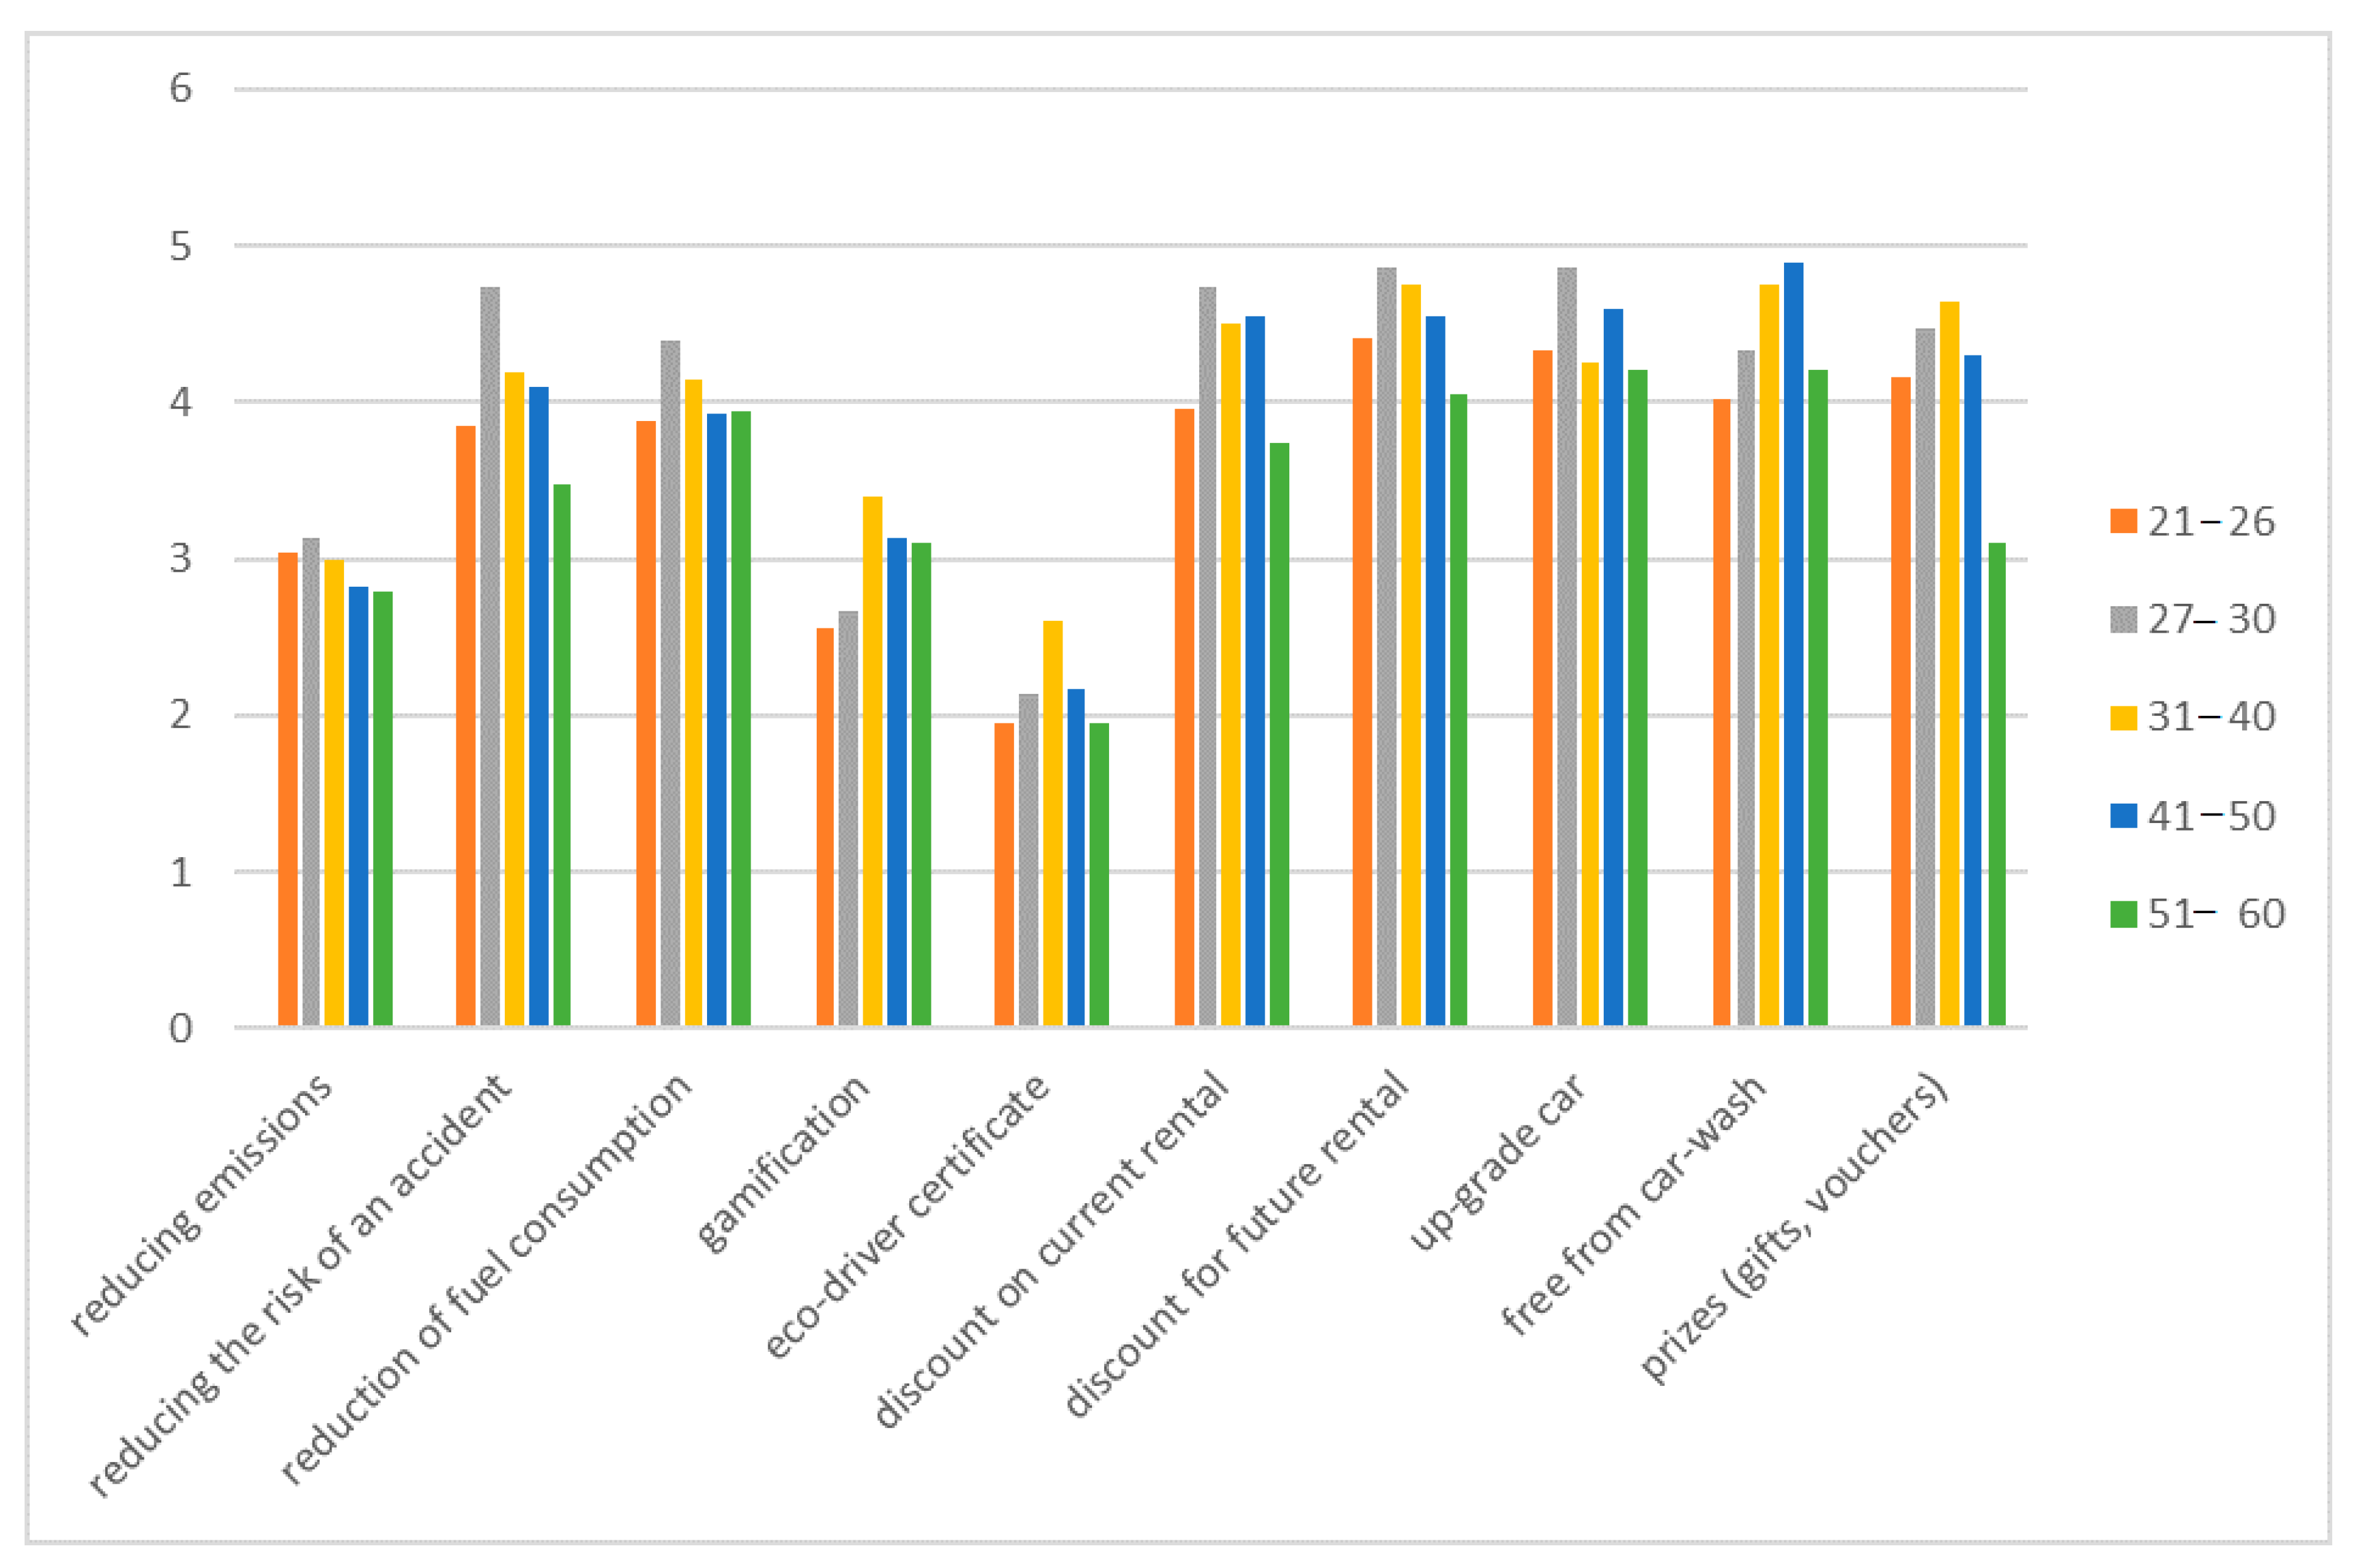
The age of the respondents statistically significantly differentiates the respondents in the assessment of gamification, eco-driver certificate, discount on current rental, discount for future rental, free from car-wash and prizes, as shown in Table 4. The differences are not statistically significant for the remaining incentives. Figure 4 also shows that most of the proposed incentives (6 out of 10) were rated the highest by respondents aged 27–30. What is interesting, this group is the second least numerous in the studied population. Young drivers (21–26), constituting almost 40% of the studied group, rated the highest discounts, prizes and upgrade car. It is also worth analyzing the preferences of older customers, who are valued for their low accident rate, which is important for the company’s costs. Drivers aged 31–40 prefer prizes, discounts (future discount more than current), but this group also appreciates the convenience of free from car-wash, which was rated as the most attractive incentive by drivers from groups 41–50 and 51–60. The study of the statistical significance of differences between individual age groups showed that most often a significantly different opinion was presented by customers in the 51–60 age group. The differences in the perception of the attractiveness of individual incentives are the highest between the extreme age groups 21–26 and 51–60.
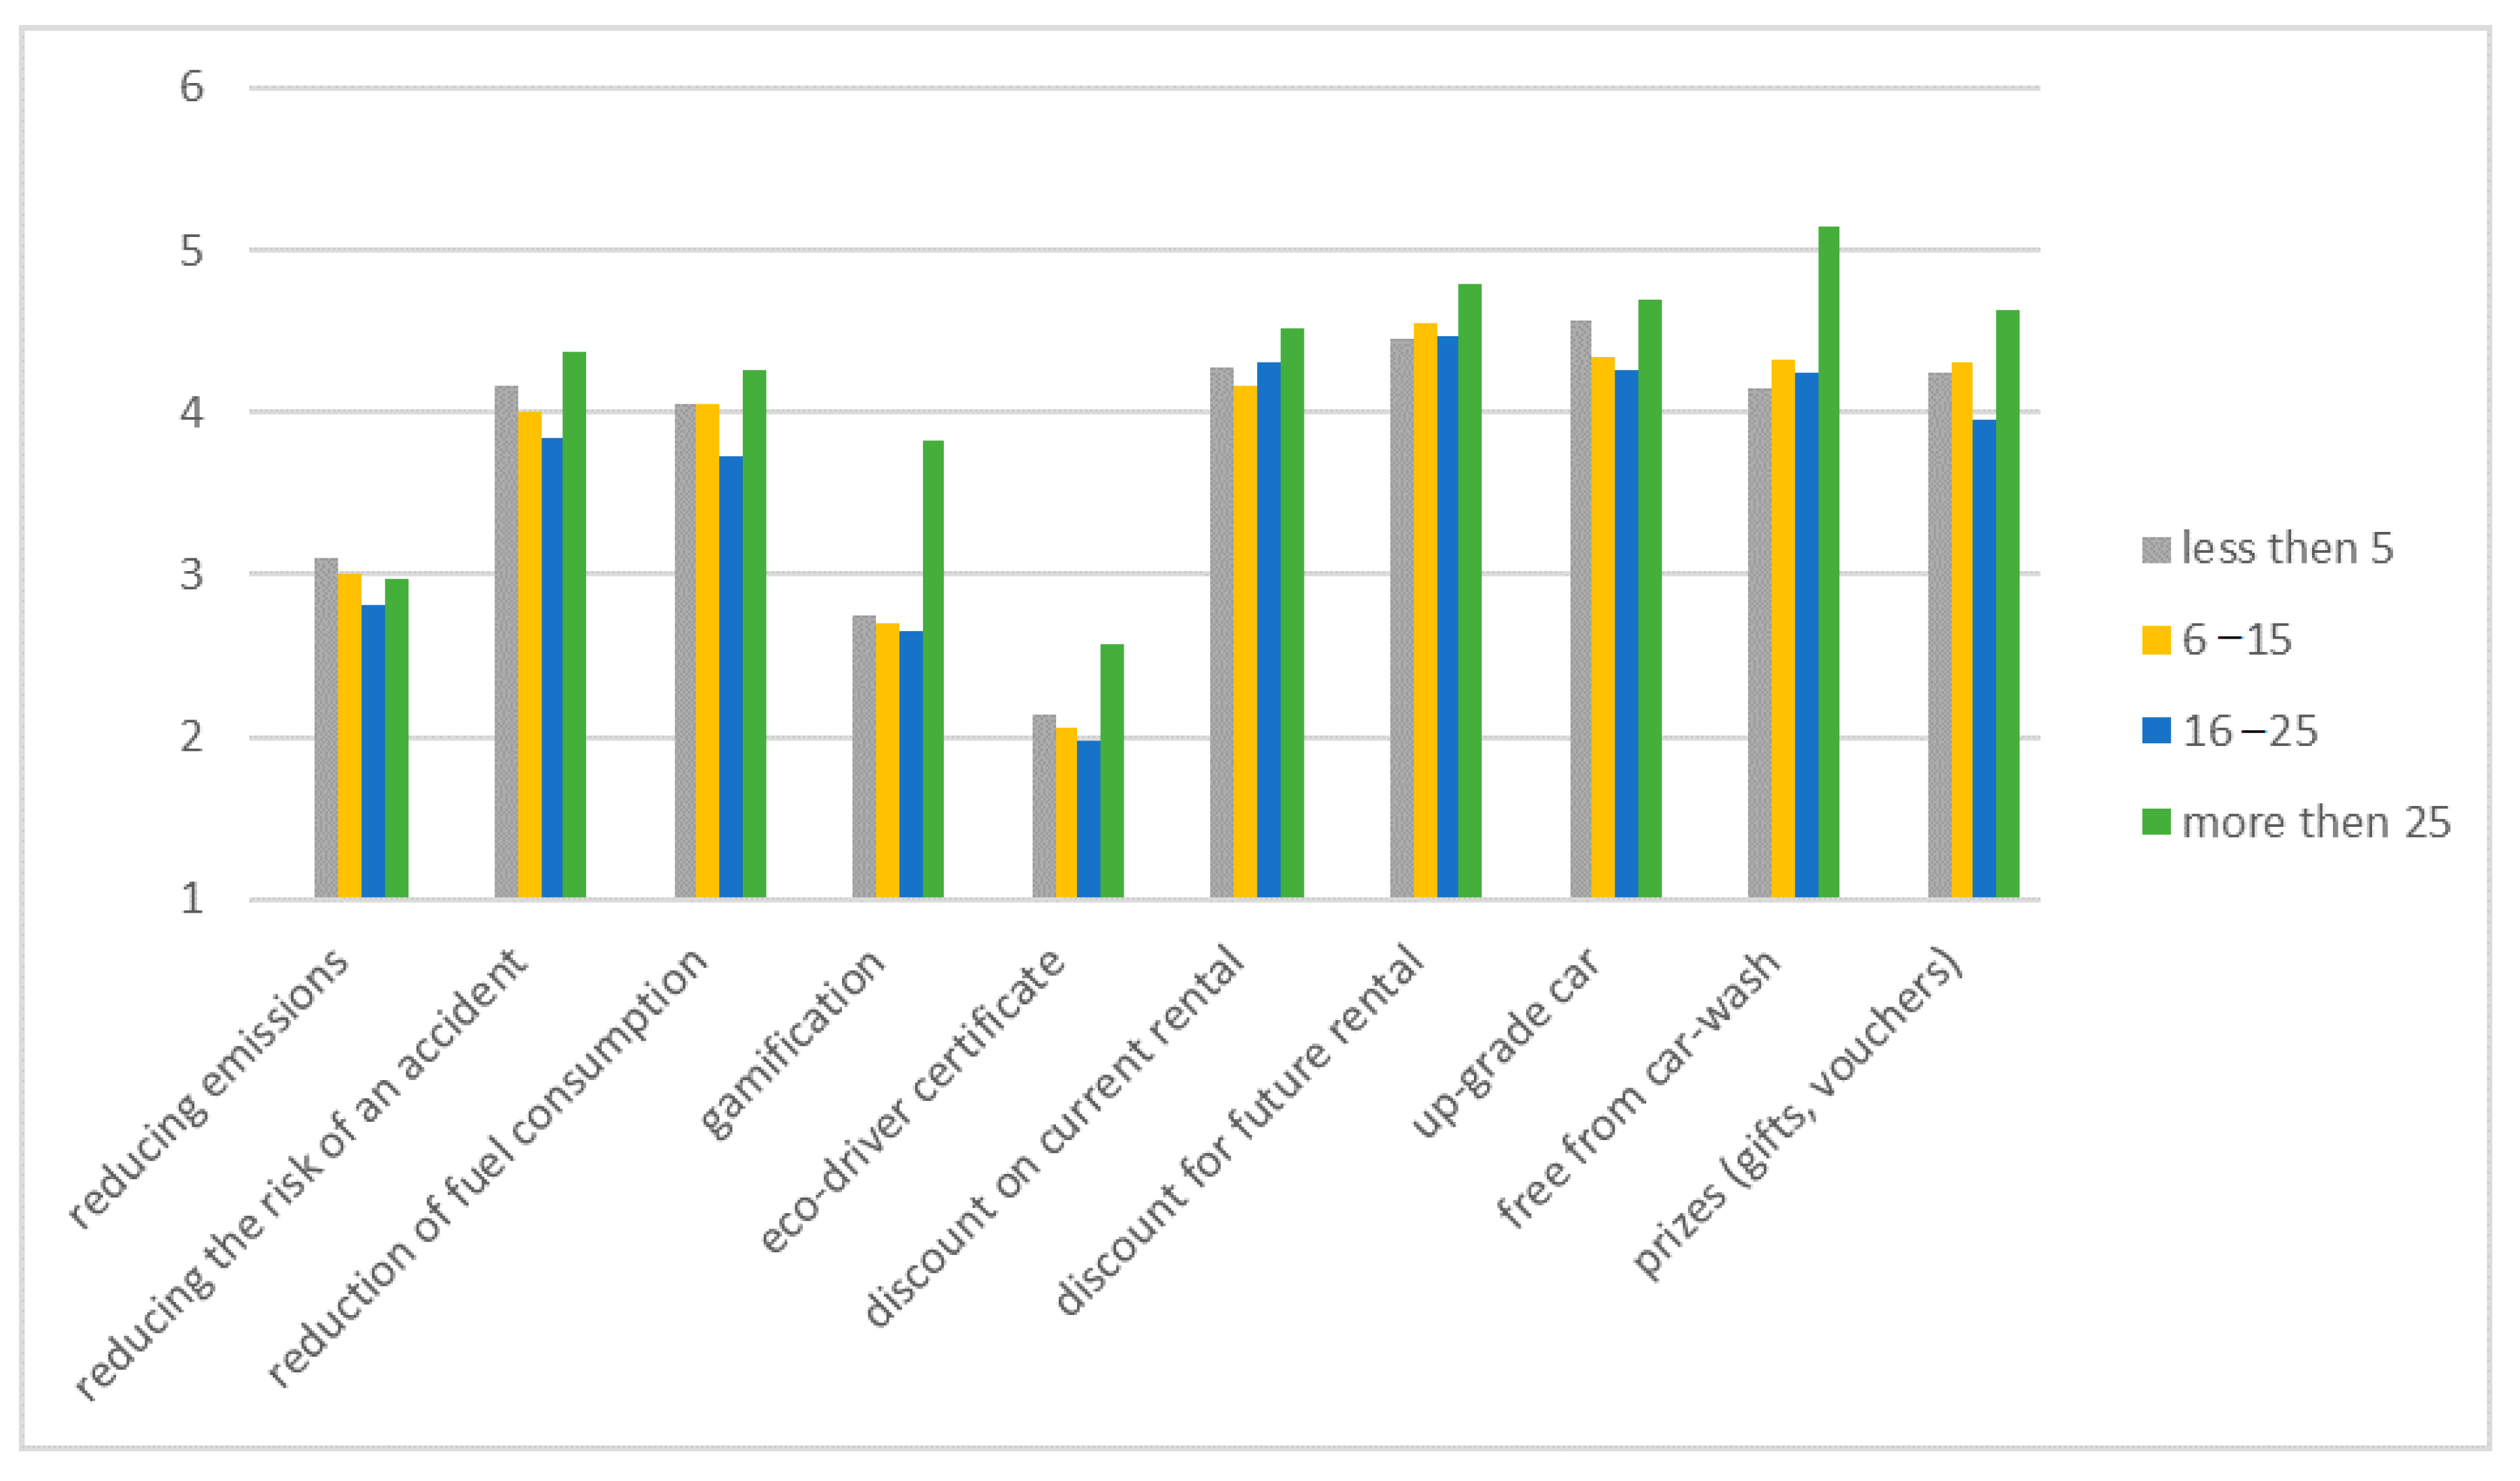
Only in case of gamification and free-from car-wash, the significance of difference test presented in Table 4 showed statistically significant differences. The group that differs from the rest are drivers with the longest experience, i.e., more than 25 years. However, Figure 5 shows that this group rates almost all incentives slightly higher than the rest of the surveyed drivers. The exception is reducing emission, which is the least important for the group with the longest experience. Long service life is associated with older age, so these data are consistent with those presented in Figure 4, where reducing emission turned out to be the least attractive incentive for the oldest group of respondents. Perhaps this is due to the lower ecological awareness of the older generation of drivers.
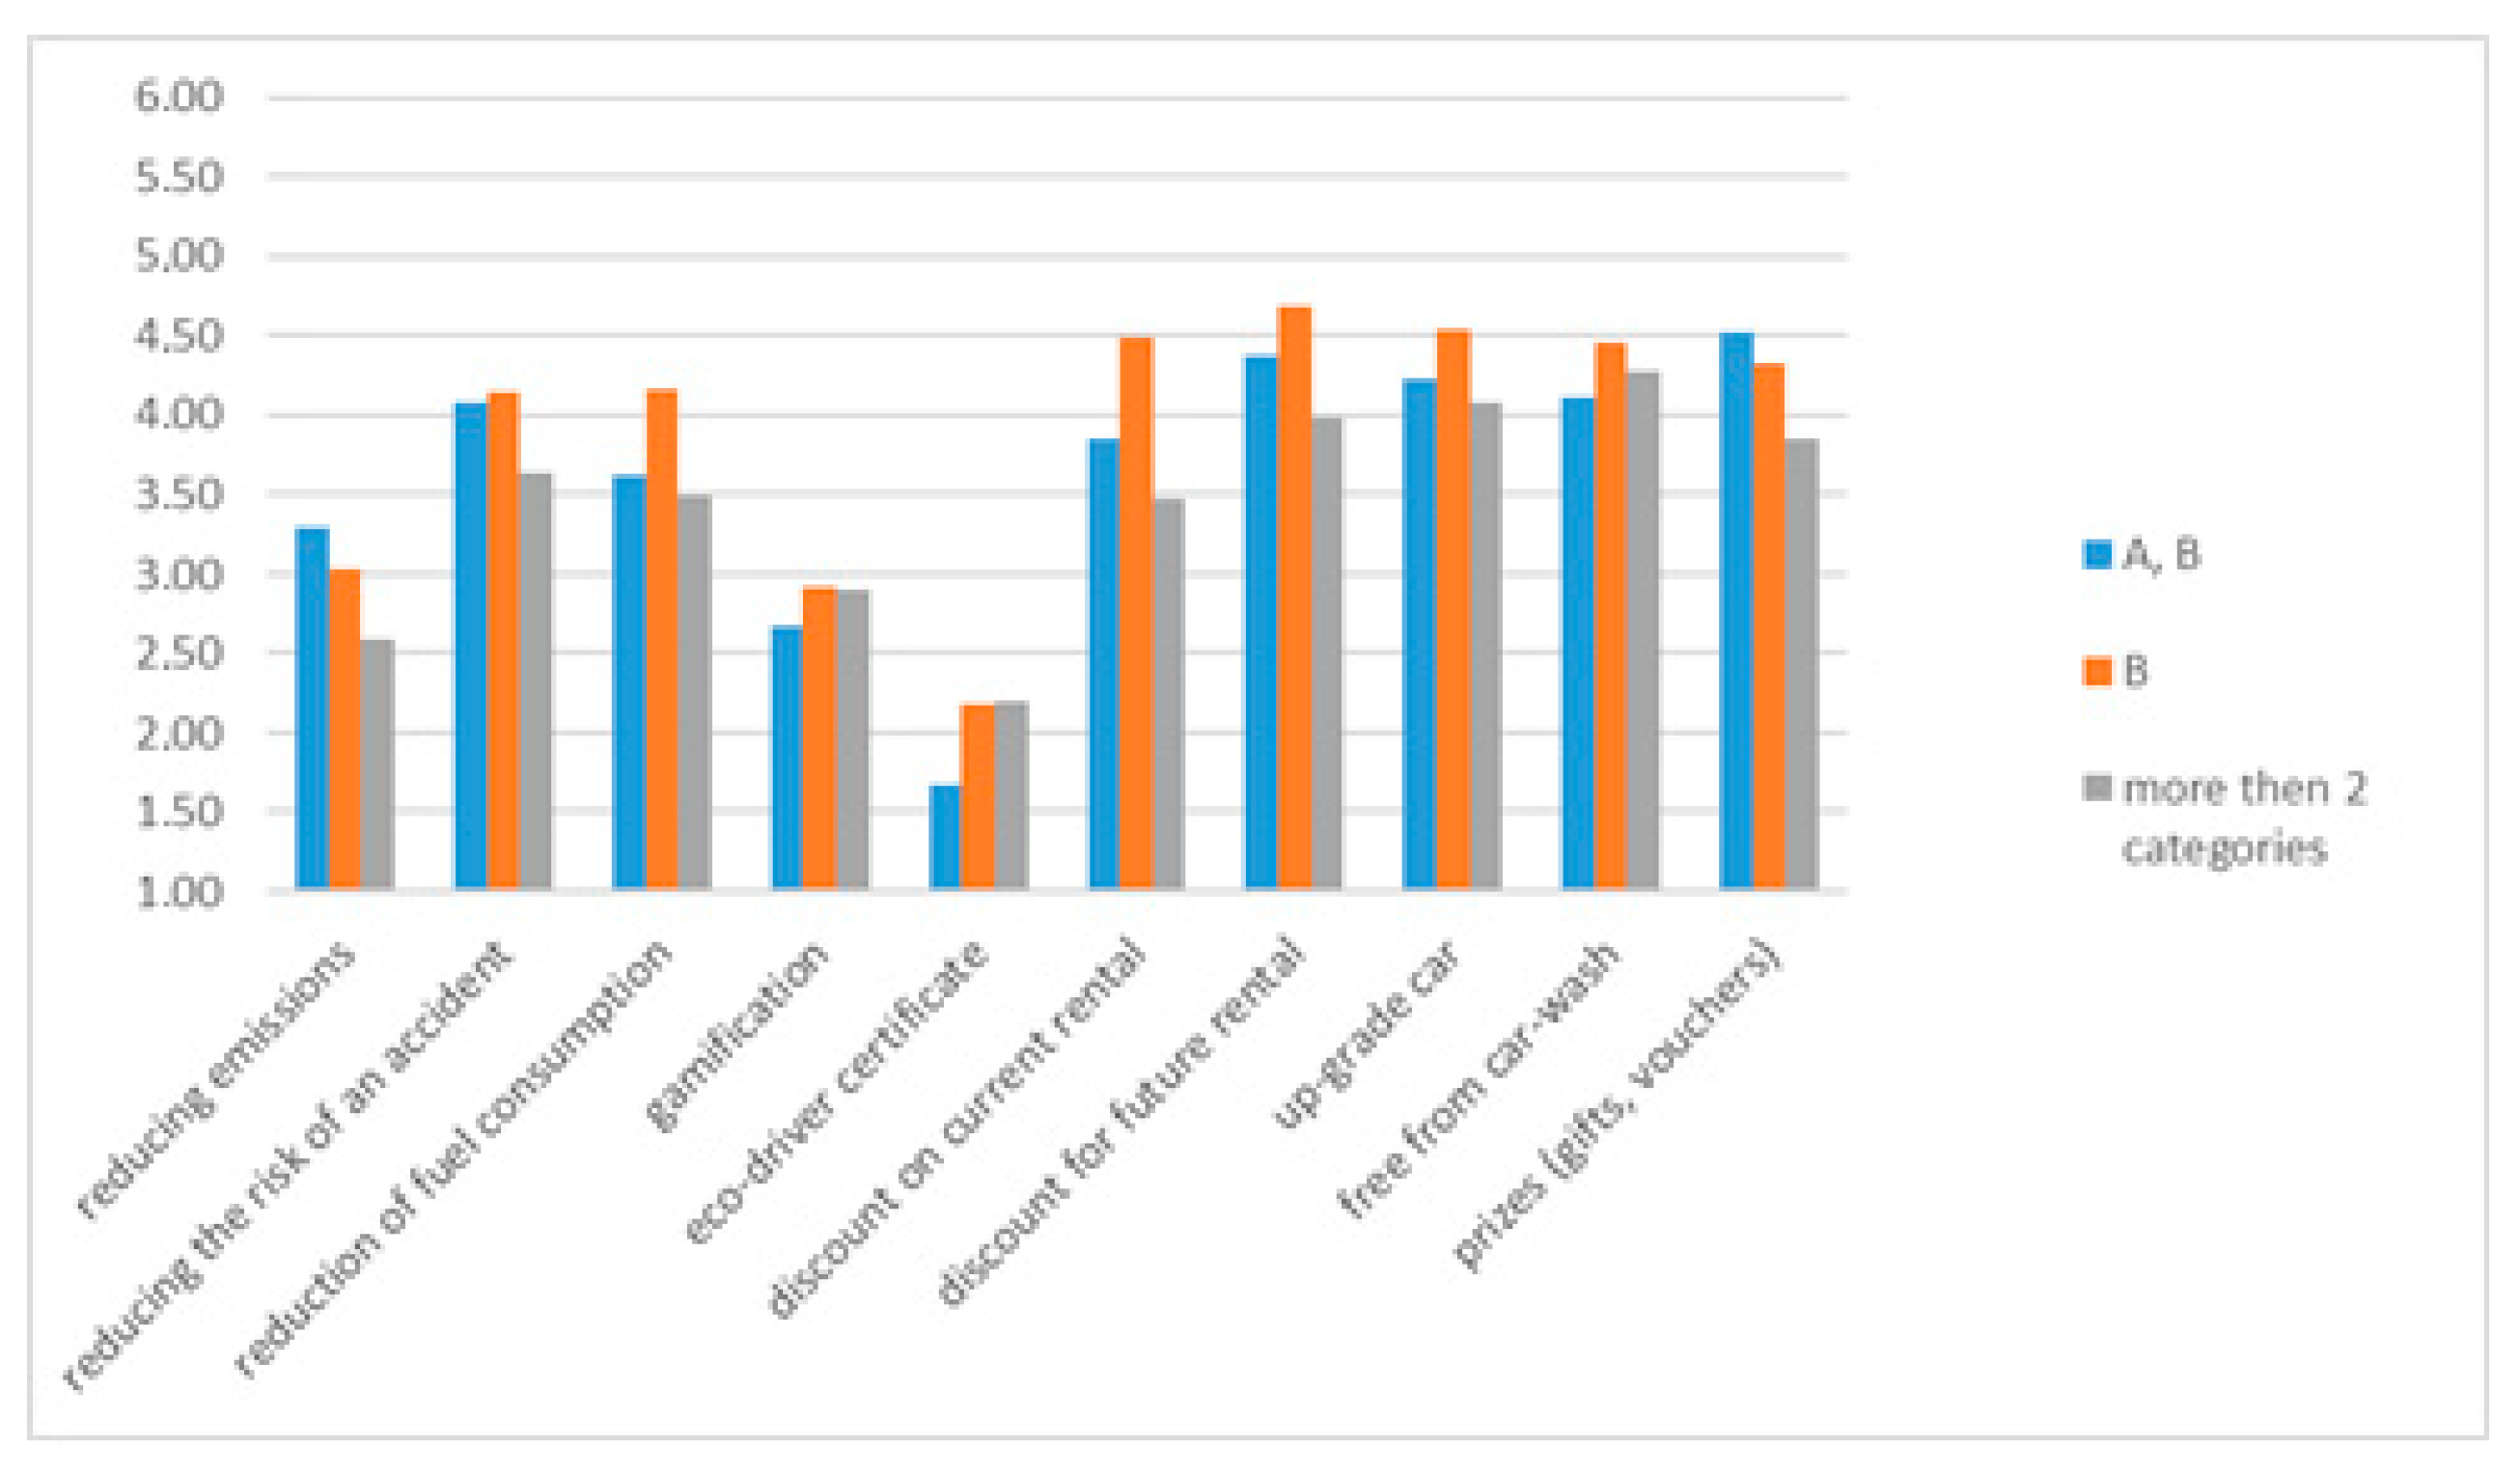
The majority of respondents had only a B category driving license—76.5% of the respondents. The type of driving license does not differentiate the respondents’ answers—statistically significant differences were observed only in case of discount on current and future rental (see Figure 6), however, due to large differences in the size of individual groups, further analysis of this variable was abandoned. A statistical significance study of the pairwise comparison showed that customers having B category license in the statistically significantly way value more the discount incentives (current and future rentals) than customers holding other license categories.
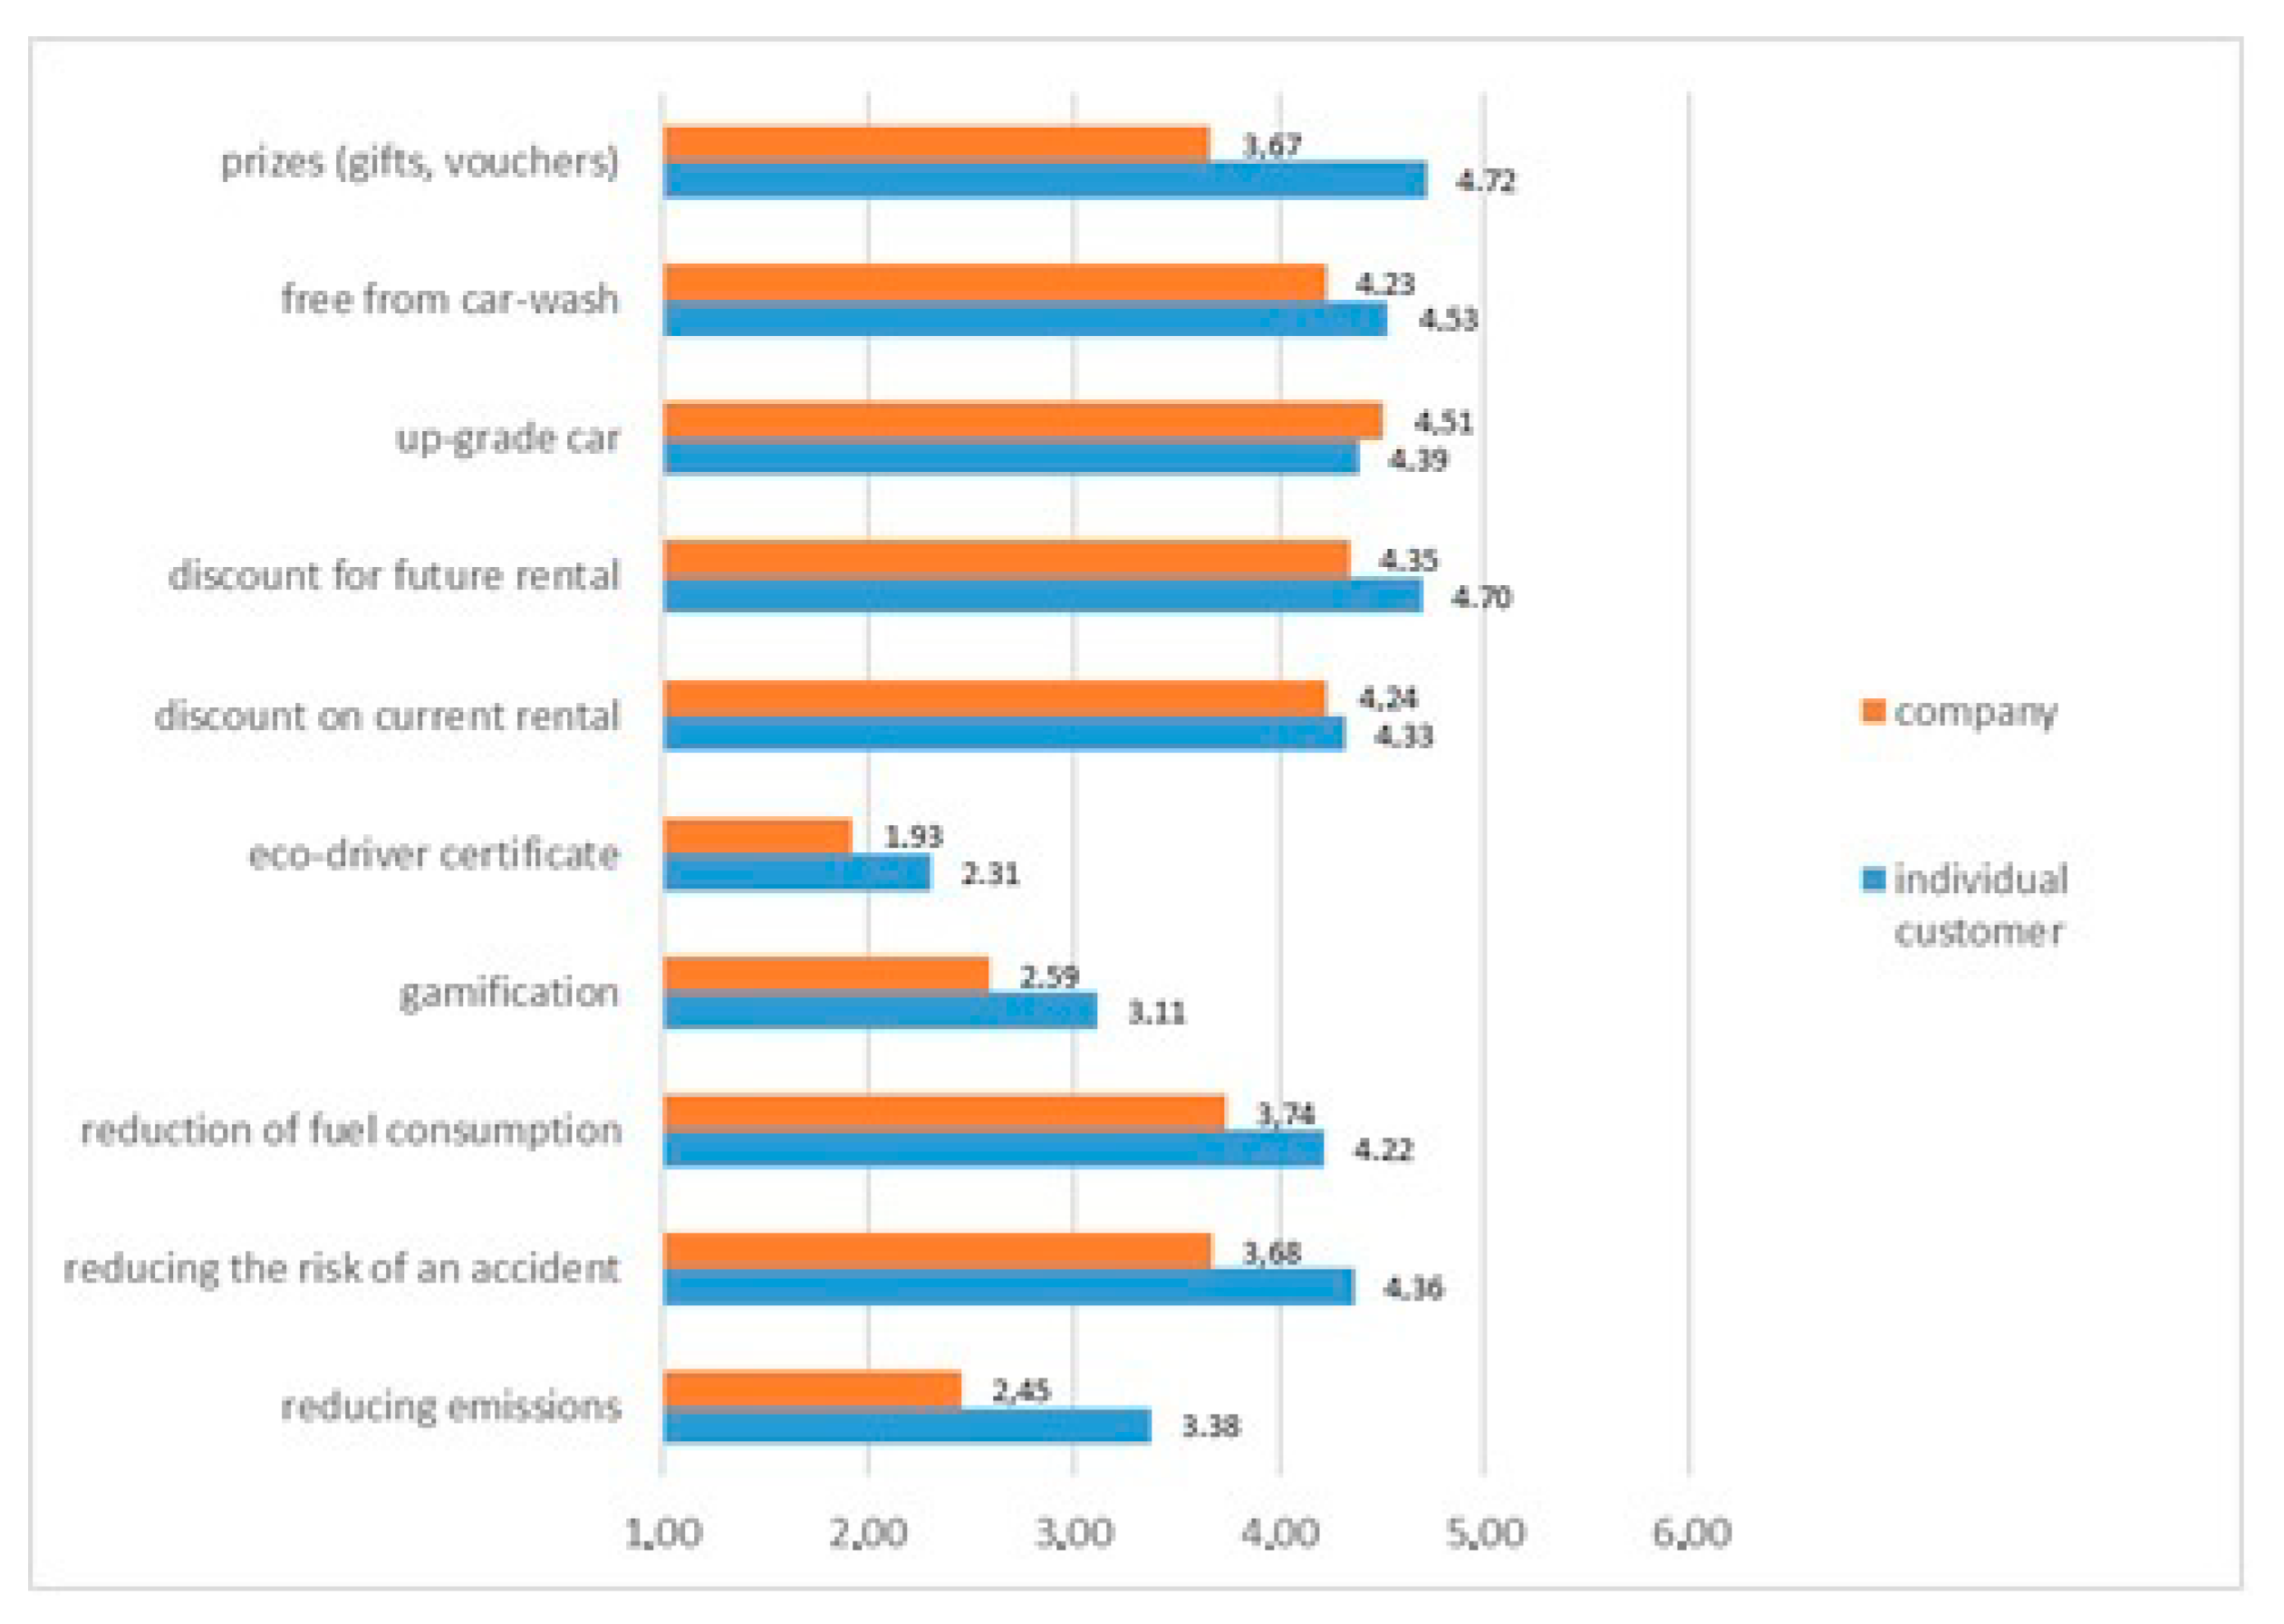
Client type turned out to be a significant variable. Only an upgraded car is more attractive for a corporate client; the remaining incentives were assessed higher by individual than corporate clients (see Figure 7). In the case of reducing emissions, reducing the risk of an accident, gamification, free from car-wash and prizes, these differences are statistically significant, as demonstrated by Mood’s Median test presented in Table 4. The incentives rated highest by an individual client are prizes and discounts for future rental. Researchers expected that this category should be attractive to a corporate customer who could use the future discount as part of an individual rental, and indeed future discount is more attractive to this group than current, but very slightly. Individual customers, however, have a greater preference for future discount.
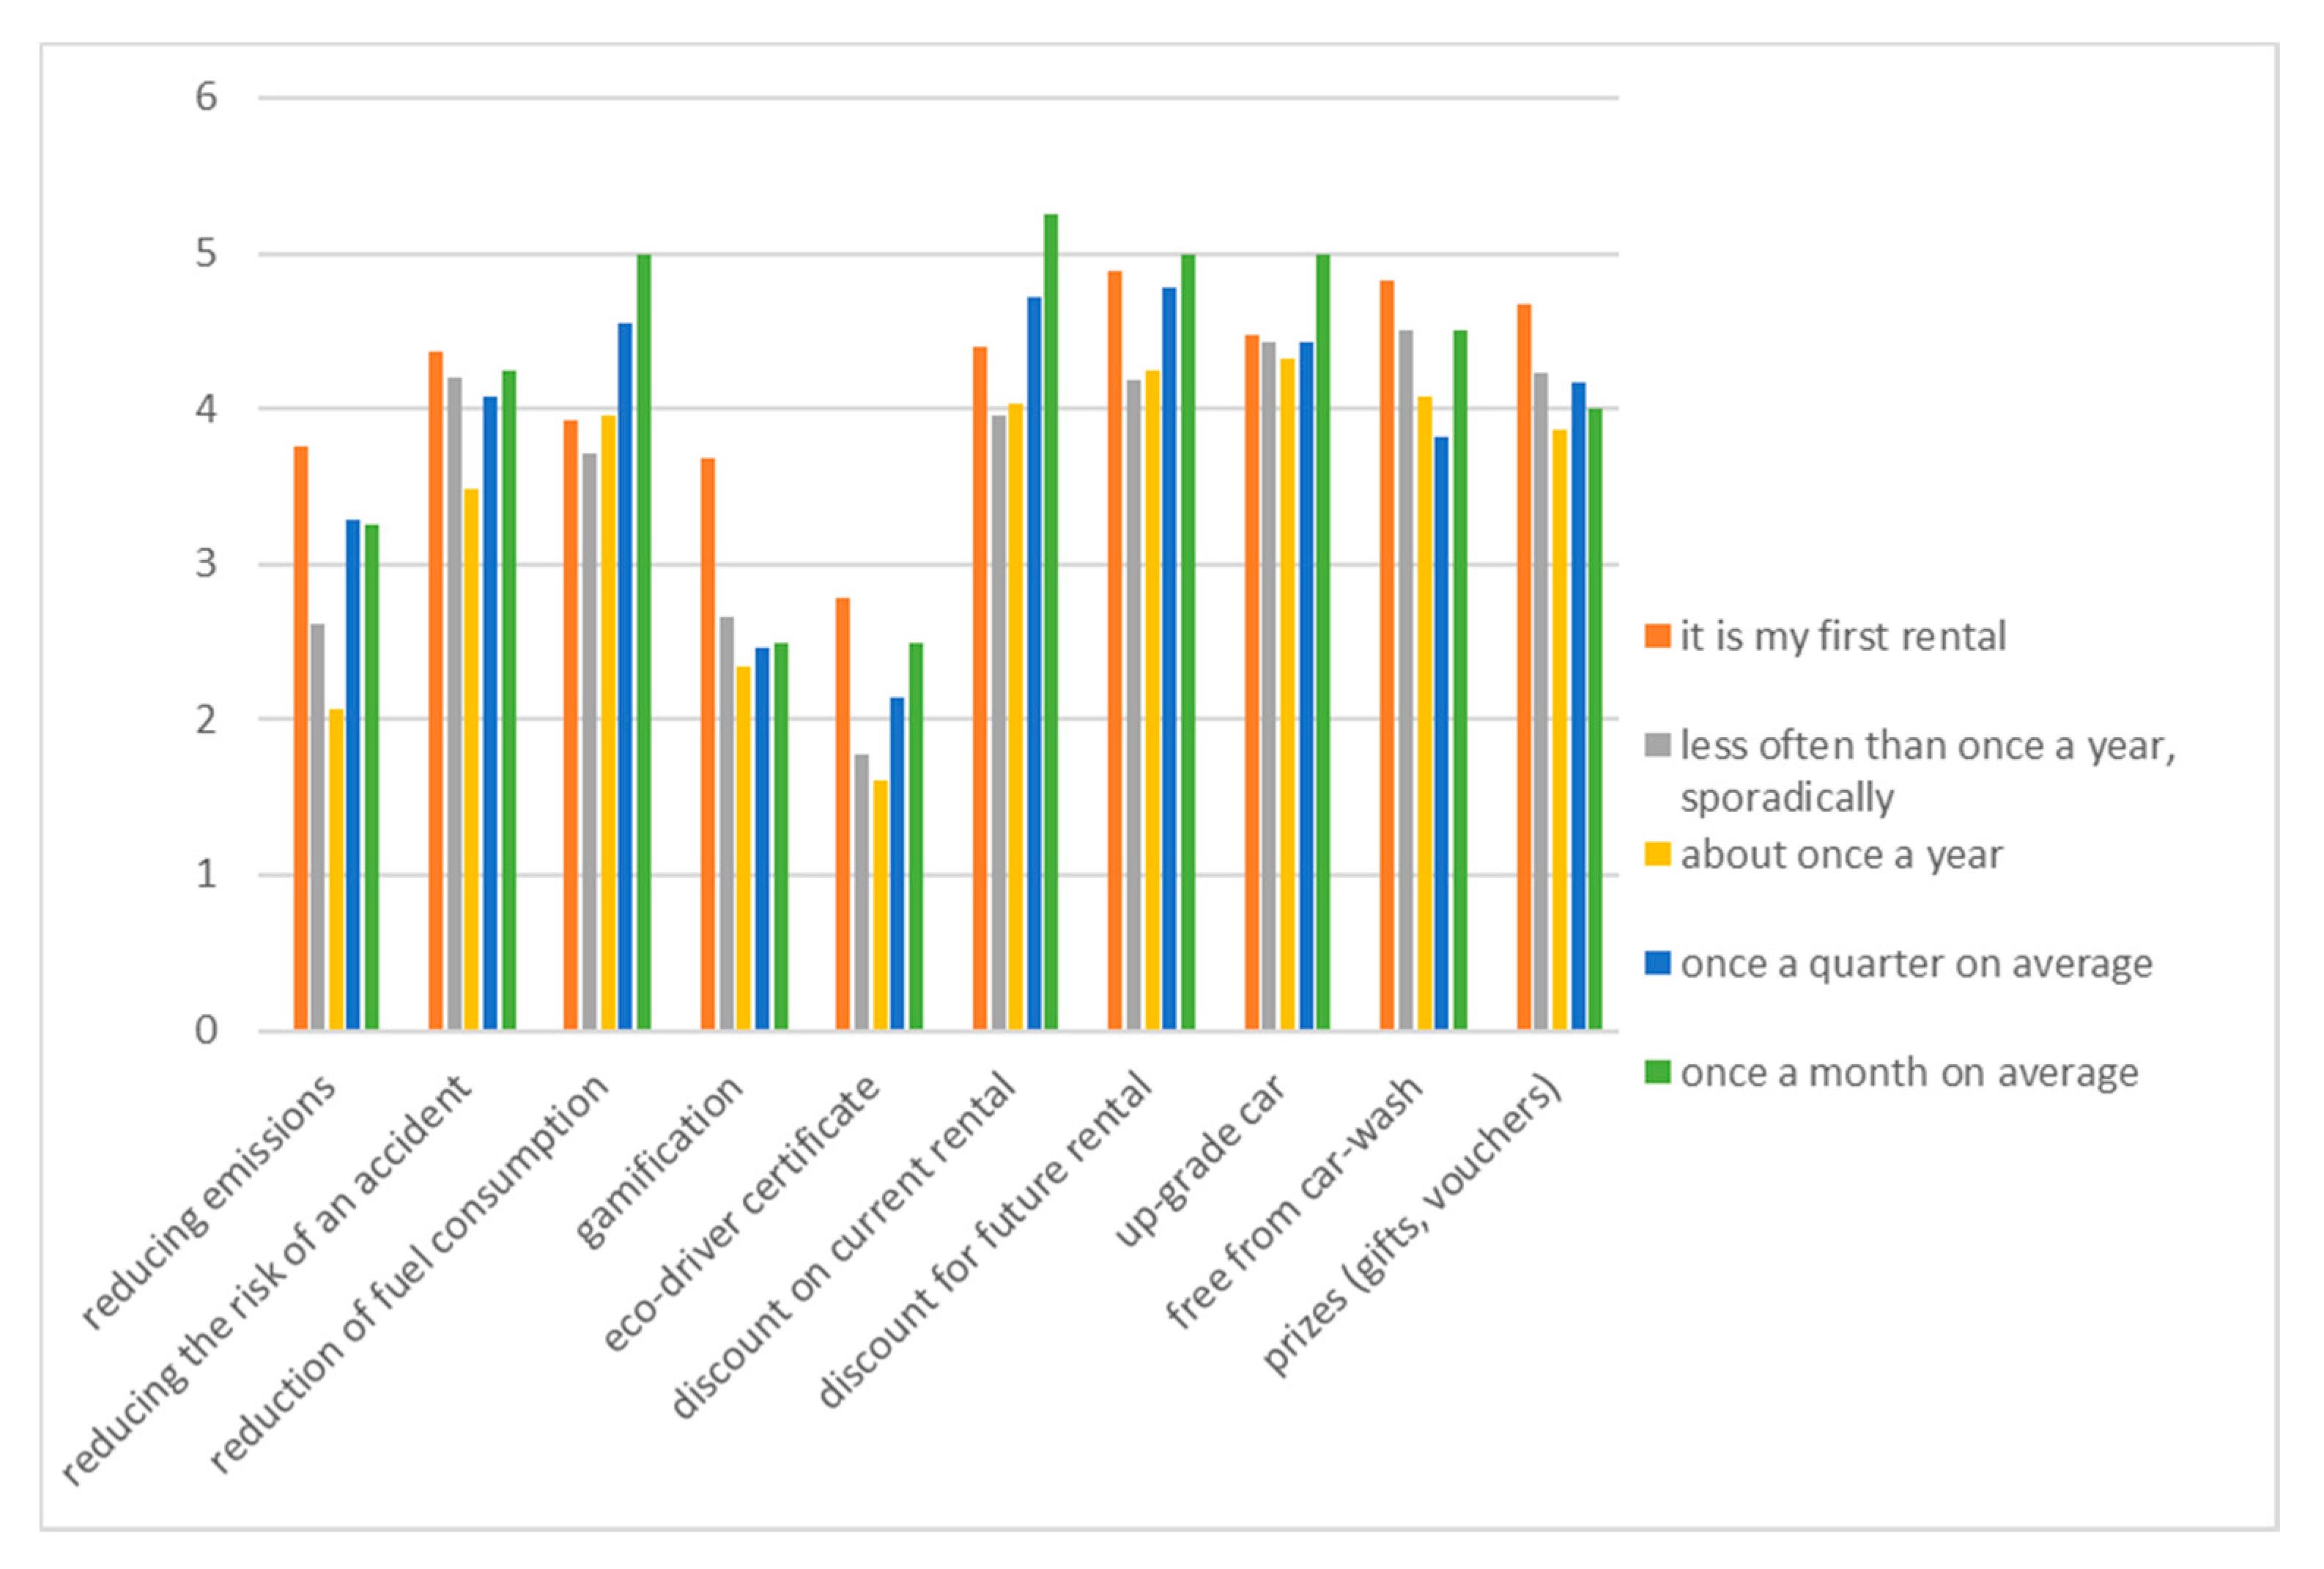
Figure 8 shows the differences in the assessment of individual benefits depending on the frequency of car rental. Only in case of car upgrade groups do not differ statistically significantly. In case of the remaining variables, the Mood’s Median test (see Table 4) showed significant differences between at least the two groups. People who rent a car most often value the discount for current rental the highest, but also the reduction of fuel consumption, future discount and car upgrade are rated very high and equally (significantly higher than other groups). The free from car-wash is also attractive to them. Similar incentives are recognized by users who rent a car on average once a quarter, who, however, value prizes higher than free from car-wash. The preferences of these customer groups should be particularly taken into account due to the revenues they generate. However, equally important is the group of people who decided to rent a car for the first time, because if properly encouraged, they have a chance to become regular customers of the company. For this group, the most attractive is the future discount and free from car-wash, but this group is significantly higher than the other categories of drivers, which also evaluates the gamification, emission reducing and eco-driver certificate. The statistical significance study of the pairwise comparison showed that this driver group most often rates the attractiveness of incentives differently by people who rent a car once a month on average.
4. Discussion
The research gap (identified in Section 2 of this paper) is the impact of the incentive system on increasing the environmental performance of drivers under short-term rental, significant from the point of view of sustainable development. There is no research in the literature on what would encourage short-term rental customers to eco-driving by a rented car. Due to the impact of transport, including passenger transport, on environmental pollution and on social aspects such as the risk of accidents and city congestion, such research seems to be important. The research conducted by the authors on a representative sample showed the level of attractiveness of selected incentives for eco-driving. Additionally, the authors verified the research hypothesis: The assessment of the attractiveness of the incentive to eco-driving depends on the character of the customer who rents a car. Table 5 presents a summary of the most and least attractive incentives, broken down by groups of respondents (customer characteristics).
The least attractive incentive turned out to be the eco-driver certificate, which was rated the lowest by all groups, as shown in the Table 5. This may result from the assumption of the respondents that this document has no power and will not bring them any benefits. Perhaps information about lower insurance premiums or a rental discount for certificate holders would change the ranking of this incentive.
When designing an incentive system, two strategies can be chosen—looking for incentives as universal as possible that will be equally attractive to all customer groups or selecting certain customer groups and preparing a campaign targeting the preferences of this group. The most universal incentives are upgrade car, reduction of fuel consumption and reducing the risk of an accident. The evaluation of the attractiveness of these incentives differs for the smallest number of customer characteristics. Thus, customers with different characteristics perceive these incentives as similarly attractive. Incentives: gamification, free from car-wash and discount on current rental are the incentives with the highest differentiation of ratings among the surveyed groups. Therefore, they are potentially the ones that will give the opportunity to create an incentive system dedicated to individual customer groups.
Another topic that requires discussion is the way in which the car rental company will communicate with the client to offer him/her additional benefits. Driving data can be collected via a telematics system. However, it is necessary to inform customers on an ongoing basis about how their driving style is assessed and what benefits they will collect. Such action requires communicating with the customer using the mobile application, which would have to be installed e.g., on the customer’s phone. This raises another obstacle that was not analyzed in the study. Probably some of the customers will not be interested in installing applications. From the point of view of building an incentive system, it seems reasonable to know the motivation of such an action (whether it is fear of tracking, feeding data to another application, or difficulties with its installation). It is also interesting to obtain information on the positive motivation of customers to install applications. Whether this motivation stems from the willingness to improve one’s driving style or to gain additional benefits, or both.
5. Conclusions, Limitations and Further Research
To sum up, the conducted research will allow the creation of effective systems encouraging customers of companies renting cars to drive in an eco-friendly style. The conducted research on the representative sample allowed for a positive verification of the research hypothesis: The assessment of the attractiveness of the incentive to eco-driving depends on the character of the customer who rents a car. As a result of the analyses, the incentives were identified, the attractiveness of which is statistically significantly dependent on the customer’s characteristics.
The conducted analysis fully covers the research gap that was identified on the basis of the literature review. So far, any recognition of the attitude towards the incentives improving eco-driving skills of drivers under short-term rentals has not been performed. According to the authors, this area should be subject to further research. Identification of incentives as key factors in increasing the environmental performance of car renters will also contribute to fulfilling the postulates of sustainable development.
Additionally, two strategies have been developed to encourage eco-driving: a universal strategy based on incentives, the attractiveness of which depends on the characteristics of customers. This strategy is aimed at specific customer groups. In this strategy, promotional activities are directed at strong incentives, the evaluation of which is strongly dependent on the characteristics of the car-rental company customers.
The research (although on a sample representative for the population) was carried out in one country. Thus, the conclusions, although generalized, apply to a selected market in Europe. An additional limitation of the conducted research is the selection of the characteristics of clients using car rental services and the analyzed set of incentives to drive in eco-style. Another limitation is the lack of testing the willingness to install a special application that allows car rental companies to communicate with the customer. It seems possible that among the respondents there are those who declare their interest in improving their driving style and reaping benefits, but will not want to install a special application. Investigating the motivation of customers to install the application should be another direction of further research.
According to the authors, further research should be conducted within the scope defined in limitations. In order to increase the universality of the conclusions, it would be necessary to conduct the same research also in other countries. Due to the fact that the development of car-rental markets in different countries is at different levels, it would also be possible to demonstrate the impact of this factor on the perception of the attractiveness of incentives.
Author Contributions
Conceptualization, M.A., J.F. and P.C.; methodology, M.A.; software, A.T.; validation, M.T., formal analysis, P.C.; investigation, M.A.; resources, A.T.; data curation, J.F. and M.A.; writing—original draft preparation, A.T., M.A. and J.F.; writing—review and editing, P.C.; visualization, M.A.; supervision, P.C.; project administration, A.T.; funding acquisition, M.T. All authors have read and agreed to the published version of the manuscript.
Funding
This research was funded by “THE NATIONAL CENTRE FOR RESEARCH AND DEVELOPMENT” in Poland, grant number: POIR.01.01.01-00-0431/19 “Development of technology and tools in the field of car telematics for intelligent reading of advanced driving parameters and reconstruction of the course of road accidents”.
Conflicts of Interest
The authors declare no conflict of interest.
References
- European Commission. Communication from the commission to the European Parliament. The Council, the European Economic and Social Committee and the Committee of the Regions, A European Strategy for Low-Emission Mobility. Oxf. Res. Encycl. Politics 2019, 15, 12. [Google Scholar]
- Jacyna, M.; Wasiak, M.; Lewczuk, K.; Karoń, G. Noise and environmental pollution from transport: Decisive problems in developing ecologically efficient transport systems. J. Vibroeng. 2017, 19, 5639–5655. [Google Scholar] [CrossRef]
- Basri, K.; Sahabuddin, E.S.; Tokan, M.K. Car pollution measurement (a study on ‘health’ environment). Poll. Res. 2015, 34, 497–502. [Google Scholar]
- Cartaxo, E.; Valois, I.; Miranda, V.; Costa, M. Issuances of Automotive Vehicles and the Impacts on Air Quality in the Largest City in the Brazilian Amazon. Sustainability 2018, 10, 4091. [Google Scholar] [CrossRef] [Green Version]
- Baptista, P.; Meloa, S.; Rolima, C. Energy, environmental and mobility impacts of car-sharing systems. Empirical results from Lisbon, Portugal. Procedia. Soc. Behav. Sci. 2014, 111, 28–37. [Google Scholar] [CrossRef] [Green Version]
- Nijland, H.; van Meerkerk, J. Mobility and environmental impacts of car sharing in The Netherlands. Environ. Innov. Soc. Transit. 2017, 23, 84–91. [Google Scholar] [CrossRef]
- Santos, G. Sustainability and Shared Mobility Models. Sustainability 2018, 10, 3194. [Google Scholar] [CrossRef] [Green Version]
- Fiedler, D.; Cap, M.; Certicky, M. Impact of Mobility-on-Demand on Traffic Congestion: Simulation-based Study. In Proceedings of the 20th IEEE International Conference on Intelligent Transportation Systems (ITSC), Yokohama, Japan, 16–19 October 2017; pp. 1–6. [Google Scholar]
- Sriyakula, T.; Jermsittiparsert, K.; Joemsittiprasertd, W.; Pamornmaste, C. Loyalty Programs Effectiveness and Customer–Company Identification. Int. J. Innov. Creat. Chang. 2019, 9, 149–164. [Google Scholar]
- Hofman-Kohlmeyer, M. Customer loyalty program as a tool of customer retention: Literature review. In Proceedings of the CBU International Conference on Innovations in Science and Education, Prague, Czech Republic, 23–25 March 2016; pp. 202–206. [Google Scholar] [CrossRef] [Green Version]
- Mosaberpanah, M.A.; Darban, K.S. The Role of Transportation in Sustainable Development. In ICSDEC 2012: Developing the Frontier of Sustainable Design, Engineering, and Construction; Wai, K.O., Chong, W.K., Gong, J., Chang, J., Khalid, S.M., Eds.; ACSE: Reston, VA, USA, 2012; pp. 441–448. [Google Scholar] [CrossRef]
- Pająk, M.; Cyplik, P. Truck platooning in the context of sustainable development’s targets defined in European Union’s strategies. LogForum 2020, 16, 311–321. [Google Scholar] [CrossRef]
- Thisaiveerasingam, T.; Bandara, S.J. Identification of relevant sustainable transportation links to sustainable development goals (SDGs) in the national context. In Proceedings of the 113th Annual IESL Sessions, Colombo, Sri Lanka, 14 October 2019; Volume 10, pp. 341–348. [Google Scholar]
- Gebresselassie, M.; Sanchez, T.W. “Smart” Tools for Socially Sustainable Transport: A Review of Mobility Apps. Urban Sci. 2018, 2, 45. [Google Scholar] [CrossRef] [Green Version]
- Nejadkoorki, F.; Yousefi, E.; Naserip, F. Analysing street traffic noise pollution in the city of Yazd. Iran. J. Environ. Health. Sci. Eng. 2010, 7, 53–62. [Google Scholar]
- Khan, S.A.R.; Zhang, Y.; Nathaniel, S. Green Supply Chain Performance and Environmental Sustainability: A Panel Study. LogForum 2020, 16, 141–159. [Google Scholar] [CrossRef]
- Cichosz, M.; Pluta-Zaremba, A. How to improve freight transport emissions’ management? LogForum 2019, 15, 93–105. [Google Scholar] [CrossRef]
- Zadobrischi, E.; Cosovanu, L.M.; Dimian, M. Traffic Flow Density Model and Dynamic Traffic Congestion Model Simulation Based on Practice Case with Vehicle Network and System Traffic Intelligent Communication. Symmetry 2020, 12, 1172. [Google Scholar] [CrossRef]
- Koźlak, A.; Wach, D. Causes of traffic congestion in urban areas. Case of Poland. In Proceedings of the SHS Web of Conferences, The 10th Jubilee Scientific Conference—InfoGlob, Beijing, China, 18–20 December 2018; Volume 57. [Google Scholar] [CrossRef] [Green Version]
- Murat, O.; Ebru, S.E. Determination of traffic noise pollution of the city of Tekirdag. J. Environ. Prot. Ecol. 2016, 17, 1276–1284. [Google Scholar]
- Swami, A. Impact of Automobile Induced Air Pollution on roadside vegetation: A Review. ESSENCE Int. J. Environ. Rehabil. Conserv. 2018, 101–116. [Google Scholar] [CrossRef]
- Montes-González, D.; Vílchez-Gómez, R.; Barrigón-Morillas, J.M.; Atanasio-Moraga, P.; Rey-Gozalo, G.; Trujillo-Carmona, J. Noise and Air Pollution Related to Health in Urban Environments. Proceedings 2018, 2, 1311. [Google Scholar] [CrossRef] [Green Version]
- Jakovljevic, B.; Paunovic, K.; Belojevic, G. Road-traffic noise and factors influencing noise annoyance in an urban population. Environ. Int. 2009, 35, 552–556. [Google Scholar] [CrossRef]
- Issa, Y. Effect of driver’s personal characteristics on traffic accidents in Tabuk city in Saudi Arabia. J. Transp. Lit. 2016, 10, 25–29. [Google Scholar] [CrossRef] [Green Version]
- Pino, O.; Baldari, F.; Pelosi, A.; Giucastro, G. Risk factors of road crash: An empirical analysis among an Italian drivers sample. Int. J. Innov. Appl. Stud. 2014, 5, 301–308. [Google Scholar]
- European Commission Annual Accident Report. 2018. Available online: https://ec.europa.eu/transport/road_safety/sites/roadsafety/files/pdf/statistics/dacota/asr2018.pdf (accessed on 17 December 2020).
- Bener, A.; Dafeeah, E.E.; Verjee, M.; Yousafzai, M.T.; Al-Khatib, J.; Nema, N.; Mari, S.; Choi, M.K.; Özkan, T.; Lajunen, T. Gender and age differences in risk taking behaviour in road traffic crashes. Adv. Transp. Stud. Int. J. Sect. B 2013, 31, 53–62. [Google Scholar]
- Rhodes, N.; Pivik, K. Age and gender differences in risky driving: The roles of positive affect and risk perception. Accid. Anal. Prev. 2011, 43, 923–931. [Google Scholar] [CrossRef] [PubMed]
- Rodrigues, H.S.; Fonseca, M.J.; Cardoso, P.R. The Effect of Drivers Gender on the Perception of Portuguese Road Safety Communication Campaigns. Int. J. Bus. Manag. 2015, 3, 104–123. [Google Scholar] [CrossRef] [Green Version]
- Sabbour, S.M.; Ibrahim, J.M. Driving behavior, driver style and road traffic accidents among young medical groups. Inj. Prev. 2010, 16. [Google Scholar] [CrossRef] [Green Version]
- Ozkan, T.; Lajunen, T. What causes the differences in driving between young men and women? The effects of gender roles and sex on young drivers’ driving behaviour and self-assessment of skills. Transp. Res. Part F 2006, 9, 269–277. [Google Scholar] [CrossRef]
- Al-Balbissi, A.H. Role of Gender in Road Accidents. Traffic Inj. Prev. 2003, 4, 64–73. [Google Scholar] [CrossRef] [Green Version]
- Mccartt, A.; Mayhew, D.R.; Braitman, K.A.; Ferguson, S.A.; Simpson, H.M. Effects of Age and Experience on Young Driver Crashes: Review of Recent Literature. Traffic Inj. Prev. 2009, 10, 209–219. [Google Scholar] [CrossRef]
- Guého, L.; Granié, M.A.; Apostolidis, T. WIiT Paris 2014: Women’s Issues in Transportation. In Proceedings of the 5th International Conference on Women’s Issues in Transportation—Bridging the Gap, Paris, France, 14 April 2014. [Google Scholar]
- Rolison, J.J.; Regeva, S.; Moutarib, S.; Feeneyc, A. What are the factors that contribute to road accidents? An assessment of law enforcement views, ordinary drivers’ opinions, and road accident records. Accid. Anal. Prev. 2018, 115, 11–24. [Google Scholar] [CrossRef]
- Almeida, F.; Silva, P.; Leite, J. Proposal of a carsharing system to improve urban mobility. Theor. Empir. Res. Urban Manag. 2017, 12, 32–44. [Google Scholar]
- Wang, Y.; Boggio-Marzet, A. Evaluation of Eco-Driving Training for Fuel Efficiency and Emissions Reduction According to Road Type. Sustainability 2018, 10, 3891. [Google Scholar] [CrossRef] [Green Version]
- Adamczak, M.; Kovacic-Lukman, R.; Toboła, A.; Tórz, M.; Cyplik, P. Role of IoT Solutions in Reducing CO2 Emission and Road Safety in Car Rental and Car Sharing Market. In Integration of Information Flow for Greening Supply Chain Management; Koliński, A., Dujak, D., Golinska-Dawson, P., Eds.; Springer: Cham, Germany, 2020; pp. 203–217. [Google Scholar] [CrossRef]
- Giesel, F.; Nobis, C. The Impact of Carsharing on Car Ownership in German Cities. In Proceedings of the International Scientific Conference on Mobility and Transport Transforming Urban Mobility, mobil.TUM, Munich, Germany, 6–7 June 2016; pp. 215–224. [Google Scholar] [CrossRef] [Green Version]
- Musso, A.; Corazza, M.; Tozzi, M. Car Sharing in Rome: A Case Study to Support Sustainable Mobility. Procedia-Soc. Behav. Sci. 2012, 48, 3482–3491. [Google Scholar] [CrossRef] [Green Version]
- Vinod, B. Unleashing the power of loyalty programs—The next 30 years. J. Revenue Pricing Manag. 2011, 10, 471–476. [Google Scholar] [CrossRef]
- Berman, B. Developing an Effective Customer Loyalty Program. Calif. Manag. Rev. 2006, 49, 123–148. [Google Scholar] [CrossRef] [Green Version]
- Szczepańska, K.; Gawron, P. Loyalty Programs Effectiveness. Found. Manag. 2011, 3, 89–102. [Google Scholar] [CrossRef]
- Lippoldt, K.; Niels, T.; Bogenberger, K. Effectiveness of different incentive models in free-floating carsharing systems: A case study in Milan. In Proceedings of the 21st International Conference on Intelligent Transportation Systems (ITSC), Maui, HI, USA, 4–7 November 2018; pp. 1179–1185. [Google Scholar] [CrossRef]
- Gavalas, D.; Konstantopoulos, C.; Pantziou, G. Design and Management of Vehicle Sharing Systems: A Survey of Algorithmic Approaches. In Smart Cities and Homes: Key Enabling Technologies, Morgan Kaufmann; Obaidat, M.S., Nicopolitidis, P., Eds.; Elsevier: Amsterdam, The Netherlands, 2016; pp. 261–289. [Google Scholar] [CrossRef] [Green Version]
- Kubera, M.; Kot, S. Evolution of Carsharing in Poland. In Proceedings of the 31st International Business Information Management Association (IBIMA), Milan, Italy, 25–26 April 2018; pp. 5328–5336, ISBN 978-0-9998551-0-2. [Google Scholar]
Figure 1.
Research methodology. Source: own elaboration.

Figure 2.
Average rating of incentives—all respondents. Source: own elaboration.

Figure 3.
Average rating of incentives—in relation to gender. Source: own elaboration.

Figure 4.
Average rating of incentives by age groups. Source: own elaboration.

Figure 5.
Average rating of incentives depending on the driver’s experience. Source: own elaboration.
Figure 5.
Average rating of incentives depending on the driver’s experience. Source: own elaboration.

Figure 6.
Average rating of incentives in relation to driving license categories. Source: own elaboration.
Figure 6.
Average rating of incentives in relation to driving license categories. Source: own elaboration.

Figure 7.
Average rating of incentives in relation to individual and corporate customers. Source: own elaboration.
Figure 7.
Average rating of incentives in relation to individual and corporate customers. Source: own elaboration.

Figure 8.
Average rating of incentives depending on the frequency of car rental from the rental company. Source: own elaboration.
Figure 8.
Average rating of incentives depending on the frequency of car rental from the rental company. Source: own elaboration.


Table 1.
Research areas of analyzed publications. Source: own elaboration.
| Analyzed Papers | Increase in Mobility | Number of Vehicles and CO2 Emissions Reduction | Incentive System | Car Rental/Car Sharing | Eco-Driving |
|---|---|---|---|---|---|
| [5] | x | x | |||
| [6] | x | x | |||
| [7] | x | x | x | x | |
| [8] | x | x | |||
| [9] | x | ||||
| [10] | x | ||||
| [36] | x | x | |||
| [37] | x | x | x | ||
| [38] | x | x | x | x | |
| [39] | x | x | x | ||
| [40] | x | x | |||
| [41] | x | ||||
| [43] | x | ||||
| [44] | x | x | |||
| [45] | x | x | x | ||
| [46] | x | x |
Table 2.
Characteristics of the tested sample. Source: own elaboration.
| Customer Characteristics | Groups | No. of Respondents | % of Respondents |
|---|---|---|---|
| Gender | Male | 201 | 62.2% |
| Female | 122 | 37.8% | |
| Age | 21–26 | 127 | 39.3% |
| 27–30 | 45 | 13.9% | |
| 31–40 | 60 | 18.6% | |
| 41–50 | 72 | 22.3% | |
| 51–60 | 19 | 5.9% | |
| Driving experience | less than 5 | 83 | 25.7% |
| 6–15 | 112 | 34.7% | |
| 16–25 | 74 | 22.9% | |
| more than 25 | 54 | 16.7% | |
| Driving license category | A, B | 27 | 8.4% |
| B | 247 | 76.5% | |
| more than 2 categories | 49 | 15.2% | |
| Type of customer | individual customer | 184 | 57.0% |
| company | 139 | 43.0% | |
| Car rental frequency | it is my first rental | 106 | 32.8% |
| less often than once a year, sporadically | 78 | 24.1% | |
| about once a year | 78 | 24.1% | |
| once a quarter on average | 49 | 15.2% | |
| once a month on average | 12 | 3.7% |
Table 3.
Results of normality test (Anderson–Darling Test). Source: own elaboration.
| Emissions Reduction | Reducing the Risk of An Accident | Reduction of Fuel Consumption | Gamification | Eco-driver Certificate | Discount on Current Rental | Discount for Future Rental | Upgrade Car | Free from Car-wash | Prizes (Gifts, Vouchers) | |
|---|---|---|---|---|---|---|---|---|---|---|
| p-Value | <0.005 | <0.005 | <0.005 | <0.005 | <0.005 | <0.005 | <0.005 | <0.005 | <0.005 | <0.005 |
Table 4.
Results of hypothesis testing using the Mood’s Median test. Source: own elaboration.
| Customer Characteristic | Emissions Reduction | Reducing the Risk of An Accident | Reduction of Fuel Consumption | Gamification | Eco-driver Certificate | Discount on Current Rental | Discount for Future Rental | Upgrade Car | Free from Car-wash | Prizes (Gifts, Vouchers) |
|---|---|---|---|---|---|---|---|---|---|---|
| Gender | 0.000 | 0.057 | 0.340 | 0.032 | 0.014 | 0.000 | 0.000 | 0.411 | 0.403 | 0.699 |
| Age | 0.894 | 0.061 | 0.054 | 0.005 | 0.000 | 0.005 | 0.438 | 0.062 | 0.000 | 0.000 |
| Driving experience | 0.790 | 0.373 | 0.095 | 0.002 | 0.086 | 0.127 | 0.477 | 0.180 | 0.000 | 0.153 |
| Driving license category | 0.473 | 0.516 | 0.103 | 0.589 | 0.641 | 0.000 | 0.014 | 0.726 | 0.842 | 0.849 |
| Type of customer | 0.016 | 0.002 | 0.192 | 0.033 | 0.072 | 0.879 | 0.148 | 0.886 | 0.007 | 0.002 |
| Car rental frequency | 0.000 | 0.000 | 0.000 | 0.000 | 0.000 | 0.007 | 0.001 | 0.056 | 0.001 | 0.001 |
Note: The p-Value marked in green in Table 4 indicates that the evaluation of attractiveness of a given incentive (column) indicated by people from different groups separated within one factor (row) are statistically significantly different from each other. p-Value, less than the assumed significance level, allowed for the rejection of the null hypothesis.
Table 5.
The least and the most attractive incentives. Source: own elaboration.
| Customer Characteristic | Layers | The Most Attractive Incentive | The Least Attractive Incentive |
|---|---|---|---|
| Gender | Male | Free from car-wash | Eco-driver certificate |
| Female | Discount for future rental | Eco-driver certificate | |
| Age | 21–26 | Discount for a future rental | Eco-driver certificate |
| 27–30 | Upgrade car | Eco-driver certificate | |
| 31–40 | Free from car-wash/future discount | Eco-driver certificate | |
| 41–50 | Free from car-wash | Eco-driver certificate | |
| 51–60 | Upgrade car | Eco-driver certificate | |
| Driving license experience | less than 5 | Upgrade car | Eco-driver certificate |
| 6–15 | Discount for future rental | Eco-driver certificate | |
| 16–25 | Discount for future rental | Eco-driver certificate | |
| more then 25 | Free from car-wash | Eco-driver certificate | |
| Driving license category | A, B | Prizes | Eco-driver certificate |
| B | Discount for future rental | Eco-driver certificate | |
| more than 2 categories | Free from car-wash | Eco-driver certificate | |
| Type of customer | individual customer | Prizes | Eco-driver certificate |
| company | Upgrade car | Eco-driver certificate |
Note: In Table 5, those incentives, whose importance is statistically significant, are marked green.
Publisher’s Note: MDPI stays neutral with regard to jurisdictional claims in published maps and institutional affiliations. |
© 2020 by the authors. Licensee MDPI, Basel, Switzerland. This article is an open access article distributed under the terms and conditions of the Creative Commons Attribution (CC BY) license (http://creativecommons.org/licenses/by/4.0/).
Share and Cite
MDPI and ACS Style
Adamczak, M.; Toboła, A.; Fijałkowska, J.; Cyplik, P.; Tórz, M. Analysis of Incentives to Eco-Driving for Car Rental Companies’ Customers. Sustainability 2020, 12, 10579. https://0-doi-org.brum.beds.ac.uk/10.3390/su122410579
AMA Style
Adamczak M, Toboła A, Fijałkowska J, Cyplik P, Tórz M. Analysis of Incentives to Eco-Driving for Car Rental Companies’ Customers. Sustainability. 2020; 12(24):10579. https://0-doi-org.brum.beds.ac.uk/10.3390/su122410579
Chicago/Turabian StyleAdamczak, Michał, Adrianna Toboła, Jadwiga Fijałkowska, Piotr Cyplik, and Maciej Tórz. 2020. "Analysis of Incentives to Eco-Driving for Car Rental Companies’ Customers" Sustainability 12, no. 24: 10579. https://0-doi-org.brum.beds.ac.uk/10.3390/su122410579
Note that from the first issue of 2016, this journal uses article numbers instead of page numbers. See further details here.