A Sustainable Niche Market: How Does Honey Behave?


Department of Agricultural, Forest and Food Sciences (DISAFA), University of Turin, 10095 Grugliasco, Italy
*
Author to whom correspondence should be addressed.
Sustainability 2020, 12(24), 10678; https://0-doi-org.brum.beds.ac.uk/10.3390/su122410678
Submission received: 25 November 2020
/
Revised: 15 December 2020
/
Accepted: 18 December 2020
/
Published: 21 December 2020
(This article belongs to the Section Economic and Business Aspects of Sustainability)
Abstract
:The global honey market has witnessed constant growth over recent decades, especially in Asian regions. In recent years, the increase in export flows of this product throughout the world has raised the issue of the lack of international import standards and regulations, making trade susceptible to variables that are not only economic, but also social or political. The objective of this study is therefore to explore, using the econometric methodology of gravity models, what the determinants of the international honey trade are, both economic and socio-cultural, and to verify whether a niche market, such as the one being examined, is influenced by these covariates, in a similar manner to the main commodities of the agri-food sector, or if honey displays a unique behavior. The results show that honey market behavior is not statistically different from that of the main agri-food products already studied and that the cultural distance, introduced as a covariate, does not have a significant influence.
1. Introduction
Over the last twenty years, both technical and scientific progress and the growth of beekeeping have led to a significant increase in honey production, with an average annual growth of 35,000 tonnes since 2000, amounting to a total of 1.8 Mt of honey produced in 2016 [1] worldwide.
Despite the partial reliability of the production data available, there is a positive trend in international honey production, mainly driven by Asia, and more specifically by China and India, which in recent years have established their production leadership, recording average honey production increases in excess of 10,000 tonnes per year. In contrast, other regions of the world, such as Europe and the Americas, have shown more limited increases in production, of less than 2000 tonnes per year [1,2].
Economically, the honey sector can be defined as a niche market in the global agro-food exports’ context, mainly driven by commodities with much higher volumes and values. By 2017, honey exports accounted for 0.17% of total world agri-food exports; comparing the different national economies, the honey sector never accounts for more than 1% of total exports, even where this production is more widespread [2,3]. The impact of this economy is therefore very little marked in fact. Although the volumes exported are increasing, it is not possible to define honey as an agri-food commodity.
In parallel to this trend, there has been an increase in apparent consumption of this niche agro-food product, especially in high-income countries [1,3].
Increasing production and consumption have, consequently, provided a strong impulse to the world honey trade: notably, since 2009, the total quantity of honey exported has increased by about 50%, from 400,000 tons per year to over 600,000 tons [1], with an estimated value for 2016 of over 2.2 billion US dollars [3]. It should also be noted that the export capacity of Asian countries has evolved in a similar way to the volumes produced, whereas in other regions, particularly Europe, the competitive capacity of honey exports has been rather limited [4], showing instead a growing attention to the quality aspects and ecosystem services provided by beekeeping [5].
Focusing on trade flows, there was a significant increase in quantities traded worldwide, from around 300,000 tonnes in 1995 to over 650,000 tonnes in 2016, with a value of exports of over 2 billion dollars, according to the UN Comtrade database [3], which also demonstrates the market liberalization process, particularly for Asian countries, with an estimated average annual increase of around 9000 tonnes of honey exported [2] (Figure 1).
The leadership in honey exports is held by China, which exported almost 130,000 tonnes of honey in 2017, followed by Argentina and Ukraine. Many countries, particularly Asian ones, have met the growing international demand for honey by placing a high quantity of the product on the international scene at a more competitive price than other markets of origin [6]: according to [2], for example, the average price per kg of Chinese honey in 2017 was just over $2, whereas honey from Germany or Spain was over $4.5·kg−1.
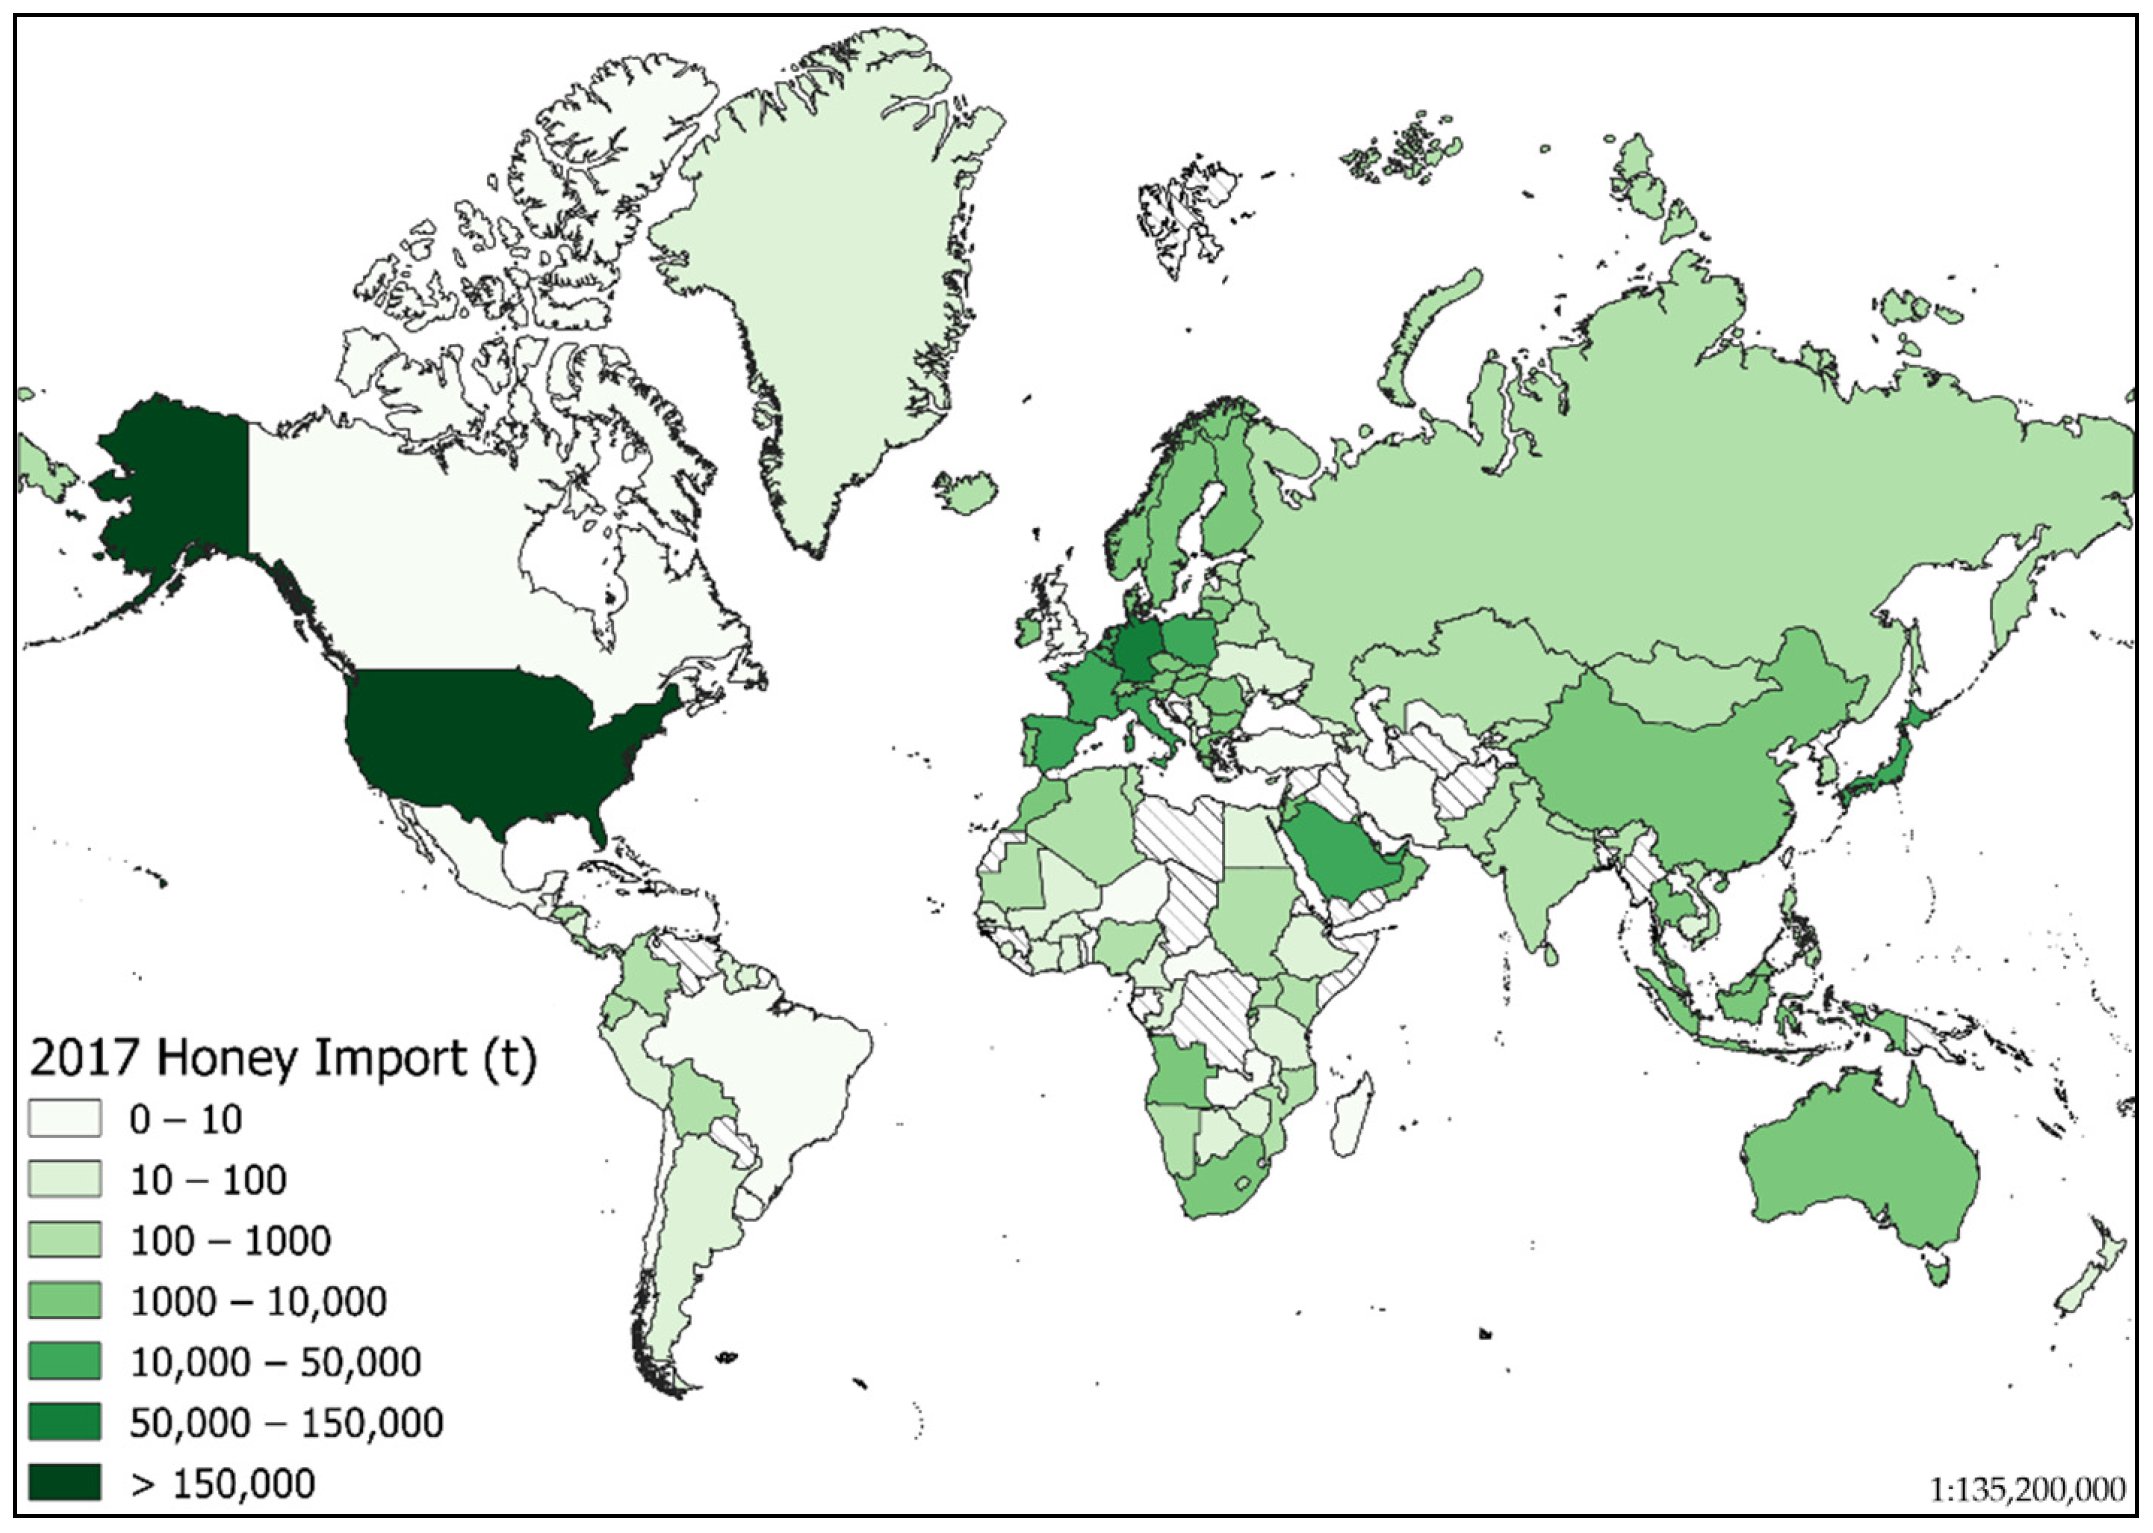
Imports therefore followed the same trend, with the USA, Germany, and the UK leading the most important honey importing countries [3]. Moreover, some nations, such as Germany, report large quantities of imported and exported honey, showing that some countries mainly play a role as a commercial hub for re-exports [2,6]. In this context, the EU is one of the world’s major honey importing partners (Figure 2).
From a legislative point of view, the honey trade is currently regulated by a small number of international standards, and import and export of this product are currently mainly based on the parameters set out in the Codex Alimentarius [7], as revised in 2001. This has led to a wide variability in the parameters adopted to define the product and its quality standards, making the international honey trade susceptible to factors that are not strictly linked to quality aspects, but also economic and political. For example, among the custom barriers linked to economic issues, there are the anti-dumping measures, in force since 2001, implemented on the Chinese honey entering in the U.S. market, to mainly preserve internal production in the domestic market [8].
Therefore, there is no unique or recognized legislation at international level, so a number of different national regulations are applied, making it even more difficult to meet the varying criteria imposed and hindering trade [9]. By using the Codex Alimentarius as a voluntary regulation mainly related to botanical and geographical origin and to the criteria of chemical composition and physical characteristics of the product [7], already in 2001 the European Union had adopted the requirements for honey trade [10,11], subsequently implementing further regulations that integrated the quality parameters for imports from third countries [12,13,14].
In addition to this limited and heterogeneous regulation, there is also the phenomenon of food fraud, in which honey is considered as one of the marketed products most subject to adulteration: according to the study by Moore et al. [15], honey is third in the world in terms of number of cases of reported fraud. In particular, many fraud cases in the sector have been traced back to the product from Asian countries [6,16]. This has also led to important commercial consequences, such as the limitation of Chinese honey flowing into the US market after 2010 [16] and also the European Commission’s monitoring plan in 2015, which highlighted at least 15% of the samples analyzed as not meeting the standards imposed by the European single market [6].
Honey is a sustainable product by definition. It has environmentally friendly characteristics, including the conservation of biodiversity and pollination as an ecosystem service [17]. These aspects can be recognized, for example, by the organic label for honey, by incorporating low-impact production criteria and management of adversities through biotechniques [18,19], instead of conventional techniques, as in the case of the Varroa mite [20].
With the use of biotechniques, organic honey production has an undoubtedly positive impact from a socio-economic and environmental point of view and can help organic beekeepers to gain a better recognition of their product. As highlighted by de Oliveira et al. [21], most of the indicators used to explore the economic and environmental impact positively describe the conversion and organic production of beekeepers.
Moreover, the role of bees and beekeepers in maintaining biodiversity has already been emphasized in the literature, confirming the fundamental activity of beekeeping from an ecological point of view [5] and highlighting the pollination service activity as a positive economic externality [22]. Many authors have observed the consumers’ opinion of honey, which is perceived as healthy, safe, and environmentally friendly. A more sustainable product often means that the consumer is willing to pay a higher price, which has important implications for producers [23,24].
Consumers attach great importance to these aspects, which are well-represented by the organic label [25]. Equally important is the concept of local production, closely linked to the territory. This is taken into account in a positive way by consumers, who not only associate positive environmental effects but also the preservation of local activities [24,26,27]. So, honey identifiable as a local or mountain product [28], or even with Geographical Indication schemes like the Product Designation of Origin (PDO), can be considered sustainable and recognizable on the market by a label, and all of these characteristics can contribute to building the image of a more sustainable product in the consumer’s mind [29], thus potentially influencing trade flows.
Despite the limited economic impact of the honey trade in the global context, when compared to the main agro-food commodities, it is interesting to analyze the dynamics and determinants that influence export flows, in order to identify the main trade drivers at international level, also in consideration of the fact that there are no specific studies in literature focusing on the international honey trade, whereas the last decade has seen an increase in scientific publications focusing on food fraud, where honey is one of the main products subject to food adulteration [15,30,31].
Trade flow analysis draws mainly on gravity models, econometric tools theorized and developed in the 1960s [32] and still widely applied today in many sectors, including migration flows, for which many applications have been developed [33,34].
The great versatility of gravity models has also made them useful for applications in the field of agricultural economics, ranging from the study of the meat trade, in which the impacts of specific trade restrictions have been studied [34,35,36,37,38], of fish products [39,40,41], and of wines [42,43,44]. Other recent applications include fruit and vegetables [45,46], olive oil [47,48] or, more generally, the impacts of tariff and non-tariff barriers or trade agreements on many primary sector products [49,50,51].
With regard to honey, the only econometric application related to this product examines the Chinese market. [52] Thus the application of the structural gravity model methodology with an international outlook represents the main innovation of this study since there are no studies currently being conducted on honey following this approach.
The aim of this study is to analyze the determinants influencing global honey exports and to verify whether these determinants are similar to those of other agri-food products which have a greater economic impact or if there is evidence of original behavior. This study is carried out using the main variables used in literature, such as distance, apparent consumption, gross domestic production, and the presence of trade treaties or free trade agreements. The analysis will also include some socio-cultural variables, in order to assess whether these covariates also have an influence on honey trade dynamics, as recently reported [53]. This represents another innovative feature of this study of socio-cultural variables: in fact, this is a long-established relationship, which is still of current interest but rarely applied to niche products.
2. Materials and Methods
2.1. Theoretical Framework
The gravity models are inspired, albeit with due distinction, by Newton’s law of universal gravitation. The basic principle is that the trade flow from one country to another is directly proportional to the economic dimension of the two countries involved, identified by the Gross Domestic Product (GDP), and inversely proportional to the distance between the two trading partners [32], used as a proxy for transport costs [54].
In its original formulation the log-linear model is structured as follows (1):
where Trade is the monetary value of annual exports of product k from state i to state j, in millions of USD (nominal value). Exports were accessed from the UN Comtrade database [3], which uses the Harmonized System Code HS:6 classification system, thus identifying honey by the code HS6:040900.
GDP is the economic dimension of both states i and j, in billions of USD (nominal values), obtained from the World Bank database [55], while Distij is the linear distance in km between the capitals of the two countries, retrieved from the database developed by the Centre d’Études Prospectives et d’Informations Internationales (CEPII) [56].
Regarding distance, a negative impact on the dependent variable is expected. Finally, ε is the residual error term.
Based on the approach proposed by Anderson & Van Wincoop [54], the model is estimated in its augmented form using the Ordinary Least Square Method (OLS), including some additional variables and presented as follows (2):
where GDPi,t−1 e GDPj,t−1 are, respectively, the gross domestic product of state i and state j, lagged to the previous year: lag-1 allows the endogeneity of the model [57] to be controlled and the effect of an economic cycle on the trade dynamics to be considered, referring to the following year.
Foodj represents the apparent honey consumption of the importing country, in tons, and was obtained from the trade data of the UN Comtrade database [3] and the production data of the FAOSTAT database [1]. This covariate has already been used, for example, in the study of determinants of seafood international trade and normally has a positive effect on the import flows [58] and also in the study of the forests product trade at international level, with similar positive effects on import flows [59], without generating, in both of the cases, endogeneity problems.
Finally, Prodj represents honey supply at the time t of the importing country, expressed in tons and obtained from the FAOSTAT database [1]: this variable usually has a negative impact on trade flows, generating a “home bias effect” [54], since it causes a trade resistance to the purchase of foreign products when domestic production increases, as already highlighted for the international wine market [60].
The proposed log-linear form includes some error components that generate biased coefficient estimates and do not allow effective control of the heteroscedasticity of the data [61,62,63].
The first of these components is the presence of “Multilateral Resistance Terms”, not directly observable components [63] which, as a result of increasing resistance to trade of a nation towards other countries, lead it to trade only with some specific partners [54], causing what Baldwin & Taglioni [61] define as one of the main errors in the estimation of gravity models (Gold Medal Mistake).
To partially counteract the error, fixed effects for the exporter and for time have been included in the model.
Another issue concerns the observations equal to 0 of the Trade dependent variable: in the log-linear form, these observations are normally omitted as “missing” data, limiting the estimation of the parameters. To avoid this, different estimation procedures have been proposed [51,63,64] including the Heckman selection model [65] and the Poisson-Pseudo Maximum Likelihood (PPML) estimation [62].
More specifically, for the Heckman selection model a two-step procedure is performed, with the initial application of a Probit model followed by an OLS, based on the results of the previous procedure [66]. However, the most widely used model is the Poisson Pseudo-Maximum Likelihood (PPML), proposed in 2006, which is consistent even in the presence of fixed effects and is also able to effectively include null observations, since its formulation does not require a logarithmic transformation of the dependent variable [62,67,68].
To compensate for the loss of information and observations resulting from the lack of treatment of the records equal to 0, a constant can then be added to the Trade value (1 + Trade), as has been performed in the present study, although in this way inconsistent estimates of parameter coefficients may result [69].
The final source of error to be taken into account is the heteroscedasticity of the data [63,69], which with log-linear models is not effectively contained and can again lead to an inconsistent estimation of the coefficients, which is avoided by using the Poisson Pseudo Maximum Likelihood (PPML) estimation [64].
2.2. Estimation Procedure
As anticipated, gravity models can be enriched by including more explanatory variables of the commercial flow, as proposed in the following Equation (3):
In the augmented model, the main variables used are combined with others, to better explain the determinants of trade. For example, dummy variables representing common trade characteristics can be inserted, as in the case of the EUij, GATTij, and FTAij variables, which indicate respectively the common membership to the European Union, to the General Agreement on Tariffs and Trade (GATT), or the World Trade Organization (WTO), and finally the common signature of bilateral or multilateral free trade agreements (FTA). Data were obtained from the CEPII database for the years 2001–2015 [56] and from the WTO database [70] for the most recent years. As they represent trade agreements or organizations, the sign of their coefficients is generally positive.
Among the socio-cultural variables, widely used in both economic studies [71] and in sociological studies [34], there are the common official language (Comlangij) and the so-called “cultural distance” (Cultdistij) variables. The first is a dummy variable, derived from the study conducted by Head [72] and generally has a positive influence on the development of a commercial relationship between two countries. The second variable concerns the cultural dimensions proposed by Hofstede [73]. The cultural sphere is considered a key element for the economic growth of a nation [74,75,76]. Hofstede [73,77] has identified different cultural dimensions that contribute to determining national culture. The four dimensions most commonly used and recognized are: “Power distance”, an indicator of unfairness in relationships and in the justice system, “Individualism”, which describes the adoption of an individualistic system or collectivist behavior [78], “Masculinity” which includes aspects of competitiveness and success related to gender, and “Uncertainty and avoidance” which expresses the preference for situations of certainty and stability [77]. The index that can be derived from these different cultural dimensions can be used to define a “Cultural distance” coefficient between two different nations. Among the different estimation methods, the most widely used [79] is the approach proposed by Kogut-Singh [80] (4):
where CDij is the cultural distance index between the two countries i and j, Ii is the ith cultural dimension for the two states, Vi is the variance of the data sample of the cultural dimension considered, and n is the number of cultural dimensions used in the estimation [80], equal to 4 in the formulation used for the present study. For example, this methodology has been used for the study of the effect of cultural distance on UK exports [53] or more generally to establish the relationship between trade and cultural distance [81]. The results identify a negative influence on international trade.
The coefficients obtained for continuous covariates are interpreted directly in terms of elasticity, whereas for the dummy variables, the coefficient is interpreted according to the formulation: (e(β dummy) − 1) × 100 [82].
The main statistics of the variables employed in the present research are reported in Table 1.
Econometric analysis was carried out using the statistical processing software STATA [83], version 15.1, adding the “ppml” tool to perform the PPML estimation [62]. In order to compare and identify the best performing and statistically consistent methodology, the three econometric models previously illustrated (OLS, PPML and Heckman) were used.
To verify the adequacy of the econometric models, the heteroscedasticity-robust “Ramsey RESET test” [84] was performed by adding an additional regressor, to verify the hypothesis of misspecification (possible non-linearity) and the possible omission of variables in the model.
2.3. Data Sample
In order to estimate a realistic model of the international honey trade, the main commercial partners were selected, similar to other econometric studies [60]. The selection covered 24 countries: Argentina, Belgium, Brazil, Canada, China, Ethiopia, France, Germany, Hungary, India, Iran, Japan, South Korea, Mexico, Poland, Romania, Russia, Slovenia, Spain, the United Kingdom, Tanzania, Turkey, Ukraine, and the United States [1,3] representing over 80% of total exports and approximately 80% of global honey imports and production.
The dataset is in a panel form, with observations that cover a period of 15 years, from 2003 to 2017, for a total of 8280 records. However, for two of the covariates used, i.e., apparent consumption (Food) and cultural distance (CultDist), there are fewer observations, due to the lack of data available in the official databases consulted. The variable Tradeij has a large rate of zero values in the dataset used (5021 of 8280 total observations).
3. Results and Discussion
For all models, 6177 of the 8280 observations were used, because the combined partial lack of observations for two covariates (apparent consumption and cultural distance) led to the selection of only those records whose explanatory variables were all present.
The comparison of the results obtained by the three models showed significant differences between the estimated coefficients (Table 2). However, the Ramsey RESET test led to the rejection of the OLS and Heckman models, as the alternative hypothesis of model misspecification must be accepted (p-values much lower than 1%). Only the PPML proved to be robust, as it did not reject the null hypothesis, and therefore we will only refer to the latter model in the analysis of the results obtained. The variable GDPi,t−1 (lagged GDP for the exporter) has been omitted due to the collinearity with the other covariates, so it will not be reported in the table of results. The lagged GDP helped the model to account for heteroscedasticity.
The interpretation of the coefficient obtained for the importing country is significant (p < 0.01) and shows the expected positive sign: an elasticity equal to 0.62 means that a 1% increase in GDP (accumulated wealth of the previous year) corresponds to a 0.62% increase in the trade flow. Although the GDP coefficient is generally reported to be close to or higher than 1 [62], often the effect of a nation’s economic dimension may have a smaller influence when analyzing trade of single products, as in the case of specific categories of fish products, which obtained coefficients comparable to those obtained for honey [58]. Comparable effects have also been obtained by Serrano [85] for several categories of agro-food products and commodities, in addition to Johnston [57], who analyzed trade relations between China and Africa. GDP effects of the same entity have also been highlighted at a disaggregated level with regard to grains and vegetables, as reported by Jayasinghe and Sarker [86] for the NAFTA market. Moreover, similar values of impact on exports by the economic dimension of trading partners were also highlighted at an aggregate product level, as reported by Balogh and Leitão [87] for the EU market. Considering this, the influence of the economic dimension of the importers on the honey trade fully reflects the behavior of other raw and processed agro-food products.
The distance between the two partners was statistically significant (elasticity equal to 0.401), despite a lower level of significance (p < 0.1): a 1% increase in distance, therefore, leads to a 0.4% decrease in trade flow, similar to what emerged from other studies on different products [60,88,89]. The distance between the two partners, used as a proxy for transport costs, therefore has a negative effect on honey trade flows, although this effect is less pronounced than reported in literature [71], perhaps in relation to the niche characteristics of the honey sector. Moreover, the long shelf-life characteristics of the product (more than 12 months) [90], combined with the lower price that large quantities of honey can achieve on the market, especially for industrial use, may affect the reduced impact of the distance between trading partners in trade flows.
The apparent consumption of the importer has a significant and positive effect on the honey trade: it is one of the strongest effects among those analyzed, with an elasticity of 0.980. This parameter has an intermediate magnitude compared to other studies, such as for seafood products [58], where it has a lower value, or as in the case of distillates in the United States, where consumption has a much greater effect [91]. Honey consumption is characterized by its multiplicity of uses, both in the food and non-food sectors, in many cases established at a traditional level [92,93] which extend the market segments to which this product has access.
Honey consumption is one of the main drivers of honey trade flows and shows an increasing trend at international level, mainly due to population growth and to the growing demand for natural food [6], especially in Europe and the United States in the last decade, for example [2,94].
The importer’s domestic supply, as expected, was significant with a negative effect on the volume of imports: the negative elasticity found (−0.603) means that an increase of 1% in domestic production is followed by a decrease of 0.6% in imports, confirming the presence of the so-called “home bias effect” [60,95].
This phenomenon has been highlighted several times with regard to both agricultural and food products, where differentiation and processing are greater [96], influencing the perception of consumers and companies, or even influencing the application of agricultural policies to protect and promote local production and consumption [97].
The impact of the “home bias effect” on food products has also been highlighted by analyzing markets and imports in the USA for such processed food products, as milk, vegetables, or alcoholic beverages [98,99]. Even in the case of wine, a much-studied product from this point of view, it has already been demonstrated how local production can be recognized as an element of competitiveness on the national market in terms of quality and price [100]. Therefore, for honey as well, similar elements that stimulate the consumption of locally produced honey can be gathered.
Regarding the trade variables, the only ones that were found to be significant were the common membership of the EU and participation in GATT or WTO, whereas the presence of free trade agreements or bilateral agreements does not appear to significantly affect trade in honey. The common membership of the European Union and, therefore, of the European single market, has a positive effect, with a coefficient higher than 1.9. The result obtained is in line with the study by Serrano [85], which showed a fair heterogeneity between the values of this parameter, in relation to the type of product considered. The highlighted positive effect can be easily understood considering that the members of the European single market have homogeneous import regulations and trade standards and that the removal of tariff and non-tariff barriers within the same market strongly encourages intra-EU trade flows [101].
Finally, membership of the GATT shows a coefficient higher than 2.7, as also highlighted by the study of [43] and similar to the results of Balogh and Jámbor [102]. Following the same logic, membership of the WTO, or signing of the GATT agreements, has also led to positive and statistically significant effects on trade flows [103,104], including those of honey at world level.
Concerning the socio-cultural variables, both have the expected sign, but only the common official language shows a statistically significant effect and a coefficient equal to 0.75, which corresponds to an increase of more than 110% of trade. The result is in line with expectations and in accordance with other studies on socio-cultural variables affecting international trade [43,102].
Finally, the cultural distance investigated by the Kogut-Singh Index [80] and considering the four main cultural dimensions developed by Hofstede [73] does not show any statistically significant effect, contrary to the results of a recent study which identified a significant effect, although a small negative impact [53]. However, cultural distance effect may not follow a linear relationship, as suggested by Lankhuizen [81], which in fact reports how the relationship can be non-linear and have a significant effect only when the distance becomes high: the threshold value of this index, in order to observe a significant effect, has been identified as 4.9. This value is present only in 90 observations in the database subject of this study. It should also be considered that for some countries the values of the different cultural dimensions are not available, generating a lack of observations that may lead to a less reliable estimate of this parameter.
4. Conclusions
The growing honey production and trade on the world stage has generated interest in studying this phenomenon. The purpose of this paper was to verify the economic and cultural determinants influencing the global trade in honey, using an econometric methodology widely established in the field. To this aim, a panel dataset of observations covering the period from 2003 to 2017 for the world’s major honey trading partners was considered, comprising over 80% of the volume of international trade and production.
The main innovation of this study is represented by the sector in which this methodology has been applied: in fact, there are no studies conducted on honey with the structural gravity model methodology and with an international outlook. Furthermore, the focus on honey has only recently started to intensify again, as a consequence of the renewed interest in quality certifications and food safety standards applicable to it. Despite this, most of the studies focus on consumer and health aspects of the product, thus leaving wide potential for further in-depth study on trade-related aspects. Additionally, media influence together with concerns about the negative health effects of food fraud of this product have raised awareness, firstly of consumers and, secondly, of researchers. Another innovative factor is the study of socio-cultural variables in relation to trade: although this is a long-established relationship, it is still of current interest and rarely applied to niche products. Moreover, similar studies to this study often do not include complex cultural variables, such as those related to cultural dimensions in Hofstede’s approach [77]. Despite the non-significance of the variable of cultural influence given by cultural dimensions, the obtained results provide a useful application key to other economic studies for the inclusion of complex cultural variables. The results obtained show that the factors influencing the honey trade do not differ significantly from those obtained for other agro-food products, but the absence of consistent literature on international trade related to this product makes it difficult to establish clearer relationships and make more robust comparisons between different economic and trade scenarios.
This work also has limitations related to the use of only partial data on international trade: although the study analyzed the main honey trading nations, it only represents a starting point for researchers, since it does not represent the whole of existing trade flows. Further studies could extend the data baseline in order to provide an even more complete overview of global trade flows, including not only the main global honey traders, but also the smaller trading partners on the international scene.
In addition, the lack of data on tariff and non-tariff measures related to honey reduces the considerations that can be made about the trade of this product. With a desirable increased availability of data in the future, particularly for technical barriers to trade (TBT) and sanitary and phytosanitary measures (SPS), which are still extremely heterogeneous across countries, useful measures can will be made by policy makers.
Further econometric studies could also be focused, with greater data availability, more specifically on the organic honey market and trade, which has shown a greater aptitude for environmental sustainability in particular, and which is gaining interest for consumers.
This research therefore provides a useful starting point for further in-depth studies in the honey trade sector, also highlighting how niche products, with moderate economic relevance in a country’s agri-food basket, fully reflect the market behavior of the major commodities in the agri-food sector.
Moreover, the analysis of these trade flows can act as a useful basis for international organizations monitoring and orienting the market (e.g., the WTO at a global level for goods and services and the International Honey Commission specifically for the honey trade). Further specific applications on the issues that most characterize this trade, such as honey fraud issues or the harmonization of quality standards, will be useful. In order to draft internationally recognized regulations that can contribute to the establishment of trade flows of products with high quality and traceability standards, other studies will be useful for policy makers. In fact, the lack of consistent literature and regulations on honey quality and trade standards is another potential field of study, in which this type of econometric approach could successfully be applied in the future.
Author Contributions
Conceptualization, L.P. and S.B.; data collection, investigation, and methodology, L.P.; formal analysis, L.P.; validation: F.B., S.B., and T.M.; writing—original draft preparation, L.P., S.B., and T.M.; writing—review and editing, L.P., F.B., S.B., and T.M.; supervision, F.B., T.M., and S.B.; project administration (related to the WP4), T.M.; funding acquisition, T.M. All authors have read and agreed to the published version of the manuscript.
Funding
This research was funded by the European Union, INTERREG V-A France–Italie (ALCOTRA) (2014–2020)—“INNOV’API (n. 1580)—Innovation sanitaire pour la durabilité des exploitations apicoles”.
Conflicts of Interest
The authors declare no conflict of interest.
References
- FAOSTAT-Food and Agriculture Data. Available online: http://www.fao.org/faostat/en/#data (accessed on 15 May 2019).
- Blanc, S.; Brun, F.; Mosso, A.; Pippinato, L.; Zanchini, R. Una Panoramica di Struttura, Produzioni e Commercio del Miele; DISAFA–University of Turin Publishing: Turin, Italy, 2019; ISBN 978-88-99108-12-0. [Google Scholar]
- UN Comtrade-United Nations Commodity Trade Statistic Database. Available online: https://comtrade.un.org/data (accessed on 14 May 2019).
- Pippinato, L.; Di Vita, G.; Brun, F. Trade and comparative advantage analysis of the EU honey sector with a focus on the Italian market. Qual. Access Success 2019, 20, 485–492. [Google Scholar]
- Blanc, S.; Brun, F.; Di Vita, G.; Mosso, A. Traditional beekeeping in rural areas. Profitability analysis and feasibility of pollination service. Qual. Access Success 2019, 19, 72–79. [Google Scholar]
- García, N.L. The Current Situation on the International Honey Market. Bee World 2018, 95, 89–94. [Google Scholar] [CrossRef]
- FAO. Codex Standard for Honey. Food and Agriculture Organization of the United Nations (FAO). 1981. Available online: http://www.fao.org/tempref/codex/Meetings/CCS/ccs7/S00_03e.pdf (accessed on 18 May 2019).
- US Department of Commerce–International Trade Administration. Honey from the People’s Republic of China: Continuation of Antidumping Duty Order. Fed. Regist. 2018, 83, 18277–18278. [Google Scholar]
- Thrasyvoulou, A.; Tananaki, C.; Goras, G.; Karazafiris, E.; Dimou, M.; Liolios, V.; Kanelis, D.; Gounari, S. Legislation of honey criteria and standards. J. Apic. Res. 2018, 57, 88–96. [Google Scholar] [CrossRef]
- European Council. Council directive 2001/110/EC of 20 December 2001 relating honey. Off. J. EC 2001, L10/47-52. [Google Scholar]
- European Commission. Note Expl. 61913: Explanatory Note on the Implementation of Council Directive 2001/110/EC Relating to Honey; European Commission: Brussels, Belgium, 2005; p. 9538. [Google Scholar]
- European Commission. Commission Regulation no 37/2010 of 22 December 2009 on Pharmacologically Active Substances and Their Classification Regarding Maximum Residue Limits in Foodstuffs of Animal Origin JO; European Commission: Brussels, Belgium, 2010; pp. 1–72. Available online: http://eur-lex.europa.eu/legal-content/EN/TXT/PDF/?uri=CELEX:32010R0037&from=EN (accessed on 5 December 2020).
- European Parliament. Regulation (EU) No 1169/2011 of the European parliament and of the council of 25 October 2011. Off. J. EU 2011, L304, 18–63. [Google Scholar]
- European Parliament. Directive 2014/63/EU of the European parliament and of the council of 15 May 2014 amending Council directive 2001/110/EC relating to honey. Off. J. EU 2014, L164, 1–5. [Google Scholar]
- Moore, J.C.; Spink, J.; Lipp, M. Development and application of a database of food ingredient fraud and economically motivated adulteration from 1980 to 2010. J. Food Sci. 2012, 77, R118–R126. [Google Scholar] [CrossRef]
- García, N.L. A study of the causes of falling honey prices in the international market. Am. Bee J. 2016, 156, 877–882. [Google Scholar]
- Wratten, S.D.; Gillespie, M.; Decourtye, A.; Mader, E.; Desneux, N. Pollinator habitat enhancement: Benefits to other ecosystem services. Agric. Ecos. Environ. 2012, 159, 112–122. [Google Scholar] [CrossRef]
- Mancuso, T.; Croce, L.; Vercelli, M. Total Brood Removal and Other Biotechniques for the Sustainable Control of Varroa Mites in Honey Bee Colonies: Economic Impact in Beekeeping Farm Case Studies in Northwestern Italy. Sustainability 2020, 12, 2302. [Google Scholar] [CrossRef] [Green Version]
- Vercelli, M.; Croce, L.; Mancuso, T. An Economic Approach to Assess the Annual Stock in Beekeeping Farms: The Honey Bee Colony Inventory Tool. Sustainability 2020, 12, 9258. [Google Scholar] [CrossRef]
- Traynor, K.S.; Mondet, F.; de Miranda, J.R.; Techer, M.; Kowallik, V.; Oddie, M.A.Y.; Chantawannakul, P.; McAfee, A. Varroa destructor: A Complex Parasite, Crippling Honey Bees Worldwide. Trends Parasitol. 2020, in press. [Google Scholar] [CrossRef] [PubMed]
- de Oliveira, E.R.; Muniz, E.B.; Soares, J.P.G.; Farias, M.D.F.L.; Gandra, J.R.; de Araújo Gabriel, A.M.; Malaquias, J.V.; Pereira, T.L. Environmental impacts of the conversion to organic honey production in family units of small farmers in Brazil. Org. Agric. 2019, 10, 187–197. [Google Scholar] [CrossRef]
- Allsopp, M.H.; de Lange, W.J.; Veldtman, R. Valuing Insect Pollination Services with Cost of Replacement. PLoS ONE 2008, 3, e3128. [Google Scholar] [CrossRef]
- Sama, C.; Crespo-Cebada, E.; Díaz-Caro, C.; Mesías, F.J. Análisis de las preferencias de los consumidores españoles hacia la miel de producción social y ambientalmente responsable frente a la de Comercio Justo. Arch. Zootec. 2019, 68, 495–503. [Google Scholar] [CrossRef] [Green Version]
- Vapa-Tankosić, J.; Ignjatijević, S.; Kiurski, J.; Milenković, J.; Milojević, I. Analysis of Consumers’ Willingness to Pay for Organic and Local Honey in Serbia. Sustainability 2020, 12, 1468. [Google Scholar] [CrossRef]
- Jensen, J.D.; Mørkbak, M.R. Role of gastronomic, externality and feasibility attributes in consumer demand for organic and local foods: The case of honey and apples. Int. J. Consum. Stud. 2013, 37, 634–641. [Google Scholar] [CrossRef]
- Ribeiro, M.I.; Fernandes, A.J.; Cabo, P.S.; Diniz, F.J. Trends in Honey Purchase and Consumption in Trás-os-Montes Region, Portugal. Econ. Reg. 2019, 15, 822–833. [Google Scholar] [CrossRef]
- Khaoula, B.; Zineb, N.; Zakaria, A.; Abdelmajid, S.; Asmae, C.; Abderrazak, K. Consumption, preferences and habits of purchasing consumers of honey in Morocco. J. Hyg. Eng. Des. 2019, 28, 61–65. [Google Scholar]
- Brun, F.; Zanchini, R.; Mosso, A.; Di Vita, G.A. Testing consumer propensity towards novel optional quality terms: An explorative assessment of “mountain” labelled honey. AIMS Agric. Food 2020, 5, 190–203. [Google Scholar] [CrossRef]
- Arvanitoyannis, I.; Krystallis, A. An empirical examination of the determinants of honey consumption in Romania. Int. J. Food Sci. Tech. 2006, 41, 1164–1176. [Google Scholar] [CrossRef]
- Djekic, I.; Jambrak, A.R.; Djugum, J.; Rajkovic, A. How the food industry experiences and perceives food fraud. Qual. Assur. Saf. Crops Foods 2018, 10, 325–333. [Google Scholar] [CrossRef]
- Jones Ritten, C.; Thunström, L.; Ehmke, M.; Beiermann, J.; McLeod, D. International honey laundering and consumer willingness to pay a premium for local honey: An experimental study. Aust. J. Agric. Resour. Econ. 2019, 63, 726–741. [Google Scholar] [CrossRef]
- Tinbergen, J. Shaping the World Economy; Suggestions for an International Economic Policy; The Twentieth Century Fund: New York, NY, USA, 1962. [Google Scholar]
- Beine, M.; Bertoli, S.; Fernández-Huertas Moraga, J. A practitioners’ guide to gravity models of international migration. World Econ. 2016, 39, 496–512. [Google Scholar] [CrossRef] [Green Version]
- Belot, M.; Ederveen, S. Cultural barriers in migration between OECD countries. J. Popul. Econ. 2012, 25, 1077–1105. [Google Scholar] [CrossRef] [Green Version]
- Ghazalian, P.L.; Tamini, L.D.; Larue, B.; Gervais, J.P. A Gravity Model to Account for Vertical Linkages between Markets with an Application to the Cattle/Beef Sector. J. Int. Trade Econ. Dev. 2012, 21, 579–601. [Google Scholar] [CrossRef]
- Shahriar, S.; Qian, L.; Kea, S. Determinants of Exports in China’s Meat Industry: A Gravity Model Analysis. Emerg. Mark. Fin. Trade 2019, 55, 2544–2565. [Google Scholar] [CrossRef]
- Thompson, J.M. Effects of regionalized trade restrictions on quantity exported during a highly pathogenic avian influenza event. J. Agric. Appl. Econ. 2018, 50, 270–289. [Google Scholar] [CrossRef] [Green Version]
- Webb, M.; Gibson, J.; Strutt, A. The impact of diseases on international beef trade: Market switching and persistent effects. Food Policy 2018, 75, 93–108. [Google Scholar] [CrossRef]
- Chen, R.; Hartarska, V.; Wilson, N.L. The causal impact of HACCP on seafood imports in the US: An application of difference-in-differences within the gravity model. Food Policy 2018, 79, 166–178. [Google Scholar] [CrossRef]
- Kuo, T.C.; Vincent, A. Assessing the changes in international trade of marine fishes under CITES regulations—A case study of seahorses. Mar. Policy 2018, 88, 48–57. [Google Scholar] [CrossRef]
- Wang, P.; Tran, N.; Wilson, N.L.; Chan, C.Y.; Dao, D. An analysis of seafood trade duration: The case of ASEAN. Mar. Res. Econ. 2019, 34, 59–76. [Google Scholar] [CrossRef]
- Agostino, M.; Trivieri, F. Geographical indication and wine exports. An empirical investigation considering the major European producers. Food Policy 2014, 46, 22–36. [Google Scholar] [CrossRef]
- Castillo, J.S.; Villanueva, E.C.; García-Cortijo, M.C. The international wine trade and its new export dynamics (1988–2012): A gravity model approach. Agribusiness 2016, 32, 466–481. [Google Scholar] [CrossRef]
- Dal Bianco, A.; Orrego, M.J.E.; Boatto, V.; Gennari, A.J. Is Mercosur promoting trade? Insights from Argentinean wine exports. Span. J. Agric. Res. 2017, 15, 1–8. [Google Scholar] [CrossRef] [Green Version]
- Fiankor, D.D.D.; Martínez-Zarzoso, I.; Brümmer, B. Exports and governance: The role of private voluntary agrifood standards. J. Agric. Econ. 2019, 50, 341–352. [Google Scholar] [CrossRef]
- Irandu, E.M. Factors influencing growth of horticultural exports in Kenya: A gravity model analysis. GeoJournal 2019, 84, 877–887. [Google Scholar] [CrossRef]
- Kavallari, A.; Maas, S.; Schmitz, P.M. Examining the determinants of olive oil demand in nonproducing countries: Evidence from Germany and the UK. J. Food Prod. Mark. 2011, 17, 355–372. [Google Scholar] [CrossRef]
- Kashiwagi, K.; Yamna, E.; Arfa, L.; Zaibet, L. Growing Olive Oil Export and Intra-Industry Trade in Mediterranean Countries: Application of Gravity Model. Sustaninability 2020, 12, 7027. [Google Scholar] [CrossRef]
- Crivelli, P.; Gröschl, J. The impact of sanitary and phytosanitary measures on market entry and trade flows. World Econ. 2016, 39, 444–473. [Google Scholar] [CrossRef] [Green Version]
- Santeramo, F.G.; Lamonaca, E. The Effects of Non-tariff Measures on Agri-food Trade: A Review and Meta-analysis of Empirical Evidence. J. Agric. Econ. 2019, 70, 595–617. [Google Scholar] [CrossRef] [Green Version]
- Winchester, N.; Rau, M.L.; Goetz, C.; Larue, B.; Otsuki, T.; Shutes, K.; Nunes de Faria, R. The impact of regulatory heterogeneity on agri-food trade. World Econ. 2012, 35, 973–993. [Google Scholar] [CrossRef]
- Wei, G.X.; Huang, J.K.; Jun, Y. Honey safety standards and its impacts on China’s honey export. J. Integr. Agric. 2012, 11, 684–693. [Google Scholar] [CrossRef]
- Kristjánsdóttir, H.; Guðlaugsson, Þ.Ö.; Guðmundsdóttir, S.; Aðalsteinsson, G.D. Cultural and geographical distance: Effects on UK exports. Appl. Econ. Lett. 2020, 27, 275–279. [Google Scholar] [CrossRef]
- Anderson, J.E.; Van Wincoop, E. Gravity with gravitas: A solution to the border puzzle. Am. Econ. Rev. 2003, 93, 170–192. [Google Scholar] [CrossRef] [Green Version]
- WB-World Bank Open Data. Available online: https://data.worldbank.org (accessed on 14 May 2019).
- CEPII-Gravity Dataset. Available online: http://www.cepii.fr/CEPII/en/bdd_modele/download.asp?id=8 (accessed on 9 May 2019).
- Johnston, L.A.; Morgan, S.L.; Wang, Y. The gravity of China’s African export promise. World Econ. 2015, 38, 913–934. [Google Scholar] [CrossRef]
- Natale, F.; Borrello, A.; Motova, A. Analysis of the determinants of international seafood trade using a gravity model. Mar. Policy 2015, 60, 98–106. [Google Scholar] [CrossRef]
- Morland, C.; Schier, F.; Weimar, H. The Structural Gravity Model and Its Implications on Global Forest Product Trade. Forests 2020, 11, 178. [Google Scholar] [CrossRef] [Green Version]
- Dal Bianco, A.; Ladislao Boatto, V.; Caracciolo, F.; Santeramo, F.G. Tariffs and Non-tariff Frictions in the World Wine Trade. Eur. Rev. Agric. Econ. 2016, 43, 31–57. [Google Scholar] [CrossRef] [Green Version]
- Baldwin, R.; Taglioni, D. Gravity for Dummies and Dummies for Gravity Equations, Working Paper No. 12516; National Bureau of Economic Research: Cambridge, MA, USA, 2006. [Google Scholar]
- Santos Silva, J.S.; Tenreyro, S. The Log of Gravity. Rev. Econ. Stat. 2006, 88, 641–658. [Google Scholar] [CrossRef] [Green Version]
- Yotov, Y.V.; Piermartini, R.; Monteiro, J.A.; Larch, M. An Advanced Guide to Trade Policy Analysis: The Structural Gravity Model; The World Trade Organization: Geneva, Switzerland, 2016. [Google Scholar]
- Gómez-Herrera, E. Comparing alternative methods to estimate gravity models of bilateral trade. Empir. Econ. 2013, 44, 1087–1111. [Google Scholar] [CrossRef] [Green Version]
- Heckman, J.J. Sample Selection Bias as a Specification Error (with an Application to the Estimation of Labor Supply Function)-Working Paper No. 172; National Bureau of Economic Research: Stanford, CA, USA, 1977. [Google Scholar]
- Helpman, E.; Melitz, M.; Rubinstein, Y. Estimating trade flows: Trading partners and trading volumes. Q. J. Econ. 2007, 123, 441–487. [Google Scholar] [CrossRef] [Green Version]
- Fally, T. Structural gravity and fixed effects. J. Int. Econ. 2015, 97, 76–85. [Google Scholar] [CrossRef] [Green Version]
- Santos Silva, J.S.; Tenreyro, S. Further simulation evidence on the performance of the Poisson pseudo-maximum likelihood estimator. Econ. Lett. 2011, 112, 220–222. [Google Scholar] [CrossRef] [Green Version]
- Krisztin, T.; Fischer, M.M. The gravity model for international trade: Specification and estimation issues. Spat. Econ. Anal. 2015, 10, 451–470. [Google Scholar] [CrossRef]
- WTO-World Trade Organization Trade and Tariff Data. Available online: https://data.wto.org (accessed on 12 May 2019).
- Disdier, A.C.; Head, K. The puzzling persistence of the distance effect on bilateral trade. Rev. Econ. Stat. 2008, 90, 37–48. [Google Scholar] [CrossRef]
- Head, K.; Mayer, T.; Ries, J. The erosion of colonial trade linkages after independence. J. Int. Econ. 2010, 81, 1–14. [Google Scholar] [CrossRef] [Green Version]
- Hofstede, G. Culture’s Consequences: Comparing Values, Behaviors, Institutions and Organizations across Nations; SAGE Publications: Thousand Oaks, CA, USA, 2001. [Google Scholar]
- Weber, M. The Theory of Social and Economic Organization; Free Press: New York, NY, USA, 1947. [Google Scholar]
- Zaheer, S.; Zaheer, A. Country effects on information seeking in global electronic networks. J. Int. Bus. Stud. 1997, 28, 77–100. [Google Scholar] [CrossRef]
- Brown, T.E.; Ulijn, J.M. Innovation, Entrepreneurship and Culture: The Interaction between Technology, Progress and Economic Growth; Edward Elgar Publishing: Northampton, MA, USA, 2004. [Google Scholar]
- Hofstede, G.; Hofstede, G.J.; Minkow, M. Cultures and Organizations, Software of the Mind; McGraw-Hill Education: New York, NY, USA, 1991. [Google Scholar]
- Kristjánsdóttir, H.; Guðlaugsson, Þ.Ö.; Guðmundsdóttir, S.; Aðalsteinsson, G.D. Hofstede national culture and international trade. Appl. Econ. 2017, 49, 5792–5801. [Google Scholar] [CrossRef]
- Kaasa, A.; Vadi, M.; Varblane, U. A new dataset of cultural distances for European countries and regions. Res. Int. Bus. Fin. 2016, 37, 231–241. [Google Scholar] [CrossRef]
- Kogut, B.; Singh, H. The Effect of National Culture on the Choice of Entry Mode. J. Int. Bus. Stud. 1988, 19, 411–432. [Google Scholar] [CrossRef]
- Lankhuizen, M.B.M.; de Groot, H.L.F. Cultural distance and international trade: A non-linear relationship. Lett. Spat. Res. Sci. 2016, 9, 19–25. [Google Scholar] [CrossRef]
- Baier, S.L.; Bergstrand, J.H. Do free trade agreements actually increase members’ international trade? J. Int. Econ. 2007, 71, 72–95. [Google Scholar] [CrossRef] [Green Version]
- StataCorp-STATA. Statistical Software: Release 15; StataCorp LLC: College Station, TX, USA, 2017. [Google Scholar]
- Ramsey, J.B. Tests for specification errors in classical linear least-squares regression analysis. J. R. Stat. Soc. Ser. B (Meth.) 1969, 31, 350–371. [Google Scholar] [CrossRef]
- Serrano, R.; Gil-Pareja, S.; Llorca-Vivero, R.; García-Casarejos, N.; Pinilla, V. The internationalisation of the Spanish food industry: The home market effect and European market integration. Span. J. Agric. Res. 2015, 13, 1–4. [Google Scholar] [CrossRef] [Green Version]
- Jayasinghe, S.; Sarker, R. Effects of regional trade agreements on trade in agrifood products: Evidence from gravity modeling using disaggregated data. Rev. Agric. Econ. 2008, 30, 61–81. [Google Scholar] [CrossRef] [Green Version]
- Balogh, J.M.; Leitão, N.C. A gravity approach of agricultural trade: The nexus of the EU and African, Caribbean and Pacific countries. Agric. Econ. (Czech Rep.) 2019, 65, 509–519. [Google Scholar] [CrossRef] [Green Version]
- Crescimanno, M.; Galati, A.; Yahiaoui, D. Determinants of Italian agri-food exports in non-EU Mediterranean Partner Countries: An empirical investigation through a gravity model approach. New Med. 2013, 12, 46–55. [Google Scholar]
- Thuong, N.T.T. The effect of Sanitary and Phytosanitary measures on Vietnam’s rice exports. Economia 2018, 19, 251–265. [Google Scholar] [CrossRef]
- Fallico, B.; Arena, E.; Zappala, M. Prediction of honey shelf life. J. Food Qual. 2009, 32, 352–368. [Google Scholar] [CrossRef]
- De Matteis, M.C.; Yu, T.E.; Boyer, C.N.; DeLong, K.L. Analyzing determinants of US distillers dried grains with solubles exports. Agribusiness 2019, 35, 168–181. [Google Scholar] [CrossRef]
- Miguel, M.G.; Antunes, M.D.; Faleiro, M.L. Honey as a Complementary Medicine. Integr. Med. Int. 2017, 12, 1–15. [Google Scholar] [CrossRef] [PubMed] [Green Version]
- Šedík, P.; Pocol, C.B.; Horská, E.; Fiore, M. Honey: Food or medicine? A comparative study between Slovakia and Romania. Br. Food J. 2019, 121, 1281–1297. [Google Scholar] [CrossRef]
- Shahbandeh, M. Honey Market Worldwide and in the U.S.-Statistics & Facts. Statista.com. 2019. Available online: https://0-www-statista-com.brum.beds.ac.uk/statistics/328897/per-capita-consumption-of-pure-honey-in-the-us/ (accessed on 5 December 2020).
- Lombardi, P.; Dal Bianco, A.; Freda, R.; Caracciolo, F.; Cembalo, L. Development and trade competitiveness of the European wine sector: A gravity analysis of intra-EU flows. Wine Econ. Policy 2016, 5, 50–59. [Google Scholar] [CrossRef] [Green Version]
- Ghazalian, P.L. Home Bias in Primary Agricultural and Processed Food Trade: Assessing the Effects of National Degree of Uncertainty Aversion. J. Agric. Econ. 2011, 63, 265–290. [Google Scholar] [CrossRef]
- Eriksson, C. Home bias in preferences and the political economics of agricultural protection. Rev. Agric. Environ. Stud. 2011, 92, 5–23. [Google Scholar]
- Lopez, R.A.; Pagoulatos, E.; Gonzalez, M.A. Home bias and US imports of processed food products. N. Am. J. Econ. Fin. 2006, 17, 363–373. [Google Scholar] [CrossRef]
- Olper, A.; Raimondi, V. Market access asymmetry in food trade. Rev. World Econ. 2008, 144, 509–537. [Google Scholar] [CrossRef] [Green Version]
- Ayuda, M.I.; Ferrer-Pérez, H.; Pinilla, V. Explaining world wine exports in the first wave of globalization, 1848–1938. J. Wine Econ. 2020, 15, 263–283. [Google Scholar] [CrossRef]
- in’t Veld, J. The economic benefits of the EU Single Market in goods and services. J. Policy Model. 2019, 41, 803–818. [Google Scholar] [CrossRef]
- Balogh, J.M.; Jámbor, A. The role of culture, language and trade agreements in global wine trade. AGRIS Online Pap. Econ. Inform. 2018, 10, 17–29. [Google Scholar] [CrossRef]
- Chang, P.L.; Lee, M.J. The WTO trade effect. J. Int. Econ. 2011, 85, 53–71. [Google Scholar] [CrossRef]
- Larch, M.; Monteiro, J.A.; Piermartini, R.; Yotov, Y. On the Effects of GATT/WTO Membership on Trade: They are Positive and Large after All. Working Paper ERSD-2019-09; WTO: Geneva, Switzerland, 2019. [Google Scholar]
Figure 1.
2017 Honey exporting country in tonnes (Source UN Comtrade).

Figure 2.
2017 Honey importing country in tonnes (Source UN Comtrade).


Table 1.
Descriptive statistics of the variables used in the study.
| Variable | Type | u.m. | Obs. | Median | Mean | St. Dev. | Min | Max |
|---|---|---|---|---|---|---|---|---|
| Tradeij | Continuous | Mn USD | 8280 | 0.0 | 1.4 | 6.9 | 0 | 142.0 |
| GDPj,t−1 | Continuous | Bn USD | 8280 | 826.5 | 1915.9 | 3219.9 | 7.9 | 18,707.2 |
| Distij | Continuous | km | 8280 | 6800.1 | 6602.3 | 4220.3 | 196.9 | 19,447.4 |
| Foodj | Continuous | t | 8119 | 32,131.7 | 53,289.6 | 69,706.4 | 1004.7 | 440,577.4 |
| Prodj | Continuous | t | 8280 | 32,336.0 | 52,469.3 | 81,944.2 | 471 | 562,875 |
| Cultdistij | Continuous | - | 6297 | 1.3 | 1.6 | 1.1 | 0.1 | 5.2 |
| Comlangij | Dummy | - | 8280 | 0 | 0.1 | 0.3 | 0 | 1 |
| GATTij | Dummy | - | 8280 | 1 | 0.8 | 0.4 | 0 | 1 |
| EUij | Dummy | - | 8280 | 0 | 0.1 | 0.3 | 0 | 1 |
| FTAij | Dummy | - | 8280 | 0 | 0.3 | 0.4 | 0 | 1 |
Table 2.
Estimated gravity models for international honey exports from 2003 to 2017.
| OLS (ln 1 + Trade) | Heckman (lnTrade) | PPML (Trade) | |
|---|---|---|---|
| lnGDPj,t−1 | 0.25 *** | 0.62 *** | 0.62 *** |
| lnDistij | −0.14 ** | −0.48 *** | −0.41 ** |
| lnFoodj | 0.01 | 0.18 *** | 0.97 *** |
| lnProdj | −0.10 *** | −0.30 *** | −0.59 *** |
| Comlangij | 0.17 | 0.67 *** | 0.79 * |
| Cultdistij | 0.01 | 0.53 *** | −0.10 |
| GATTij | 0.01 *** | 0.58 *** | 2.74 *** |
| EUij | 0.43 *** | 1.43 *** | 1.94 *** |
| FTAij | 0.10 | −0.16 | 0.33 |
| N. of obs. | 6177 | 6177 | 6177 |
| Ramsey RESET Test | 0.000 *** | 0.000 *** | 0.67 |
Levels of statistical significance: * p < 0.1; ** p < 0.05; *** p < 0.01.
Publisher’s Note: MDPI stays neutral with regard to jurisdictional claims in published maps and institutional affiliations. |
© 2020 by the authors. Licensee MDPI, Basel, Switzerland. This article is an open access article distributed under the terms and conditions of the Creative Commons Attribution (CC BY) license (http://creativecommons.org/licenses/by/4.0/).
Share and Cite
MDPI and ACS Style
Pippinato, L.; Blanc, S.; Mancuso, T.; Brun, F. A Sustainable Niche Market: How Does Honey Behave? Sustainability 2020, 12, 10678. https://0-doi-org.brum.beds.ac.uk/10.3390/su122410678
AMA Style
Pippinato L, Blanc S, Mancuso T, Brun F. A Sustainable Niche Market: How Does Honey Behave? Sustainability. 2020; 12(24):10678. https://0-doi-org.brum.beds.ac.uk/10.3390/su122410678
Chicago/Turabian StylePippinato, Liam, Simone Blanc, Teresina Mancuso, and Filippo Brun. 2020. "A Sustainable Niche Market: How Does Honey Behave?" Sustainability 12, no. 24: 10678. https://0-doi-org.brum.beds.ac.uk/10.3390/su122410678
Note that from the first issue of 2016, this journal uses article numbers instead of page numbers. See further details here.