Preliminary Screening for Microplastic Concentrations in the Surface Water of the Ob and Tom Rivers in Siberia, Russia

 ,
,  , ,
, , 
Abstract
:
1. Introduction
2. Materials and Methods
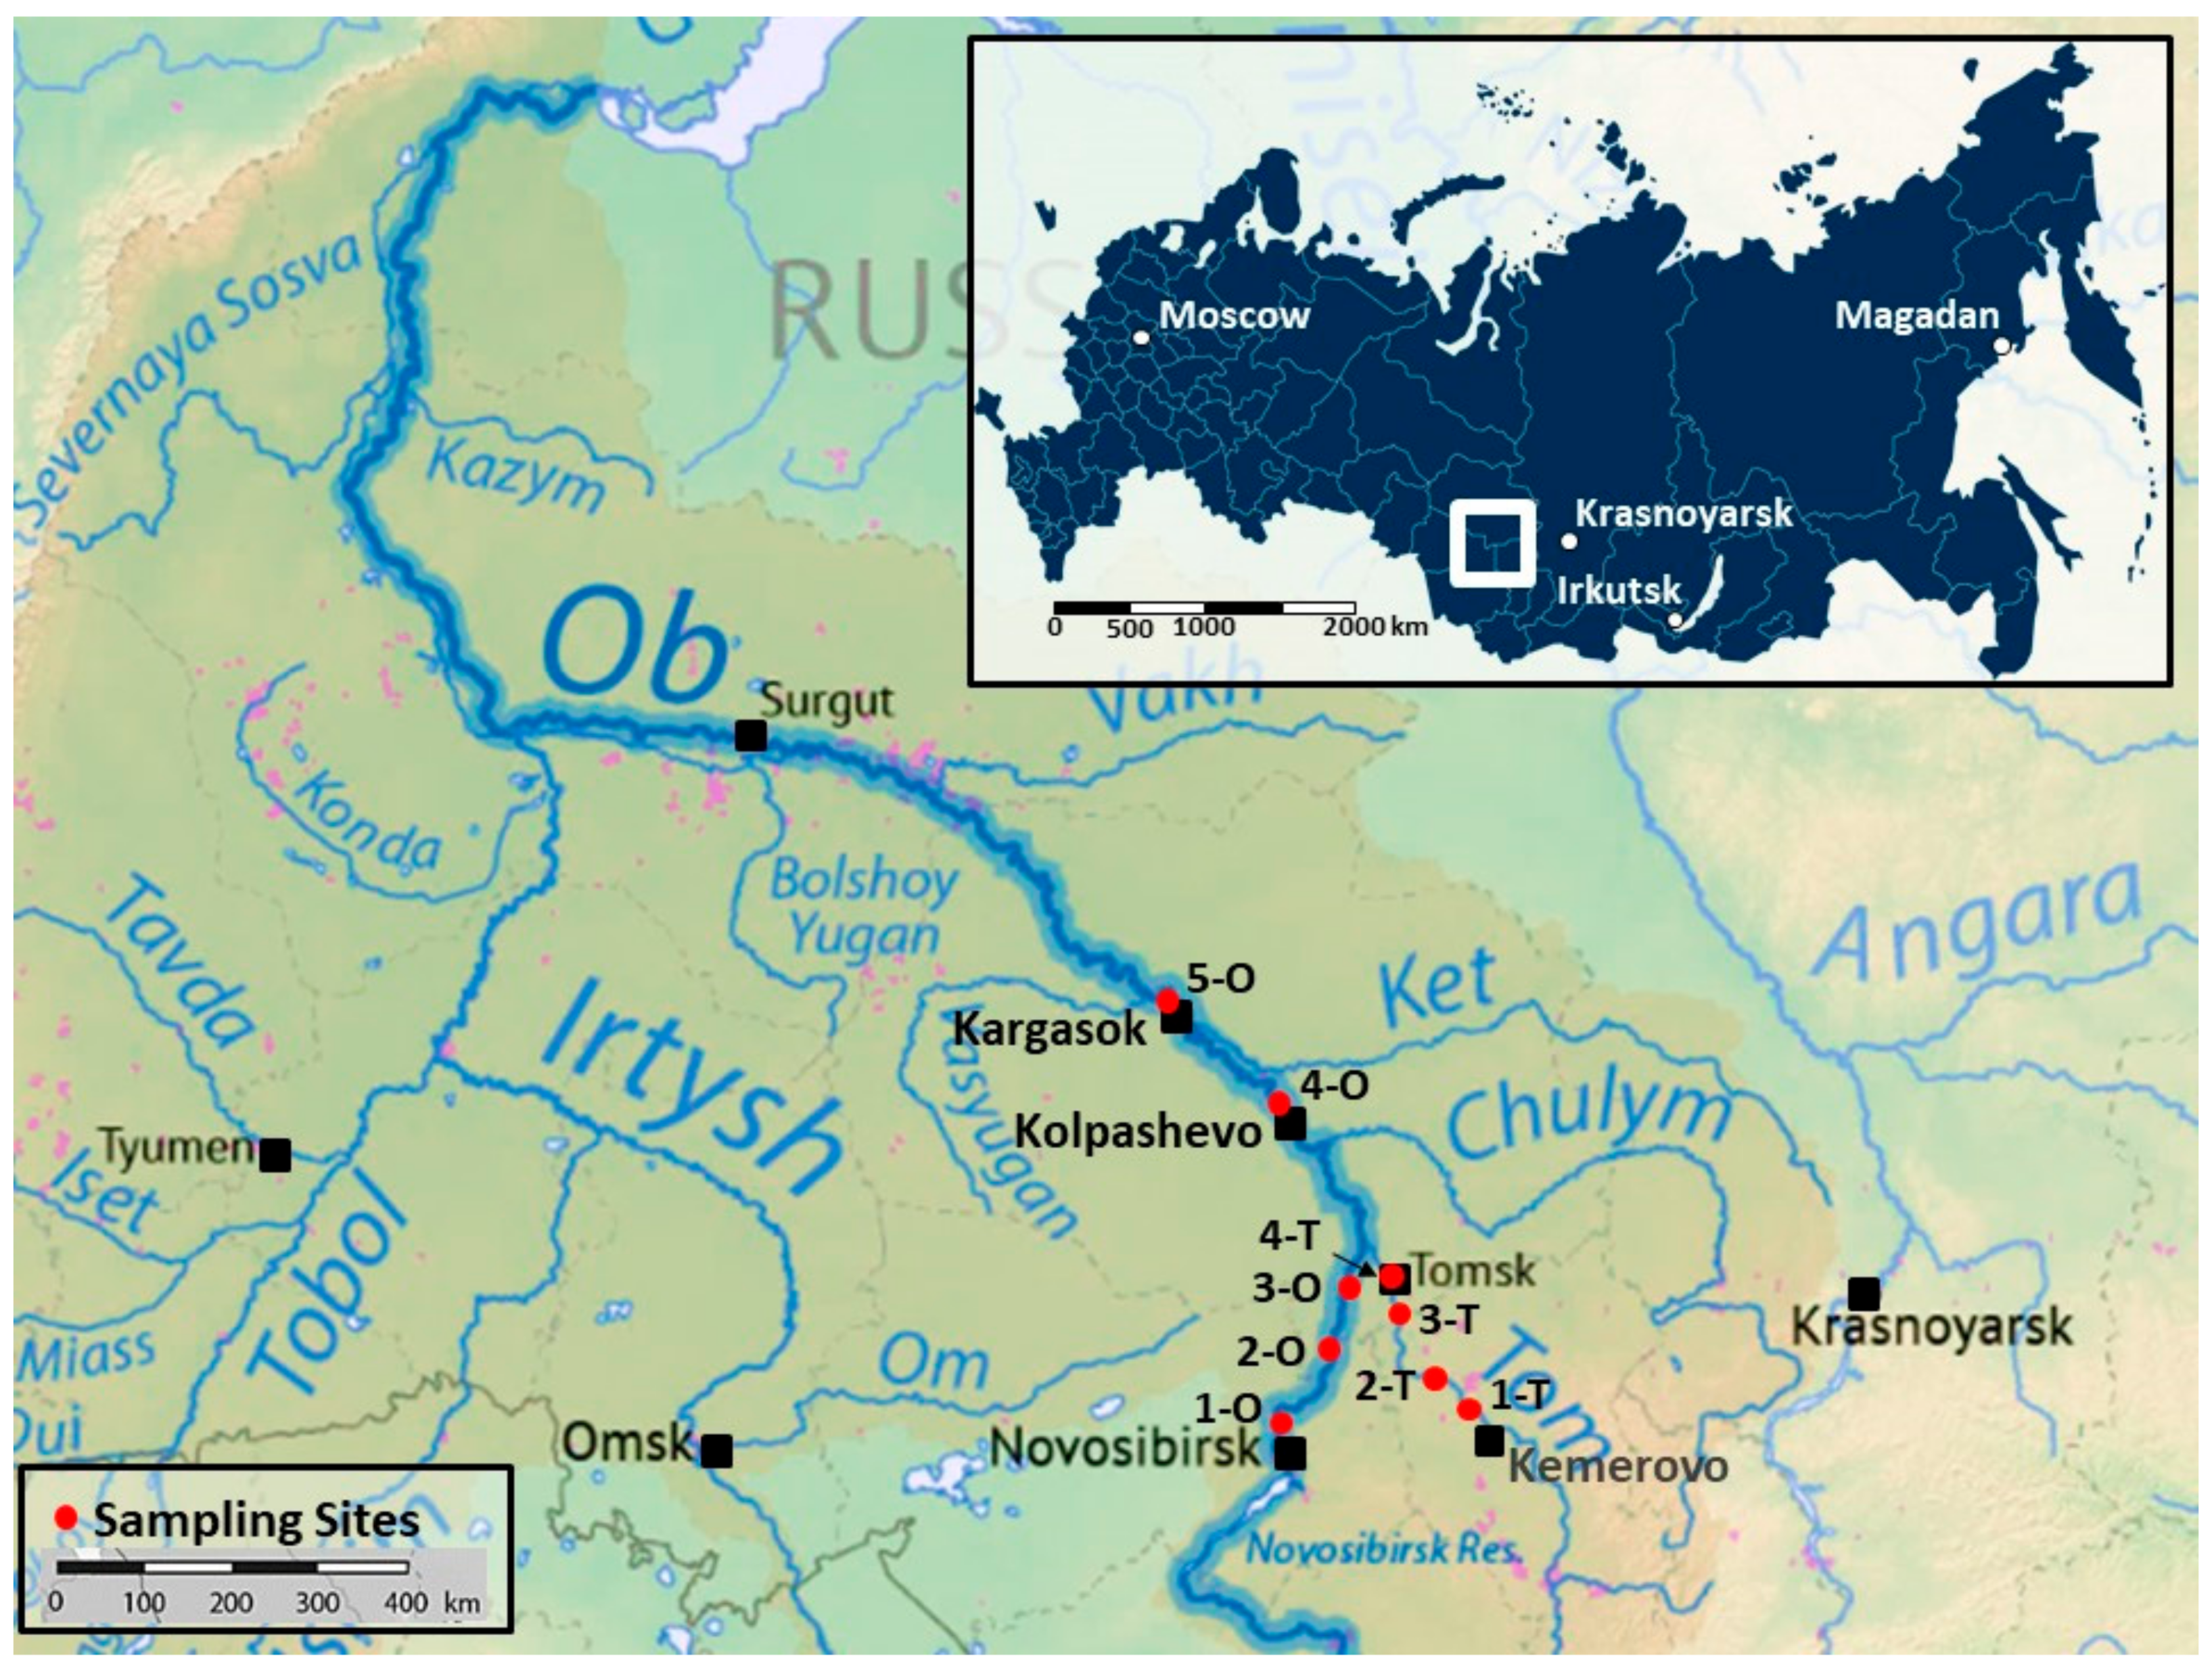
2.1. Study Area
2.2. Sampling and Field Studies
2.3. Laboratory Analysis of Microplastics
2.4. Processing of the Results
3. Results
3.1. Physico-Chemical Characteristic of the Water
3.2. MP Abundance in the Surface Water
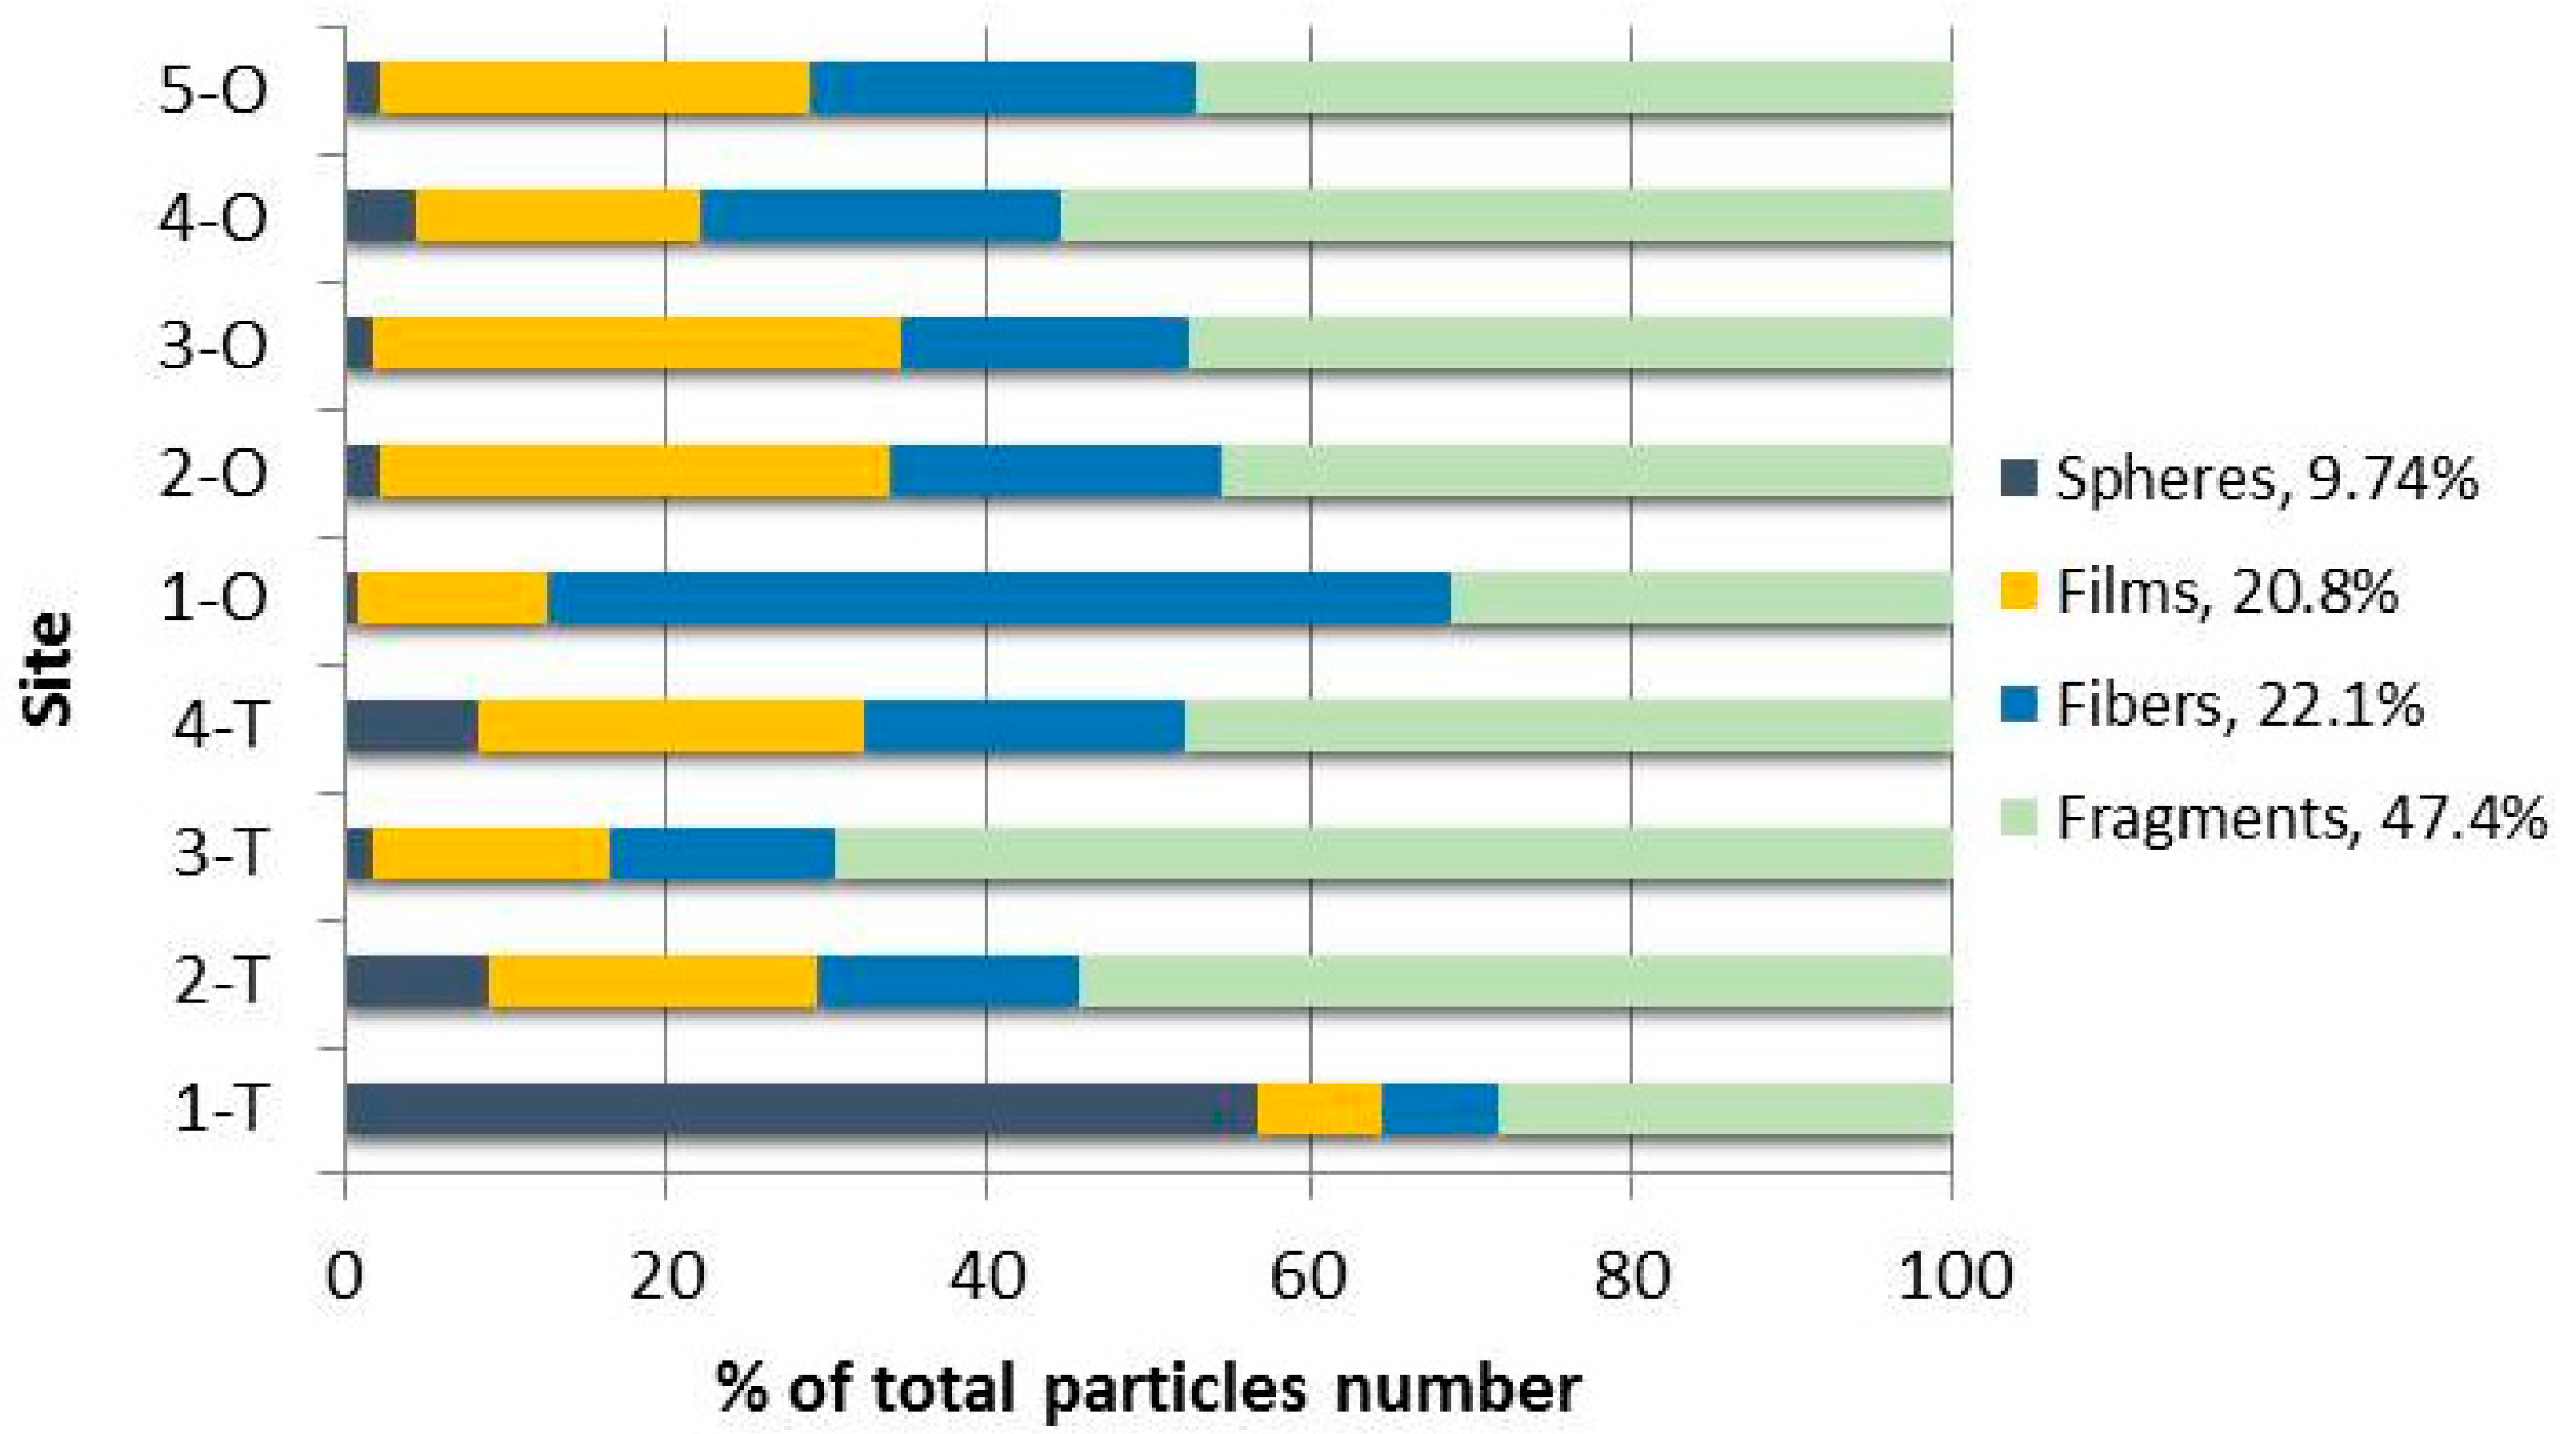
3.3. Morphological Characteristics of the Detected MP
4. Conclusions
Supplementary Materials
Author Contributions
Funding
Institutional Review Board Statement
Informed Consent Statement
Acknowledgments
Conflicts of Interest
References
- Frias, J.P.G.L.; Nash, R. Microplastics: Finding a consensus on the definition. Mar. Pollut. Bull. 2019, 138, 145–147. [Google Scholar] [CrossRef] [PubMed]
- Cowger, W.; Gray, A.B.; Eriksen, M.; Moore, C.; Thiel, M. Evaluating wastewater effluent as a source of microplastics in environmental samples. In Microplastics in Water and Wastewater; Karapanagioti, H.K., Kalavrouziotis, I.K., Eds.; IWA Publishing: London, UK, 2019; pp. 109–131. [Google Scholar] [CrossRef] [Green Version]
- Hartmann, N.B.; Hüffer, T.; Thompson, R.C.; Hassellöv, M.; Verschoor, A.; Daugaard, A.E.; Rist, S.; Karlsson, T.; Brennholt, N.; Cole, M.; et al. Are we speaking the same language? Recommendations for a definition and categorization framework for plastic debris. Environ. Sci. Technol. 2019, 53, 1039–1047. [Google Scholar] [CrossRef] [PubMed] [Green Version]
- Barnes, D.K.A.; Galgani, F.; Thompson, R.C.; Barlaz, M. Accumulation and fragmentation of plastic debris in global environments. Phil. Trans. R. Soc. 2009, 364, 1985–1998. [Google Scholar] [CrossRef] [PubMed] [Green Version]
- Boucher, J.; Friot, D. Primary Microplastics in the Oceans: A Global Evaluation of Sources; IUCN: Gland, Switzerland, 2017; 43p. [Google Scholar] [CrossRef]
- Chae, Y.; An, Y.J. Effects of micro- and nanoplastics on aquatic ecosystems: Current research trends and perspectives. Mar. Pollut. Bull. 2017, 124, 624–632. [Google Scholar] [CrossRef]
- Sharma, S.; Chatterjee, S. Microplastic pollution, a threat to marine ecosystem and human health: A short review. Environ. Sci. Pollut. Res. 2017, 24, 21530–21547. [Google Scholar] [CrossRef]
- Campanale, C.; Massarelli, C.; Savino, I.; Locaputo, V.; Uricchio, V.F. A detailed review study on potential effects of microplastics and additives of concern on human health. Int. J. Environ. Res. Public Health 2020, 17, 1212. [Google Scholar] [CrossRef] [Green Version]
- Wang, W.; Gao, H.; Jin, S.; Li, R.; Na, G. The ecotoxicological effects of microplastics on aquatic food web, from primary producer to human: A review. Ecotoxicol. Environ. Saf. 2019, 173, 110–117. [Google Scholar] [CrossRef]
- Rubio, L.; Marcos, R.; Hernández, A. Potential adverse health effects of ingested micro- and nanoplastics on humans. Lessons learned from in vivo and in vitro mammalian models. J. Toxicol. Environ. Health B Crit. Rev. 2020, 23, 51–68. [Google Scholar] [CrossRef]
- Yong, C.Q.Y.; Valiyaveetill, S.; Tang, B.L. Toxicity of microplastics and nanoplastics in mammalian systems. Int. J. Environ. Res. Public Health 2020, 17, 1509. [Google Scholar] [CrossRef] [Green Version]
- Eerkes-Medrano, D.; Thompson, R.C.; Aldridge, D.C. Microplastics in freshwater systems: A review of the emerging threats, identification of knowledge gaps and prioritisation of research needs. Water Res. 2015, 75, 63–82. [Google Scholar] [CrossRef]
- Wagner, M.; Scherer, C.; Alvarez-Muñoz, D.; Brennholt, N.; Bourrain, X.; Buchinger, S.; Fries, E.; Grosbois, C.; Klasmeier, J.; Marti, T.; et al. Microplastics in freshwater ecosystems: What we know and what we need to know. Environ. Sci. Eur. 2014, 26, 12. [Google Scholar] [CrossRef] [PubMed] [Green Version]
- Lambert, S. Microplastics are contaminants of emerging concern in freshwater environments: An overview. In Freshwater microplastics. Emerging Environmental Contaminants; Wagner, M., Lambert, S., Eds.; Springer: Basel, Switzerland, 2018; pp. 1–23. [Google Scholar] [CrossRef] [Green Version]
- Kim, H.; Lee, J.-Y. Emerging concerns about microplastic pollution on groundwater in South Korea. Sustainability 2020, 12, 5275. [Google Scholar] [CrossRef]
- Scheurer, M.; Bigalke, M. Microplastics in Swiss floodplain soils. Environ. Sci. Technol. 2018, 52, 3591–3598. [Google Scholar] [CrossRef] [PubMed]
- Brahney, J.; Hallerud, M.; Heim, E.; Hahnenberger, M.; Sukumaran, S. Plastic rain in protected areas of the United States. Science 2020, 368, 1257–1260. [Google Scholar] [CrossRef] [PubMed]
- de Souza Machado, A.A.; Kloas, W.; Zarfl, C.; Hempel, S.; Rillig, M.C. Microplastics as an emerging threat to terrestrial ecosystems. Glob. Chang. Biol. 2018, 24, 1405–1416. [Google Scholar] [CrossRef] [PubMed] [Green Version]
- Bergmann, M.; Mützel, S.; Primpke, S.; Tekman, M.B.; Trachsel, J.; Gerdts, G. White and wonderful? Microplastics prevail in snow from the Alps to the Arctic. Sci. Adv. 2019, 5, eaax1157. [Google Scholar] [CrossRef] [PubMed] [Green Version]
- Allen, S.; Allen, D.; Phoenix, V.R.; Le Roux, G.; Durántez Jiménez, P.; Simonneau, A.; Binet, S.; Galop, D. Atmospheric transport and deposition of microplastics in a remote mountain catchment. Nat. Geosci. 2019, 12, 339–344. [Google Scholar] [CrossRef]
- Wright, S.L.; Ulke, J.; Font, A.; Chan, K.L.A.; Kelly, F.J. Atmospheric microplastic deposition in an urban environment and an evaluation of transport. Environ. Int. 2020, 136, 105411. [Google Scholar] [CrossRef]
- Rochman, C.M.; Hoellein, T. The global odyssey of plastic pollution. Thinking big about small particles reveals new features of the microplastic cycle. Science 2020, 368, 1184–1185. [Google Scholar] [CrossRef]
- Wichmann, D.; Delandmeter, P.; van Sebille, E. Influence of near-surface currents on the global dispersal of marine microplastic. J. Geophys. Res. Ocean. 2019, 124, 6086–6096. [Google Scholar] [CrossRef] [Green Version]
- Horton, A.A.; Walton, A.; Spurgeon, D.J.; Lahive, E.; Svendsen, C. Microplastics in freshwater and terrestrial environments: Evaluating the current understanding to identify the knowledge gaps and future research priorities. Sci. Total Environ. 2017, 586, 127–141. [Google Scholar] [CrossRef] [PubMed] [Green Version]
- Skalska, K.; Ockelford, A.; Ebdon, J.E.; Cundy, A.B. Riverine microplastics: Behaviour, spatio-temporal variability, and recommendations for standardised sampling and monitoring. J. Water Proc. Eng. 2020, 38, 101600. [Google Scholar] [CrossRef]
- Moore, C.; Lattin, G.; Zellers, A. Quantity and type of plastic debris flowing from two urban rivers to coastal waters and beaches of Southern California. J. Integr. Coast. Zone Manag. 2011, 11, 65–73. [Google Scholar] [CrossRef]
- Eriksen, M.; Mason, S.; Wilson, S.; Box, C.; Zellers, A.; Edwards, W.; Farley, H.; Amato, S. Microplastic pollution in the surface waters of the Laurentian Great Lakes. Mar. Pollut. Bull. 2013, 77, 177–182. [Google Scholar] [CrossRef] [PubMed]
- Nizzetto, L.; Bussi, G.; Futter, M.; Butterfield, D.; Whitehead, P. A theoretical assessment of microplastic transport in river catchments and their retention by soils and river sediments. Environ. Sci. Process. Impacts 2016, 18, 1050–1059. [Google Scholar] [CrossRef] [PubMed]
- Bellasi, A.; Binda, G.; Pozzi, A.; Galafassi, S.; Volta, P.; Bettinetti, R. Microplastic contamination in freshwater environments: A review, focusing on interactions with sediments and benthic organisms. Environments 2020, 7, 30. [Google Scholar] [CrossRef] [Green Version]
- van der Wal, M.; Van Der Meulen, M.; Tweehuijsen, G.; Peterlin, M.; Palatinus, A.; Kovač Viršek, M.; Coscia, L.; Kržan, A. Identification and Assessment of Riverine Input of (Marine) Litter; European Commission: Bruxelles, Belgium, 2015; 186p. [Google Scholar]
- McClelland, J.W.; Holmes, R.M.; Peterson, B.J.; Stieglitz, M. Increasing river discharge in the Eurasian Arctic: Consideration of dams, permafrost thaw, and fires as potential agents of change. J. Geophys. Res. 2004, 109, D18102. [Google Scholar] [CrossRef] [Green Version]
- Lammers, R.B.; Shiklomanov, A.I.; Vörösmarty, C.J.; Fekete, B.M.; Peterson, B.J. Assessment of contemporary Arctic river runoff based on observational discharge records. J. Geophys. Res. 2001, 106, 3321–3334. [Google Scholar] [CrossRef]
- Kirpotin, S.N. The great Ob River basin. Int. J. Environ. Stud. 2015, 72, 377–379. [Google Scholar] [CrossRef]
- Ivanov, K.S.; Erokhin, Y.V.; Ponomarev, V.S.; Pogromskaya, O.E.; Berzin, S.V. Geological structure of the basement of western and eastern parts of the West-Siberian Plain. Int. J. Sci. Educ. 2016, 11, 6409–6432. [Google Scholar]
- Ulmishek, G.F. Petroleum Geology and Resources of the West Siberian Basin, Russia; U.S. Geological Survey Bulletin 2201-G; U.S. Geological Survey: Reston, VA, USA, 2003; 49p. [Google Scholar]
- The State Water Register. Available online: http://textual.ru/gvr/ (accessed on 12 October 2020).
- Campanale, C.; Savino, I.; Pojar, I.; Massarelli, C.; Uricchio, V.F. A Practical overview of methodologies for sampling and analysis of microplastics in riverine environments. Sustainability 2020, 12, 6755. [Google Scholar] [CrossRef]
- Andrady, A.L. The plastic in microplastics: A review. Mar. Pollut. Bull. 2017, 119, 12–22. [Google Scholar] [CrossRef] [PubMed]
- Water Measurement Manual. A Water Resources Technical Publication, Dodge, R. (Ed.) U.S. Department of the Interior Bureau of Reclamation, Third Edition; U.S. Government Printing Office: Denver, CO, USA, 2001; 317p. [Google Scholar]
- Fernández-Turiel, J.L.; Llorens, J.F.; López-Vera, F.; Gómez-Artola, C.; Morell, I.; Gimeno, D. Strategy for water analysis using ICP-MS. Fresenius J. Anal. Chem. 2000, 368, 601–606. [Google Scholar] [CrossRef] [PubMed]
- Pokrovsky, O.S.; Shirokova, L.S. Diurnal variations of dissolved and colloidal organic carbon and trace metals in a boreal lake during summer bloom. Water Res. 2013, 47, 922–932. [Google Scholar] [CrossRef]
- Masura, J.; Baker, J.; Foster, G.; Arthur, C. Laboratory Methods for the Analysis of Microplastics in the Marine Environment: Recommendations for Quantifying Synthetic Particles in Waters and Sediments; NOAA Technical Memorandum NOS-OR&R-48; NOAA Marine Debris Division: Silver Spring, MD, USA, 2015; 39p. [Google Scholar]
- McCormick, A.R.; Hoellein, T.J.; London, M.G.; Hittie, J.; Scott, J.W.; Kelly, J.J. Microplastic in surface waters of urban rivers: Concentration, sources, and associated bacterial assemblages. Ecosphere 2016, 7, e01556. [Google Scholar] [CrossRef]
- Koelmans, A.A.; Nor, N.H.M.; Hermsen, E.; Kooi, M.; Mintenig, S.M.; De France, J. Microplastics in freshwaters and drinking water: Critical review and assessment of data quality. Water Res. 2019, 155, 410–422. [Google Scholar] [CrossRef]
- Mann, H.B.; Whitney, D.R. On a test of whether one of two random variables is stochastically larger than the other. Ann. Math. Stat. 1947, 18, 50–60. [Google Scholar] [CrossRef]
- Kruskal, W.H.; Wallis, W.A. Use of ranks in one-criterion variance analysis. J. Am. Stat. Assoc. 1952, 47, 583–621. [Google Scholar] [CrossRef]
- Vorobyev, S.N.; Pokrovsky, O.S.; Kirpotin, S.N.; Kolesnichenko, L.G.; Shirokova, L.S.; Manasypov, R.M. Flood zone biogeochemistry of the Ob River middle course. J. Appl. Geochem. 2015, 63, 133e145. [Google Scholar] [CrossRef]
- Søndergaard, M. Redox potential. Reference module in earth systems and environmental sciences. In Encyclopedia of Inland Waters; Likens, G.E., Ed.; Academic Press: Cambridge, MA, USA, 2008; Volume 3, pp. 852–859. [Google Scholar]
- Faure, F.; Demars, A.C.; Wieser, A.O.; Kunz, M.; de Alencastro, L.F. Plastic pollution in Swiss surface waters: Nature and concentrations, interaction with pollutants. Environ. Chem. 2015, 12, 582–591. [Google Scholar] [CrossRef]
- Rodrigues, M.O.; Abrantes, N.; Gonçalves, F.J.M.; Nogueira, H.; Marques, J.C.; Gonçalves, A.M.M. Spatial and temporal distribution of microplastics in water and sediments of a freshwater system (Antuã River, Portugal). Sci. Total Environ. 2018, 633, 1549–1559. [Google Scholar] [CrossRef] [PubMed]
- Yonkos, L.T.; Friedel, E.A.; Perez-Reyes, A.C.; Ghosal, S.; Arthur, C.D. Microplastics in four estuarine rivers in the Chesapeake Bay, USA. Environ. Sci. Technol. 2014, 48, 14195–14202. [Google Scholar] [CrossRef] [PubMed]
- Campanale, C.; Stock, F.; Massarelli, C.; Kochleus, C.; Bagnuolo, G.; Reifferscheid, G.; Uricchio, V.F. Microplastics and their possible sources: The example of Ofanto river in southeast Italy. Environ. Pollut. 2020, 258, 113284. [Google Scholar] [CrossRef] [PubMed]
- Baldwin, A.K.; Corsi, S.R.; Mason, S.A. Plastic debris in 29 great lakes tributaries: Relations to watershed attributes and hydrology. Environ. Sci. Technol. 2016, 50, 10377–10385. [Google Scholar] [CrossRef] [PubMed]
- Mani, T.; Hauk, A.; Walter, U. and Burkhardt-Holm, P. Microplastics profile along the Rhine River. Sci. Rep. 2015, 5, 17988. [Google Scholar] [CrossRef] [PubMed]
- Lechner, A.; Keckeis, H.; Lumesberger-Loisl, F.; Zens, B.; Krusch, R.; Tritthart, M.; Glas, M.; Schludermann, E. The Danube so colourful: A potpourri of plastic litter outnumbers fish larvae in Europe’s second largest river. Environ. Pollut. 2014, 188, 177–181. [Google Scholar] [CrossRef] [PubMed] [Green Version]
- Dris, R.; Gasperi, J.; Tassin, B. Sources and fate of microplastics in urban areas: A focus on Paris Megacity. In Freshwater Microplastics: The Handbook of Environmental Chemistry; Wagner, M., Lambert, S., Eds.; Springer: Cham, Switzerland, 2018; Volume 58, pp. 69–83. [Google Scholar] [CrossRef] [Green Version]
- Population Stat. World Statistical Data. Available online: https://populationstat.com/ (accessed on 3 November 2020).
- Wong, J.K.H.; Lee, K.K.; Tang, K.H.D.; Yap, P.-S. Microplastics in the freshwater and terrestrial environments: Prevalence, fates, impacts and sustainable solutions. Sci. Total Environ. 2020, 719, 137512. [Google Scholar] [CrossRef]
- Kusui, T.; Noda, M. International survey on the distribution of stranded and buried litter on beaches along the Sea of Japan. Mar. Pollut. Bull. 2003, 47, 175–179. [Google Scholar] [CrossRef]
- Browne, M.A.; Crump, P.; Niven, S.J.; Teuten, E.; Tonkin, A.; Galloway, T.; Thompson, R. Accumulation of microplastic on shorelines worldwide: Sources and sinks. Environ. Sci. Technol. 2011, 45, 9175–9179. [Google Scholar] [CrossRef]
- Desforges, J.P.; Galbraith, M.; Dangerfield, N.; Ross, P.S. Widespread distribution of microplastics in subsurface seawater in the NE Pacific Ocean. Mar. Pollut. Bull. 2014, 79, 94–99. [Google Scholar] [CrossRef]
- Jahan, S.; Strezov, V.; Weldekidan, H.; Kumar, R.; Kan, T.; Sarkodie, S.A.; He, J.; Dastjerdi, B.; Wilson, S.P. Interrelationship of microplastic pollution in sediments and oysters in a seaport environment of the eastern coast of Australia. Sci. Total Environ. 2019, 695, 133924. [Google Scholar] [CrossRef] [PubMed]
- Talvitie, J.; Heinonen, M.; Pääkkönen, J.P.; Vahtera, E.; Mikola, A.; Setälä, O.; Vahala, R. Do wastewater treatment plants act as a potential point source of microplastics? Preliminary study in the coastal Gulf of Finland, Baltic Sea. Water Sci. Technol. 2015, 72, 1495–1504. [Google Scholar] [CrossRef] [PubMed]
- McCormick, A.; Hoellein, T.J.; Mason, S.A.; Schluep, J.; Kelly, J.J. Microplastic is an abundant and distinct microbial habitat in an urban river. Environ. Sci. Technol. 2014, 48, 11863–11871. [Google Scholar] [CrossRef] [PubMed]
- Murphy, F.; Ewins, C.; Carbonnier, F.; Quinn, B. Wastewater treatment works (WwTW) as a source of microplastics in the aquatic environment. Environ. Sci. Technol. 2016, 50, 5800–5808. [Google Scholar] [CrossRef] [Green Version]
- Ziajahromi, S.; Neale, P.A.; Leusch, F.D.L. Wastewater treatment plant effluent as a source of microplastics: Review of the fate, chemical interactions and potential risks to aquatic organisms. Water Sci. Technol. 2016, 74, 2253–2269. [Google Scholar] [CrossRef]
- Kemerovo Region Investment Passport. 2018. Available online: https://keminvest.ru/media/W1siZiIsIjIwMTkvMDgvMjUvNWM5N2V0cG05X2t1emJhc3NfaW52ZXN0cGFzc3BvcnRfMjAxOF9lbmdsaXNoXzZfaW5ldC5wZGYiXV0/kuzbass_investpassport_2018_english_6_inet.pdf?sha=18184cf401373917 (accessed on 7 November 2020).
- Habib, D.; Locke, D.C.; Cannone, L.J. Synthetic fibers as indicators of municipal sewage sludge, sludge products, and sewage treatment plant effluents. Water Air Soil Pollut. 1998, 103, 1–8. [Google Scholar] [CrossRef]
- Zubris, K.A.V.; Richards, B.K. Synthetic fibers as an indicator of land application of sludge. Environ. Pollut. 2005, 138, 201–211. [Google Scholar] [CrossRef]
- Ziajahromi, S.; Neale, P.A.; Rintoul, L.; Leusch, F.D.L. Wastewater treatment plants as a pathway for microplastics: Development of a new approach to sample wastewater-based microplastics. Water Res. 2017, 112, 93–99. [Google Scholar] [CrossRef]
- Fendell, L.S.; Sewell, M.A. Contributing to marine pollution by washing your face: Microplastics in facial cleansers. Mar. Pollut. Bull. 2009, 58, 1225–1228. [Google Scholar] [CrossRef]
- Siegfried, M.; Koelmans, A.A.; Besseling, E.; Kroeze, C. Export of microplastics from land to sea. A modelling approach. Water Res. 2017, 127, 249–257. [Google Scholar] [CrossRef]
- Dris, R.; Gasperi, J.; Saad, M.; Mirande, C.; Tassin, B. Synthetic fibers in atmospheric fallout: A source of microplastics in the environment? Mar. Pollut. Bull. 2016, 104, 290–293. [Google Scholar] [CrossRef] [PubMed]
- Isobe, A. Percentage of microbeads in pelagic microplastics within Japanese coastal waters. Mar. Pollut. Bull. 2016, 110, 432–437. [Google Scholar] [CrossRef] [PubMed]
- Tanaka, K.; Takada, H. Microplastic fragments and microbeads in digestive tracts of planktivorous fish from urban coastal waters. Sci. Rep. 2016, 6, 1–8. [Google Scholar] [CrossRef] [PubMed]
- Klein, S.; Worch, E.; Knepper, T.P. Occurrence and spatial distribution of microplastics in river shore sediments of the Rhine-Main Area in Germany. Environ. Sci. Technol. 2015, 49, 6070–6076. [Google Scholar] [CrossRef] [PubMed]


| Sampling Sites | 1-T | 2-T | 3-T | 4-T | 1-O | 2-O | 3-O | 4-O | 5-O |
|---|---|---|---|---|---|---|---|---|---|
| Geographical coordinates | 55°25′31.188″ N 85°55′24.960″ E | 55°44′13.344″ N 84°56′28.140″ E | 56°10′53.472″ N 84°52′44.760″ E | 56°26′56.724″ N 84°56′8196″ E | 55°11′6972″ N 82°52′57.396″ E | 56°4′42.348″ N 83°51′47.484″ E | 56°31′48.468″ N 84°9′40.824″ E | 58°18′16.416″ N 82°54′27.864″ E | 59°4′1992″ N 80°50′58.668″ E |
| Sampling Sites | 1-T | 2-T | 3-T | 4-T | 1-O | 2-O | 3-O | 4-O | 5-O |
|---|---|---|---|---|---|---|---|---|---|
| pH | 8.19 | 8.85 | 8.60 | 7.55 | 8.23 | 8.81 | 8.82 | 7.96 | 7.49 |
| T, °C | 15.7 | 17.2 | 15.5 | 19.6 | 18.4 | 20.0 | 19.9 | 18.9 | 18.4 |
| Eh, mV | +248 | +272 | +268 | +243 | +263 | +181 | +201 | +207 | +218 |
| Sampling Sites | 1-T | 2-T | 3-T | 4-T | 1-O | 2-O | 3-O | 4-O | 5-O |
|---|---|---|---|---|---|---|---|---|---|
| Elements content, mg L−1 | |||||||||
| Na | 6.94 | 5.63 | 8.06 | 6.56 | 10.1 | 6.22 | 7.25 | 4.85 | 4.39 |
| Mg | 4.61 | 2.51 | 3.66 | 3.37 | 5.20 | 4.91 | 4.84 | 3.38 | 3.59 |
| K | 0.36 | 0.32 | 0.35 | 0.49 | 0.90 | 0.96 | 1.05 | 0.72 | 1.08 |
| Ca | 29.5 | 14.2 | 20.8 | 19.2 | 30.8 | 30.2 | 32.4 | 23.3 | 24.0 |
| Si | 1.67 | 1.31 | 1.50 | 2.41 | 2.03 | 1.73 | 2.08 | 1.92 | 3.05 |
| Fe | 0.13 | 0.06 | 0.08 | 0.08 | 0.12 | 0.12 | 0.12 | 0.20 | 0.33 |
| Elements content, μg L−1 | |||||||||
| Li | 3.00 | 3.00 | 3.70 | 4.00 | 6.30 | 2.10 | 2.9 | 2.2 | 2.9 |
| Al | 7.00 | 16.0 | 15.0 | 8.80 | 3.00 | 4.20 | 4.0 | 4.5 | 12.0 |
| P | <10.0 | <10.0 | <10.0 | 20.3 | <10.0 | 11.0 | <10.0 | 15.0 | 31.0 |
| V | <1.00 | 1.10 | <1.00 | <1.00 | 1.70 | 2.00 | 2.30 | 1.20 | <1.00 |
| Mn | 66.0 | 9.50 | 1.90 | 5.00 | 6.50 | 6.70 | 12.0 | 1.40 | 50.0 |
| Co | 0.14 | <0.10 | <0.10 | <0.10 | <0.10 | <0.10 | <0.10 | <0.10 | 0.22 |
| Ni | 1.40 | <1.00 | 1.01 | 1.20 | 1.50 | 1.40 | 1.60 | 1.50 | 2.60 |
| Cu | <1.00 | <1.00 | <1.00 | <1.00 | 1.30 | 0.14 | 1.60 | 1.10 | 1.40 |
| Zn | <1.00 | 1.10 | <1.00 | 3.20 | <1.00 | <1.00 | <1.00 | <1.00 | <1.00 |
| As | 1.03 | 1.20 | <1.00 | <1.00 | 1.50 | 1.80 | 1.90 | 1.10 | 1.10 |
| Rb | 0.30 | 0.22 | 0.25 | 0.31 | 0.40 | 0.40 | 0.46 | 0.36 | 1.1 |
| Sr | 140 | 76.0 | 120 | 120 | 140 | 150 | 150 | 120 | 130 |
| Y | <0.10 | <0.10 | <0.10 | <0.10 | <0.10 | <0.10 | <0.10 | <0.10 | 0.35 |
| Mo | 0.55 | 0.88 | 0.67 | 0.68 | 0.80 | 0.80 | 0.78 | 0.54 | 0.39 |
| Sb | <0.10 | <0.10 | <0.10 | <0.10 | 0.11 | 0.12 | 0.12 | <0.10 | <0.10 |
| Ba | 28.0 | 20.0 | 22.0 | 23.0 | 23.0 | 18.0 | 21.0 | 18.0 | 27.0 |
| La | <0.10 | <0.10 | <0.10 | <0.10 | <0.10 | <0.10 | <0.10 | <0.10 | 0.27 |
| Ce | <0.10 | <0.10 | <0.10 | <0.10 | <0.10 | <0.10 | <0.10 | <0.10 | 0.35 |
| Nd | <0.10 | <0.10 | <0.10 | <0.10 | <0.10 | <0.10 | <0.10 | <0.10 | 0.32 |
| U | 0.51 | 0.26 | 0.55 | 0.25 | 0.86 | 0.68 | 0.80 | 0.46 | 0.25 |
| Sampling Sites | The River Tom | The River Ob | |||||||
|---|---|---|---|---|---|---|---|---|---|
| 1-T | 2-T | 3-T | 4-T | 1-O | 2-O | 3-O | 4-O | 5-O | |
| Total mass, μg m−3 | 199 ± 67.8 | 47.7 ± 32.6 | 22.9 ± 3.35 | 47.9 ± 28.1 | 89.3 ± 6.22 | 56.0 ± 5.65 | 89.1 ± 29.5 | 96.2 ± 9.26 | 107 ± 12.6 |
| Average, μg m−3 | 79.4 ± 80.6 | 87.5 ± 19.1 | |||||||
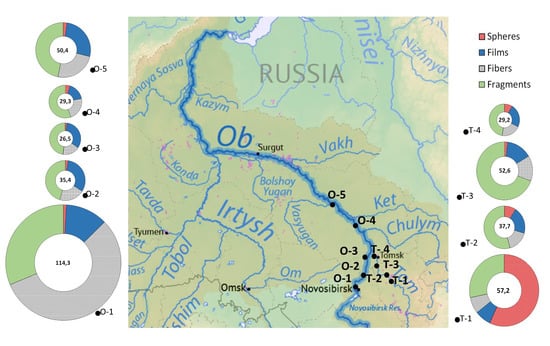
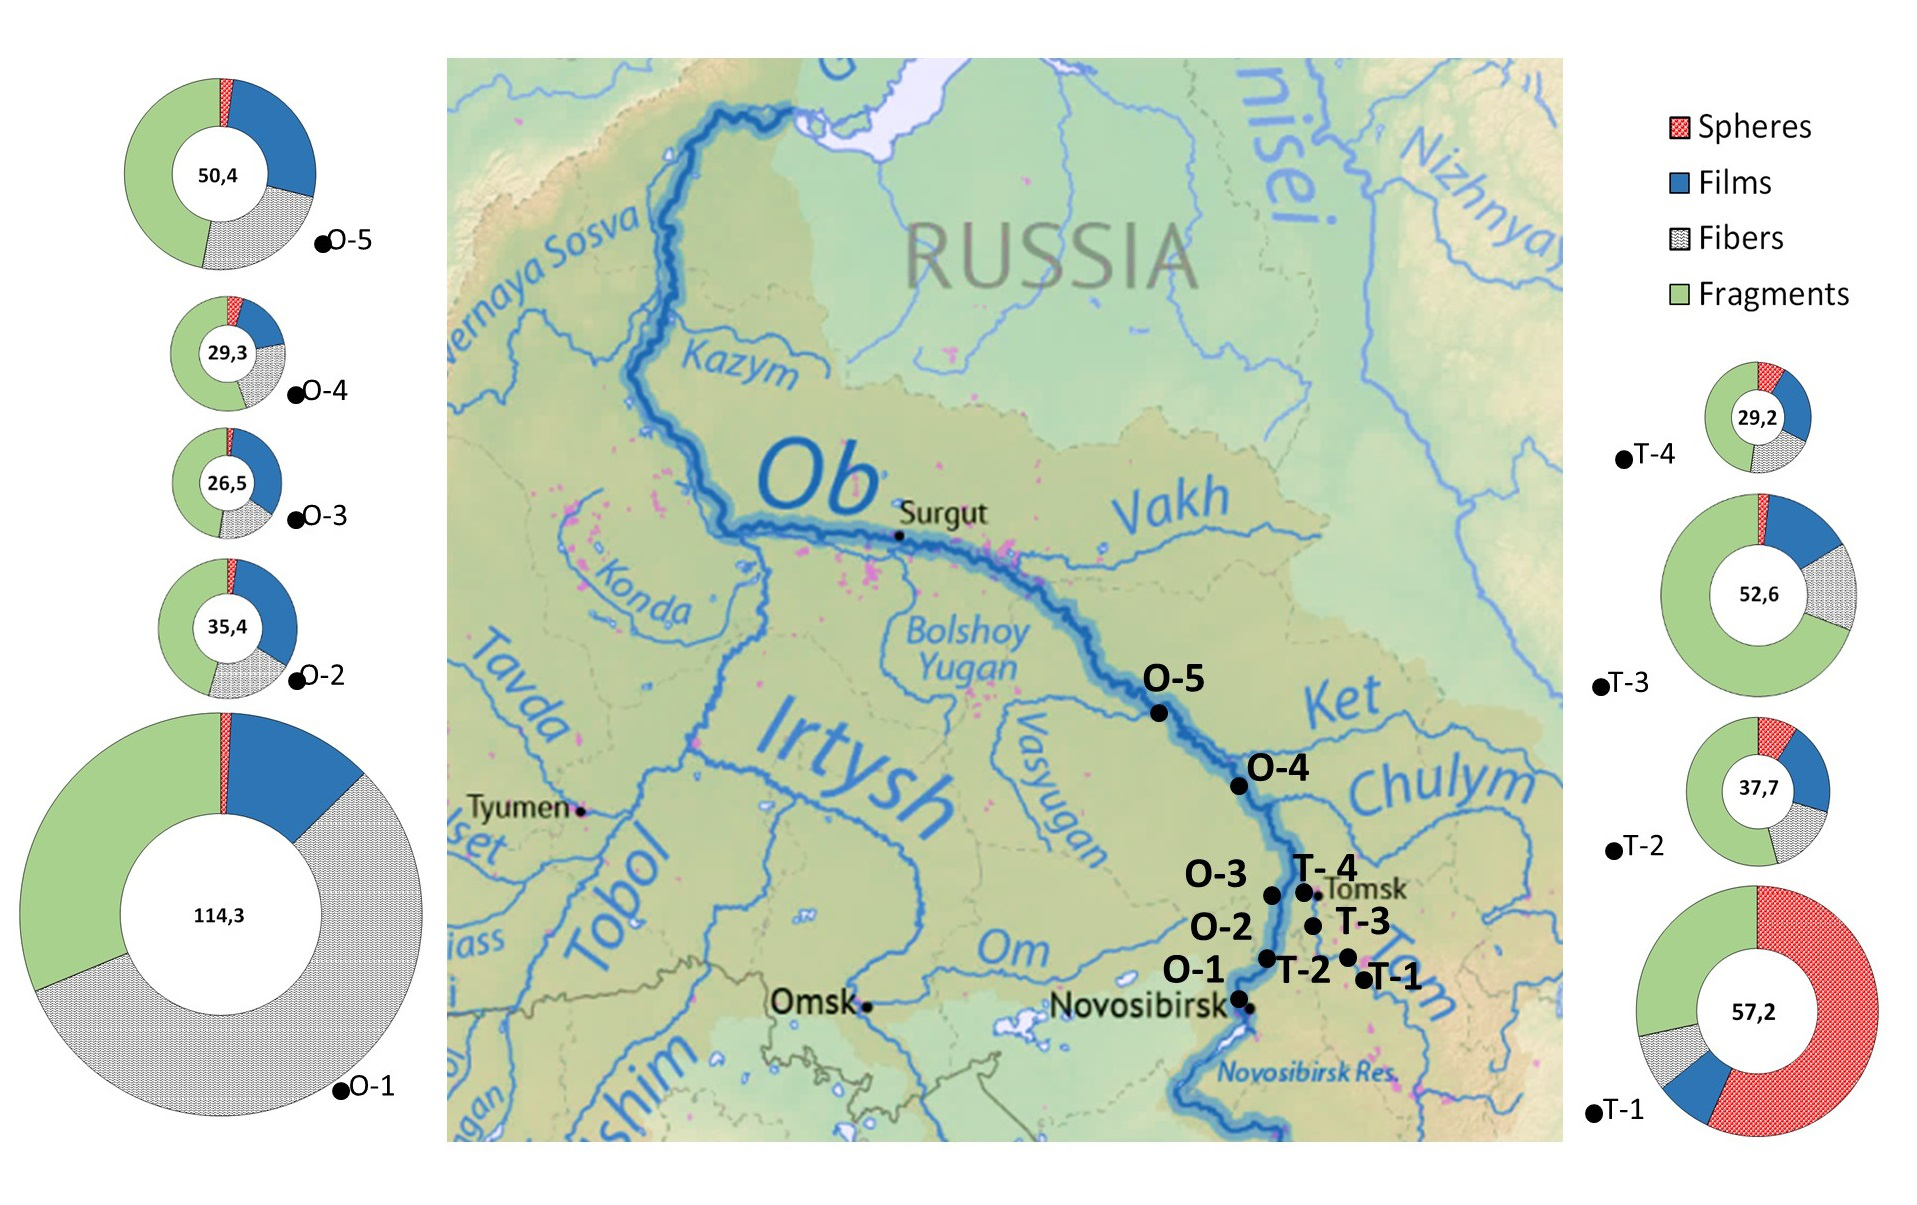
| Total count, items m−3 | 57.2 ± 10.3 | 37.7 ± 13.9 | 52.6 ± 5.54 | 29.2 ± 14.5 | 114 ± 6.76 | 35.4 ± 6.31 | 26.5 ± 11.8 | 29.3 ± 3.61 | 50.4 ± 6.04 |
| Average, items m−3 | 44.2 ± 13.0 | 51.2 ± 36.5 | |||||||
| Scheme 1. | 1-T | 2-T | 3-T | 4-T | 1-O | 2-O | 3-O | 4-O | 5-O | Av. |
|---|---|---|---|---|---|---|---|---|---|---|
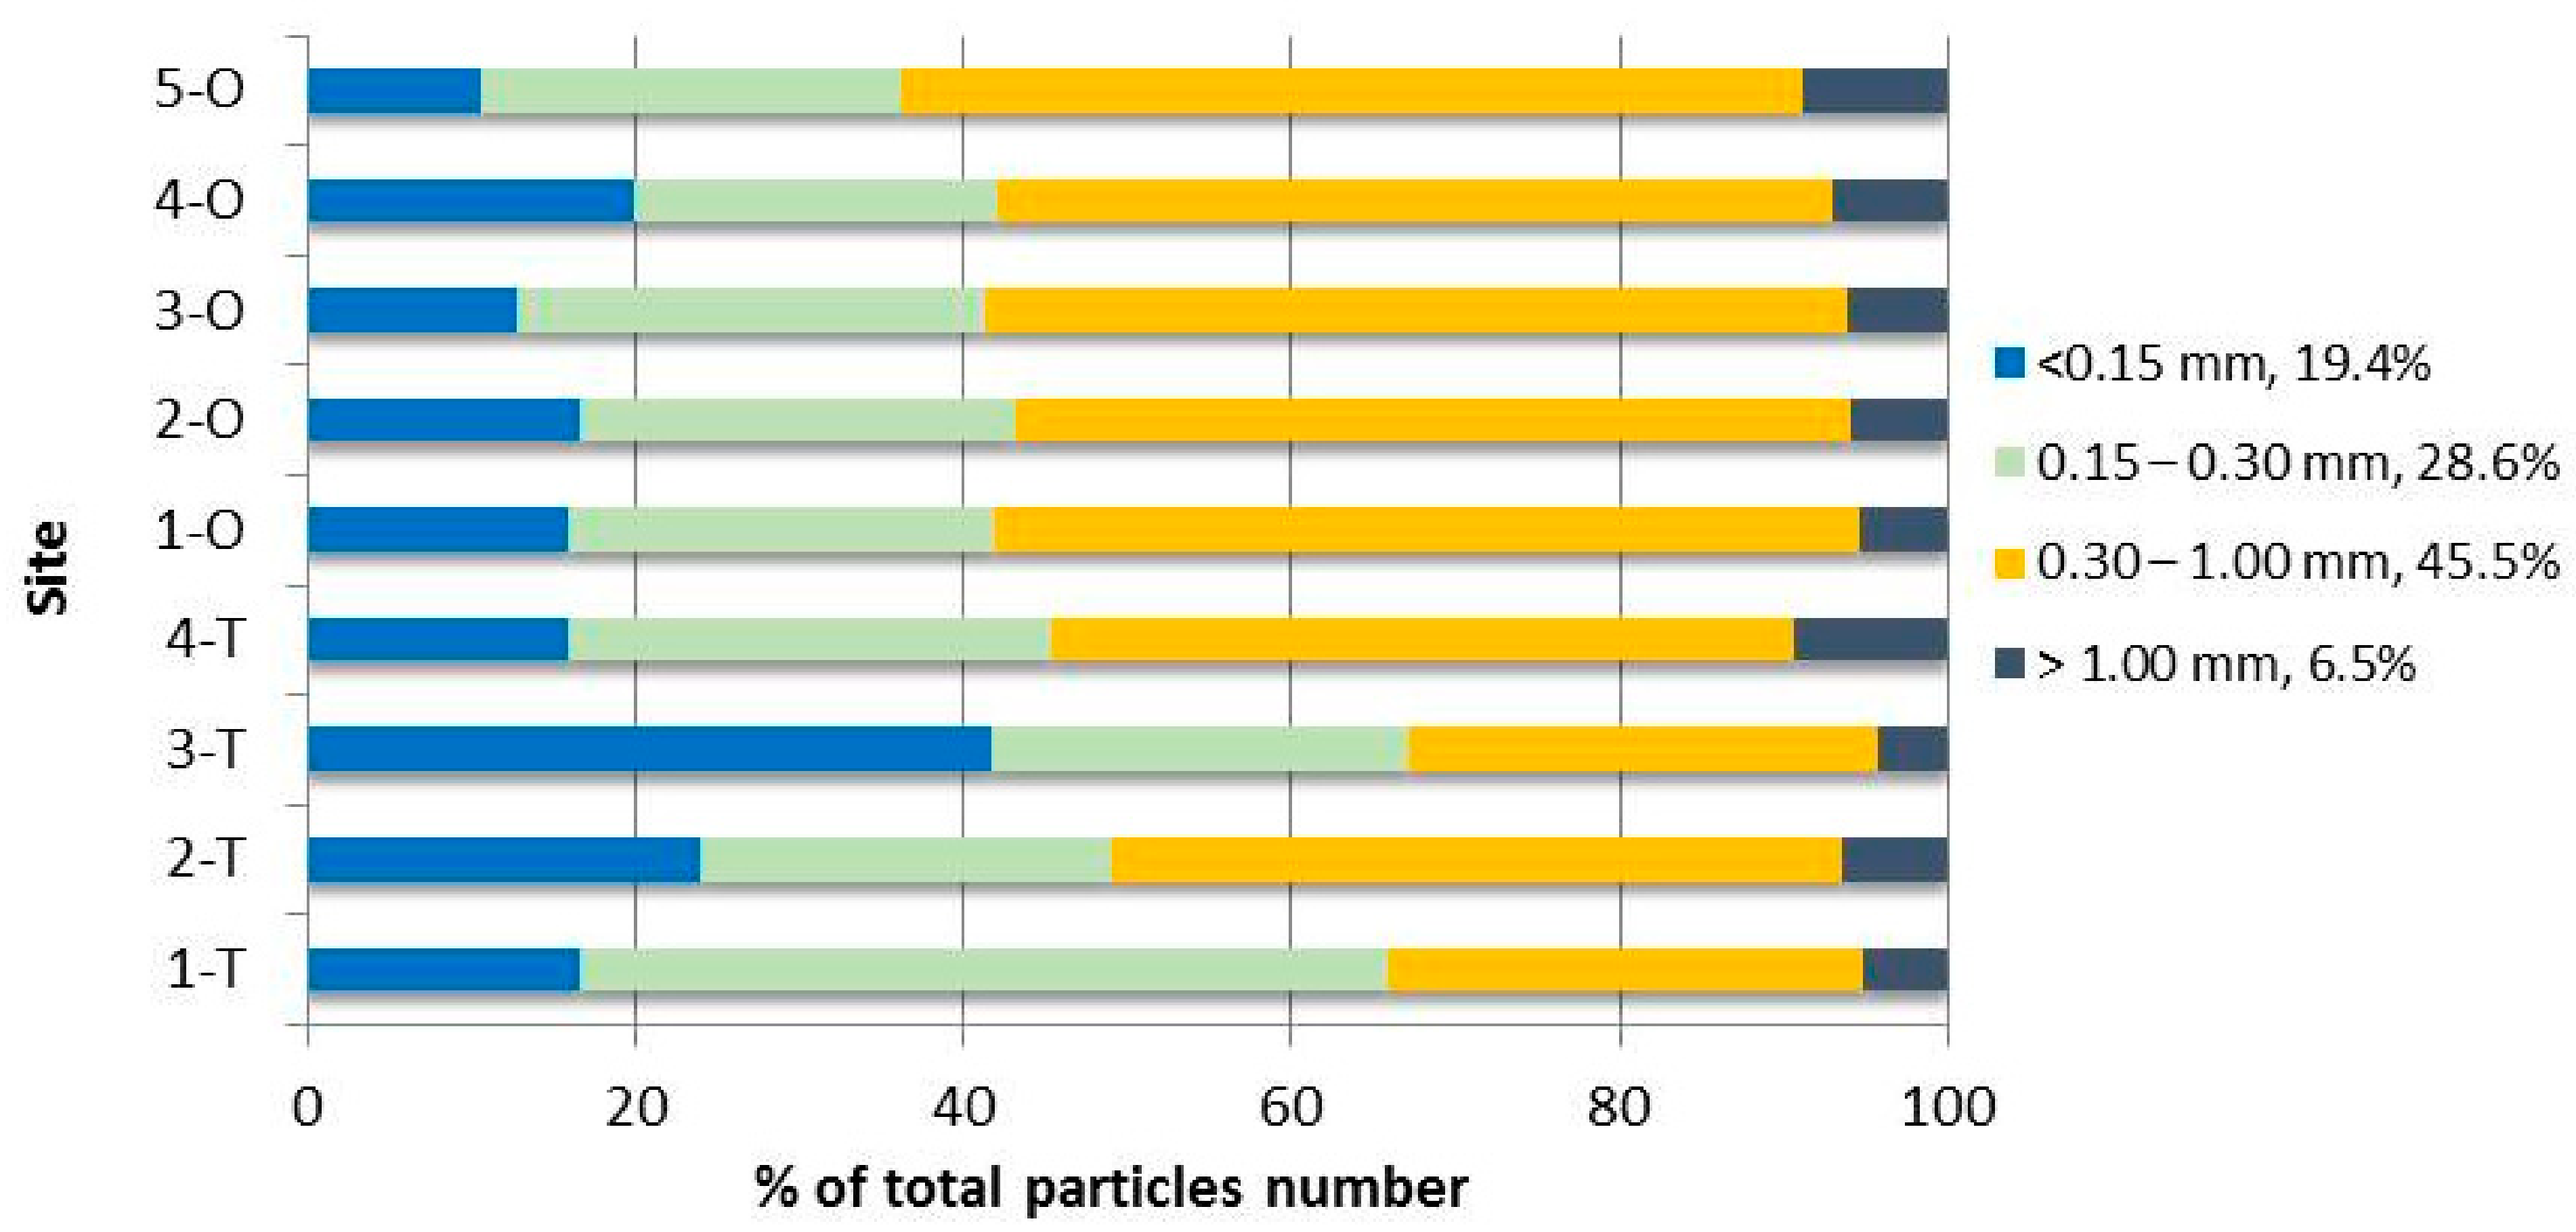
| Sizes, items m−3 | ||||||||||
| <0.15 mm | 9.52 ± 3.09 | 9.07 ± 3.29 | 21.9 ± 3.46 | 4.67 ± 3.70 | 18.3 ± 5.63 | 5.90 ± 2.61 | 3.37 ± 0.44 | 5.84 ± 1.19 | 5.33 ± 1.76 | 9.328 |
| 0.15–0.30 mm | 28.2 ± 6.74 | 9.41 ± 3.96 | 13.4 ± 2.37 | 8.60 ± 1.21 | 29.6 ± 14.9 | 9.38 ± 4.72 | 7.61 ± 2.20 | 6.48 ± 5.43 | 12.9 ± 7.27 | 13.94 |
| 0.30–1.00 mm | 16.6 ± 12.5 | 16.8 ± 17.2 | 15.1 ± 6.15 | 13.2 ± 13.4 | 60.2 ± 7.26 | 18.1 ± 4.09 | 13.9 ± 10.0 | 14.9 ± 2.24 | 27.7 ± 7.38 | 21.83 |
| 1.00–2.00 mm | 2.46 ± 2.11 | 2.14 ± 1.86 | 2.06 ± 1.70 | 2.29 ± 1.81 | 5.99 ± 1.41 | 1.87 ± 1.63 | 1.38 ± 0.75 | 2.07 ± 0.59 | 3.99 ± 2.85 | 2.696 |
| 2.00–3.00 mm | 0.37 ± 0.21 | 0.19 ± 0.02 | 0.13 ± 0.08 | 0.27 ± 0.25 | 0.19 ± 0.06 | 0.22 ± 0 16 | 0.20 ± 0.20 | nd | 0.48 ± 0.35 | 0.227 |
| 3.00–4.00 mm | 0.04 ± 0.04 | 0.08 ± 0.07 | nd | 0.18 ± 0.20 | 0.04 ± 0.02 | nd | 0.05 ± 0.09 | nd | nd | 0.043 |
| 4.00–5.00 mm | 0.04 ± 0.04 | nd | nd | nd | nd | nd | nd | nd | nd | 0.004 |
| Shapes, items m−3 | ||||||||||
| Spheres | 32.5 ± 10.8 | 3.41 ± 2.01 | 0.92 ± 0.55 | 2.47 ± 0.89 | 0.95 ± 0.54 | 0.77 ± 1.09 | 0.51 ± 0.47 | 1.30 ± 0.62 | 1.14 ± 1.32 | 4.886 |
| Films | 4.37 ± 1.21 | 7.69 ± 3.03 | 7.75 ± 3.26 | 6.95 ± 1.99 | 13.5 ± 4.53 | 11.3 ± 4.24 | 8.68 ± 4.91 | 5.19 ± 1.69 | 13.4 ± 13.8 | 8.759 |
| Fibers/Lines | 4.18 ± 3.45 | 6.12 ± 1.94 | 7.40 ± 3.09 | 5.86 ± 4.36 | 64.2 ± 4.94 | 7.26 ± 7.19 | 4.70 ± 2.94 | 6.61 ± 5.28 | 12.2 ± 6.78 | 13.16 |
| Fragments | 16.2 ± 2.58 | 20.5 ± 11.0 | 36.5 ± 5.84 | 13.9 ± 11.0 | 35.7 ± 7.33 | 16.1 ± 4.52 | 12.6 ± 9.48 | 16.2 ± 1.52 | 23.7 ± 12.0 | 21.27 |
| Spheres | 1-T | 2-T | 3-T | 4-T | 1-O | 2-O | 3-O | 4-O | 5-O | Films | 1-T | 2-T | 3-T | 4-T | 1-O | 2-O | 3-O | 4-O | 5-O |
|---|---|---|---|---|---|---|---|---|---|---|---|---|---|---|---|---|---|---|---|
| 1-T | 1-T | ||||||||||||||||||
| 2-T | + | 2-T | - | ||||||||||||||||
| 3-T | + | + | 3-T | - | - | ||||||||||||||
| 4-T | + | - | - | 4-T | - | - | - | ||||||||||||
| 1-O | + | + | - | - | 1-O | + | - | - | + | ||||||||||
| 2-O | + | + | - | - | - | 2-O | + | - | - | - | - | ||||||||
| 3-O | + | + | - | + | - | - | 3-O | - | - | - | - | - | - | ||||||
| 4-O | + | + | - | - | - | - | + | 4-O | - | - | - | - | + | + | - | ||||
| 5-O | + | - | - | - | - | - | - | - | 5-O | - | - | - | - | - | - | - | - | ||
| Fibers | 1-T | 2-T | 3-T | 4-T | 1-O | 2-O | 3-O | 4-O | 5-O | Fragments | 1-T | 2-T | 3-T | 4-T | 1-O | 2-O | 3-O | 4-O | 5-O |
| 1-T | 1-T | ||||||||||||||||||
| 2-T | - | 2-T | - | ||||||||||||||||
| 3-T | - | - | 3-T | + | - | ||||||||||||||
| 4-T | - | - | - | 4-T | - | - | + | ||||||||||||
| 1-O | + | + | + | + | 1-O | + | - | - | + | ||||||||||
| 2-O | - | - | - | - | + | 2-O | - | - | + | - | + | ||||||||
| 3-O | - | - | - | - | + | - | 3-O | - | - | + | - | + | - | ||||||
| 4-O | - | - | - | - | + | - | - | 4-O | - | - | + | - | + | - | - | ||||
| 5-O | - | - | - | - | + | - | - | - | 5-O | - | - | - | - | - | - | - | - |
Publisher’s Note: MDPI stays neutral with regard to jurisdictional claims in published maps and institutional affiliations. |
© 2020 by the authors. Licensee MDPI, Basel, Switzerland. This article is an open access article distributed under the terms and conditions of the Creative Commons Attribution (CC BY) license (http://creativecommons.org/licenses/by/4.0/).
Share and Cite
Frank, Y.A.; Vorobiev, E.D.; Vorobiev, D.S.; Trifonov, A.A.; Antsiferov, D.V.; Soliman Hunter, T.; Wilson, S.P.; Strezov, V. Preliminary Screening for Microplastic Concentrations in the Surface Water of the Ob and Tom Rivers in Siberia, Russia. Sustainability 2021, 13, 80. https://0-doi-org.brum.beds.ac.uk/10.3390/su13010080
Frank YA, Vorobiev ED, Vorobiev DS, Trifonov AA, Antsiferov DV, Soliman Hunter T, Wilson SP, Strezov V. Preliminary Screening for Microplastic Concentrations in the Surface Water of the Ob and Tom Rivers in Siberia, Russia. Sustainability. 2021; 13(1):80. https://0-doi-org.brum.beds.ac.uk/10.3390/su13010080
Chicago/Turabian StyleFrank, Yulia A., Egor D. Vorobiev, Danil S. Vorobiev, Andrey A. Trifonov, Dmitry V. Antsiferov, Tina Soliman Hunter, Scott P. Wilson, and Vladimir Strezov. 2021. "Preliminary Screening for Microplastic Concentrations in the Surface Water of the Ob and Tom Rivers in Siberia, Russia" Sustainability 13, no. 1: 80. https://0-doi-org.brum.beds.ac.uk/10.3390/su13010080