Analytical Approach to Quantitative Country Risk Assessment for the Belt and Road Initiative


1
School of International Trade and Economics, University of International Business and Economics, Beijing 100029, China
2
UIBE Belt & Road Energy Trade and Development Center, University of International Business and Economics, Beijing 100029, China
*
Author to whom correspondence should be addressed.
Sustainability 2021, 13(1), 423; https://0-doi-org.brum.beds.ac.uk/10.3390/su13010423
Submission received: 4 December 2020
/
Revised: 29 December 2020
/
Accepted: 2 January 2021
/
Published: 5 January 2021
Abstract
:In recent years, the “Belt and Road Initiative” (BRI) promoted by the Chinese government has attracted a significant amount of international trade and transnational investment and other businesses. Accordingly, country risk assessment should be granted priority in the decision-making process for these projects. Based on a comprehensive consideration of important relevant countries and the availability of data of countries along the BRI, this paper uses data from 49 countries along the BRI between 2014–2019 and establishes a national risk-evaluation system for the BRI from four dimensions (i.e., political, economic, social, and investment). This paper adopts the Grey correlation analysis based on the Technique for Order Preference by Similarity to Ideal Solution (Grey-TOPSIS) method to identify and evaluate the risk of countries along the BRI. Geographic Information System (GIS) maps are drawn according to the criteria for classifying the five risk levels to show the rank of the four aspects of risk scores along the BRI in 2019 and the rank of overall country risk scores during the period 2014–2019. The proposed conclusion and policy implications can help the Chinese government and companies to make informed decisions and minimize potential risks.
1. Introduction
In October 2013, the Chinese government put forward the “Belt and Road Initiative” (BRI), which was officially short for “Silk Road Economic Belt” and “Maritime Silk Road” [1]. In 2013, the Chinese government named 65 countries, mainly in Asia, Europe, and Africa, as being eligible for inclusion in the BRI, and announced that the BRI was open to any other country willing to participate. So far, China has signed 200 cooperation documents with 168 countries and international organizations to jointly build the BRI [2]. This initiative as a long-term national strategy under the new historical context has attracted a lot of attention and discussion globally [3]. Some observers argue that the BRI is a new economic strategy aimed at enhancing the economic connection between China’s domestic market and the global market [4]. Others propose that the aim of this initiative is mainly to optimize the economic structure and external sectors in China [5].
With its goal of enhancing policy coordination, connectivity of infrastructure, unimpeded trade, financial integration, and close people-to-people ties among countries in this region [6], the BRI has achieved positive results [7,8]. Countries along the BRI occupy more than 60% of the population of the whole world, with more than 30% of the world’s gross domestic product (GDP), excluding China [1]. According to the Ministry of Commerce, the achievements of the BRI construction are reflected mainly in the continuous expansion of trade exchanges, deepening of investment cooperation, and steady progress in project construction. To be more specific, trade in goods between China and the countries along the BRI grew by 6% in 2019, accounting for 29.4% of China’s total outward foreign trade; turnover of contracted overseas projects increased by 9.7%, accounting for more than half of the total; and this initiative has created nearly 320,000 jobs for the host country. Following the principle of extensive consultation, joint contribution, and shared benefits, China will make greater efforts to promote economic and trade cooperation as well as high-quality development of the countries along the BRI.
However, risks and challenges are bound to exist in the construction of this large-scale infrastructure and in establishing cooperative trade [9]. In the decision-making process of these transnational projects by countries and enterprises, analysis of the risk of the projects should be given priority [10]. Enterprises engaged in transnational trade and investment will need to be rated for credit risk, just like in domestic general business [11]. However, unlike general domestic operations, the risk of undertaking transnational projects in countries where the trade companies and invested projects are located must be evaluated. The proportion of internal trade along the BRI in relation to total global trade has increased significantly, reaching 13.4% in 2017 and overtaking the North American Free Trade Area (NAFTA) to become the world’s second-largest trade block after the European Union (EU) [12]. Meanwhile, political, economic, and other factors in countries within the BRI are uneven. Most of the transnational trade and outward foreign investment will take a long time to prepare and build [13]. Recently signed projects in China’s ports and high-speed rail construction projects (e.g., in Malaysia, and Indonesia) are advancing rapidly, as are other projects such as the China-Laos railway, the Budapest-Belgrade railway, and the East-West high-speed railway. Thus, close attention should be paid to the risk of countries along the BRI to effectively avoid losses while promoting the initiative [11,14].
The contributions of this study are mainly in two aspects: (1) A new BRI country risk-evaluation index system was created by considering 20 indicators covering four dimensions (e.g., political, economic, social, and investment). We used the Grey correlation analysis based on the Technique for Order Preference by Similarity to Ideal Solution (Grey-TOPSIS) method to calculate the risk scores of countries along the BRI and classify the countries into five risk levels (lowest, low, medium, high, and highest) according to the scores. (2) We drew Geographic Information System (GIS) maps of the ranking of the four dimensions’ risk scores of the BRI countries in 2019 and the ranking of overall country risk scores from 2014 to 2019 to give a more direct view of the distinctions across countries. The proposed conclusion and policies can help the Chinese government and companies make informed decisions and minimize potential risk.
2. Literature Review
In this section, we will discuss the existing studies from two aspects: (1) providing an overview of research reports on the country risk assessment (see Section 2.1); (2) introducing studies on BRI country risk assessment (see Section 2.2).
2.1. Research Reports on Country Risk Assessment
So far, the research reports of country risk assessment focus on two main areas: (1) international information agencies that mainly issue country risk reports, and (2) national credit-rating agencies.
International information agencies publish country risk reports on a monthly, quarterly, or yearly basis to assess political, economic, and social risk in countries around the world. For example, the “International Country Risk Guide” (ICRG), published by the PRS Group, “Country Report” and “Country Profile” published by the Economist Intelligence Unit (EIU), and “International Risk” and “Payment Review” published by Dun & Bradstreet.
There have been many authoritative professional risk-assessment institutions in the world assessing the state of sovereignty, politics, economy, military, and social security of countries globally. Typical examples are Standard & Poor’s, Moody’s, Fitch’s, the World Bank’s World Development Indicators (WDI), and the Betasman Transformation Index (BTI). There are also many domestic institutions carrying out research on the risk index of countries along the BRI, such as the “Renmin University of China Energy Investment Political Risk Index” (RUCIEIPRI), released by the Renmin University of China, and “The Belt and Road Infrastructure Development Index Report” (BRIDI), released by the China International Contractors Association. Nevertheless, to the best of our knowledge, very few reports have focused on country risk assessment, which is essential for the Chinese government and Chinese enterprises to minimize potential risks when making decisions.
2.2. Studies on BRI Country Risk Assessment
At present, scholars have carried out researches on the BRI from various perspectives. Sun et al., investigate the low-carbon financial risk in the project along the BRI and suggest that China needs to establish the risk databases along the BRI to ensure investment efficiency [15]. Other than this, Liu et al., explore the risks of biological invasion on the BRI and find a total of 14 invasion hotspots [16]. Moreover, environmental issues are essential for this initiative, since most of the countries along the BRI are developing countries, and their economic development is under great environmental pressure. Huang identifies the environmental risk and opportunity based on the TOPSIS method and finds that most countries in Central and Eastern Europe (CEE) and some other countries are suitable for environmental investment [14]. A similar conclusion was drawn by Hussain et al., they analyze investment risk and natural resource potential based on a multi-criteria decision-making approach, and find that the majority of countries in CEE and some other countries are suitable for Chinese enterprises to invest in the BRI [9]. Countries along the BRI are rich in oil and gas resources, and many scholars have studied them from the perspective of energy intensity [3], energy efficiency [17], and the role of energy [18] in the relationship between China and the countries along the BRI. For instance, Duan et al., use a fuzzy integrated evaluation model based on the entropy weight to assess the energy investment risk for countries and regions along the BRI and find that resource potential should be considered for investing decisions [19]. Table 1 shows an overview of papers published on the risks of the BRI. While most of the literature adopts econometrics to study the risk along the BRI, a few pieces of literature establish the index system on the several aspects of risk along the BRI, such as outward foreign direct investment (OFDI), investment in coal-fired power plants, and the environment.
Although a growing body of study has focused on the risk index system of the world’s countries or major economies, certain literature gaps still exist. First, the business and investment environment of the host countries (e.g., the time to start a business, the time to electrify, and the number of employees) will significantly influence the risk assessment results. However, to the best of our knowledge, there is no literature that takes into account such dimensions when assessing the risk of countries and regions along the BRI. Second, with the development of the BRI region over time, the weight of each index in country risk assessment along this region is constantly changing. However, most previous studies obtain a series of weights based on one- or multi-year data, from which it is difficult to identify the dynamic differences in the risk results of countries since the BRI was proposed. Based on a broad sample of 49 countries along the BRI covering the period 2014–2019, this study creates a new country risk-evaluation index system using 20 indicators arising from a consideration of four dimensions: political, economic, social, and investment. This study classifies countries along the BRI into five risk levels according to the weights and scores calculated through the Grey-TOPSIS method from 2014 to 2019. GIS maps of the ranking of the four dimensions and overall country risk scores are drawn to give a more direct view of the dynamic distinctions across countries.
3. Methodology and Data
3.1. Construction of the Evaluation Index System
Based on previous studies, this study proposes that the country risk of the BRI region includes four dimensions: political risk, economic risk, social risk, and investment risk; and each dimension includes five secondary indicators. Based on extensive searches of surveys and data, this study extracted 20 indicators from the World Bank’s World Development Indicators (WDI) and the PRS Group’s International Country Risk Guide (ICRG) databases with a consolidated description. This study assumes that the weight of each index in this system varies by year. Table 2 illustrates the detailed explanation of each indicator, the data sources, and the sign of indicators.
3.1.1. Political Risk
The political environment along the BRI is complex and there is little cause for optimism about the political future of some of the countries, which poses a threat to the construction of the BRI. Political risk refers mainly to the possibility of economic losses caused by changes in the political environment, political instability, and changes in the policies and regulations of the host country. High political risk and political instability will consistently result in higher country risk, lower risk score, and higher risk rating. In this study, five political risk indicators were presented (see Table 2). Notably, political stability and absence of violence [9], government credit [15], and several other factors can also be considered important for the country political risk index. However, considering the detailed explanations of these indicators are consistent with the indexes selected in this study (i.e., internal conflict, external conflict, and government stability) to some extent, these indicators were not considered in our model.
3.1.2. Economic Risk
Most of the countries along the BRI are developing countries. Due to different conditions of economic development, these countries confront many unstable factors. Economic risk refers mainly to the possibility of economic losses suffered due to economic problems in the host country’s economy. A better economic environment will lead to lower country risk, higher risk score, and lower risk rating. In this study, the aspect of economic risk included five sub-indicators (see Table 2). In addition, GDP per capita growth [19], exchange rate stability [14], total foreign debt as a percentage of GDP [9], and several other indexes can also be considered reasonable to evaluate the country economic risk. The indicators selected in this study (i.e., GDP per capita, and inflation rate) can explain these factors to some extent.
3.1.3. Social Risk
Social risk can lead to social conflict and endanger social stability and social order. More directly, social risk means the possibility of a social crisis. A social risk that turns into a social crisis can have a disastrous impact on a country’s stability and social order. The advancement of economic globalization coexists with the increase of social risk. High social conflict and social instability will result in higher country risk, lower risk score, and higher risk rating. In this study, five social risk indicators were assessed (see Table 2). Notably, some literature classifies job creation, social acceptance, and social benefits in the renewable energy industry into social risk [22], while this study mainly focuses on social stability rather than the benefits. Thus, these indicators were not considered in our model.
3.1.4. Investment Risk
Investment risk refers mainly to investors’ uncertainty about future investment returns, and the risk that investors may suffer income loss or even principal loss in the investment process. To be specific, investment risk refers to the deviation between the actual return and the expected return due to the influence of some uncontrollable factors in the investment process. A better business and investment environment will significantly lead to lower country risk, higher risk score, and lower risk rating. However, no literature takes this dimension into account when establishing the risk assessment along the BRI, and the aspect of investment risk included five sub-indicators in this study (see Table 2). For instance, the shorter the time taken to start a business, electrify, and execute the contract, the better for the investment. The business and investment environment will be better if the time for a company to start a business, electrify, and execute the contract in the host country is short.
3.2. Grey-TOPSIS Model
The Grey-TOPSIS model adopted to assess country risk in this paper is as follows. In order to calculate a comprehensive risk-evaluation index, it is necessary to dimensionally change the indicators in different positive and negative indicators. In this paper, deviation standardization was adopted to carry out a linear transformation of the original data, so that the results fall into the interval of [0, 1]. The entropy-weighting method is an objective weighting method, which depends mainly on the overall influence of indicators’ change on the relative degree of the system. In general, indicators with a relatively large change have a greater weight.
Suppose we use a - dimension indicator to assess risk in countries, then the indicator system . In this paper, represent political risk, economic risk, social risk, and investment risk respectively. The – dimensions index data matrix is defined as follows:
where indicates the second order index of the aspect. Let and represent the maximum and minimum value of the index of the aspect in all countries and regions respectively.
The risk direction of the original data is inconsistent, so we normalize the data in the following ways:
Then we get the normalized matrix as follows:
where is the normalized value of . Let denote the standardized score of the index of country and defined as follows:
Index ratio , index ratio matrix , and the entropy are defined as follows:
makes no sense when in the empirical analysis. Therefore, needs to be modified and defined as follows:
where q is any small number. Entropy vector . The weight of the secondary index is set to :
The weight matrix composed of each secondary index:
Then according to , we get the weights for each aspect and . and are defined as the maximum and minimum score of standardized score for all countries. The evaluation sequence , the optimal reference sequence , and the worst reference sequence of the country after standardization are defined as follows:
The optimal and worst Grey-TOPSIS correlation coefficients are defined as follows:
where is the distinguishing coefficient used to weaken or enhance the influence of on the Grey-TOPSIS correlation coefficient. The range of is generally (0, 1]. Other literature often makes , so in this study, the value is like that.
3.3. Regions, Countries, and Data
The BRI aims to build an open cooperation platform linked by the “Silk Road Spirit” on a global scale. As the initiative is gaining international recognition, more and more countries are getting involved. In the selection of BRI countries between 2014 and 2019, 49 were chosen as the research objects based on a comprehensive consideration of important nodes and data availability of countries along the BRI (see Table 3).
4. Results and Discussions
4.1. Weight of Country (Economy) Risk Index
This study uses the Grey-TOPSIS method to calculate the risk index of countries along the BRI and obtain the weight of each index (see Table 4).
As can be seen from Table 4, the results of the weights of the risk index systems along the BRI verify the hypothesis in Section 3.1, the weight of each index in this system varies by year. It can be seen that the investment risk index has the lowest weight of the four indexes during 2014–2019, and its weight decreased significantly, nearly half, with time. The weight of the political risk and social risk slightly dropped since 2017 and 2016, respectively. The weight of the economic risk significantly increased since 2016, which indicates that country risk is increasingly related to the economic environment. In 2019, the most important indicators of political risk were government stability and internal and external conflicts. As for economic risk, GDP and investment openness are the primary consideration indicators. Bureaucracy and the number of employees are significant for social and investment risk, respectively.
According to the formula in Chapter 3, we combined the Grey-TOPSIS correlation coefficient with the index weight and then calculated the risk score based on the Grey-TOPSIS correlation coefficient. The secondary index score of political, economic, social, and investment risk is between 1 and 100. The higher the score, the higher the risk. This paper finally shows the scores of political, economic, social, and investment risk related indicators of the 49 selected countries along the BRI in 2019 (see Appendix Table A1, Table A2, Table A3 and Table A4).
4.2. Country (Economy) Risk Evaluation
According to the quantile of 0.2, 0.4, 0.6, 0.8, and 1.0, the country risk scores along the BRI are divided into five grades: lowest risk, low risk, medium risk, high risk, and highest risk.
(1) Lowest-risk country. There is little risk of loss of direct investment in the country or region. Even if a country crisis occurs, the responsible party may take certain measures to compensate for the loss of projects and enterprises.
(2) Low-risk country. In the foreseeable period of time, adverse factors could bring uncertainty resulting in losses among projects and enterprises.
(3) Medium-risk country. There are obvious problems in a certain aspect or several aspects of the countries or regions, which may cause certain losses to the projects and enterprises.
(4) High-risk country. The risk factors in this country are relatively serious, the probability of risk accidents is relatively high, and losses to projects and enterprises in this country are potentially high.
(5) Highest-risk country. This country has a high probability of risk accidents, which may cause higher losses to projects and enterprises.
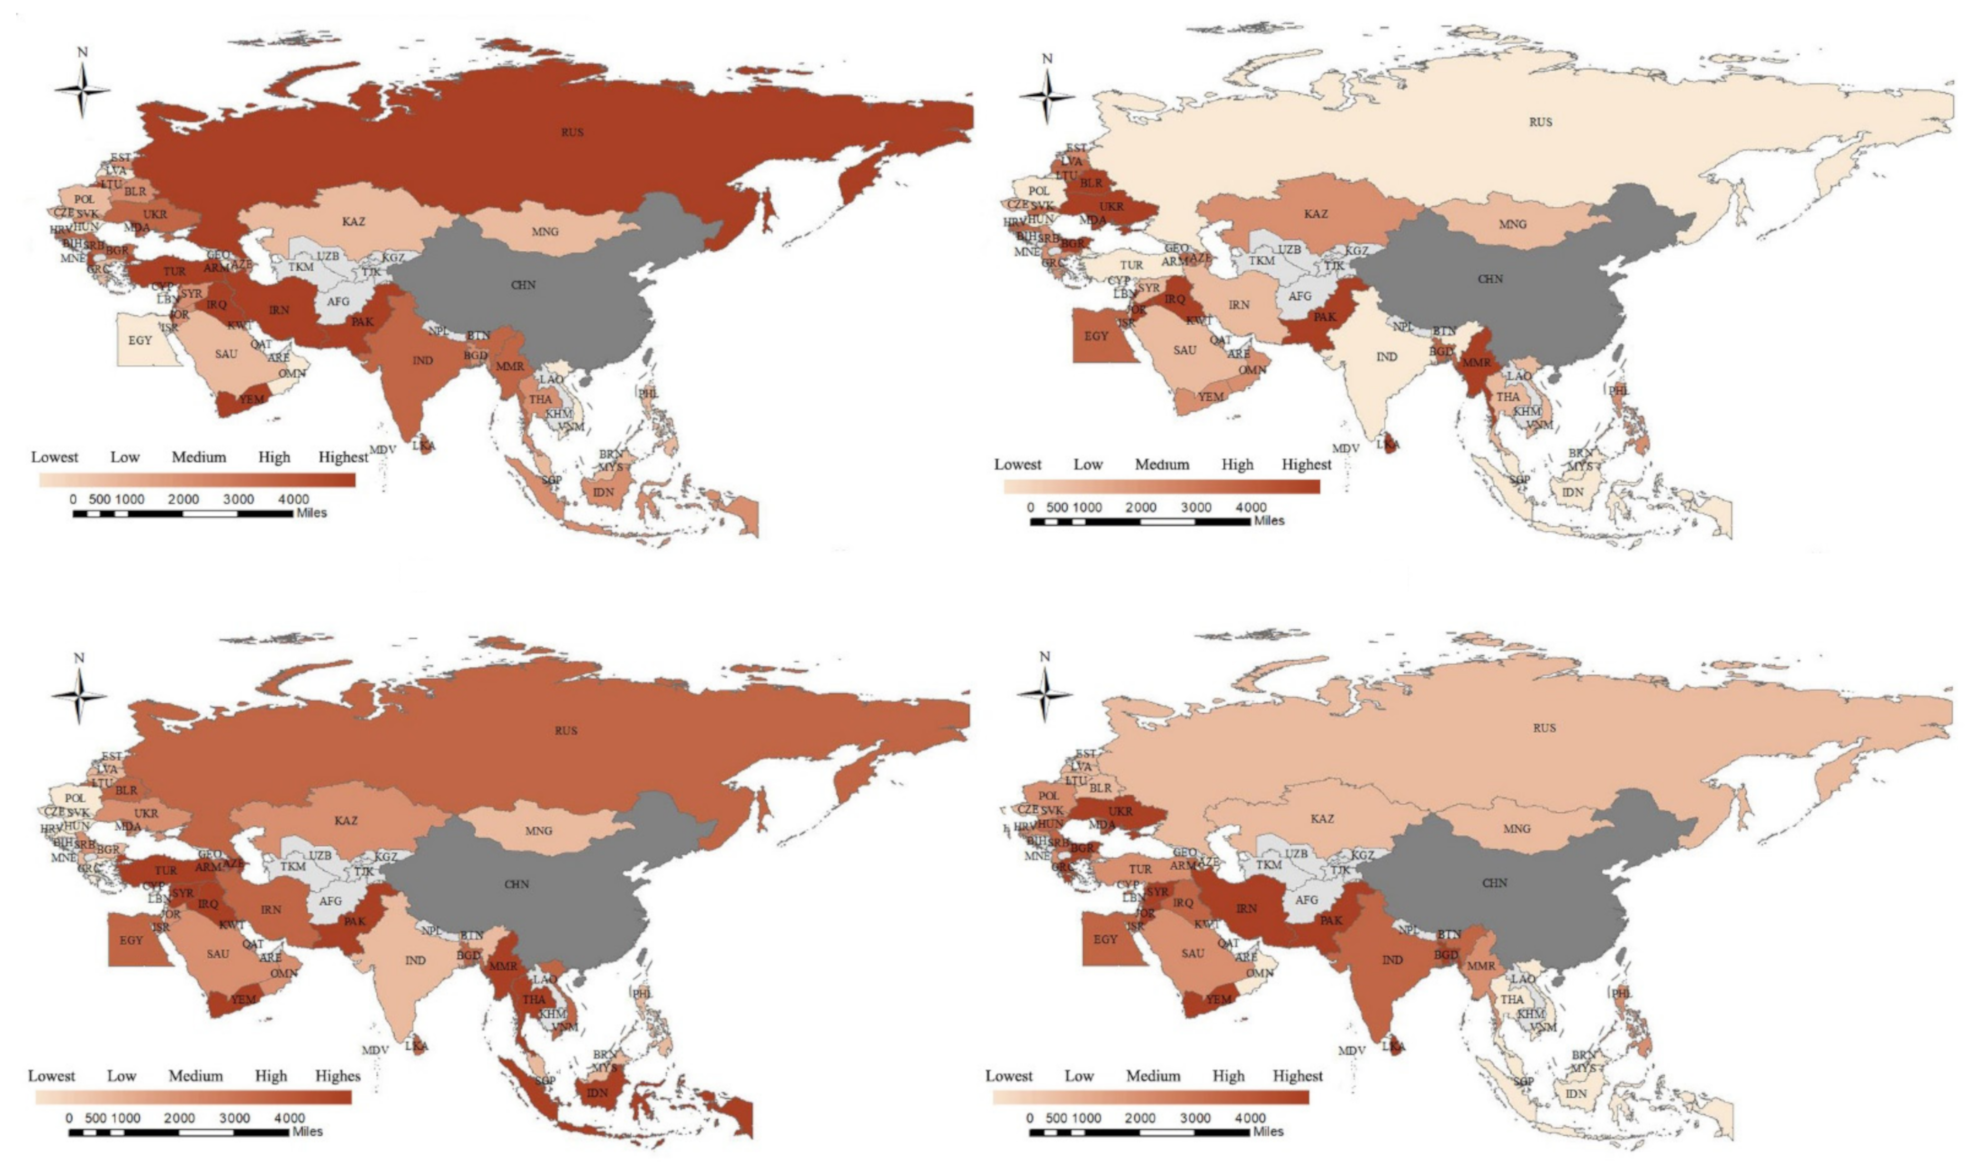
We use this rating method to classify risk scores of countries from the Grey-TOPSIS and draw GIS maps to help make decisions related to trade cooperation and investment. Figure 1 shows the 2019 results, where (a) is political risk evaluation, (b) is economic risk evaluation, (c) is social risk evaluation, and (d) is investment risk evaluation.
4.2.1. Political Risk Evaluation
Several countries and economies with the most intense geopolitical conflicts in the world are distributed along the BRI, presenting a geopolitical security deficit. For example, latent risks of regional conflicts exist in Afghanistan, Syria, and other countries. Furthermore, the border areas of North Africa, Russia, and Ukraine have become virtually stagnant due to wars and conflicts. The China-Pakistan Economic Corridor (CPEC), the China-Sri Lanka port, and industrial park projects have also caused political instability in India. Although the China-Laos Railway, the Budapest-Belgrade Railway, and the Jakarta-Bandung High-speed Railway have finally entered the construction stage, potential risks cannot be ignored.
In the lowest political risk countries (e.g., Brunei, Oman, and Singapore), there is little risk of expropriation or exchange restrictions, and there is little risk of war, insurrection, or harassment that would harm Chinese investment enterprises. Countries with low (e.g., Greece, Malaysia, and Poland), and medium (e.g., Azerbaijan, Belarus, and Indonesia) political risk are less likely to have a situation in which the host government illegally occupies or expropriates the property of foreign-invested enterprises, or restricts the transfer of property belonging to Chinese invested enterprises. Some countries with high (e.g., India, Kuwait, and Myanmar) and the highest (e.g., Iraq, Iran, and Israel) political risk have not yet fully recovered from the effects of war, and are still at risk of war, insurgence, and unrest. Besides, due to war, such high- and highest-risk areas are not highly regulated and the laws there are not sound enough. The conclusion can be drawn that the CEE region has less political risk than other regions along the BRI, which is consistent with results in the previous literature [9]. In addition, this study finds that the CIS and West Asia region ranked high and the highest political risk, while most countries in the ASEAN region were classed as low and medium political risk countries.
4.2.2. Economic Risk Evaluation
Countries with better economic conditions can always bring a higher level of investment returns and investment security. There are trade barriers in the BRI region, and it relies too much on external markets, so it is at great risk of being impacted by external fluctuations. Vicious competition, insufficient facilitation, and high logistics costs among economies also make it more difficult to circulate goods and services.
Countries with the lowest economic risk (e.g., Singapore, Malaysia, and Poland) have a good economic environment, which makes these countries very suitable for trade cooperation and investment construction. Countries with low (e.g., Brunei, Kuwait, and Thailand) and medium (e.g., Azerbaijan, Kazakhstan, and Oman) economic risk have relatively fast economic growth and a relatively high degree of investment openness. Countries with high (e.g., Bahrain, Egypt, and Romania) and the highest (e.g., Myanmar, Iraq, and Ukraine) economic risk are excessively dangerous in some or many aspects. This study concludes that the ASEAN and CIS regions were classed as low and lowest regions, while previous literature shows that most countries in the ASEAN region are medium risk countries [9]. This may due to the fact that this study takes socioeconomic conditions into account. Besides, this study concluded that most countries in West Asia were placed in the category of medium economic risk.
4.2.3. Social Risk Evaluation
Social risk is the possibility of social conflict that endangers social stability and order. Once this possibility becomes a reality, social risk turns into a social crisis.
In the lowest social risk countries (e.g., Singapore, Greece, and Czechia), the government and army can play a very important role in the face of internal or external threats. Countries with low (e.g., the Philippines, Estonia, and Mongolia) and medium (e.g., Qatar, Kuwait, and Oman) social risk have a relatively good social environment. However, it is still necessary to be alert to the possibility of one or several prominent dimensions of social risk during the BRI construction. Social dissatisfaction in high-risk countries (e.g., Iran, Bangladesh, and Moldova) or highest-risk countries (e.g., Syria, Iraq, and Yemen) may be derived from religious, ethnic, or linguistic differences, which lead to higher religious and ethnic tensions. In some countries, there have been frequent demonstrations, and the resulting riots have continued to worsen domestic social security. Governments and military forces in such countries are not well equipped to deal with actual internal or external threats. The conclusion can be drawn that the CIS, ASEAN, and West Asia region has higher social risk than other regions along the BRI, while the social condition in the CEE region is relatively stable.
4.2.4. Investment Risk Evaluation
Investors must take risks in order to obtain expected returns from investment activities. Investment risk mainly measures the likelihood that China’s OFDI profits will deviate from expected outcomes and lead to changes in the operation of overseas investments.
Good investment environment and lowest investment risk countries (e.g., Singapore, Qatar, and Brunei) are conducive to smooth overseas investment activities. When investing in low-risk countries (e.g., Mongolia, Lithuania, and Russia) and medium-risk countries (e.g., Slovakia, Poland, and the Philippines), it is necessary to measure whether a company can bear the probability of loss. The proportion of employed people in countries with high (e.g., Cyprus, Moldova, and Iraq) and highest (e.g., Iran, Syria, and Yemen) investment risk is generally low, which makes it more difficult to have sufficient human resources to carry out projects when making overseas investments. Most countries in the ASEAN and CIS regions have lower investment risk, while the countries in the West Asia and CEE regions have higher investment risk than other regions.
4.3. Country Risk Change Along the BRI, from 2014 to 2019
As the BRI was proposed in September 2013, this study uses the Grey-TOPSIS model to calculate the country risk of BRI countries from 2014 to 2019 (see Table A5). A GIS map according to the criteria for classification into five grades (see Section 4.1) was also created to show the differences of risk among countries and the changes of risk during 2014–2019 (see Figure 2).
Most previous literature obtains a series of weights based on one- or multi-year data, from which it is difficult to identify dynamic changes in the weights of indexes and the results of country risk assessment across countries since the BRI was proposed. A dynamic analysis of country risk along the BRI is necessary to identify how the risks of countries changed since the initiative was proposed. As can be seen from Figure 2, except for a few countries such as Indonesia, Iran, and Kazakhstan, the risk of other countries did not change significantly during the six years. The risk of countries in Central Asia, South Asia, and CEE was relatively low from 2014 to 2019. While for countries in the CIS and ASEAN region, it was relatively high in 2014, and gradually decreased over time. The risk of countries in West Asia remained basically unchanged during 2014–2019.
Some interesting points are worth mentioning according to Figure 2:
(1) The decline of country risk in India, Russia, and other countries in 2018 was driven mainly by the improvement of national economic conditions.
(2) Indonesia went from being a high-risk country to the highest risk country in 2015. From 2015 to 2016, Indonesia witnessed political turmoil, prominent corruption problems, and poor administration. Indonesia’s excessive protection of local workers, restrictions on the importation of foreign workers, coupled with the intervention from the United States, Japan, and other countries, eventually led to the “influx of Chinese workers into Indonesia” controversy. This country did not return to a medium-risk level until 2017, and to a low-risk level in 2019.
(3) After Iran’s announcement in February 2003 that it had discovered and refined uranium, there was great concern in society. After signing the Treaty on the Non-Proliferation of Nuclear Weapons in December 2003, Iran resumed nuclear ignition tests in 2006, and the Iranian nuclear issue re-emerged. It was not until the Iranian nuclear agreement was reached in July 2015 that the Iranian nuclear issue came to the end.
(4) In 2015, as the international oil price continued to decline, Kazakhstan, as a major energy country, experienced a significant slowdown in economic growth. The country’s foreign trade fell by more than a third that year and the country risk rose from low to medium levels. In 2017, due to the improvement of external economic factors, the overall resurgence of the energy industry, and the increase of domestic oil production, Kazakhstan’s economy started recovering.
5. Conclusions and Policy Implications
This paper establishes a BRI country risk evaluation index system from four dimensions (i.e., political risk, economic risk, social risk, and investment risk). In this paper, the Grey-TOPSIS model is adopted to identify risk in the four dimensions of the BRI countries in 2019 and to evaluate the countries’ risk changes during the period 2014–2019. The main findings of this study are as follows:
(1) The economic risk index accounted for the largest weight in the countries’ risk assessment, followed by the social risk index and the political risk index, while the investment risk index took up the least weight. Among the economic risk indicators, the most influential is the country’s GDP per capita, which accounts for more than half of the economic risk indicators.
(2) We found relatively high political and social risk in West Asia and the CIS countries. South Asia has relatively high economic and investment risks. The ASEAN region has relatively high economic and social risks. The risk in CEE is relatively low. The political, economic, and investment risk in Central Asia is very low, and social risk is relatively moderate.
The above findings suggest several policy implications:
(1) The Chinese government and enterprises need to pay full attention to countries with the lowest political risk along the BRI. When domestic enterprises identify the risk of cooperation countries, they can take into account the risk score in this study and the actual situation and determine whether the corresponding risk that exists in the countries is controllable.
(2) Nowadays, most of the countries that have signed bilateral or multilateral investment protection agreements with China are developing countries. Due to the large number of developing countries along the BRI, the Chinese government should give full play to its role in management, supervision, service, and protection, and actively sign bilateral and multilateral investment protection agreements to effectively promote trade cooperation and investment in infrastructure.
(3) China should establish cooperation with countries’ governments and societies along the BRI, share information, and strengthen prevention measures. Once an incident occurs in a cooperative country, the country and enterprise need to take active measures to effectively assess, warn about, and deal with the risks involved. BRI risk-assessment reports need to be issued regularly, and a BRI country risk-assessment system and an emergency response mechanism need to be established and improved.
Author Contributions
J.L.: data curation, methodology, software. X.D.: writing—review and editing, supervision, funding acquisition. Q.J.: conceptualization, writing—review and editing. K.D.: validation, writing—original draft, funding acquisition. All authors have read and agreed to the published version of the manuscript.
Funding
The article was supported by the Fundamental Research Funds for the Central Universities in UIBE (Grant No. 19QD03), the National Social Science Foundation of China (Grant No. 18VDL017), and the Innovation Methods Special Foundation of the Chinese Ministry of Science and Technology (Grant No. 2018IMO40100). Certainly, all remaining errors are our own.
Conflicts of Interest
No potential conflict of interest was reported by the authors.
Appendix A

Table A1.
The political risk faced by the construction of the BRI countries in 2019.
| Country | A1 | A2 | A3 | A4 | A5 | Country | A1 | A2 | A3 | A4 | A5 |
|---|---|---|---|---|---|---|---|---|---|---|---|
| ALB | 0.00 | 65.04 | 81.67 | 62.50 | 42.86 | LTU | 20.48 | 77.24 | 80.00 | 50.00 | 20.48 |
| ARM | 100.00 | 64.23 | 17.50 | 75.00 | 42.86 | MYS | 32.53 | 80.49 | 70.00 | 62.50 | 32.53 |
| AZE | 42.17 | 66.67 | 17.50 | 87.50 | 57.14 | MDA | 1.20 | 54.47 | 60.00 | 75.00 | 1.20 |
| BHR | 38.55 | 21.95 | 70.00 | 62.50 | 85.71 | MNG | 13.25 | 94.31 | 100.0 | 66.67 | 13.25 |
| BGD | 67.47 | 28.46 | 46.67 | 62.50 | 14.29 | MMR | 31.33 | 18.70 | 40.00 | 75.00 | 31.33 |
| BLR | 24.10 | 60.98 | 70.00 | 75.00 | 57.14 | OMN | 67.47 | 70.73 | 70.00 | 50.00 | 67.47 |
| BRN | 67.47 | 100.00 | 70.00 | 50.00 | 80.95 | PAK | 4.82 | 28.46 | 34.17 | 75.00 | 4.82 |
| BGR | 16.87 | 89.43 | 56.67 | 50.00 | 42.86 | PHL | 42.17 | 51.22 | 77.50 | 62.50 | 42.17 |
| HRV | 6.02 | 80.49 | 70.00 | 50.00 | 85.71 | POL | 27.71 | 82.93 | 70.00 | 50.00 | 27.71 |
| CYP | 38.55 | 90.24 | 50.00 | 37.50 | 100.00 | QAT | 96.39 | 70.73 | 10.00 | 37.50 | 96.39 |
| CZE | 19.28 | 87.80 | 80.00 | 54.17 | 100.00 | ROU | 2.41 | 52.85 | 90.00 | 62.50 | 2.41 |
| EGY | 72.29 | 40.65 | 60.00 | 75.00 | 42.86 | RUS | 30.12 | 30.08 | 10.00 | 87.50 | 30.12 |
| EST | 0.00 | 100.00 | 90.00 | 25.00 | 71.43 | SAU | 61.45 | 58.54 | 28.33 | 37.50 | 61.45 |
| GRC | 26.51 | 80.49 | 80.00 | 62.50 | 85.71 | SRB | 24.10 | 51.22 | 50.00 | 75.00 | 24.10 |
| HUN | 59.04 | 84.55 | 80.00 | 50.00 | 71.43 | SGP | 89.16 | 70.73 | 80.00 | 0.00 | 89.16 |
| IND | 26.51 | 33.33 | 28.33 | 62.50 | 85.71 | SVK | 12.05 | 88.62 | 90.00 | 37.50 | 12.05 |
| IDN | 53.01 | 52.85 | 50.00 | 50.00 | 28.57 | SVN | 2.41 | 80.49 | 73.33 | 37.50 | 2.41 |
| IRN | 21.69 | 63.41 | 0.00 | 87.50 | 71.43 | LKA | 10.84 | 51.22 | 80.00 | 75.00 | 10.84 |
| IRQ | 20.48 | 40.65 | 65.83 | 89.58 | 0.00 | SYR | 53.01 | 23.58 | 17.50 | 100.0 | 53.01 |
| ISR | 6.02 | 41.46 | 30.00 | 37.50 | 100.00 | THA | 45.78 | 24.39 | 56.67 | 75.00 | 45.78 |
| JOR | 38.55 | 23.58 | 60.00 | 50.00 | 57.14 | TUP | 21.69 | 27.64 | 24.17 | 62.50 | 21.69 |
| KAZ | 43.37 | 56.91 | 90.00 | 50.00 | 57.14 | UKR | 36.14 | 38.21 | 15.83 | 65.63 | 36.14 |
| KWT | 8.43 | 57.72 | 60.83 | 62.50 | 71.43 | VNM | 53.01 | 85.37 | 60.00 | 62.50 | 53.01 |
| LVA | 21.69 | 90.24 | 90.00 | 62.50 | 100.00 | YEM | 9.64 | 12.20 | 10.00 | 100.0 | 9.64 |
| LBN | 4.82 | 0.00 | 12.50 | 87.50 | 71.43 |
Notes: “A1” represents government stability, “A2” represents internal conflict, “A3” represents external conflict, “A4” represents control of corruption, and “A5” represents law and order.
Table A2.
The economic risk faced by the construction of the BRI countries in 2019.
| Country | B1 | B2 | B3 | B4 | B5 | Country | B1 | B2 | B3 | B4 | B5 |
|---|---|---|---|---|---|---|---|---|---|---|---|
| ALB | 0.04 | 56.93 | 9.53 | 75.26 | 36.81 | LTU | 0.36 | 69.38 | 4.09 | 60.97 | 72.39 |
| ARM | 0.04 | 95.99 | 3.44 | 69.25 | 39.88 | MYS | 3.37 | 72.28 | 3.68 | 76.94 | 100.0 |
| AZE | 0.43 | 56.97 | 4.73 | 78.66 | 82.21 | MDA | 0.00 | 65.94 | 6.59 | 46.87 | 31.29 |
| BHR | 0.21 | 54.07 | 4.03 | 73.95 | 58.90 | MNG | 0.04 | 77.86 | 19.45 | 31.17 | 39.26 |
| BGD | 1.74 | 100.00 | 2.23 | 52.61 | 27.61 | MMR | 0.67 | 61.82 | 4.61 | 34.91 | 34.97 |
| BLR | 0.46 | 49.74 | 3.60 | 40.87 | 44.17 | OMN | 0.56 | 44.50 | 6.06 | 96.13 | 55.21 |
| BRN | 0.04 | 68.94 | 4.37 | 95.91 | 92.02 | PAK | 2.14 | 48.05 | 2.36 | 29.49 | 44.17 |
| BGR | 0.46 | 65.33 | 3.80 | 51.53 | 65.03 | PHL | 3.04 | 84.68 | 3.62 | 73.14 | 30.67 |
| HRV | 0.49 | 62.17 | 3.52 | 69.08 | 66.26 | POL | 5.64 | 70.95 | 4.29 | 60.99 | 78.53 |
| CYP | 0.16 | 64.30 | 100.00 | 74.25 | 73.62 | QAT | 1.44 | 39.55 | 0.00 | 99.32 | 80.98 |
| CZE | 2.12 | 59.49 | 5.40 | 57.80 | 82.21 | ROU | 1.95 | 70.46 | 4.36 | 38.96 | 42.33 |
| EGY | 2.53 | 81.18 | 4.57 | 1.68 | 49.69 | RUS | 15.20 | 50.61 | 3.46 | 56.36 | 63.19 |
| EST | 0.15 | 72.31 | 11.13 | 59.53 | 67.48 | SAU | 6.02 | 43.28 | 2.14 | 74.68 | 64.42 |
| GRC | 2.15 | 54.45 | 3.78 | 79.49 | 57.67 | SRB | 0.35 | 71.24 | 10.00 | 63.71 | 48.47 |
| HUN | 1.39 | 76.61 | 21.75 | 52.28 | 84.66 | SGP | 2.83 | 46.20 | 30.31 | 76.85 | 93.25 |
| IND | 25.63 | 77.31 | 3.34 | 64.54 | 40.49 | SVK | 0.91 | 58.27 | 3.78 | 62.75 | 62.58 |
| IDN | 10.36 | 77.32 | 3.82 | 68.47 | 80.37 | SVN | 0.41 | 58.59 | 4.78 | 63.94 | 63.19 |
| IRN | 4.67 | 63.40 | 7.59 | 61.58 | 51.53 | LKA | 0.67 | 57.44 | 2.47 | 65.21 | 54.60 |
| IRQ | 1.82 | 72.79 | 0.22 | 77.39 | 4.91 | SYR | 4.67 | 63.40 | 7.59 | 61.58 | 22.09 |
| ISR | 2.69 | 66.36 | 6.45 | 64.89 | 82.21 | THA | 3.84 | 58.08 | 2.70 | 73.23 | 67.48 |
| JOR | 0.20 | 55.38 | 3.47 | 68.77 | 18.40 | TUP | 10.77 | 47.24 | 2.74 | 0.00 | 48.47 |
| KAZ | 1.76 | 73.51 | 3.58 | 39.93 | 66.87 | UKR | 1.09 | 64.33 | 5.40 | 32.21 | 47.24 |
| KWT | 1.11 | 43.87 | 2.06 | 100.00 | 98.16 | VNM | 1.66 | 91.77 | 7.80 | 67.44 | 44.17 |
| LVA | 0.19 | 56.81 | 4.70 | 62.76 | 66.26 | YEM | 4.67 | 63.40 | 7.59 | 61.58 | 0.00 |
| LBN | 0.26 | 0.00 | 5.78 | 61.27 | 51.53 |
Notes: “B1” represents GDP per capita, “B2” represents economic growth, “B3” represents investment openness, “B4” represents inflation rate, and “B5” represents socioeconomic conditions.
Table A3.
The social risk faced by the construction of the BRI countries in 2019.
| Country | C1 | C2 | C3 | C4 | C5 | Country | C1 | C2 | C3 | C4 | C5 |
|---|---|---|---|---|---|---|---|---|---|---|---|
| ALB | 82.35 | 80.00 | 70.00 | 81.82 | 33.33 | LTU | 82.35 | 90.00 | 60.00 | 90.91 | 50.00 |
| ARM | 55.88 | 80.00 | 90.00 | 63.64 | 0.00 | MYS | 82.35 | 50.00 | 50.00 | 63.64 | 66.67 |
| AZE | 47.06 | 60.00 | 70.00 | 18.18 | 0.00 | MDA | 64.71 | 100.0 | 20.00 | 63.64 | 0.00 |
| BHR | 47.06 | 40.00 | 60.00 | 45.45 | 33.33 | MNG | 82.35 | 80.00 | 80.00 | 63.64 | 50.00 |
| BGD | 38.24 | 40.00 | 30.00 | 63.64 | 33.33 | MMR | 20.59 | 40.00 | 30.00 | 45.45 | 0.00 |
| BLR | 47.06 | 80.00 | 80.00 | 9.09 | 16.67 | OMN | 82.35 | 60.00 | 80.00 | 27.27 | 33.33 |
| BRN | 82.35 | 70.83 | 70.83 | 0.00 | 83.33 | PAK | 20.59 | 0.00 | 0.00 | 63.64 | 33.33 |
| BGR | 82.35 | 80.00 | 69.17 | 90.91 | 33.33 | PHL | 30.15 | 40.00 | 60.00 | 81.82 | 66.67 |
| HRV | 82.35 | 80.00 | 60.00 | 90.91 | 66.67 | POL | 100.0 | 80.00 | 100.0 | 84.85 | 66.67 |
| CYP | 82.35 | 60.00 | 30.00 | 100.00 | 100.00 | QAT | 64.71 | 60.00 | 100.0 | 27.27 | 33.33 |
| CZE | 100.00 | 100.00 | 60.00 | 81.82 | 66.67 | ROU | 82.35 | 80.00 | 50.00 | 100.0 | 0.00 |
| EGY | 11.76 | 30.00 | 80.00 | 36.36 | 45.83 | RUS | 64.71 | 90.00 | 40.00 | 32.58 | 19.44 |
| EST | 82.35 | 80.00 | 30.00 | 90.91 | 50.00 | SAU | 82.35 | 50.00 | 80.00 | 27.27 | 33.33 |
| GRC | 82.35 | 80.00 | 80.00 | 100.00 | 66.67 | SRB | 64.71 | 80.00 | 40.00 | 90.91 | 33.33 |
| HUN | 100.00 | 90.00 | 60.00 | 81.82 | 66.67 | SGP | 82.35 | 70.00 | 100.0 | 27.27 | 100.0 |
| IND | 64.71 | 30.00 | 30.00 | 100.00 | 66.67 | SVK | 100.0 | 60.00 | 50.00 | 100.0 | 66.67 |
| IDN | 38.24 | 10.00 | 20.00 | 69.70 | 34.72 | SVN | 91.18 | 90.00 | 50.00 | 81.82 | 83.33 |
| IRN | 64.71 | 20.00 | 50.00 | 45.45 | 33.33 | LKA | 47.06 | 20.00 | 40.00 | 63.64 | 33.33 |
| IRQ | 0.00 | 5.00 | 30.00 | 63.64 | 16.67 | SYR | 29.41 | 50.00 | 30.00 | 9.09 | 16.67 |
| ISR | 38.24 | 30.00 | 20.00 | 100.00 | 100.00 | THA | 29.41 | 20.00 | 60.00 | 36.36 | 33.33 |
| JOR | 64.71 | 60.00 | 50.00 | 45.45 | 33.33 | TUP | 29.41 | 50.00 | 20.00 | 40.15 | 33.33 |
| KAZ | 82.35 | 60.00 | 60.00 | 28.79 | 52.78 | UKR | 82.35 | 80.00 | 60.00 | 81.82 | 0.00 |
| KWT | 82.35 | 50.00 | 70.00 | 45.45 | 33.33 | VNM | 47.06 | 60.00 | 70.00 | 18.18 | 33.33 |
| LVA | 82.35 | 80.00 | 30.00 | 81.82 | 50.00 | YEM | 38.24 | 30.00 | 40.00 | 36.36 | 0.00 |
| LBN | 29.41 | 30.00 | 80.00 | 72.73 | 33.33 |
Notes: “C1” represents military in politics, “C2” represents religious tensions, “C3” represents ethnic tensions, “C4” represents democratic accountability, and “C5” represents bureaucracy.
Table A4.
The investment risk faced by the construction of the BRI countries in 2019.
| Country | D1 | D2 | D3 | D4 | D5 | Country | D1 | D2 | D3 | D4 | D5 |
|---|---|---|---|---|---|---|---|---|---|---|---|
| ALB | 46.55 | 95.77 | 80.66 | 76.66 | 29.39 | LTU | 70.11 | 94.37 | 76.13 | 86.68 | 45.87 |
| ARM | 55.17 | 96.48 | 80.25 | 73.76 | 24.38 | MYS | 55.17 | 77.46 | 100.0 | 83.13 | 54.17 |
| AZE | 43.10 | 97.18 | 93.00 | 92.70 | 55.44 | MDA | 42.53 | 96.48 | 74.07 | 72.79 | 14.23 |
| BHR | 45.98 | 90.42 | 81.48 | 69.55 | 74.08 | MNG | 55.17 | 85.21 | 77.37 | 86.43 | 42.86 |
| BGD | 36.78 | 74.65 | 58.66 | 17.39 | 43.67 | MMR | 48.28 | 92.25 | 81.07 | 35.62 | 51.45 |
| BLR | 46.55 | 90.14 | 66.67 | 92.82 | 52.36 | OMN | 52.87 | 96.06 | 97.53 | 71.95 | 69.61 |
| BRN | 68.97 | 94.37 | 99.59 | 75.69 | 47.88 | PAK | 36.21 | 78.87 | 63.52 | 41.36 | 31.95 |
| BGR | 79.31 | 69.72 | 2.06 | 74.14 | 37.04 | PHL | 65.52 | 55.63 | 94.65 | 48.42 | 47.06 |
| HRV | 67.24 | 74.65 | 83.13 | 68.58 | 27.10 | POL | 81.03 | 50.00 | 63.37 | 66.32 | 40.33 |
| CYP | 74.14 | 93.66 | 53.50 | 39.50 | 47.31 | QAT | 71.84 | 89.86 | 91.77 | 73.76 | 100.0 |
| CZE | 82.76 | 67.61 | 86.01 | 66.77 | 49.01 | ROU | 51.72 | 73.94 | 38.27 | 77.50 | 36.15 |
| EGY | 49.43 | 84.51 | 88.07 | 45.31 | 15.52 | RUS | 53.45 | 87.89 | 93.13 | 88.82 | 48.23 |
| EST | 68.97 | 97.18 | 72.43 | 81.19 | 50.73 | SAU | 48.28 | 87.46 | 95.47 | 73.43 | 36.30 |
| GRC | 82.76 | 96.48 | 88.89 | 0.00 | 18.17 | SRB | 48.28 | 92.25 | 58.44 | 70.39 | 27.63 |
| HUN | 82.18 | 92.25 | 4.12 | 71.49 | 39.99 | SGP | 100.0 | 100.0 | 99.18 | 100.0 | 64.40 |
| IND | 57.47 | 77.46 | 88.13 | 17.19 | 25.27 | SVK | 76.44 | 71.83 | 73.25 | 60.50 | 43.13 |
| IDN | 60.34 | 84.37 | 96.61 | 84.54 | 58.23 | SVN | 57.47 | 90.85 | 94.24 | 35.62 | 42.54 |
| IRN | 34.48 | 0.00 | 78.19 | 77.96 | 12.09 | LKA | 35.06 | 90.85 | 68.72 | 25.40 | 34.59 |
| IRQ | 48.28 | 64.79 | 88.89 | 76.99 | 8.18 | SYR | 34.48 | 80.28 | 49.79 | 54.23 | 13.66 |
| ISR | 82.18 | 86.62 | 67.90 | 47.58 | 53.08 | THA | 59.77 | 93.66 | 97.53 | 83.45 | 62.86 |
| JOR | 41.38 | 84.51 | 87.24 | 69.10 | 0.80 | TUP | 41.38 | 92.25 | 95.88 | 70.33 | 23.50 |
| KAZ | 54.60 | 95.07 | 80.66 | 86.68 | 60.59 | UKR | 49.43 | 92.96 | 0.00 | 86.17 | 30.29 |
| KWT | 72.41 | 74.79 | 89.71 | 74.01 | 72.32 | VNM | 55.17 | 79.58 | 97.12 | 84.74 | 79.77 |
| LVA | 77.59 | 94.37 | 65.84 | 80.28 | 45.32 | YEM | 0.00 | 45.07 | 76.17 | 68.91 | 0.00 |
| LBN | 40.23 | 80.99 | 73.25 | 63.99 | 20.49 |
Notes: “D1” represents investment profile, “D2” represents time to start a business, “D3” represents time to electrify, “D4” represents time to execute the contract, and “D5” represents number of employees.
Table A5.
Risk scores for the BRI countries based on Grey-TOPSIS during 2014–2019.
| Country | 2014 | 2014 Rank | 2015 | 2015 Rank | Up/Down | 2016 | 2016 Rank | Up/Down | 2017 | 2017 Rank | Up/Down | 2018 | 2018 Rank | Up/Down | 2019 | 2019 Rank | Up/Down |
|---|---|---|---|---|---|---|---|---|---|---|---|---|---|---|---|---|---|
| ALB | 0.487 | C | 0.475 | C | ↓ | 0.487 | C | ↑ | 0.495 | C | ↑ | 0.406 | C | ↓ | 0.369 | C | ↓ |
| ARM | 0.419 | D | 0.414 | E | ↓ | 0.424 | E | ↑ | 0.428 | D | ↑ | 0.367 | E | ↓ | 0.382 | C | ↑ |
| AZE | 0.451 | D | 0.435 | D | ↓ | 0.434 | D | ↓ | 0.421 | E | ↓ | 0.360 | E | ↓ | 0.359 | D | ↓ |
| BHR | 0.494 | B | 0.491 | B | ↓ | 0.503 | C | ↑ | 0.493 | C | ↓ | 0.381 | D | ↓ | 0.367 | D | ↓ |
| BGD | 0.387 | E | 0.383 | E | ↓ | 0.392 | E | ↑ | 0.405 | E | ↑ | 0.371 | D | ↓ | 0.353 | D | ↓ |
| BLR | 0.418 | D | 0.430 | D | ↑ | 0.457 | C | ↑ | 0.451 | D | ↓ | 0.378 | D | ↓ | 0.356 | D | ↓ |
| BRN | 0.582 | A | 0.554 | A | ↓ | 0.580 | A | ↑ | 0.574 | A | ↓ | 0.443 | A | ↓ | 0.411 | A | ↓ |
| BGR | 0.468 | C | 0.481 | C | ↑ | 0.490 | C | ↑ | 0.479 | C | ↓ | 0.401 | C | ↓ | 0.369 | D | ↓ |
| HRV | 0.516 | B | 0.509 | B | ↓ | 0.529 | B | ↑ | 0.526 | B | ↓ | 0.411 | B | ↓ | 0.383 | C | ↓ |
| CYP | 0.531 | B | 0.598 | A | ↑ | 0.581 | A | ↓ | 0.590 | A | ↑ | 0.445 | A | ↓ | 0.492 | A | ↑ |
| CZE | 0.564 | A | 0.556 | A | ↓ | 0.582 | A | ↑ | 0.577 | A | ↓ | 0.448 | A | ↓ | 0.412 | A | ↓ |
| EGY | 0.396 | E | 0.399 | E | ↑ | 0.412 | E | ↑ | 0.415 | E | ↑ | 0.391 | D | ↓ | 0.365 | D | ↓ |
| EST | 0.531 | B | 0.517 | B | ↓ | 0.548 | B | ↑ | 0.555 | A | ↑ | 0.421 | B | ↓ | 0.389 | B | ↓ |
| GRC | 0.501 | B | 0.520 | B | ↑ | 0.536 | B | ↑ | 0.523 | B | ↓ | 0.430 | A | ↓ | 0.400 | B | ↓ |
| HUN | 0.546 | A | 0.520 | B | ↓ | 0.553 | A | ↑ | 0.548 | B | ↓ | 0.453 | A | ↓ | 0.424 | A | ↓ |
| IND | 0.453 | C | 0.452 | C | ↓ | 0.468 | C | ↑ | 0.458 | C | ↓ | 0.462 | A | ↑ | 0.416 | A | ↓ |
| IDN | 0.424 | D | 0.414 | E | ↓ | 0.432 | E | ↑ | 0.458 | C | ↑ | 0.414 | B | ↓ | 0.388 | C | ↓ |
| IRN | 0.412 | E | 0.423 | D | ↑ | 0.449 | D | ↑ | 0.444 | D | ↓ | 0.372 | D | ↓ | 0.353 | D | ↓ |
| IRQ | 0.370 | E | 0.379 | E | ↑ | 0.400 | E | ↑ | 0.363 | E | ↓ | 0.332 | E | ↓ | 0.327 | E | ↓ |
| ISR | 0.544 | A | 0.545 | A | ↑ | 0.563 | A | ↑ | 0.550 | A | ↓ | 0.422 | B | ↓ | 0.388 | B | ↓ |
| JOR | 0.442 | D | 0.429 | D | ↓ | 0.439 | D | ↑ | 0.437 | D | ↓ | 0.372 | D | ↓ | 0.348 | E | ↓ |
| KAZ | 0.495 | B | 0.480 | C | ↓ | 0.489 | C | ↑ | 0.498 | B | ↑ | 0.406 | C | ↓ | 0.385 | C | ↓ |
| KWT | 0.531 | B | 0.517 | B | ↓ | 0.523 | B | ↑ | 0.495 | B | ↓ | 0.382 | D | ↓ | 0.375 | C | ↓ |
| LVA | 0.526 | B | 0.523 | B | ↓ | 0.543 | B | ↑ | 0.535 | B | ↓ | 0.408 | C | ↓ | 0.393 | B | ↓ |
| LBN | 0.425 | D | 0.433 | D | ↑ | 0.435 | D | ↑ | 0.423 | E | ↓ | 0.347 | E | ↓ | 0.334 | E | ↓ |
| LTU | 0.539 | A | 0.527 | A | ↓ | 0.546 | B | ↑ | 0.536 | B | ↓ | 0.415 | B | ↓ | 0.391 | B | ↓ |
| MYS | 0.526 | B | 0.519 | B | ↓ | 0.526 | B | ↑ | 0.519 | B | ↓ | 0.435 | A | ↓ | 0.402 | A | ↓ |
| MDA | 0.429 | D | 0.423 | D | ↓ | 0.434 | D | ↑ | 0.435 | D | ↑ | 0.364 | E | ↓ | 0.343 | E | ↓ |
| MNG | 0.492 | C | 0.490 | B | ↓ | 0.503 | B | ↑ | 0.516 | B | ↑ | 0.418 | B | ↓ | 0.399 | B | ↓ |
| MMR | 0.404 | E | 0.401 | E | ↓ | 0.411 | E | ↑ | 0.404 | E | ↓ | 0.351 | E | ↓ | 0.330 | E | ↓ |
| OMN | 0.527 | B | 0.506 | B | ↓ | 0.540 | B | ↑ | 0.530 | B | ↓ | 0.424 | B | ↓ | 0.399 | B | ↓ |
| PAK | 0.388 | E | 0.383 | E | ↓ | 0.396 | E | ↑ | 0.394 | E | ↓ | 0.354 | E | ↓ | 0.320 | E | ↓ |
| PHL | 0.464 | C | 0.457 | C | ↓ | 0.483 | C | ↑ | 0.476 | C | ↓ | 0.400 | C | ↓ | 0.381 | C | ↓ |
| POL | 0.537 | A | 0.541 | A | ↑ | 0.562 | A | ↑ | 0.550 | A | ↓ | 0.443 | A | ↓ | 0.412 | A | ↓ |
| QAT | 0.622 | A | 0.598 | A | ↓ | 0.622 | A | ↑ | 0.609 | A | ↓ | 0.428 | B | ↓ | 0.410 | A | ↓ |
| ROU | 0.467 | C | 0.467 | C | ↓ | 0.481 | C | ↑ | 0.475 | C | ↓ | 0.391 | C | ↓ | 0.358 | D | ↓ |
| RUS | 0.437 | D | 0.427 | D | ↓ | 0.449 | D | ↑ | 0.444 | D | ↓ | 0.411 | C | ↓ | 0.386 | C | ↓ |
| SAU | 0.492 | C | 0.484 | C | ↓ | 0.505 | B | ↑ | 0.486 | C | ↓ | 0.405 | C | ↓ | 0.388 | C | ↓ |
| SRB | 0.460 | C | 0.461 | C | ↑ | 0.475 | C | ↑ | 0.474 | C | ↓ | 0.391 | D | ↓ | 0.370 | C | ↓ |
| SGP | 0.653 | A | 0.636 | A | ↓ | 0.644 | A | ↑ | 0.654 | A | ↑ | 0.485 | A | ↓ | 0.471 | A | ↓ |
| SVK | 0.543 | A | 0.532 | A | ↓ | 0.552 | A | ↑ | 0.553 | A | ↑ | 0.424 | B | ↓ | 0.393 | B | ↓ |
| SVN | 0.534 | A | 0.532 | A | ↓ | 0.556 | A | ↑ | 0.551 | A | ↓ | 0.424 | B | ↓ | 0.389 | B | ↓ |
| LKA | 0.417 | E | 0.428 | D | ↑ | 0.445 | D | ↑ | 0.431 | D | ↓ | 0.375 | D | ↓ | 0.346 | E | ↓ |
| SYR | 0.379 | E | 0.389 | E | ↑ | 0.389 | E | ↓ | 0.400 | E | ↑ | 0.363 | E | ↓ | 0.349 | E | ↓ |
| THA | 0.428 | D | 0.434 | D | ↑ | 0.451 | D | ↑ | 0.453 | D | ↑ | 0.391 | C | ↓ | 0.368 | D | ↓ |
| TUP | 0.436 | D | 0.432 | D | ↓ | 0.442 | D | ↑ | 0.440 | D | ↓ | 0.390 | D | ↓ | 0.353 | D | ↓ |
| UKR | 0.406 | E | 0.420 | E | ↑ | 0.427 | E | ↑ | 0.415 | E | ↓ | 0.356 | E | ↓ | 0.351 | E | ↓ |
| VNM | 0.462 | C | 0.473 | C | ↑ | 0.486 | C | ↑ | 0.485 | C | ↓ | 0.407 | C | ↓ | 0.389 | B | ↓ |
| YEM | 0.369 | E | 0.339 | E | ↓ | 0.342 | E | ↑ | 0.332 | E | ↓ | 0.310 | E | ↓ | 0.317 | E | ↑ |
Notes: (1) “A” represents lowest risk, “B” represents low risk, “C” represents medium risk, “D” represents high risk, and “E” represents highest risk. (2) “↑” represents risk scores higher than the year before, and “↓” represents risk scores lower than the year before. (3) The higher the score, the lower the risk.
Table A6.
List of abbreviations.
| Abbreviations | |||
|---|---|---|---|
| BRI | The Belt and Road Initiative | GLS | Generalized least square |
| NAFTA | North American Free Trade Area | DID | Difference in differences |
| EU | European Union | TOPSIS | Technique for Order Preference by Similarity to Ideal Solution |
| Grey-TOPSIS | Grey correlation analysis based on the Technique for Order Preference by Similarity to Ideal Solution | ANP | Analytic Network Process |
| GIS | Geographic Information System | ISM | Interpretive Structural Modeling |
| ICRG | International Country Risk Guide | MCDM | Multi-Criteria Decision Making |
| EIU | Economist Intelligence Unit | GDP | Gross domestic product |
| WDI | World Bank’s World Development Indicators | CPEC | China-Pakistan Economic Corridor |
| BTI | Betasman Transformation Index | OFDI | Outward Foreign Direct Investment |
| RUCIEIPRI | Renmin University of China Energy Investment Political Risk Index | CIS | Commonwealth of Independent States |
| BRIDI | The Belt and Road Infrastructure Development Index Report | ASEAN | Association of Southeast Asian Nations |
| OLS | Ordinary least square | CEE | Central and Eastern Europe |
References
- Zhang, C.; Fu, J.; Pu, Z. A study of the petroleum trade network of countries along “The Belt and Road Initiative”. J. Clean. Prod. 2019. [Google Scholar] [CrossRef]
- The State Council Information Office of the People’s Republic of China. 2020; The State Council Held a Press Conference on Business Work and Operation in 2019. Available online: http://www.scio.gov.cn/index.htm (accessed on 8 June 2020).
- Zhao, Y.; Liu, X.; Wang, S.; Ge, Y. Energy relations between China and the countries along the Belt and Road: An analysis of the distribution of energy resources and interdependence relationships. Renew. Sustain. Energ. Rev. 2019. [Google Scholar] [CrossRef]
- Hu, J.; Wang, D.; Study on the Country Risks of “One Belt One Road” Countries along the Route. Economic Issue. 2016. (In Chinese). Available online: https://kns.cnki.net/KCMS/detail/detail.aspx?dbcode=CJFQ&dbname=CJFDLAST2016&filename=JJWT201605002&uid (accessed on 8 June 2020).
- Chen, W.; Dollar, D.; Tang, H. Why is China investing in Africa? Evidence from the firm level. World Bank Econ. Rev. 2018, 32, 610–632. [Google Scholar] [CrossRef] [Green Version]
- Soyres, F.; De Mulabdic, A.; Murray, S.; Rocha, N.; Ruta, M. How much will the Belt and Road Initiative reduce trade costs? Int. Econ. 2019, 159, 151–164. [Google Scholar] [CrossRef] [Green Version]
- Li, C.; Liu, B. Air pollution embodied in China’ s trade with the BR countries: Transfer pattern and environmental implication. J. Clean. Prod. 2020, 247, 119126. [Google Scholar] [CrossRef]
- Yu, S.; Qian, X.; Liu, T. Belt and road initiative and Chinese firms’ outward foreign direct investment. Emerg. Mark. Rev. 2019, 41, 100629. [Google Scholar] [CrossRef]
- Hussain, J.; Zhou, K.; Guo, S.; Khan, A. Investment risk and natural resource potential in “Belt & Road Initiative” countries: A multi-criteria decision-making approach. Sci. Total Environ. 2020, 723, 137981. [Google Scholar] [CrossRef]
- Deghetto, K.; Lamont, B.T.; Holmes, R.M., Jr. Safety risk and international investment decisions. J. World Bus. 2020, 55, 101129. [Google Scholar] [CrossRef]
- Zhang, X.; Wang, X.; Shen, P. The Research of China’s Banking Regulation in the Concept of Finacial Inclusion. Econ. Issue. 2016, 1–7. (In Chinese). Available online: https://kns.cnki.net/kcms/detail/detail.aspx?filename=JJWT201605008&dbcode=CJFD (accessed on 8 June 2020).
- CCIEE. One Belt and One Road Trade and Investment Index (BRTII). 2018. Available online: http://www.ccpit.org/Contents/Channel_3588/2019/0509/1163169/content_1163169.htm (accessed on 8 June 2020).
- Feng, L.; Li, C.; Li, Q. Research on Risk Assessment of China’s Foreign Infrastructure Construction Investment—Taking 10 Countries along the “One Belt and One Road” as Examples. Transnatl. Bus 2018. (In Chinese). Available online: https://kns.cnki.net/KCMS/detail/detail.aspx?dbcode=CJFQ&dbname=CJFDLAST2018&filename=GJJH201803013&uid (accessed on 8 June 2020).
- Huang, Y. Environmental risks and opportunities for countries along the Belt and Road: Location choice of China’s investment. J. Clean. Prod. 2019, 211, 14–26. [Google Scholar] [CrossRef]
- Sun, Y.; Chen, L.; Sun, H.; Taghizadeh-hesary, F. Low-carbon financial risk factor correlation in the belt and road PPP project. Financ. Res. Lett. 2020, 35, 101491. [Google Scholar] [CrossRef]
- Liu, X.; Blackburn, M.T.; Song, T.J.; Li, X.P.; Huang, C.; Li, Y.M. Risks of biological invasion on the belt and road. Curr. Biol. 2019, 29, 499–505. [Google Scholar] [CrossRef] [PubMed] [Green Version]
- Qi, S.; Peng, H.; Zhang, Y. Energy intensity convergence in Belt and Road Initiative (BRI) countries: What role does China-BRI trade play? J. Clean. Prod. 2019, 239, 118022. [Google Scholar] [CrossRef]
- Chen, S.; Lu, X.; Miao, Y.; Logan, K.G.; Michael, B.; Chen, S.; Lu, X.; Miao, Y.; Deng, Y.; Nielsen, C.P.; et al. The potential of photovoltaics to power the belt and road initiative the potential of photovoltaics to power the belt and road initiative. Joule 2019, 8, 1895–1912. [Google Scholar] [CrossRef]
- Duan, F.; Ji, Q.; Liu, B.Y.; Fan, Y. Energy investment risk assessment for nations along China’s Belt & Road Initiative. J. Clean. Prod. 2018, 170, 535–547. [Google Scholar] [CrossRef]
- Du, J.; Zhang, Y. China economic review does one belt one road initiative promote Chinese overseas direct investment? China Econ. Rev. 2018, 47, 189–205. [Google Scholar] [CrossRef]
- Li, J.; Liu, B.; Qian, G.; Kong, H.; Bay, C.W.; Kong, H. The belt and road initiative, cultural friction and ethnicity: Their effects on the export performance of SMEs in China. J. World Bus. 2019, 54, 350–359. [Google Scholar] [CrossRef]
- Hashemizadeh, A.; Ju, Y.; Mojtaba, S.; Bamakan, H.; Le, H.P. Renewable energy investment risk assessment in belt and road initiative countries under uncertainty conditions. Energy 2020, 214, 118923. [Google Scholar] [CrossRef]
- Dang, L.; Zhao, J. Cultural risk and management strategy for Chinese enterprises’ overseas investment. China Econ. Rev. 2020, 61, 101433. [Google Scholar] [CrossRef]
- Yuan, J.; Li, X.; Xu, C.; Zhao, C.; Liu, Y. Investment risk assessment of coal- fi red power plants in countries along the Belt and Road initiative based on ANP-Entropy-TODIM method. Energy 2019, 176, 623–640. [Google Scholar] [CrossRef]
Figure 1.
Four aspects of risk ratings for the BRI countries based on Grey-TOPSIS in 2019.

Figure 2.
Risk ratings for the BRI countries based on Grey-TOPSIS during 2014–2019.

Table 1.
Overview of papers published by risk of the BRI.
| Paper | Area | Aspects | Period | Method | Dimensions | Variable |
|---|---|---|---|---|---|---|
| [8] | BRI | OFDI | 2000–2015 | OLS | / | GDP, trade, energy, bureaucratic quality, law and order, corruption, investment profile, capacity utilization, etc. |
| [20] | BRI | OFDI | 2005–2015 | DID | / | Different sectors. |
| [21] | BRI | Export | 2013–2016 | GLS | / | Export performance, the BRI, cultural friction, ethnicity, firm age, size, past performance (before BRI), etc. |
| [9] | BRI | OFDI | / | TOPSIS | Environmental, resource, economic, and political | CO2 emissions, natural resources depletion, air pollution, GDP, control of corruption, government effectiveness, etc. |
| [14] | BRI | Environment | / | TOPSIS | Environment risk and opportunity | Environmental quality, climate change, ecological vulnerability, resources productive, resources endowment. |
| [15] | BRI | Low-carbon financial risk | 2010–2019 | ISM | / | Technology, public opposition, operational, completion, default, financial investment, supply chain, low-carbon, etc. |
| [22] | BRI | Investment in renewable energy | / | MCDM | Tradability, economic, technical, environment, and social | Domestic potential market, international potential market, investment cost, maturity, efficiency, capacity factor, land use, job creation, etc. |
| [23] | BRI | Cultural | / | / | Cultural differences, conflicts, conflicts, and risk, and evolution | Language, religious beliefs, legal origin. |
| [24] | BRI | Investment in coal-fired power plants | 2018 | ANP-Entropy-TODIM | / | Economic foundation, external finance, social, political, Chinese factors, electricity, coal power revenue, etc. |
Table 2.
Countries (economies) risk-evaluation system along the BRI.
| Aspects | Secondary Indicators | Meaning | Source | Sign |
|---|---|---|---|---|
| Political Risk | Government stability | Government instability and frequent violent overthrows may lead to frequent changes of leaders, which is not conducive to the continuity of foreign economic policies. | ICRG | + |
| Internal conflict | The country’s political violence and its actual or potential impact on governance. | ICRG | + | |
| External conflict | Foreign actions, including diplomatic pressure, aid suspensions, trade restrictions, and territorial disputes, pose risk to the current government. | ICRG | − | |
| Control of corruption | Corruption within the political system is a threat to foreign investment. It measures the level of control over corruption and abuse of public power in the host government. | ICRG | − | |
| Law and order | To measure the perfection of a country’s legal system and the level of enforcement, restriction, and supervision in accordance with the law. | ICRG | + | |
| Economic Risk | GDP per capita | GDP, constant 2010 prices in dollars. | WDI | + |
| Economic growth | GDP growth rate. | WDI | + | |
| Investment openness | OFDI inflow refers to the net inflow of investment into enterprises operating in an economy other than that of the investor economy to obtain a lasting managed interest. | WDI | + | |
| Inflation rate | The uncertainty that rising prices bring to the economy. | WDI | − | |
| Socioeconomic conditions | The socioeconomic pressures at work in society that could constrain government action or foster social dissatisfaction. | ICRG | + | |
| Social Risk | Military in politics | Its involvement in politics, even at a peripheral level, is a diminution of democratic accountability. | ICRG | + |
| Religious tensions | It may stem from the status in society of religious groups that seek to replace civil law with religious law and exclude other religions from politics or society. | ICRG | + | |
| Ethnic tensions | The degree of tension within a country attributable to racial, nationality, or language divisions. | ICRG | + | |
| Democratic accountability | A measure of how responsive the government is to its people on the basis that the less responsive it is, the more likely it is that the government will fall. | ICRG | + | |
| Bureaucracy | Bureaucracies are a shock absorber of social risk, minimizing policy changes when governments change. | ICRG | + | |
| Investment Risk | Investment profile | Factors affecting the risk to investments that are not covered by other political, economic, and financial risk components. | ICRG | + |
| Time taken to start a business | The convenience of starting, operating, and closing enterprises in countries along the BRI are comprehensively measured. | WDI | − | |
| Time taken to electrify | The number of days required for a business or project to be permanently connected to electricity. | WDI | − | |
| Time taken to execute the contract | An effective legal system for resolving commercial disputes is crucial to projects, otherwise, a company may encounter the case of non-compliance with contracts. | WDI | − | |
| Number of employees | The number of economic activists over 15 measures the host country’s labor force supply. | WDI | + |
Notes: (1) “+” represents a positive indicator, and a higher value is considered to be less risky. “−” represents a negative indicator, and a smaller value is considered less risky. (2) Data sources, ICRG refers to ICRG’s PRS group country risk international guide, and WDI refers to the World Bank’s World Development Indicators.
Table 3.
Countries (economies) along the BRI based on location.
| Area | Country |
|---|---|
| Mongolia (1) | Mongolia (MNG) |
| Association of Southeast Asian Nations (ASEAN) (8) | Malaysia (MYS), Singapore (SGP), Indonesia (IDN), Viet Nam (VNM), Thailand (THA), Myanmar (MMR), Brunei Darussalam (BRN), and the Philippines (PHL) |
| West Asia (16) | Cyprus (CYP), Iran (IRN), Iraq (IRQ), Turkey (TUR), Syria (SYR), Jordan (JOR), Lebanon (LBN), Saudi Arabia (SAU), Israel (ISR), Egypt (EGY), Yemen (YEM), Oman (OMN), Qatar (QAT), Kuwait (KWT), Bahrain (BHR), and Greece (GRC) |
| South Asia (4) | Pakistan (PAK), India (IND), Sri Lanka (LKA), and Bangladesh (BGD) |
| Central Asia (1) | Kazakhstan (KAZ) |
| Commonwealth of Independence States (CIS) (6) | Russia (RUS), Belarus (BLR), Armenia (ARM), Ukraine (UKR), Azerbaijan (AZE), and Moldova (MDA) |
| CEE (13) | Lithuania (LTU), Poland (POL), Czechia (CZE), Latvia (LVA), Estonia (EST), Hungary (HUN), Croatia (HRV), Slovakia (SVK), Bulgaria (BGR), Romania (ROM), Albania (ALB), Slovenia (SVN), and Serbia (SRB) |
Table 4.
Weight of each risk index based on the Grey-TOPSIS method in 2014–2019.
| Dimensions | 2014 | 2015 | 2016 | 2017 | 2018 | 2019 | Secondary Indicators | 2014 | 2015 | 2016 | 2017 | 2018 | 2019 |
|---|---|---|---|---|---|---|---|---|---|---|---|---|---|
| Political Risk | 0.233 | 0.201 | 0.231 | 0.271 | 0.206 | 0.172 | Government stability | 0.324 | 0.155 | 0.202 | 0.310 | 0.380 | 0.432 |
| Internal conflict | 0.246 | 0.247 | 0.259 | 0.222 | 0.163 | 0.156 | |||||||
| External conflict | 0.158 | 0.222 | 0.205 | 0.240 | 0.245 | 0.202 | |||||||
| Control of corruption | 0.112 | 0.190 | 0.170 | 0.097 | 0.082 | 0.081 | |||||||
| Law and order | 0.160 | 0.186 | 0.165 | 0.130 | 0.130 | 0.129 | |||||||
| Economic Risk | 0.314 | 0.341 | 0.278 | 0.291 | 0.485 | 0.568 | GDP per capita | 0.616 | 0.569 | 0.686 | 0.597 | 0.864 | 0.621 |
| Economic growth | 0.063 | 0.039 | 0.052 | 0.071 | 0.043 | 0.018 | |||||||
| Investment openness | 0.159 | 0.256 | 0.061 | 0.143 | 0.015 | 0.290 | |||||||
| Inflation rate | 0.071 | 0.057 | 0.105 | 0.095 | 0.016 | 0.031 | |||||||
| Socioeconomic conditions | 0.091 | 0.079 | 0.096 | 0.094 | 0.062 | 0.040 | |||||||
| Social Risk | 0.297 | 0.300 | 0.304 | 0.283 | 0.206 | 0.171 | Military in politics | 0.110 | 0.111 | 0.113 | 0.117 | 0.118 | 0.142 |
| Religious tensions | 0.164 | 0.170 | 0.176 | 0.169 | 0.168 | 0.165 | |||||||
| Ethnic tensions | 0.139 | 0.136 | 0.135 | 0.137 | 0.138 | 0.144 | |||||||
| Democratic accountability | 0.203 | 0.206 | 0.201 | 0.199 | 0.199 | 0.194 | |||||||
| Bureaucracy | 0.383 | 0.378 | 0.375 | 0.379 | 0.378 | 0.356 | |||||||
| Investment Risk | 0.156 | 0.158 | 0.186 | 0.154 | 0.103 | 0.089 | Investment profile | 0.234 | 0.227 | 0.225 | 0.171 | 0.155 | 0.153 |
| Time to start a business | 0.102 | 0.101 | 0.099 | 0.090 | 0.097 | 0.087 | |||||||
| Time to electrify | 0.091 | 0.105 | 0.175 | 0.179 | 0.175 | 0.197 | |||||||
| Time to execute the contract | 0.216 | 0.210 | 0.184 | 0.210 | 0.194 | 0.182 | |||||||
| Number of employees | 0.358 | 0.356 | 0.317 | 0.350 | 0.379 | 0.381 |
Publisher’s Note: MDPI stays neutral with regard to jurisdictional claims in published maps and institutional affiliations. |
© 2021 by the authors. Licensee MDPI, Basel, Switzerland. This article is an open access article distributed under the terms and conditions of the Creative Commons Attribution (CC BY) license (http://creativecommons.org/licenses/by/4.0/).
Share and Cite
MDPI and ACS Style
Li, J.; Dong, X.; Jiang, Q.; Dong, K. Analytical Approach to Quantitative Country Risk Assessment for the Belt and Road Initiative. Sustainability 2021, 13, 423. https://0-doi-org.brum.beds.ac.uk/10.3390/su13010423
AMA Style
Li J, Dong X, Jiang Q, Dong K. Analytical Approach to Quantitative Country Risk Assessment for the Belt and Road Initiative. Sustainability. 2021; 13(1):423. https://0-doi-org.brum.beds.ac.uk/10.3390/su13010423
Chicago/Turabian StyleLi, Jiaman, Xiucheng Dong, Qingzhe Jiang, and Kangyin Dong. 2021. "Analytical Approach to Quantitative Country Risk Assessment for the Belt and Road Initiative" Sustainability 13, no. 1: 423. https://0-doi-org.brum.beds.ac.uk/10.3390/su13010423
Note that from the first issue of 2016, this journal uses article numbers instead of page numbers. See further details here.