Choreographic Group-Based Fitness Classes Improve Cardiometabolic Health-Related Anthropometric Indices and Blood Lipids Profile in Overweight Sedentary Women


Abstract
:1. Introduction
2. Materials and Methods
2.1. Study Design, Participants, and Procedures
2.2. Cardiometabolic Health-Related Anthropometric Indices
2.3. Blood Parameters
2.3.1. Arterial Blood Pressure
2.3.2. Blood Analysis
2.4. Intervention
2.5. Statistical Analysis
3. Results
4. Discussion
5. Conclusions
Author Contributions
Funding
Informed Consent Statement
Acknowledgments
Conflicts of Interest
References
- Collaboration, G.B.M.I.M.; Di Angelantonio, E.; Bhupathiraju, S.; Wormser, D.; Gao, P.; Kaptoge, S.; Berrington de Gonzalez, A.; Cairns, B.; Huxley, R.; Jackson, C.; et al. Body-mass index and all-cause mortality: Individual-participant-data meta-analysis of 239 prospective studies in four continents. Lancet 2016, 388, 776–786. [Google Scholar] [CrossRef] [Green Version]
- Garrow, J.S. Obesity and Related Diseases; Churchill Livingstone: London, UK, 1988; ISBN 0443037981. [Google Scholar]
- Ezzati, M.; Lopez, A.D.; Rodgers, A.A.; Murray, C.J.L. Comparative Quantification of Health Risks: Global and Regional Burden of Disease Attributable to Selected Major Risk Factors; World Health Organization: Geneva, Switzerland, 2004; ISBN 9241580313. [Google Scholar]
- Ford, N.D.; Patel, S.A.; Narayan, K.M.V. Obesity in low-and middle-income countries: Burden, drivers, and emerging challenges. Annu. Rev. Public Health 2017, 38, 145–164. [Google Scholar] [CrossRef] [Green Version]
- Fonseca, D.C.; Sala, P.; de Azevedo Muner Ferreira, B.; Reis, J.; Torrinhas, R.S.; Bendavid, I.; Waitzberg, D.L. Body weight control and energy expenditure. Clin. Nutr. Exp. 2018, 20, 55–59. [Google Scholar] [CrossRef] [Green Version]
- Romieu, I.; Dossus, L.; Barquera, S.; Blottière, H.M.; Franks, P.W.; Gunter, M.; Hwalla, N.; Hursting, S.D.; Leitzmann, M.; Margetts, B. Energy balance and obesity: What are the main drivers? Cancer Causes Control 2017, 28, 247–258. [Google Scholar] [CrossRef] [Green Version]
- WHO World Health Organization. Obesity and Overweight Fact Sheet. Available online: https://www.who.int/news-room/fact-sheets/detail/obesity-and-overweight (accessed on 3 November 2020).
- Guthold, R.; Stevens, G.A.; Riley, L.M.; Bull, F.C. Worldwide trends in insufficient physical activity from 2001 to 2016: A pooled analysis of 358 population-based surveys with 1· 9 million participants. Lancet Glob. Health 2018, 6, e1077–e1086. [Google Scholar] [CrossRef] [Green Version]
- United Nations. United Nations Sustainable Development Goals 2030. Available online: https://sdgs.un.org/es/goals (accessed on 5 November 2020).
- Eys, M.A.; Evans, M.B. Group dynamics in sport, exercise, and physical activity contexts. In Advances in Sport and Exercise Psychology, 4th ed.; Human Kinetics: Champaign, IL, USA, 2018; pp. 171–188. [Google Scholar]
- Schvey, N.A.; Sbrocco, T.; Bakalar, J.L.; Ress, R.; Barmine, M.; Gorlick, J.; Pine, A.; Stephens, M.; Tanofsky-Kraff, M. The experience of weight stigma among gym members with overweight and obesity. Stigma Health 2017, 2, 292. [Google Scholar] [CrossRef]
- Wiklund, M.; Olsén, M.F.; Willén, C. Physical activity as viewed by adults with severe obesity, awaiting gastric bypass surgery. Physiother. Res. Int. 2011, 16, 179–186. [Google Scholar] [CrossRef]
- Graupensperger, S.; Gottschall, J.S.; Benson, A.J.; Eys, M.; Hastings, B.; Evans, M.B. Perceptions of groupness during fitness classes positively predict recalled perceptions of exertion, enjoyment, and affective valence: An intensive longitudinal investigation. Sport. Exerc. Perform. Psychol. 2019, 8, 390. [Google Scholar] [CrossRef] [PubMed]
- Pitpitan, E.V. Group Identification and Permeation in Weight Stigma and Prejudice; University of Connecticut: Mansfield, CT, USA, 2011; ISBN 1267102381. [Google Scholar]
- Maher, J.P.; Gottschall, J.S.; Conroy, D.E. Perceptions of the activity, the social climate, and the self during group exercise classes regulate intrinsic satisfaction. Front. Psychol. 2015, 6, 1236. [Google Scholar] [CrossRef] [PubMed] [Green Version]
- Thompson, W.R. Worldwide survey of fitness trends for 2020. ACSMs Health Fit. J. 2019, 23, 10–18. [Google Scholar] [CrossRef]
- Fan, J.X.; Kowaleski-Jones, L.; Wen, M. Walking or dancing: Patterns of physical activity by cross-sectional age among US women. J. Aging Health 2013, 25, 1182–1203. [Google Scholar] [CrossRef] [PubMed] [Green Version]
- IHRSA IHRSA Health Club Consumer Report. 2019. Available online: https://www.ihrsa.org/about/media-center/press-releases/report-health-club-gym-studio-usage-reach-all-time-high/ (accessed on 1 September 2020).
- Vendramin, B.; Bergamin, M.; Gobbo, S.; Cugusi, L.; Duregon, F.; Bullo, V.; Zaccaria, M.; Neunhaeuserer, D.; Ermolao, A. Health benefits of Zumba fitness training: A systematic review. PM&R 2016, 8, 1181–1200. [Google Scholar]
- Thompson, W.R. Worldwide survey of fitness trends for 2012. ACSMs Health Fit. J. 2011, 15, 9–18. [Google Scholar] [CrossRef]
- Knowles, K.M.; Paiva, L.L.; Sanchez, S.E.; Revilla, L.; Lopez, T.; Yasuda, M.B.; Yanez, N.D.; Gelaye, B.; Williams, M.A. Waist circumference, body mass index, and other measures of adiposity in predicting cardiovascular disease risk factors among Peruvian adults. Int. J. Hypertens. 2011, 2011, 931402. [Google Scholar] [CrossRef] [PubMed] [Green Version]
- Ramírez-Vélez, R.; Pérez-Sousa, M.Á.; Izquierdo, M.; Cano-Gutierrez, C.A.; González-Jiménez, E.; Schmidt-RioValle, J.; González-Ruíz, K.; Correa-Rodríguez, M. Validation of Surrogate Anthropometric Indices in Older Adults: What is the Best Indicator of High Cardiometabolic Risk Factor Clustering? Nutrients 2019, 11, 1701. [Google Scholar] [CrossRef] [Green Version]
- Ramírez-Vélez, R.; Correa-Bautista, J.E.; González-Ruíz, K.; Tordecilla-Sanders, A.; García-Hermoso, A.; Schmidt-RioValle, J.; González-Jiménez, E. The role of body adiposity index in determining body fat percentage in Colombian adults with overweight or obesity. Int. J. Environ. Res. Public Health 2017, 14, 1093. [Google Scholar] [CrossRef] [PubMed] [Green Version]
- Browning, L.M.; Hsieh, S.D.; Ashwell, M. A systematic review of waist-to-height ratio as a screening tool for the prediction of cardiovascular disease and diabetes: 0· 5 could be a suitable global boundary value. Nutr. Res. Rev. 2010, 23, 247–269. [Google Scholar] [CrossRef] [PubMed] [Green Version]
- Ashwell, M.; Gunn, P.; Gibson, S. Waist-to-height ratio is a better screening tool than waist circumference and BMI for adult cardiometabolic risk factors: Systematic review and meta-analysis. Obes. Rev. 2012, 13, 275–286. [Google Scholar] [CrossRef]
- Christakoudi, S.; Tsilidis, K.K.; Muller, D.C.; Freisling, H.; Weiderpass, E.; Overvad, K.; Söderberg, S.; Häggström, C.; Pischon, T.; Dahm, C.C. A Body Shape Index (ABSI) achieves better mortality risk stratification than alternative indices of abdominal obesity: Results from a large European cohort. Sci. Rep. 2020, 10, 1–15. [Google Scholar] [CrossRef]
- Valdez, R.; Seidell, J.C.; Ahn, Y.I.; Weiss, K.M. A new index of abdominal adiposity as an indicator of risk for cardiovascular disease. A cross-population study. Int. J. Obes. Relat. Metab. Disord. J. Int. Assoc. Study Obes. 1993, 17, 77–82. [Google Scholar]
- Mantzoros, C.S.; Evagelopoulou, K.; Georgiadis, E.I.; Katsilambros, N. Conicity index as a predictor of blood pressure levels, insulin and triglyceride concentrations of healthy premenopausal women. Horm. Metab. Res. 1996, 28, 32–34. [Google Scholar] [CrossRef] [PubMed]
- Quaye, L.; Owiredu, W.K.B.A.; Amidu, N.; Dapare, P.P.M.; Adams, Y. Comparative Abilities of Body Mass Index, Waist Circumference, Abdominal Volume Index, Body Adiposity Index, and Conicity Index as Predictive Screening Tools for Metabolic Syndrome among Apparently Healthy Ghanaian Adults. J. Obes. 2019, 2019, 8143179. [Google Scholar] [CrossRef] [PubMed]
- Motamed, N.; Perumal, D.; Zamani, F.; Ashrafi, H.; Haghjoo, M.; Saeedian, F.S.; Maadi, M.; Akhavan-Niaki, H.; Rabiee, B.; Asouri, M. Conicity index and waist-to-hip ratio are superior obesity indices in predicting 10-year cardiovascular risk among men and women. Clin. Cardiol. 2015, 38, 527–534. [Google Scholar] [CrossRef] [PubMed]
- Costa, E.C.; Ferezini de Sá, J.C.; Mafaldo Soares, E.M.; Araújo Moura Lemos, T.M.; de Oliveira Maranhão, T.M.; Dantas Azevedo, G. Anthropometric indices of central obesity how discriminators of metabolic syndrome in Brazilian women with polycystic ovary syndrome. Gynecol. Endocrinol. 2012, 28, 12–15. [Google Scholar] [CrossRef]
- Bergman, R.N.; Stefanovski, D.; Buchanan, T.A.; Sumner, A.E.; Reynolds, J.C.; Sebring, N.G.; Xiang, A.H.; Watanabe, R.M. A better index of body adiposity. Obesity 2011, 19, 1083–1089. [Google Scholar] [CrossRef]
- Salas-Salvado, J.; Rubio, M.A.; Barbany, M.; Moreno, B. SEEDO 2007 Consensus for the evaluation of overweight and obesity and the establishment of therapeutic intervention criteria. Med. Clin. 2007, 128, 184–196. [Google Scholar]
- Motamed, N.; Sohrabi, M.; Poustchi, H.; Maadi, M.; Malek, M.; Keyvani, H.; Amoli, M.S.; Zamani, F. The six obesity indices, which one is more compatible with metabolic syndrome? A population based study. Diabetes Metab. Syndr. Clin. Res. Rev. 2017, 11, 173–177. [Google Scholar] [CrossRef]
- Jeukendrup, A.; Gleeson, M. Normal Ranges of Body Weight and Body Fat; Sport Nutrition-2nd Edition; Human Kinetics 1: Champaign, IL, USA, 2010; ISBN 9780736087155. [Google Scholar]
- Liu, J.; Tse, L.A.; Liu, Z.; Rangarajan, S.; Hu, B.; Yin, L.; Leong, D.P.; Li, W. Predictive values of anthropometric measurements for cardiometabolic risk factors and cardiovascular diseases among 44 048 Chinese. J. Am. Heart Assoc. 2019, 8, e010870. [Google Scholar] [CrossRef]
- Czeczelewski, M.; Czeczelewski, J.; Czeczelewska, E.; Galczak-Kondraciuk, A. Association of body composition indexes with cardio-metabolic risk factors. Obes. Med. 2020, 17, 100171. [Google Scholar] [CrossRef]
- Notarnicola, A.; Maccagnano, G.; Pesce, V.; Tafuri, S.; Leo, N.; Moretti, B. Is the Zumba fitness responsible for low back pain? Musculoskelet. Surg. 2015, 99, 211–216. [Google Scholar] [CrossRef]
- Rossmeissl, A.; Lenk, S.; Hanssen, H.; Donath, L.; Schmidt-Trucksäss, A.; Schäfer, J. ZumBeat: Evaluation of a Zumba Dance Intervention in Postmenopausal Overweight Women. Sports 2016, 4, 5. [Google Scholar] [CrossRef] [PubMed] [Green Version]
- Donath, L.; Roth, R.; Hohn, Y.; Zahner, L.; Faude, O. The effects of Zumba training on cardiovascular and neuromuscular function in female college students. Eur. J. Sport Sci. 2014, 14, 569–577. [Google Scholar] [CrossRef] [PubMed]
- Guerendiain, M.; Villa-González, E.; Barranco-Ruiz, Y. Body composition and dairy intake in sedentary employees who participated in a healthy program based on nutrition education and Zumba. Clin. Nutr. 2019, 38, 2277–2286. [Google Scholar] [CrossRef]
- Barranco-Ruiz, Y.; Ramírez-Vélez, R.; Martínez-Amat, A.; Villa-González, E. Effect of Two Choreographed Fitness Group-Workouts on the Body Composition, Cardiovascular and Metabolic Health of Sedentary Female Workers. Int. J. Environ. Res. Public Health 2019, 16, 4986. [Google Scholar] [CrossRef] [PubMed] [Green Version]
- Chavarrias, M.; Carlos-Vivas, J.; Barrantes-Martín, B.; Pérez-Gómez, J. Effects of 8-week of fitness classes on blood pressure, body composition, and physical fitness. J. Sports Med. Phys. Fit. 2019, 59, 2066–2074. [Google Scholar] [CrossRef]
- Chavarrias, M.; Carlos-Vivas, J.; Pérez-Gómez, J. Health benefits of zumba: A systematic review. J. Sport Health Res. 2018, 10, 327–337. [Google Scholar]
- Krishnan, S.; Tokar, T.N.; Boylan, M.M.; Griffin, K.; Feng, D.; Mcmurry, L.; Esperat, C.; Cooper, J.A. Zumba® dance improves health in overweight/obese or type 2 diabetic women. Am. J. Health Behav. 2015, 39, 109–120. [Google Scholar] [CrossRef]
- Cugusi, L.; Wilson, B.; Serpe, R.; Medda, A.; Deidda, M.; Gabba, S.; Satta, G.; Chiappori, P.; Mercuro, G. Cardiovascular effects, body composition, quality of life and pain after a Zumba fitness program in Italian overweight women. J. Sports Med. Phys. Fit. 2016, 56, 328–335. [Google Scholar]
- Cugusi, L.; Manca, A.; Bergamin, M.; Di Blasio, A.; Yeo, T.J.; Crisafulli, A.; Mercuro, G. Zumba Fitness and Women’s Cardiovascular Health: A systematic review. J. Cardiopulm. Rehabil. Prev. 2019, 39, 153–160. [Google Scholar] [CrossRef]
- Ljubojević, A.; Jakovljević, V.; Popržen, M. Effects of Zumba fitness program on body composition of women. SportLogia 2014, 10, 29–33. [Google Scholar] [CrossRef]
- Araneta, M.R.; Tanori, D. Benefits of Zumba Fitness® among sedentary adults with components of the metabolic syndrome: A pilot study. J. Sports Med. Phys. Fit. 2015, 55, 1227–1233. [Google Scholar]
- Barene, S.; Krustrup, P.; Brekke, O.L.; Holtermann, A. Soccer and Zumba as health-promoting activities among female hospital employees: A 40-weeks cluster randomised intervention study. J. Sports Sci. 2014, 32, 1539–1549. [Google Scholar] [CrossRef] [PubMed]
- Barene, S.; Krustrup, P.; Jackman, S.R.; Brekke, O.L.; Holtermann, A. Do soccer and Z umba exercise improve fitness and indicators of health among female hospital employees? A 12-week RCT. Scand. J. Med. Sci. Sports 2014, 24, 990–999. [Google Scholar] [CrossRef] [PubMed]
- Micallef, C. Associations of weight loss in relation to age and body mass index in a group of Maltese overweight and obese women during an 8-week Zumba programme. Sport Sci. Health 2015, 11, 97–102. [Google Scholar] [CrossRef]
- Micallef, C. The effectiveness of an 8-week Zumba programme for weight reduction in a group of Maltese overweight and obese women. Sport Sci. Health 2014, 10, 211–217. [Google Scholar] [CrossRef]
- Güçlüöver, A. The effect of 8-week Zumba® fitness on body composition of turkish womens. Prog. Nutr. 2020, 22, 316–322. [Google Scholar] [CrossRef]
- Andersen, R.E.; Wadden, T.A.; Bartlett, S.J.; Zemel, B.; Verde, T.J.; Franckowiak, S.C. Effects of lifestyle activity vs structured aerobic exercise in obese women: A randomized trial. JAMA 1999, 281, 335–340. [Google Scholar] [CrossRef]
- Kim, H.-Y.; Kwak, Y.-S.; Sung, G.-D.; Son, W.-M.; Kim, D.-Y.; Baek, Y.-H. Effect of 12 weeks combined exercise and nutrition education on body composition, liver function, serum lipids and insulin resistance in obese middle-aged woman. J. Life Sci. 2017, 27, 817–825. [Google Scholar]
- Slade, S.C.; Dionne, C.E.; Underwood, M.; Buchbinder, R. Consensus on Exercise Reporting Template (CERT): Explanation and Elaboration Statement. Br. J. Sports Med. 2016, 50, 1428–1437. [Google Scholar] [CrossRef] [Green Version]
- Muth, N.D.; Vargo, K.; Bryant, C.X. The Role of the Fitness Professional in the Clinical Setting. Curr. Sports Med. Rep. 2015, 14, 301–312. [Google Scholar] [CrossRef]
- Kodama, S.; Tanaka, S.; Saito, K.; Shu, M.; Sone, Y.; Onitake, F.; Suzuki, E.; Shimano, H.; Yamamoto, S.; Kondo, K. Effect of aerobic exercise training on serum levels of high-density lipoprotein cholesterol: A meta-analysis. Arch. Intern. Med. 2007, 167, 999–1008. [Google Scholar] [CrossRef] [PubMed] [Green Version]
- Kolovou, G.D.; Bilianou, H.G. Influence of aging and menopause on lipids and lipoproteins in women. Angiology 2008, 59, 54S–57S. [Google Scholar] [CrossRef] [PubMed]
- Ambikairajah, A.; Walsh, E.; Cherbuin, N. Lipid profile differences during menopause: A review with meta-analysis. Menopause 2019, 26, 1327–1333. [Google Scholar] [CrossRef] [PubMed]
- Mumford, S.L.; Dasharathy, S.; Pollack, A.Z. Variations in lipid levels according to menstrual cycle phase: Clinical implications. Clin. Lipidol. 2011, 6, 225–234. [Google Scholar] [CrossRef] [Green Version]
- Ko, S.-H.; Kim, H.-S. Menopause-associated lipid metabolic disorders and foods beneficial for postmenopausal women. Nutrients 2020, 12, 202. [Google Scholar] [CrossRef] [Green Version]
- Jackson, N.; Waters, E. Criteria for the systematic review of health promotion and public health interventions. Health Promot. Int. 2005, 20, 367–374. [Google Scholar] [CrossRef] [Green Version]


| n = 50 | M | SD | Risk | No risk | ||
|---|---|---|---|---|---|---|
| n | % | n | % | |||
| Age | 39.73 | 7.411 | ||||
| Athropometric measures | ||||||
| Body Weight (kg) | 67.57 | 11.01 | ||||
| Height (m) | 1.56 | 0.10 | ||||
| BMI (kg/m2) | 27.68 | 3.19 | ||||
| Hip circumference (cm) | 100.58 | 6.60 | ||||
| Anthropometric indexes | ||||||
| WC (cm) | 85.92 | 10.94 | 26 | 52 | 26 | 52 |
| WtHR | 0.55 | 0.10 | 42 | 84 | 42 | 84 |
| ABSI | 0.074 | 0.006 | 9 | 18 | 9 | 18 |
| CI | 1.20 | 0.12 | 33 | 66 | 33 | 66 |
| AVI | 15.19 | 3.88 | 9 | 18 | 9 | 18 |
| BAI (%) | 34.02 | 9.38 | 32 | 64 | 32 | 64 |
| Blood parameters | ||||||
| SBP (mmHg) | 116.04 | 12.69 | 40 | 80 | 40 | 80 |
| DBP (mmHg) | 66.23 | 8.20 | 2 | 4 | 2 | 4 |
| Fasting blood gucose (mg/dL) | 82.70 | 10.45 | 1 | 2 | 1 | 2 |
| Triglycerides (mg/dL) | 134.33 | 45.92 | 18 | 36 | 18 | 36 |
| Total Cholesterol (mg/dL) | 175.48 | 43.21 | 15 | 30 | 15 | 30 |
| HDL (mg/dL) | 41.6 | 6.4 | 48 | 96 | 48 | 96 |
| LDL (mg/dL) | 103.31 | 35.66 | 40 | 80 | 40 | 80 |
| Control Group (CG) n = 15 | Choreographic Fitness Classes Group (CFC) n = 25 | |||||||||
|---|---|---|---|---|---|---|---|---|---|---|
| Variables | Pre-Intervention | Post-Intervention | p Value | Pre-Intervention | Post-Intervention | p Value | ||||
| M | SD | M | SD | M | SD | M | SD | |||
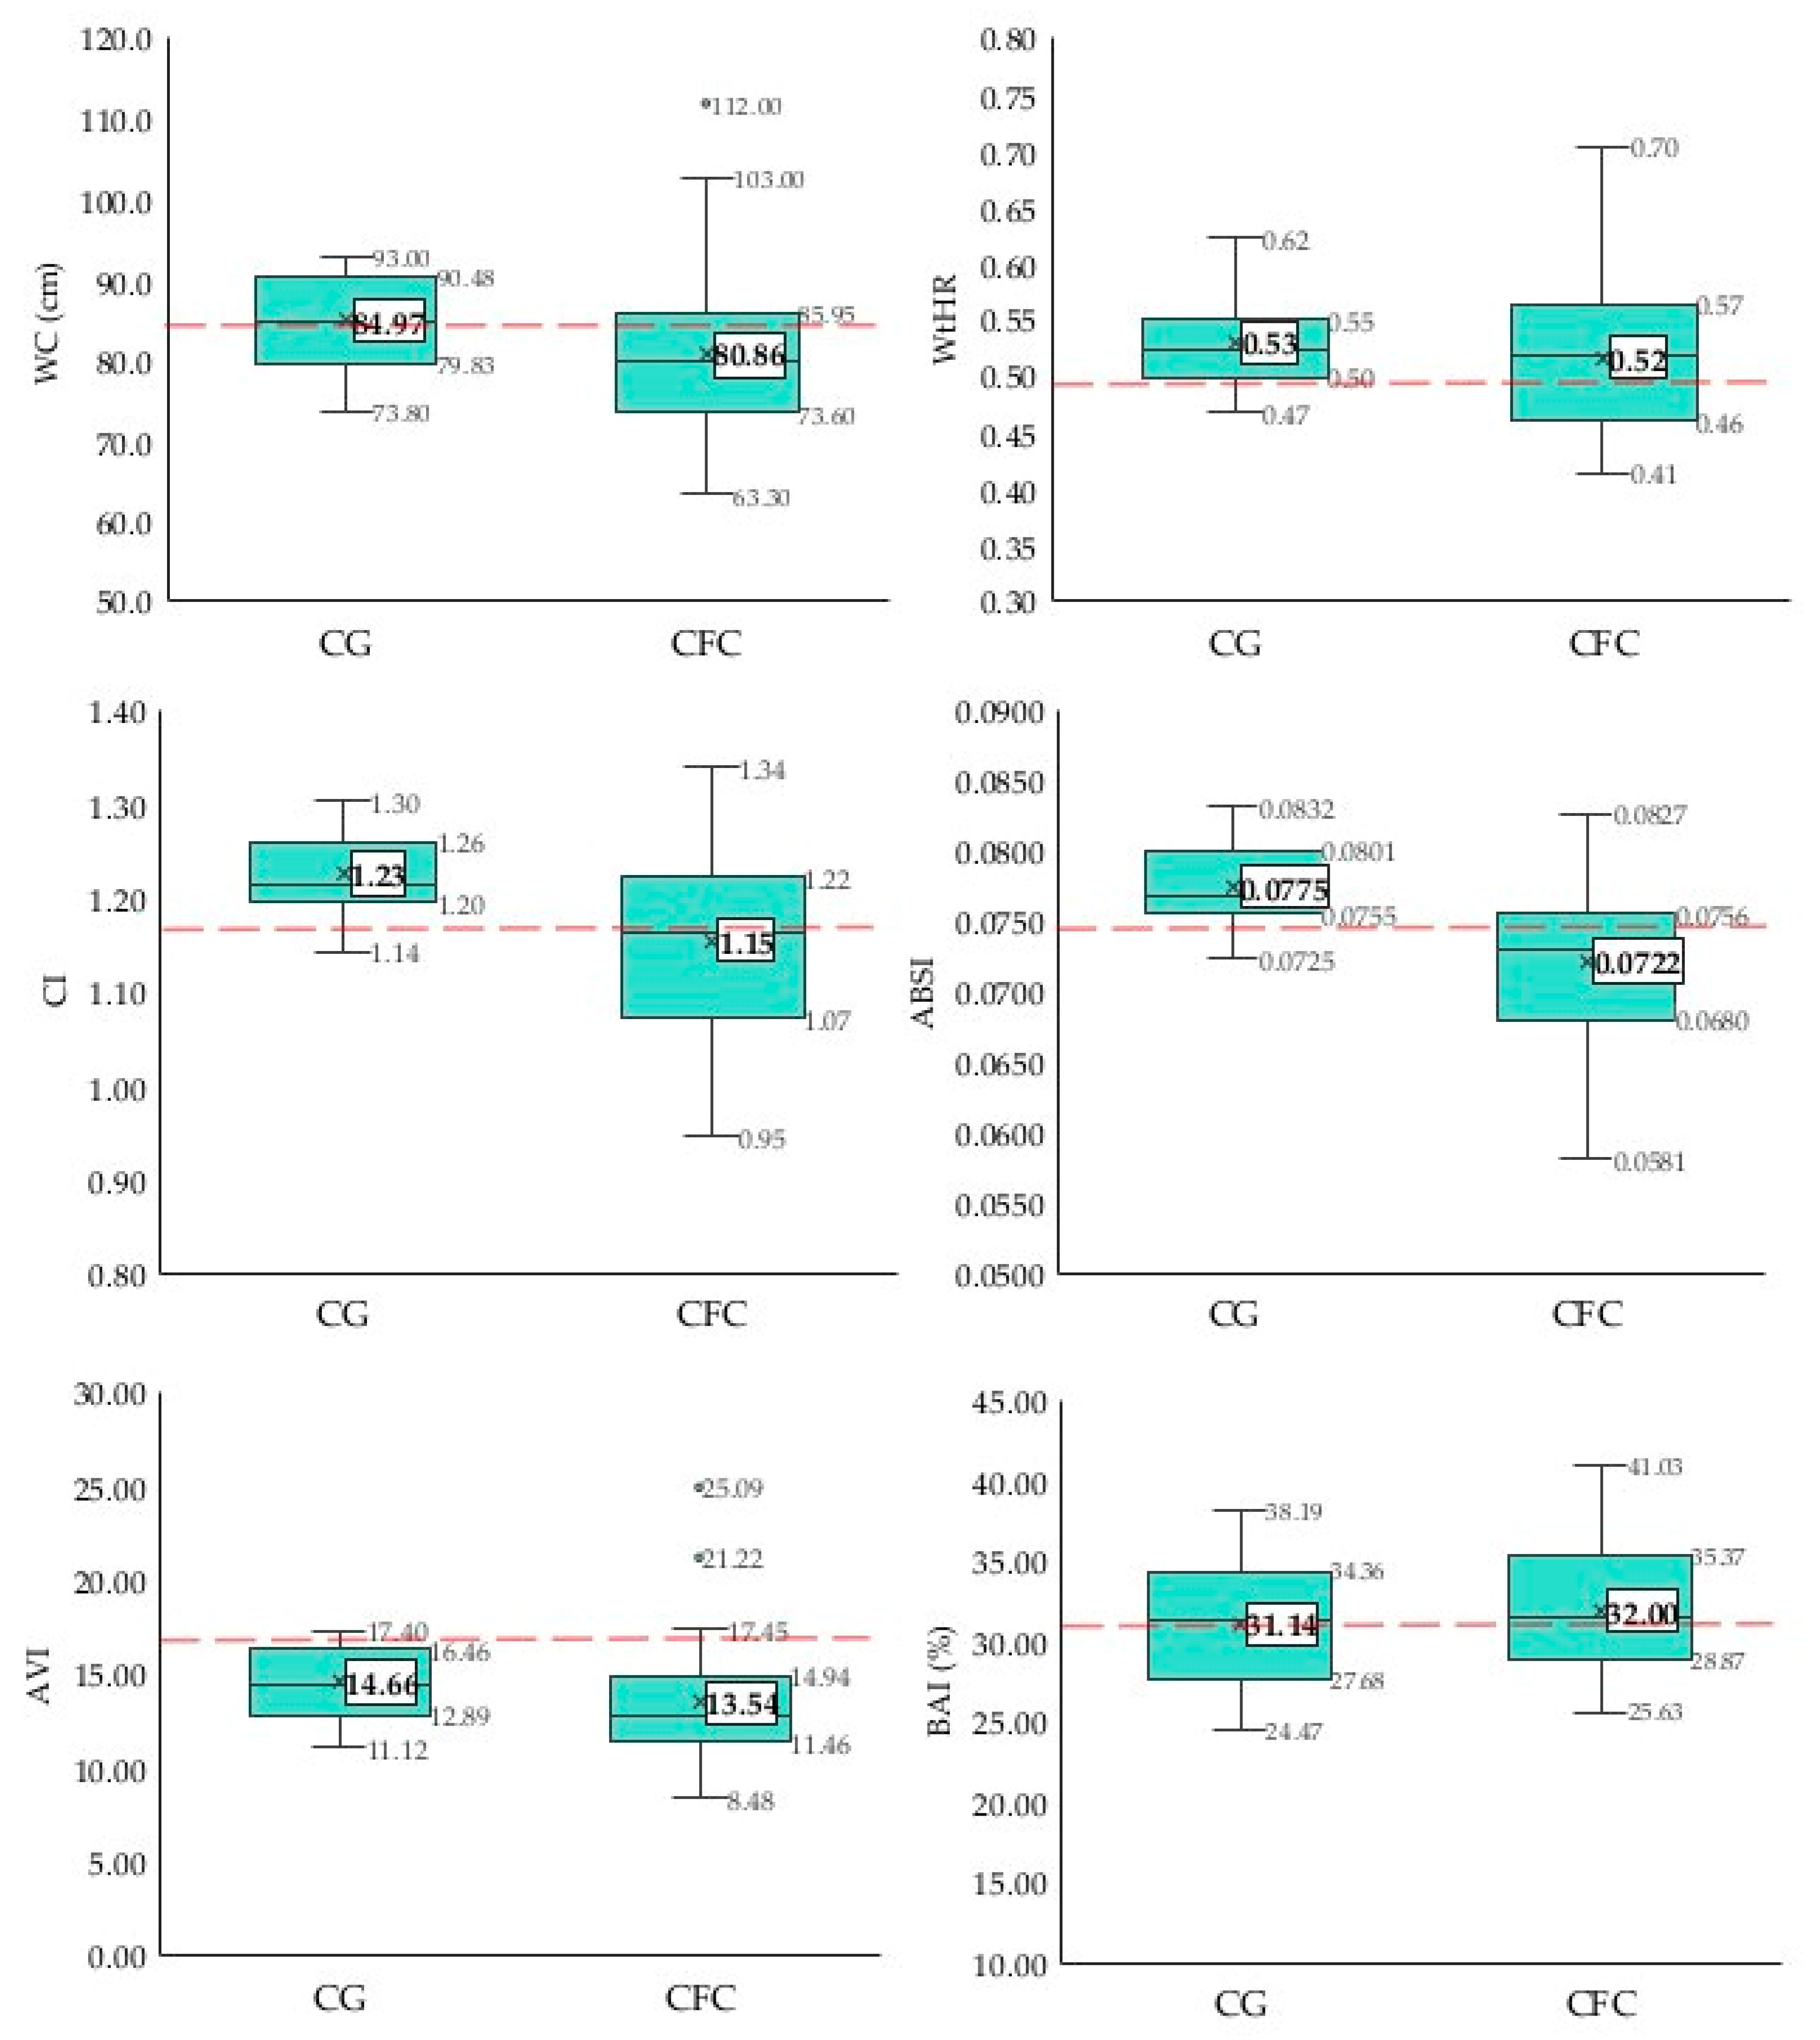
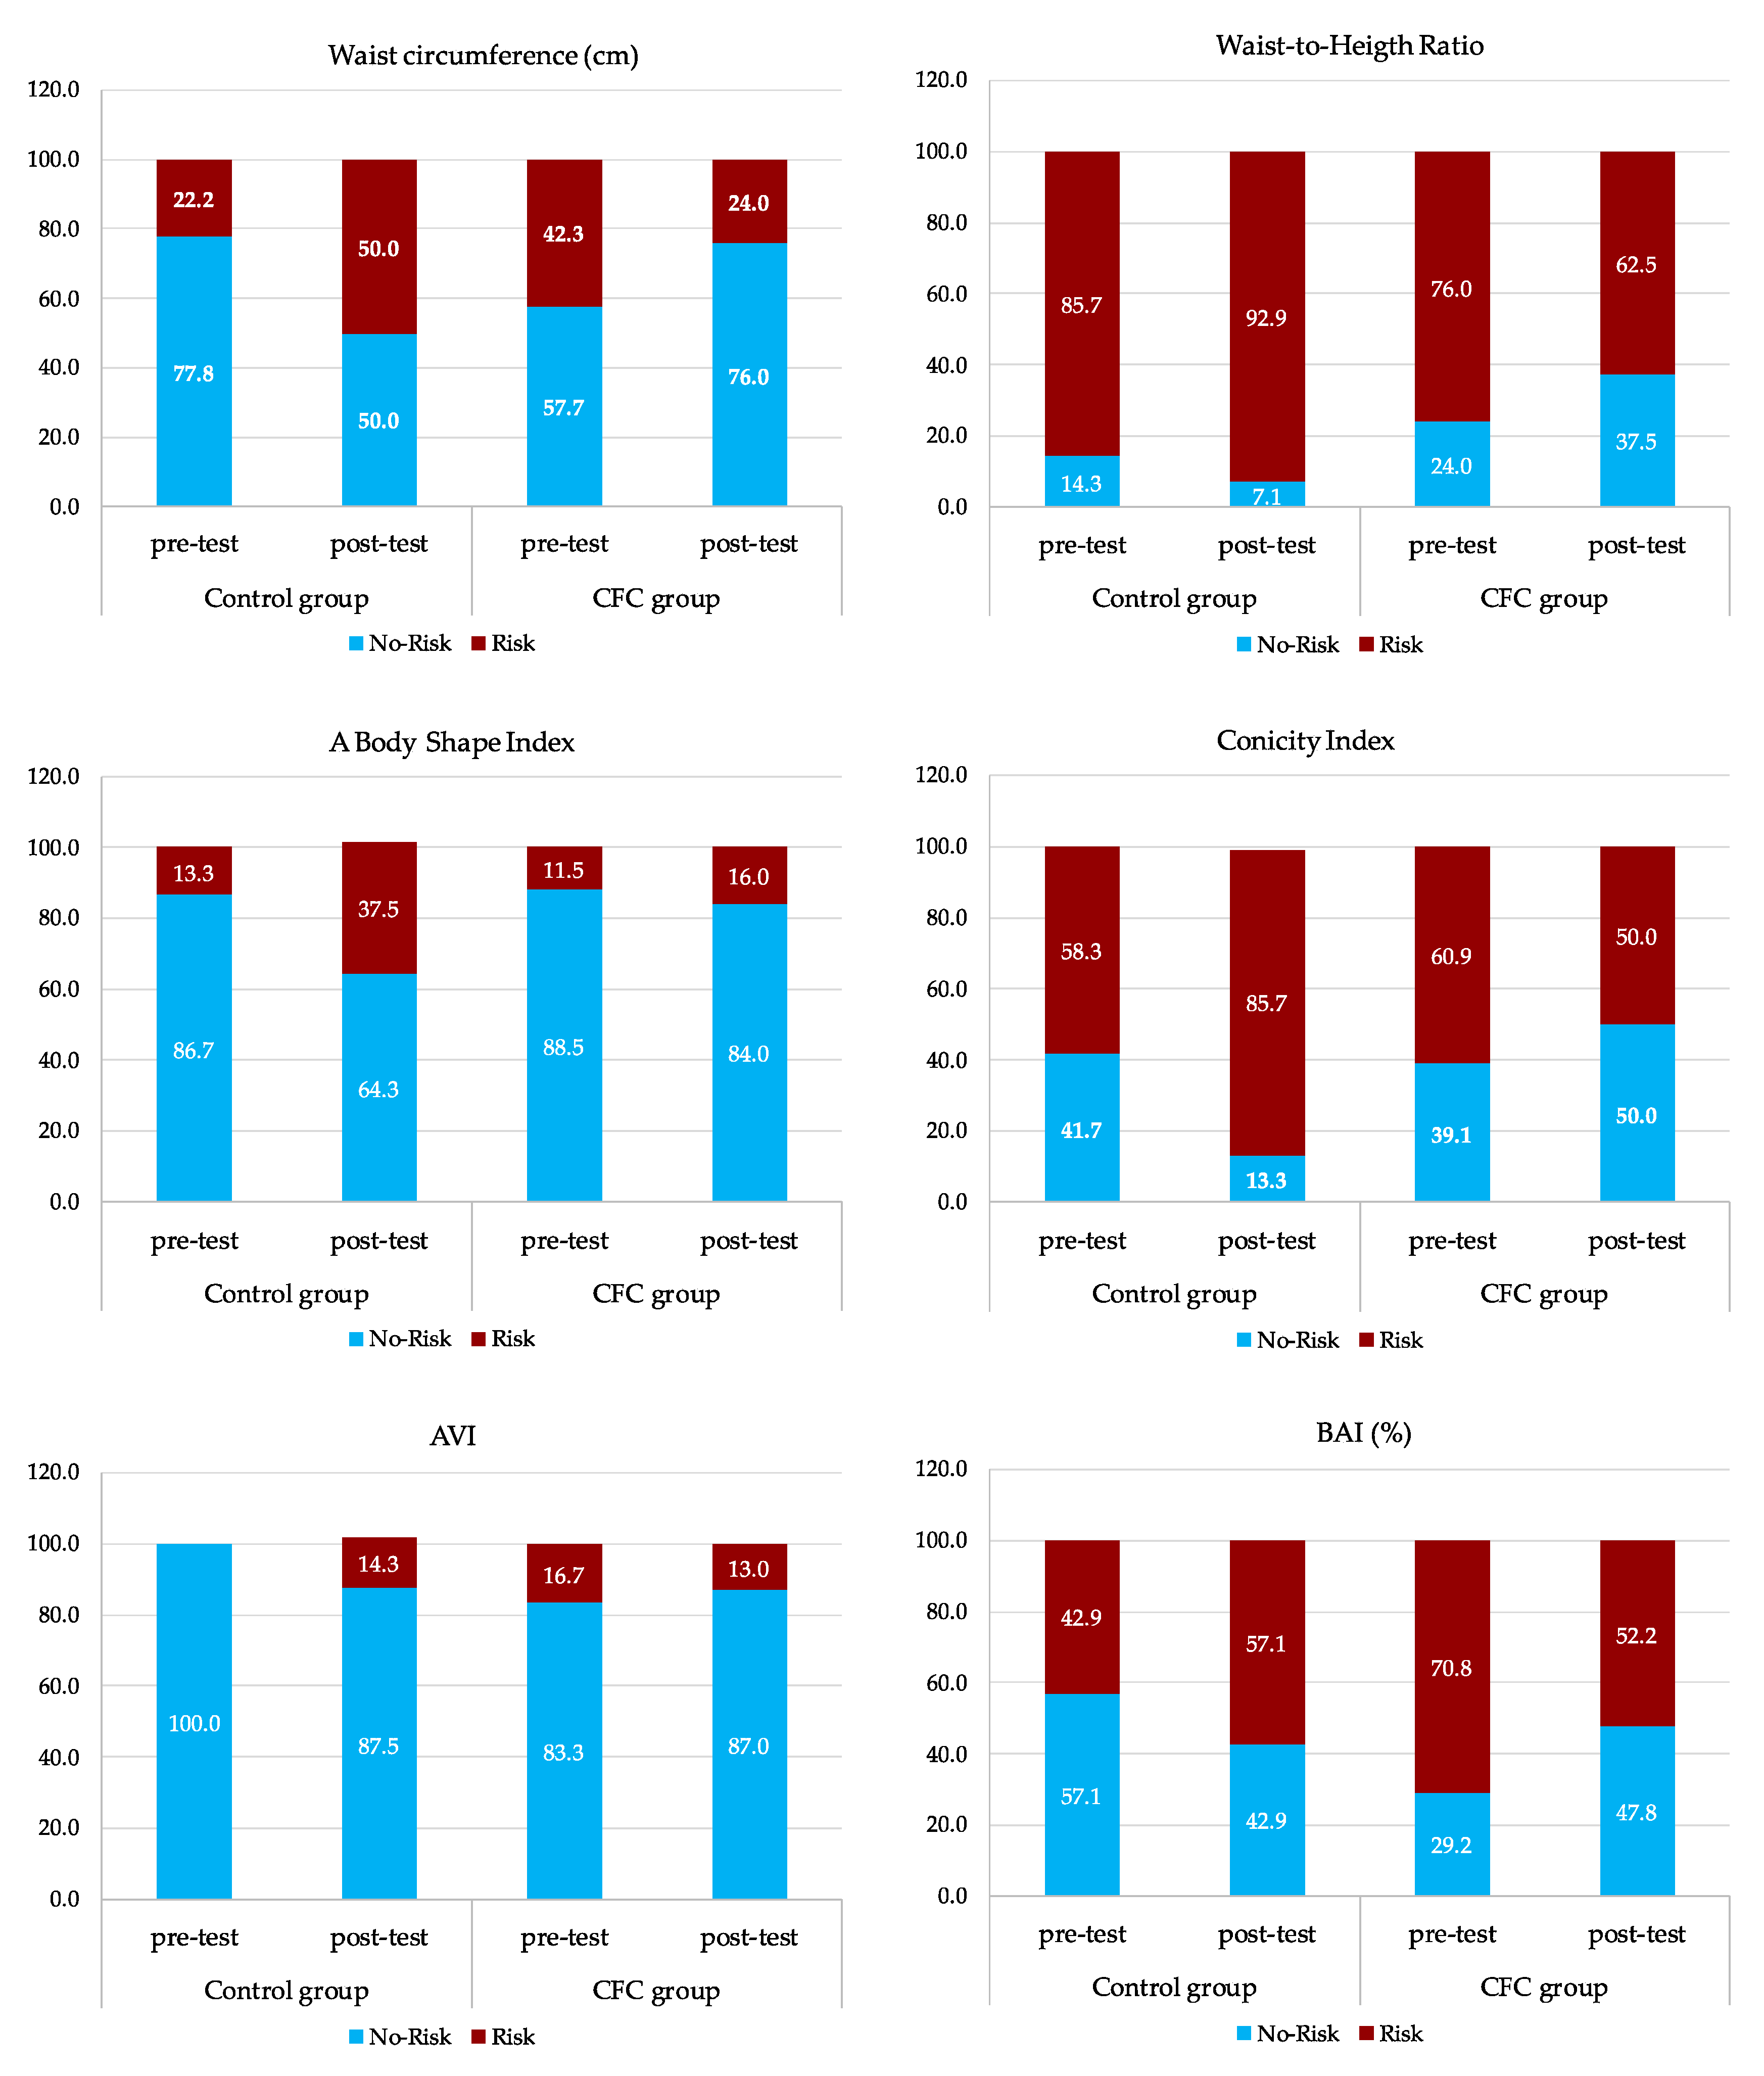
| Anthropometric indices | ||||||||||
| WC (cm) | 82.19 | 6.37 | 84.97 | 5.84 | 0.000 | 83.79 | 11.34 | 80.86 | 10.84 | 0.005 |
| WtHR | 0.52 | 0.04 | 0.53 | 0.04 | 0.006 | 0.54 | 0.070 | 0.52 | 0.070 | 0.001 |
| ABSI | 0.073 | 0.004 | 0.078 | 0.051 | 0.002 | 0.073 | 0.005 | 0.072 | 0.006 | 0.752 |
| CI | 1.17 | 0.07 | 1.23 | 0.05 | 0.001 | 1.170 | 0.10 | 1.15 | 0.09 | 0.303 |
| AVI | 13.76 | 2.01 | 14.66 | 1.93 | 0.000 | 14.53 | 3.96 | 13.55 | 3.65 | 0.002 |
| BAI (%) | 30.62 | 3.52 | 31.14 | 4.08 | 0.089 | 33.92 | 3.51 | 32.00 | 3.51 | 0.000 |
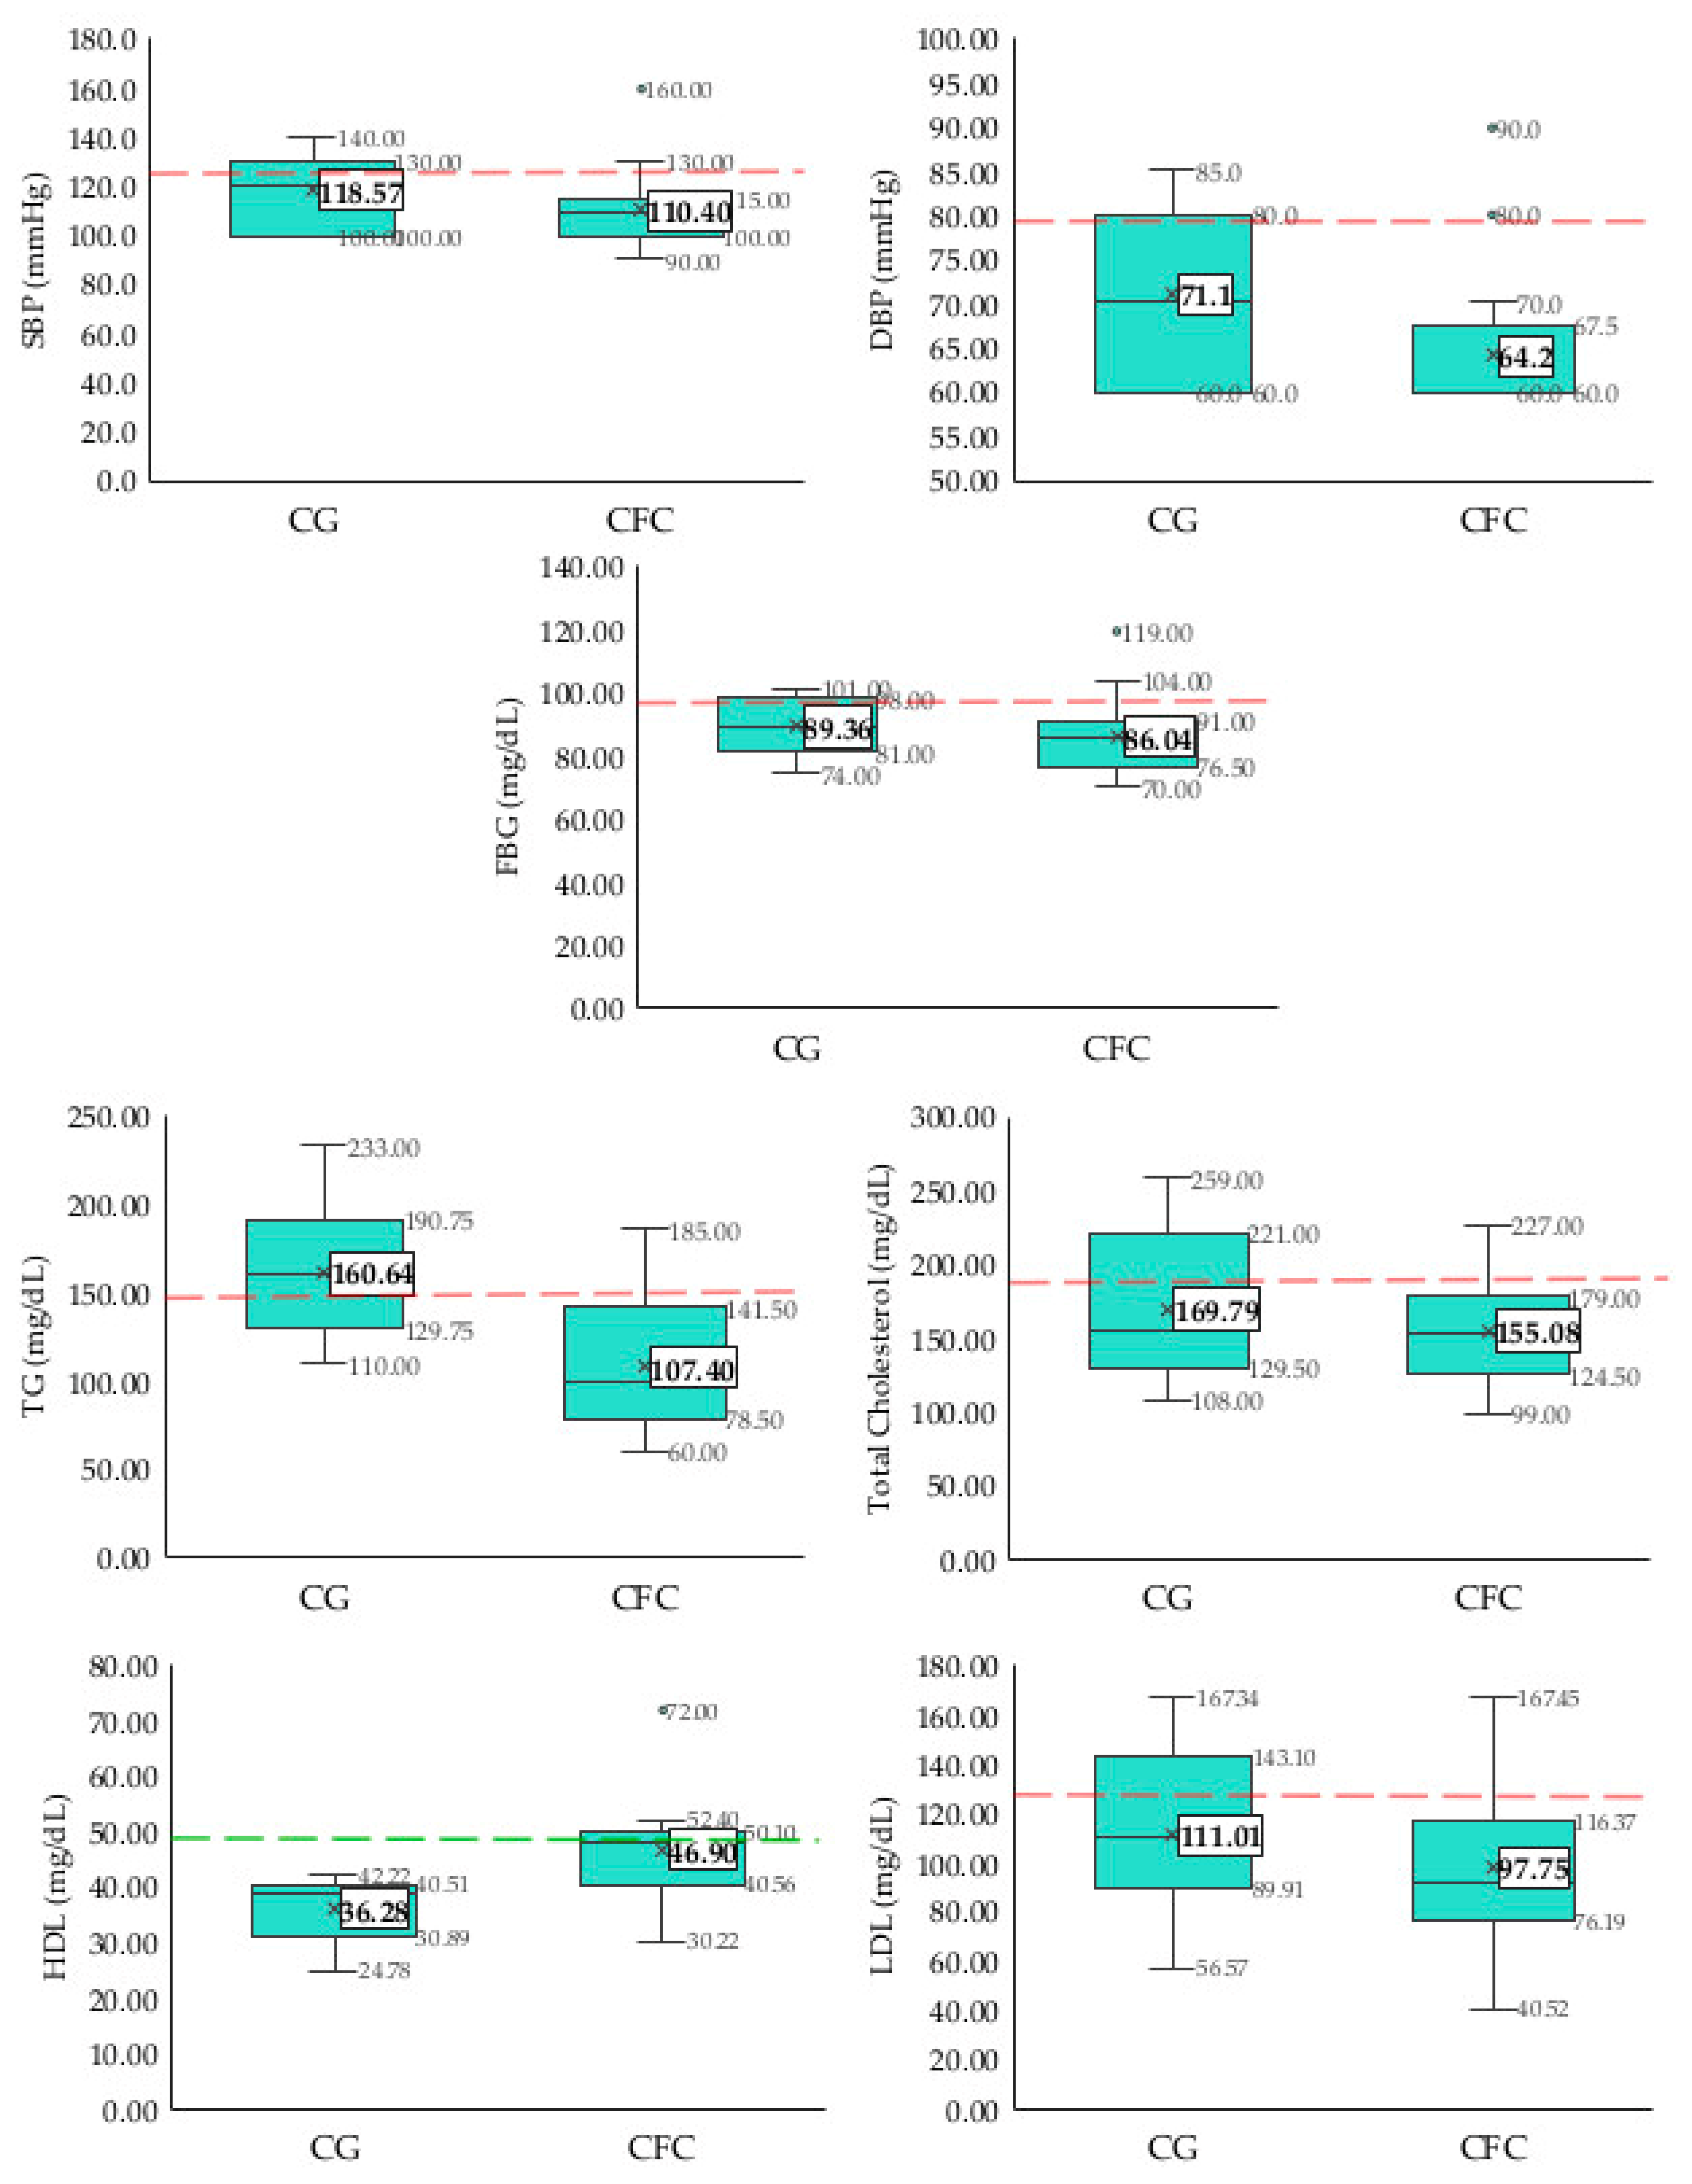
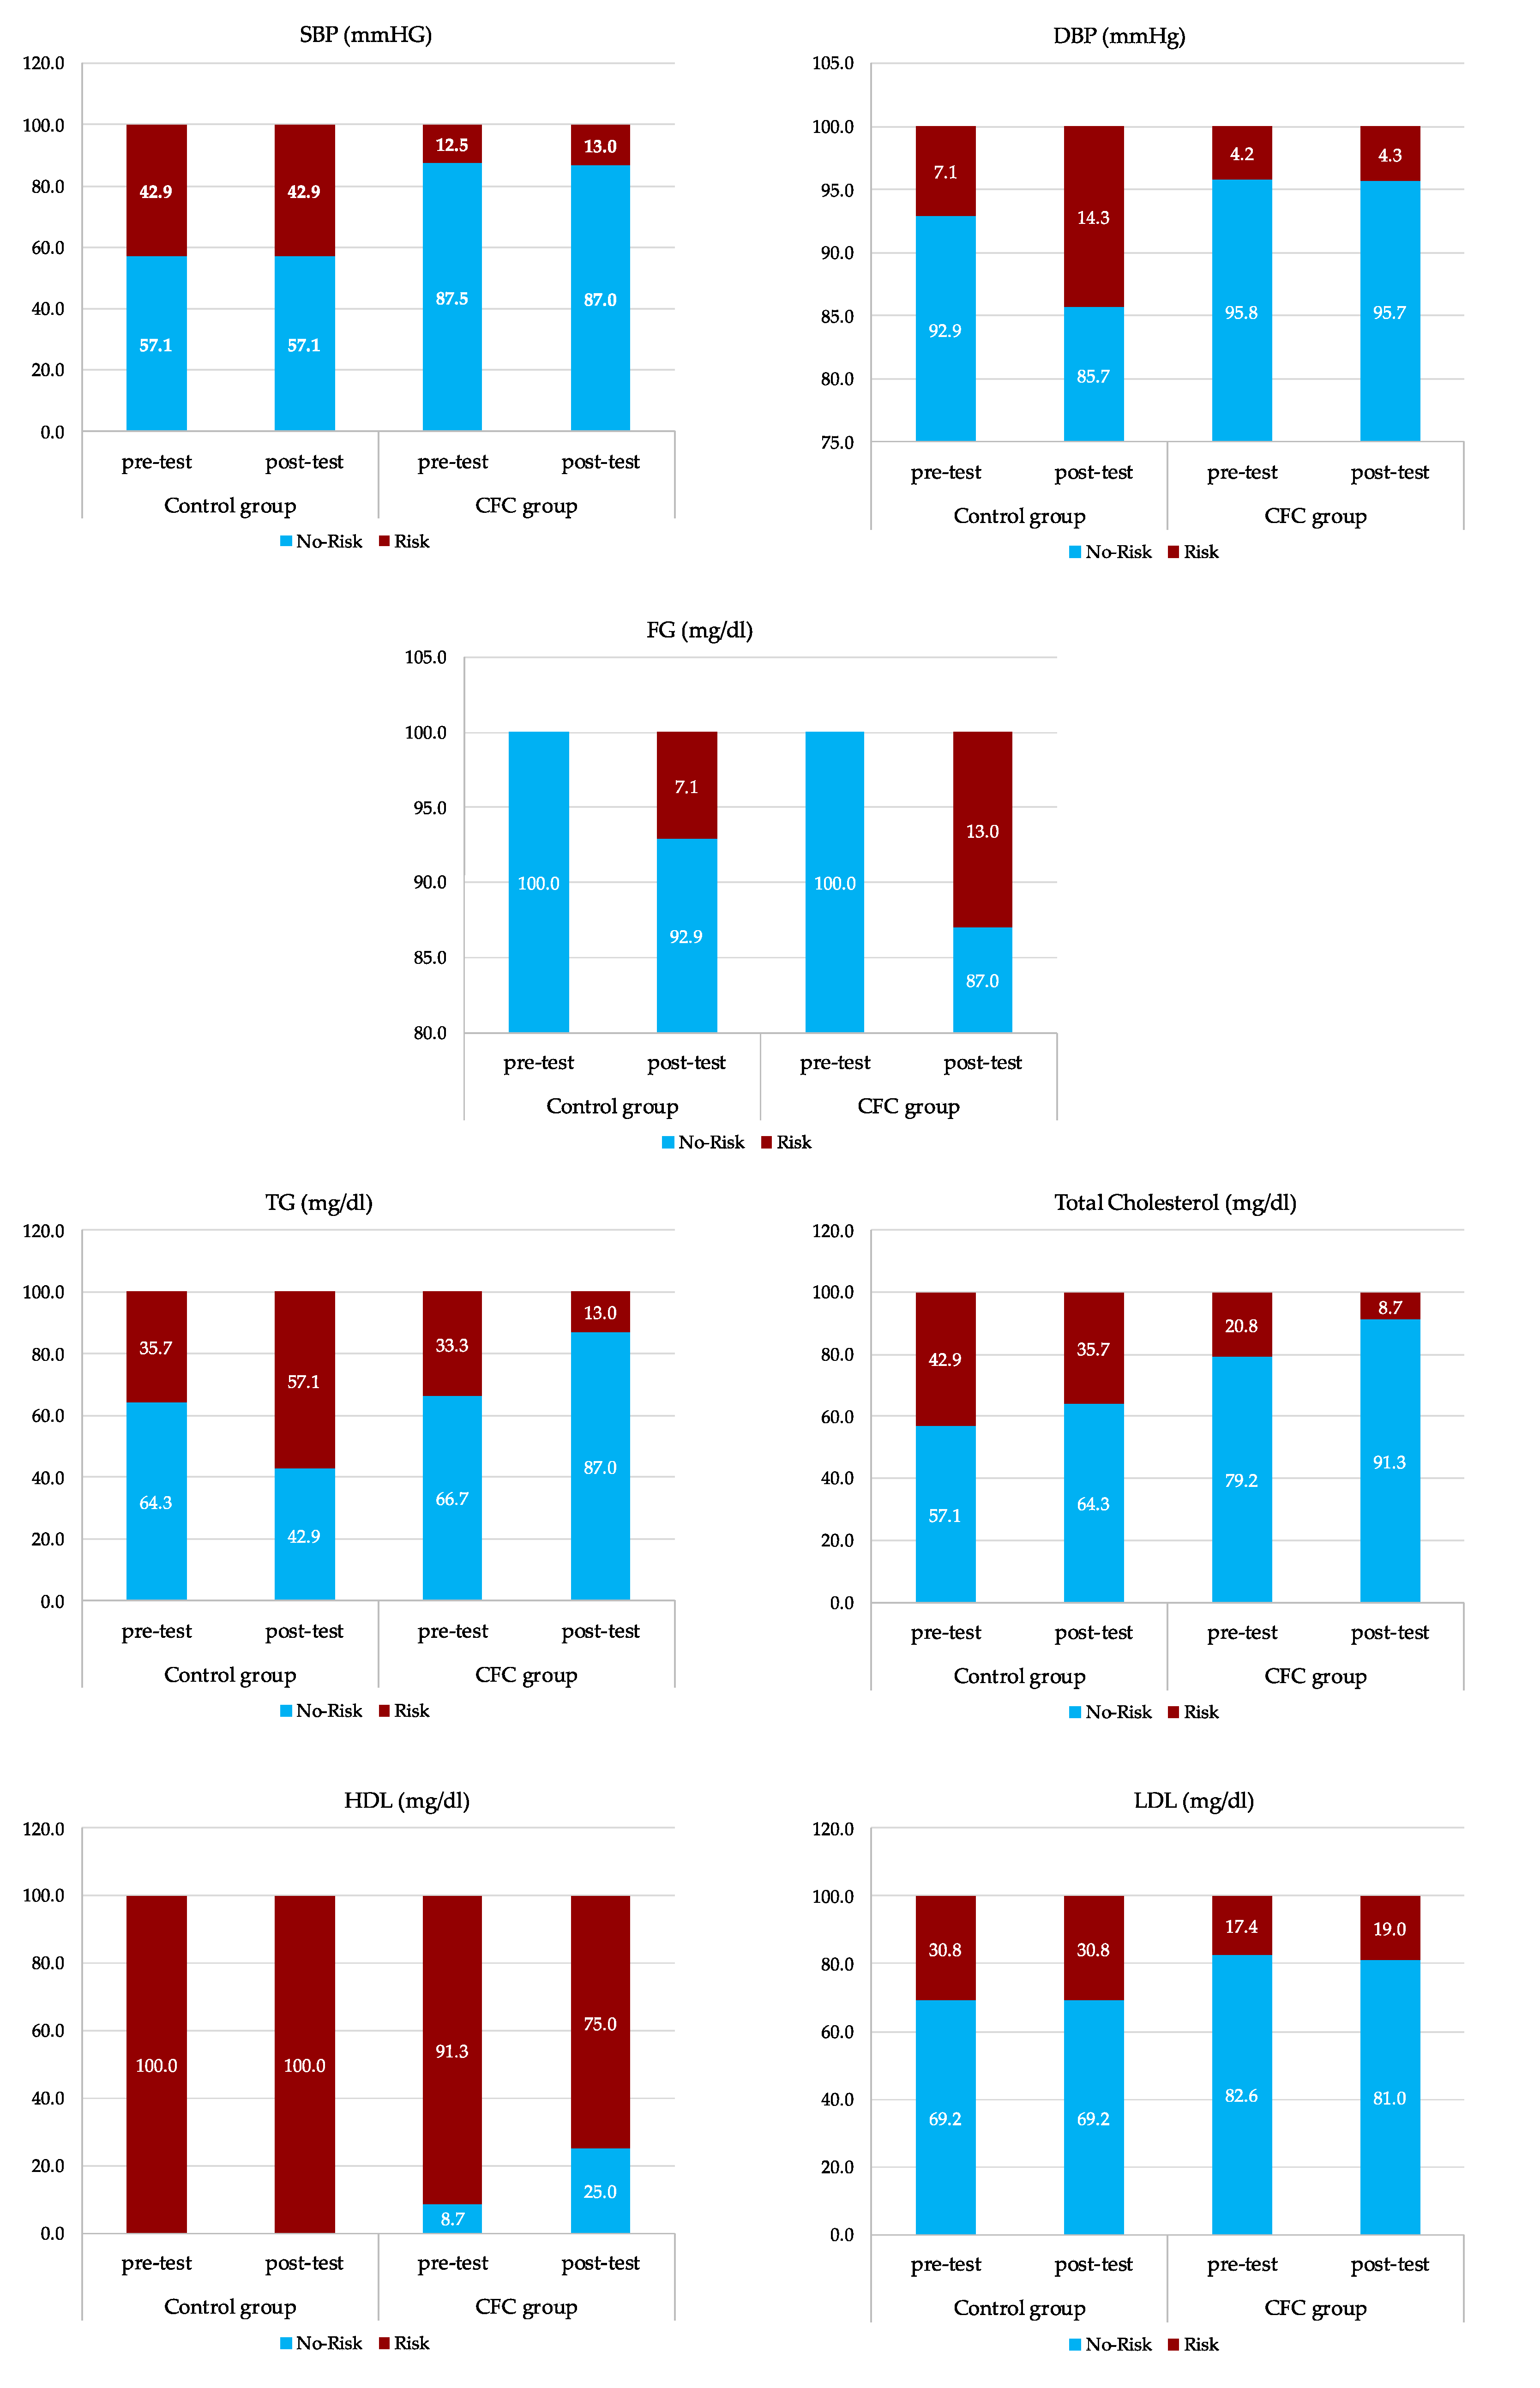
| Blood parameters | ||||||||||
| SBP (mmHg) | 118.21 | 10.49 | 118.57 | 14.06 | 0.890 | 117.00 | 14.43 | 110.40 | 14.57 | 0.004 |
| DBP (mmHg) | 68.93 | 7.38 | 71.07 | 9.44 | 0.254 | 65.00 | 9.24 | 64.20 | 8.12 | 0.672 |
| Glucose (mg/dL) | 89.87 | 7.56 | 89.36 | 8.72 | 0.817 | 78.58 | 8.13 | 86.04 | 11.48 | 0.015 |
| Triglycerides (mg/dL) | 140.44 | 39.63 | 160.64 | 36.85 | 0.004 | 126.72 | 47.56 | 107.40 | 35.13 | 0.001 |
| Total-Cholesterol (mg/dL) | 182.95 | 51.61 | 169.79 | 48.52 | 0.193 | 171.28 | 37.95 | 155.08 | 34.50 | 0.000 |
| HDL (mg/dL) | 39.15 | 3.48 | 36.00 | 5.58 | 0.061 | 44.80 | 7.48 | 46.87 | 8.04 | 0.151 |
| LDL (mg/dL) | 103.43 | 38.66 | 111.08 | 34.19 | 0.006 | 101.59 | 33.27 | 98.29 | 30.94 | 0.008 |
Publisher’s Note: MDPI stays neutral with regard to jurisdictional claims in published maps and institutional affiliations. |
© 2021 by the authors. Licensee MDPI, Basel, Switzerland. This article is an open access article distributed under the terms and conditions of the Creative Commons Attribution (CC BY) license (http://creativecommons.org/licenses/by/4.0/).
Share and Cite
Barranco-Ruiz, Y.; Villa-González, E. Choreographic Group-Based Fitness Classes Improve Cardiometabolic Health-Related Anthropometric Indices and Blood Lipids Profile in Overweight Sedentary Women. Sustainability 2021, 13, 972. https://0-doi-org.brum.beds.ac.uk/10.3390/su13020972
Barranco-Ruiz Y, Villa-González E. Choreographic Group-Based Fitness Classes Improve Cardiometabolic Health-Related Anthropometric Indices and Blood Lipids Profile in Overweight Sedentary Women. Sustainability. 2021; 13(2):972. https://0-doi-org.brum.beds.ac.uk/10.3390/su13020972
Chicago/Turabian StyleBarranco-Ruiz, Yaira, and Emilio Villa-González. 2021. "Choreographic Group-Based Fitness Classes Improve Cardiometabolic Health-Related Anthropometric Indices and Blood Lipids Profile in Overweight Sedentary Women" Sustainability 13, no. 2: 972. https://0-doi-org.brum.beds.ac.uk/10.3390/su13020972