q-Rung Orthopair Fuzzy TOPSIS Method for Green Supplier Selection Problem

.jpg)


1
Turkish Land Forces Logistics Command, 06135 Ankara, Turkey
2
Department of Industrial Engineering, Ankara Yıldırım Beyazıt University, 06010 Ankara, Turkey
3
Department of Industrial Engineering, Ankara Science University, 06200 Ankara, Turkey
*
Author to whom correspondence should be addressed.
Sustainability 2021, 13(2), 985; https://0-doi-org.brum.beds.ac.uk/10.3390/su13020985
Submission received: 2 December 2020
/
Revised: 5 January 2021
/
Accepted: 10 January 2021
/
Published: 19 January 2021
Abstract
:Supply chain management is to improve competitive stress. In today’s world, competitive terms and customer sense have altered in favor of an environmentalist manner. As a result of this, green supplier selection has become a very important topic. In the green supplier selection approach, agility, lean process, sustainability, environmental sensitivity, and durability are pointed. Like the classical supplier selection problems, environmental criteria generally emphasize green supplier selection. However, these two problem approaches are different from each other in terms of carbon footprint, water consumption, environmental and recycling applications. Due to the problem structure, a resolution is defined that includes an algorithm based on q-Rung Orthopair Fuzzy (q-ROF) TOPSIS method. Brief information about q-ROF sets is given before the methodology of the q-ROF model is introduced. By using the proposed method and q-ROF sets, an application was made with today’s uncertain conditions. In the conclusion part, a comparison is made with classical TOPSIS, Intuitionistic Fuzzy TOPSIS and q-ROF TOPSIS methodology. As a result, more stable and accurate results are obtained with q-ROF TOPSIS.
1. Introduction
With developing the awareness of environmental protection with the help of the pressures of the community and regulations of developed countries, green supply chain management (GSCM) has become a significant approach and gained attention inside the academic world and business enterprises. Environmental management has many strategic actors, including governments, stockholders, end-users, companies, and communities. An assessment system for green suppliers’ performance is crucial to decide the appropriateness of suppliers to collaborate with the related company [1].
Traditional supply chain management typically focused on cost and control of the product instead of its environmental impacts. However, GSCM is environmentally optimized, aims for cleaner production, waste management, and deals with human toxicological impacts as well [2]. The green supplier assessment and selection is the fundamental part of GSCM that can legitimately affect the performance of the company. Government regulations and public awareness regarding environmental issues make companies become more sensitive about environmental protection and force them to provide their goods and services compatible with environmental criteria. First, companies started some initiatives for emission and waste reduction, energy consumption, and in the 1990s, they also initiated eco-auditing frameworks for environment-friendly products and services. Afterward, big companies introduced environmental programs to make their supply chains obey environmental rules and regulations [3].
The Green Supplier Selection (GSS) is also a multiple-criteria group decision-making (MCGDM) problem dealing with various evaluation criteria considering environmental concerns and shows both qualitative and quantitative nature [4]. Researchers determine many environmental criteria for green supplier selection, including [2] obeying environmental regulations, green design criteria (reusability, reduction of waste, etc.), green manufacturing criteria (minimizing the hazardous material and toxic/hazardous waste in the production phase, remanufacturing, etc.), green technology, environmental management criteria (emission, reuse recovery, ISO 14000 certification, recycle of waste), green purchasing, pollution control, etc.
There are many MCGDM studies evaluating suppliers according to environmental criteria presented in the literature section. However, due to the unique nature of green supplier selection, we need a decision-making method that is able to aggregate both qualitative and quantitative data, consider uncertainty, discriminate the alternative green suppliers apparently. The aim of this paper is to introduce an effective, applicable MCGDM method to measure the performance of green suppliers using experts’ subjective evaluations. We develop a green supplier evaluation methodology with the help of q-ROF sets and TOPSIS method, which gives remarkable results. Despite its subjectivity, TOPSIS was chosen as (a) it is easy to apply, universal, and rationally comprehensible, (b) it has an intuitive and clear logic symbolizing the human decision well and has better computational efficiency, (c) it has the ability to measure the relative performance for each alternative in a simple mathematical form and (d) it gives us the distances of the alternative values to negative and positive ideal solutions. We compare our method with classical TOPSIS and Intuitionistic Fuzzy (IF) TOPSIS method of Rouyendegh et al. [5] and get successful results in terms of accuracy.
The rest of the study is structured as follows: In Section 2, a literature review of multiple criteria decision-making methods for green supplier selection is presented, especially fuzzy TOPSIS methods are included, in Section 3, q-rung orthopair fuzzy sets and q-ROF TOPSIS methodology are explained, in Section 4, a green supplier selection case study is applied to q-ROF TOPSIS method, in Section 5, the results of both methods are compared and proposed methods advantages are discussed, in Section 6, the conclusion is given.
2. Literature Review
The literature on GSS is investigated and classified according to the decision-making method, and environmental criteria are listed for each study. Among the methods, first, individual decision-making methods are mentioned, then, integrated methods are presented. Analytic Hierarchy Process (AHP), which has a more hierarchical structure, and Analytic Network Process (ANP) were frequently utilized in GSS by many researchers. Noci [6] studied green vendor rating system effects on suppliers’ environmental performance with green competencies, current environmental efficiency, the supplier’s green image as evaluating criteria. Handfield et al. [7] studied the importance of environmental trades using AHP and they applied environmental criteria, such as waste management, reverse logistics, environmental models, at the supplier facilities. Lu et al. [8] and Chiou et al. [9] study GSS in the electronics industry. Lu et al. [8] apply environmental principles to green supply selection by capturing the expertise of experienced supply chain designers use Fuzzy AHP with environmental criteria. Chiou et al. [9] use fuzzy AHP (F-AHP) with a ranking system for GSS problem with respect to six criteria that involve environmental management system, environmental performance, green competencies. Grisi et al. [10] also use fuzzy extended AHP to evaluate green supplier performance for global decision integration of both quantitative and qualitative data with environmental criteria, such as current environmental impact, environmental competencies, etc. Hsu and Hu [11,12] studied GSS in line with hazardous materials management for environmental regulations in the electronic industry using ANP method with environmental sub-criteria as green purchasing, green design, green materials coding, inventory, and management of hazardous substances. Büyüközkan and Çifçi [13,14] mentioned the fuzzy ANP (F-ANP) method to evaluate suppliers in the manufacturing industry using the factors of social responsibility and environmental competencies with green criteria, such as green organizational activities, green logistics dimensions, etc.
Researchers use many approaches other than ANP and AHP to appraise green suppliers. Zhang et al. [15] studied environmentally conscious supplier management using a fuzzy multi-agent method. Humphreys et al. [16] appraised the environmental performance of suppliers due to user priorities using the fuzzy interference method with environmental criteria. Vachon and Klassen [17] proposed the Chi-Squared Test method with a survey testing the relationship between performance criteria and project partnership in a green environment. Yang and Wu [18] suggested Grey Enthropy Synthetic Evolution model evaluating green suppliers objectively with environmental criteria, such as environmental pollutant effects and pollution control initiatives. Kumar and Jain [19] proposed DEA taking carbon footprints as the main criteria, Feyzioglu and Büyüközkan [20] studied the Choquet Integral method, which takes into consideration the dependencies of environmental performance criteria. Bai and Sarkis [21] studied the Rough Set Theory method, which evaluated green suppliers with an incomplete data environment. Bin and Hong-Jun [22] studied supplier selection based on green purchasing using the factor analysts method, Yeh and Chuang [23] used the multi-objective genetic algorithm (MOGA) for supplier selection based on green criteria like pollution treatment costs, product recycling, etc.
As integrated approaches, many combinations of MCDM methods are proposed for GSS. Humphreys et al. [24,25] used Knowledge Base System with Case-Based Reasoning to integrate the environmental criteria for the purpose of measuring the supplier performance on environmental management. Yan [26] presented a hybrid approach of AHP and Genetic Algorithms (GA) for green supplier selection to calculate the weights dynamically. Li and Zhao [27] adopted AHP to determine the weights and make the assessment among suppliers with the Threshold Method and Grey Correlational Analysis. Chen et al. [28] developed an integrated method with respect to Fuzzy Set and Grey Relational Analysis to deal with the uncertainty in GSCM with green criteria, such as cleaner production, environmental management system, internal green production plan, green design, etc. Kuo et al. [29] proposed ANN–MADA hybrid model for green supplier selection that integrates artificial neural networks (ANN), data envelopment analysis (DEA), and ANP taking both supplier selection criteria and environmental regulations. They claim that their model’s discrimination and noise-insensitivity is better than other green suppliers’ selection models. Wen and Chi [30] introduced an integrated DEA-AHP-ANP model with green criteria, such as suppliers’ green image, green product performance and they asserted that it overcomes the limitation of each individual method for green supplier selection. Kuo and Lin [31] developed an integrated DEA and ANP model for supplier selection in the high-tech industry and claim that their model takes into consideration the interdependency between environmental criteria and gives users the advantage to set up their own criteria weight preferences in DEA. Büyüközkan [3] suggested an integrated F-AHP and Fuzzy Axiomatic Design (FAD) model for supplier selection in an automotive company. F-AHP is used for the determination of criteria weights and FAD is used calculating supplier rankings by three decision-makers among five potential suppliers. The main criteria, which are product cost, environmental performance, service performance, and product quality, are extended to 18 sub-criteria. Hashemi et al. [32] introduced an integrated approach in which ANP deal with the criteria interdependencies and GRA address the uncertainties and rank the suppliers. They claim that their model deals with drawbacks such as simplification in weight assignment, lacks possible inconsistencies and ignores the criteria interdependencies.
There are a few remarkable studies, particularly on F-TOPSIS in green supplier selection problem. Awasthi et al. [33] proposed F-TOPSIS for supplier selection in the logistics sector with the criteria of using environmentally friendly technology and materials, green research and development projects, green market share, etc. Büyüközkan and Çifçi [34] introduced a model that integrates fuzzy DEMATEL method, ANP, and TOPSIS for green supplier selection of an automotive company. Banaeian et al. [35] made a comparative analysis on fuzzy TOPSIS (F-TOPSIS), fuzzy GRA, and fuzzy VIKOR methods in green supplier evaluation of agri-food companies. As a result, they found that GRA is the best amongst the three methods, both in computational complexity and effectively handling uncertain criteria. Javad et al. [36] proposed an integrated F-TOPSIS and best-worst method to select the best vendors for Khouzestan Steel Company in Iran due to their green innovation skills with green criteria, such as environmental investments and economic benefits, environmental management initiatives, green purchasing capabilities, etc. Chen et al. studied a technique based on single-valued neutrosophic linguistic TOPSIS for GSS in low-carbon supply chains [37]. Sahu et al. developed green performance index evaluation platform based on an integrated grey TOPSIS and COPRAS-grey method to evaluate green suppliers [38]. Ramakrishnan and Chakraborty developed a Cloud TOPSIS model for GSS problem in the automobile industry [39]. Cao et al. introduced an IF judgment matrix and TOPSIS integrated method for green supplier selection [40]. Finally, Rouyendegh et al. [5] proposed an Intuitionistic F-TOPSIS Model for green supplier selection to avoid ambiguity and to facilitate decision-makers selecting the best supplier in uncertain situations.
3. Methodology
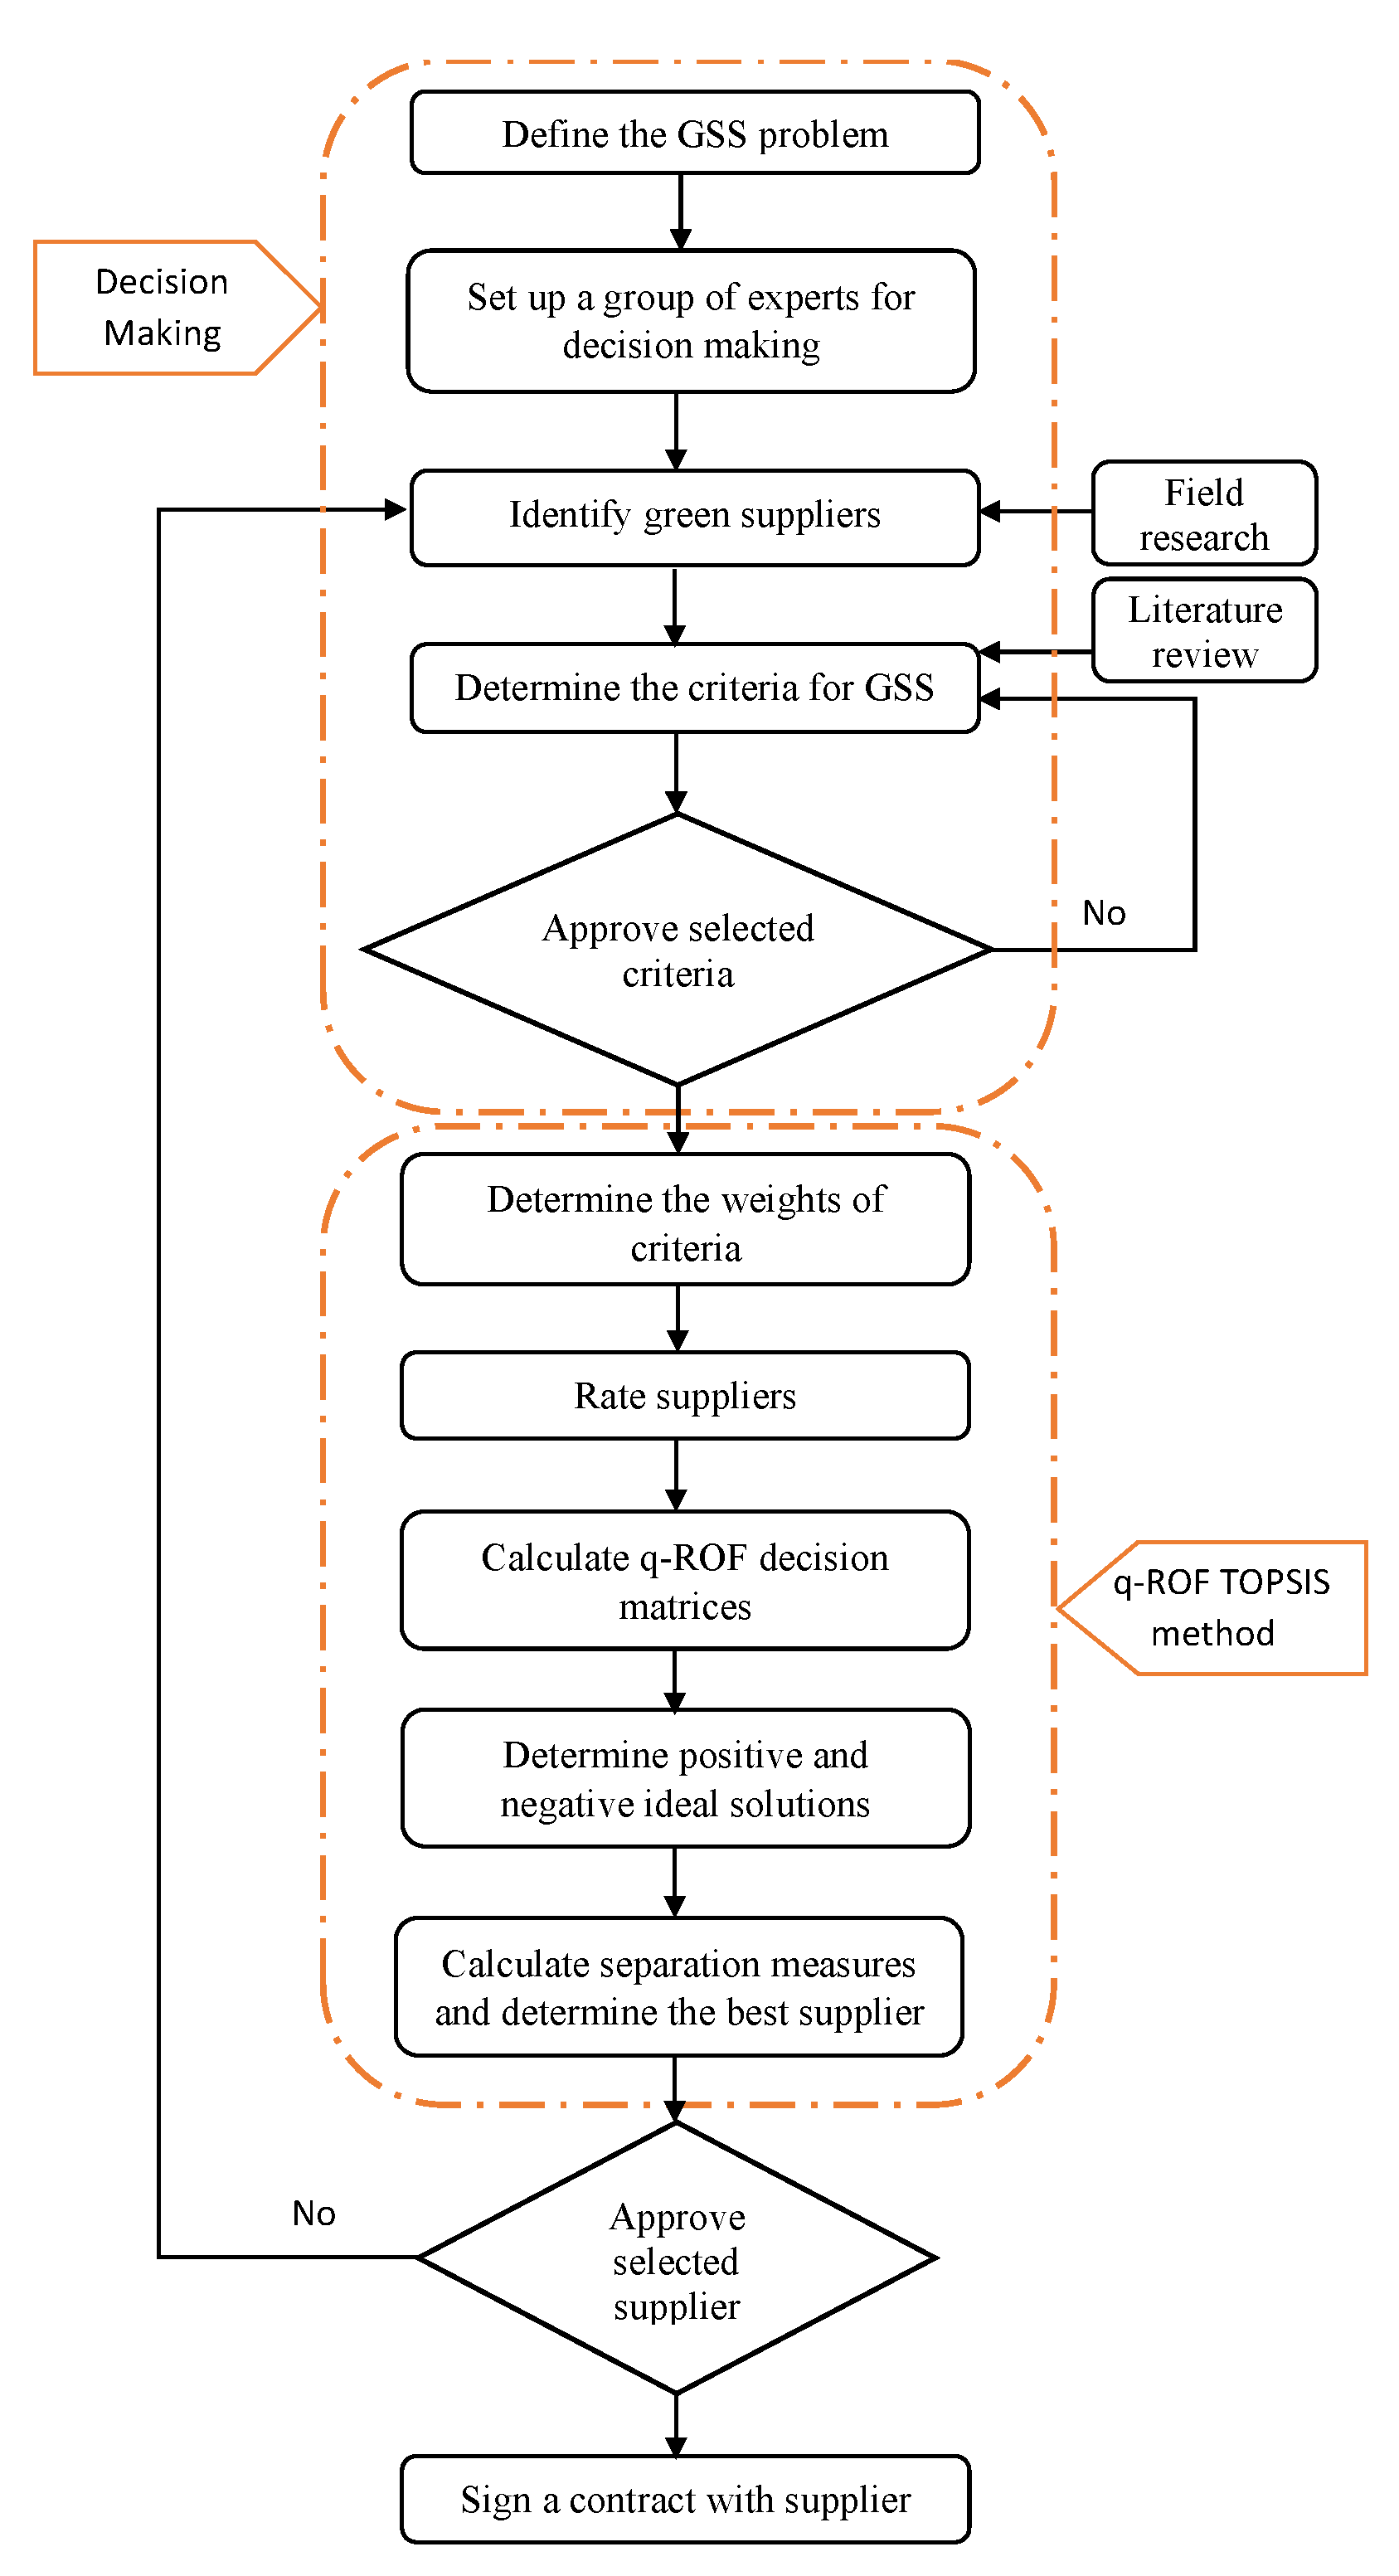
GSS is considered an MCGDM problem. Q-ROF TOPSIS method is presented for the solution of the problem (Figure 1). In this section, brief information about q rung orthopair fuzzy sets is given before the methodology of the q-ROF TOPSIS model is introduced.
3.1. Fuzzy Set Theory
Zadeh [41] introduced the fuzzy set, as in the universe of discourse is a set of ordered pairs given in Equation (1).
where is the membership degree.
As an extension to Zadeh’s introduction, Atanassov [42] proposed intuitionistic fuzzy set, of which A in X can be described as in Equations (2) and (3).
where the functions;
membership degrees of x,
non-membership degrees of x,
Besides, “he” defines the hesitation degree of belonging to or not such that:
After IFS, Yager [43] extended IFS and presented Pythagorean fuzzy sets (PFS) where the square sum of both membership degrees (a, b) such that a, b ∈ [0, 1] as follows:
With the introduction of PFS, compared to IFNs, membership and non-membership degrees have been expanded. For example, the membership degree and non-membership degree in PFS might occur as 0.8 and 0.6, respectively, however, it is not possible in IFS.
After PFS, Yager [44] presented the q-rung Orthopair fuzzy sets (q-ROFs), as the general form of IFS and PFS. In q-ROFs, the sum of the qth powers of both the membership degree and non-membership degree is restricted to one [45]. A qth rung Orthopair fuzzy subset of is given in Equation (6) as follows:
where is membership degree and is non-membership degree of to A and their sum is given in Equation (7) as follows:
The hesitation degree is given in Equation (8) as follows:
Therefore, q-ROF numbers (q-ROFNs) allow decision-makers (DMs) the flexibility to define a more comprehensive information range than previous fuzzy sets.
3.2. q-ROF TOPSIS Method
In this part, we present the modified version q-ROF TOPSIS method which was introduced by Pinar and Boran [46]. Let be a set of alternatives and be a set of criteria. The steps of q-ROF TOPSIS method are as follows:
Step 1. Calculate decision-makers (DMs) weights.
DMs weights are rated with linguistic terms in q-ROFNs. Let be a q-ROFN that rates the performance of kth of the DM. The DM rating is calculated by the help of a score function [47,48] in Equation (9) as follows:
Step 2. Aggregate the ratings and build a decision matrix.
Initially, DMs evaluate all the alternatives in linguistic terms. Then, they are converted to q-ROFNs. Presume is a group of q-ROFNs is aggregated with DMs weights using the q-ROFWA aggregator of Liu and Wang [49] presented as follows in Equation (10).
Then the aggregated q-ROF matrix is obtained as Equation (11):
where, and
Step 3. Calculation of the green evaluation criteria weights.
DM’s rate the importance of degrees (W) of evaluation criteria in linguistic terms. Then these ratings are converted to q-ROFNs and their score functions are calculated as follows:
where, and
Step 4. Set up the aggregated weighted matrix.
The aggregated weighted decision matrix is built by using the weight and previous decision matrix as follows:
and
and
Similar to the previous decision matrix, is an element of matrix .
Step 5. Calculate the Positive and Negative Ideal Solutions:
While q-ROF Positive Ideal Solution (q-ROFPIS) maximizes the benefit and minimizes the cost, on the other hand, q-ROF Negative Ideal Solution (q-ROFNIS) makes the benefits minimum and makes the costs maximum. So, let be benefit and be cost criteria. So, (q-ROFPIS) and (q-ROFNIS) can be determined as follows:
where;
and,
and,
and,
Step 6. Determine the separation measures.
As usually done in TOPSIS method, to calculate the difference between alternatives, a distance measure that is suggested for q-ROFNs by Pinar and Boran [46] is used to get stable results. The separation measures, and and, are determined with Equation (18) given below:
and
where and
Step 7. Calculate () and determine the rankings.
The relative closeness coefficient is determined with the below formula:
After is determined, to decide the optimal green supplier, alternatives are ranked according to their ’s value.
4. Case Study
In order to present the superiority of the proposed q-ROF TOPSIS model over IF TOPSIS, the same example of Rouyendegh et al. [5] is taken as the dataset of the case study. With its qualitative nature, this real-world example represents the subjectivity and uncertainty of the real decision-making environment. Here, a q-rung orthopair fuzzy set based TOPSIS model is chosen to mitigate the drawbacks of this subjectivity and ambiguity. The case study is about green supplier selection for a Turkish company. As details are shown in Table 1 and Table 2, 10 criteria are used to select the best supplier among four alternative companies by three experts as DMs.
In the first step, the importance of DMs is calculated. As explained in the previous section, linguistic evaluations are converted to q-ROFNs with the help of Table 3, and the importance of three DMs are determined as DM1 = 0.438, DM2 = 0.326, and DM3 = 0.236. In all calculations, q parameter is determined as three, and p parameter is taken as one.
In the second step, the linguistic ratings of DMs (Table 4) are converted to q-ROFNs and aggregated with the help of the q-ROFWA operator, and an aggregated matrix is constructed (Table 5).
In the third step, DM evaluations of criteria weights (Table 6) are converted q-ROFNs and in numeric form weights of evaluation criteria are calculated (Table 7).
After the criteria weights are obtained, the fourth step q-ROF decision matrix is easily converted to a weighted aggregated matrix (Table 8). In Step 5, both Positive and Negative Ideal Solutions are determined by Equations (16)–(20) and presented in Table 9 and Table 10.
In Step 6, separations between alternatives are calculated with the help of a q-ROF distance measure proposed by Pinar and Boran [42] given with Equations (21) and (22).
In Step 7, the relative closeness coefficient () is determined by using the formula given in Equation (23) and presented in Table 11.
As a result, final rankings of the alternatives are obtained as A4 > A2 > A1 > A3.
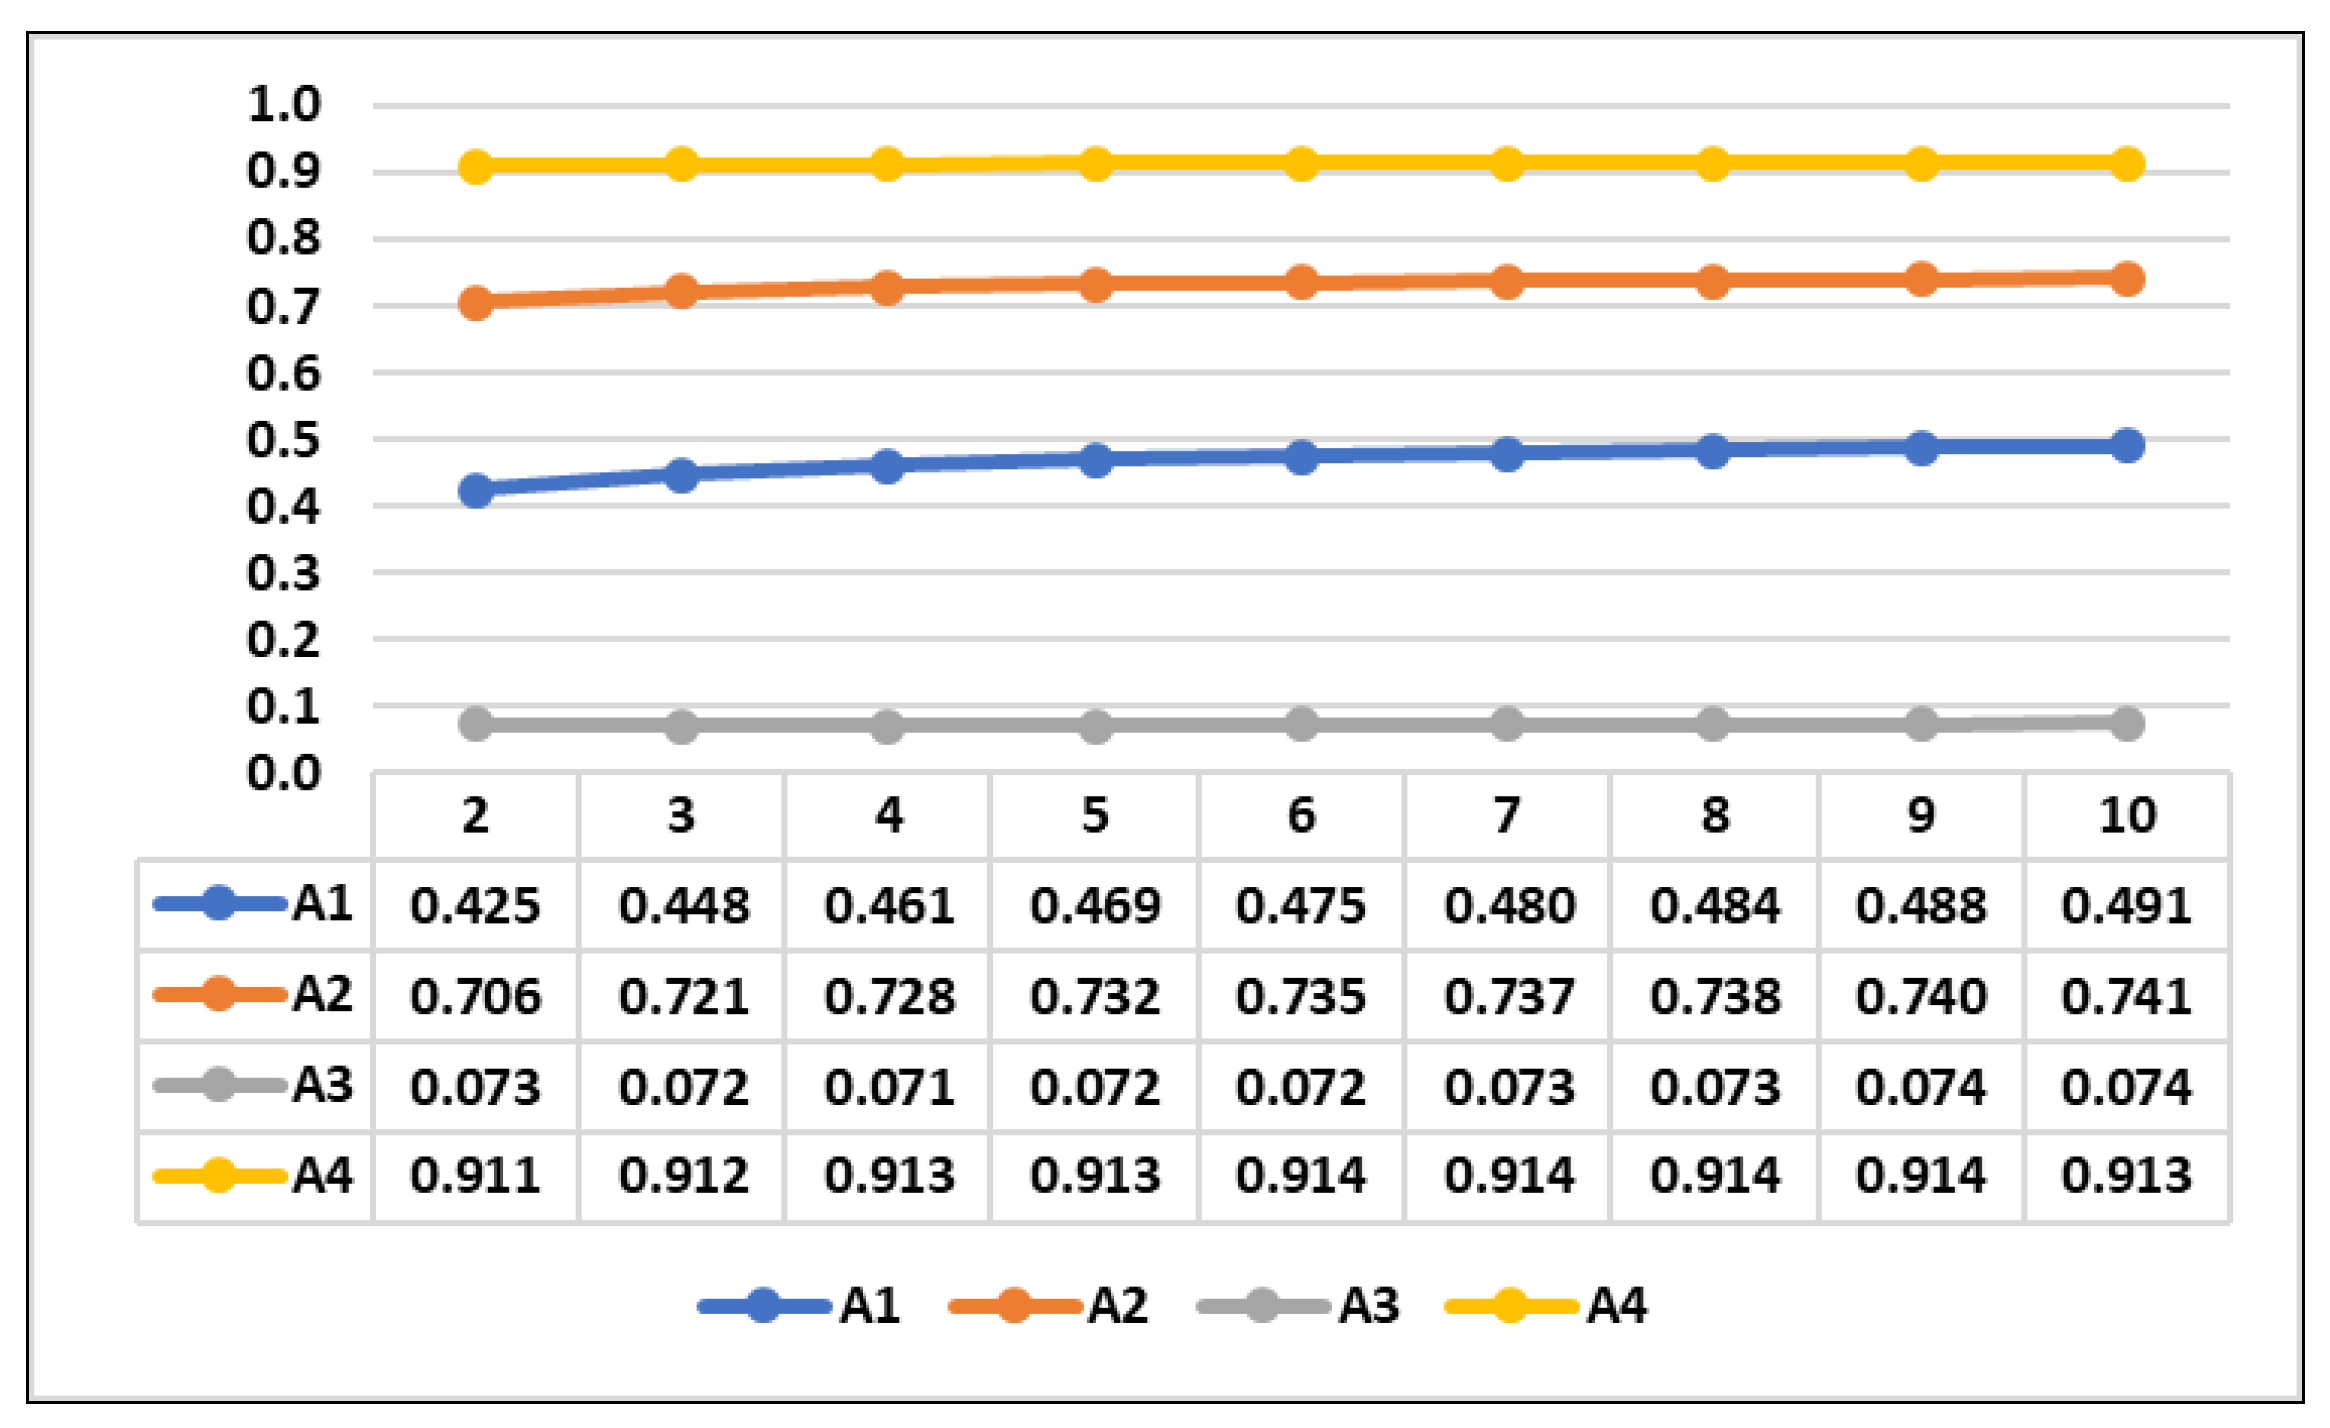
A parameter analysis test is performed to figure out the q parameter effectiveness in our model using the case study with different parameters for q = (2–10). The effects on the results of the rankings and closeness coefficient of the alternatives are presented in Figure 2. It is easily seen that the increase in q value does not have a negative effect on the stability of the rankings of the alternatives.
5. Results and Discussion
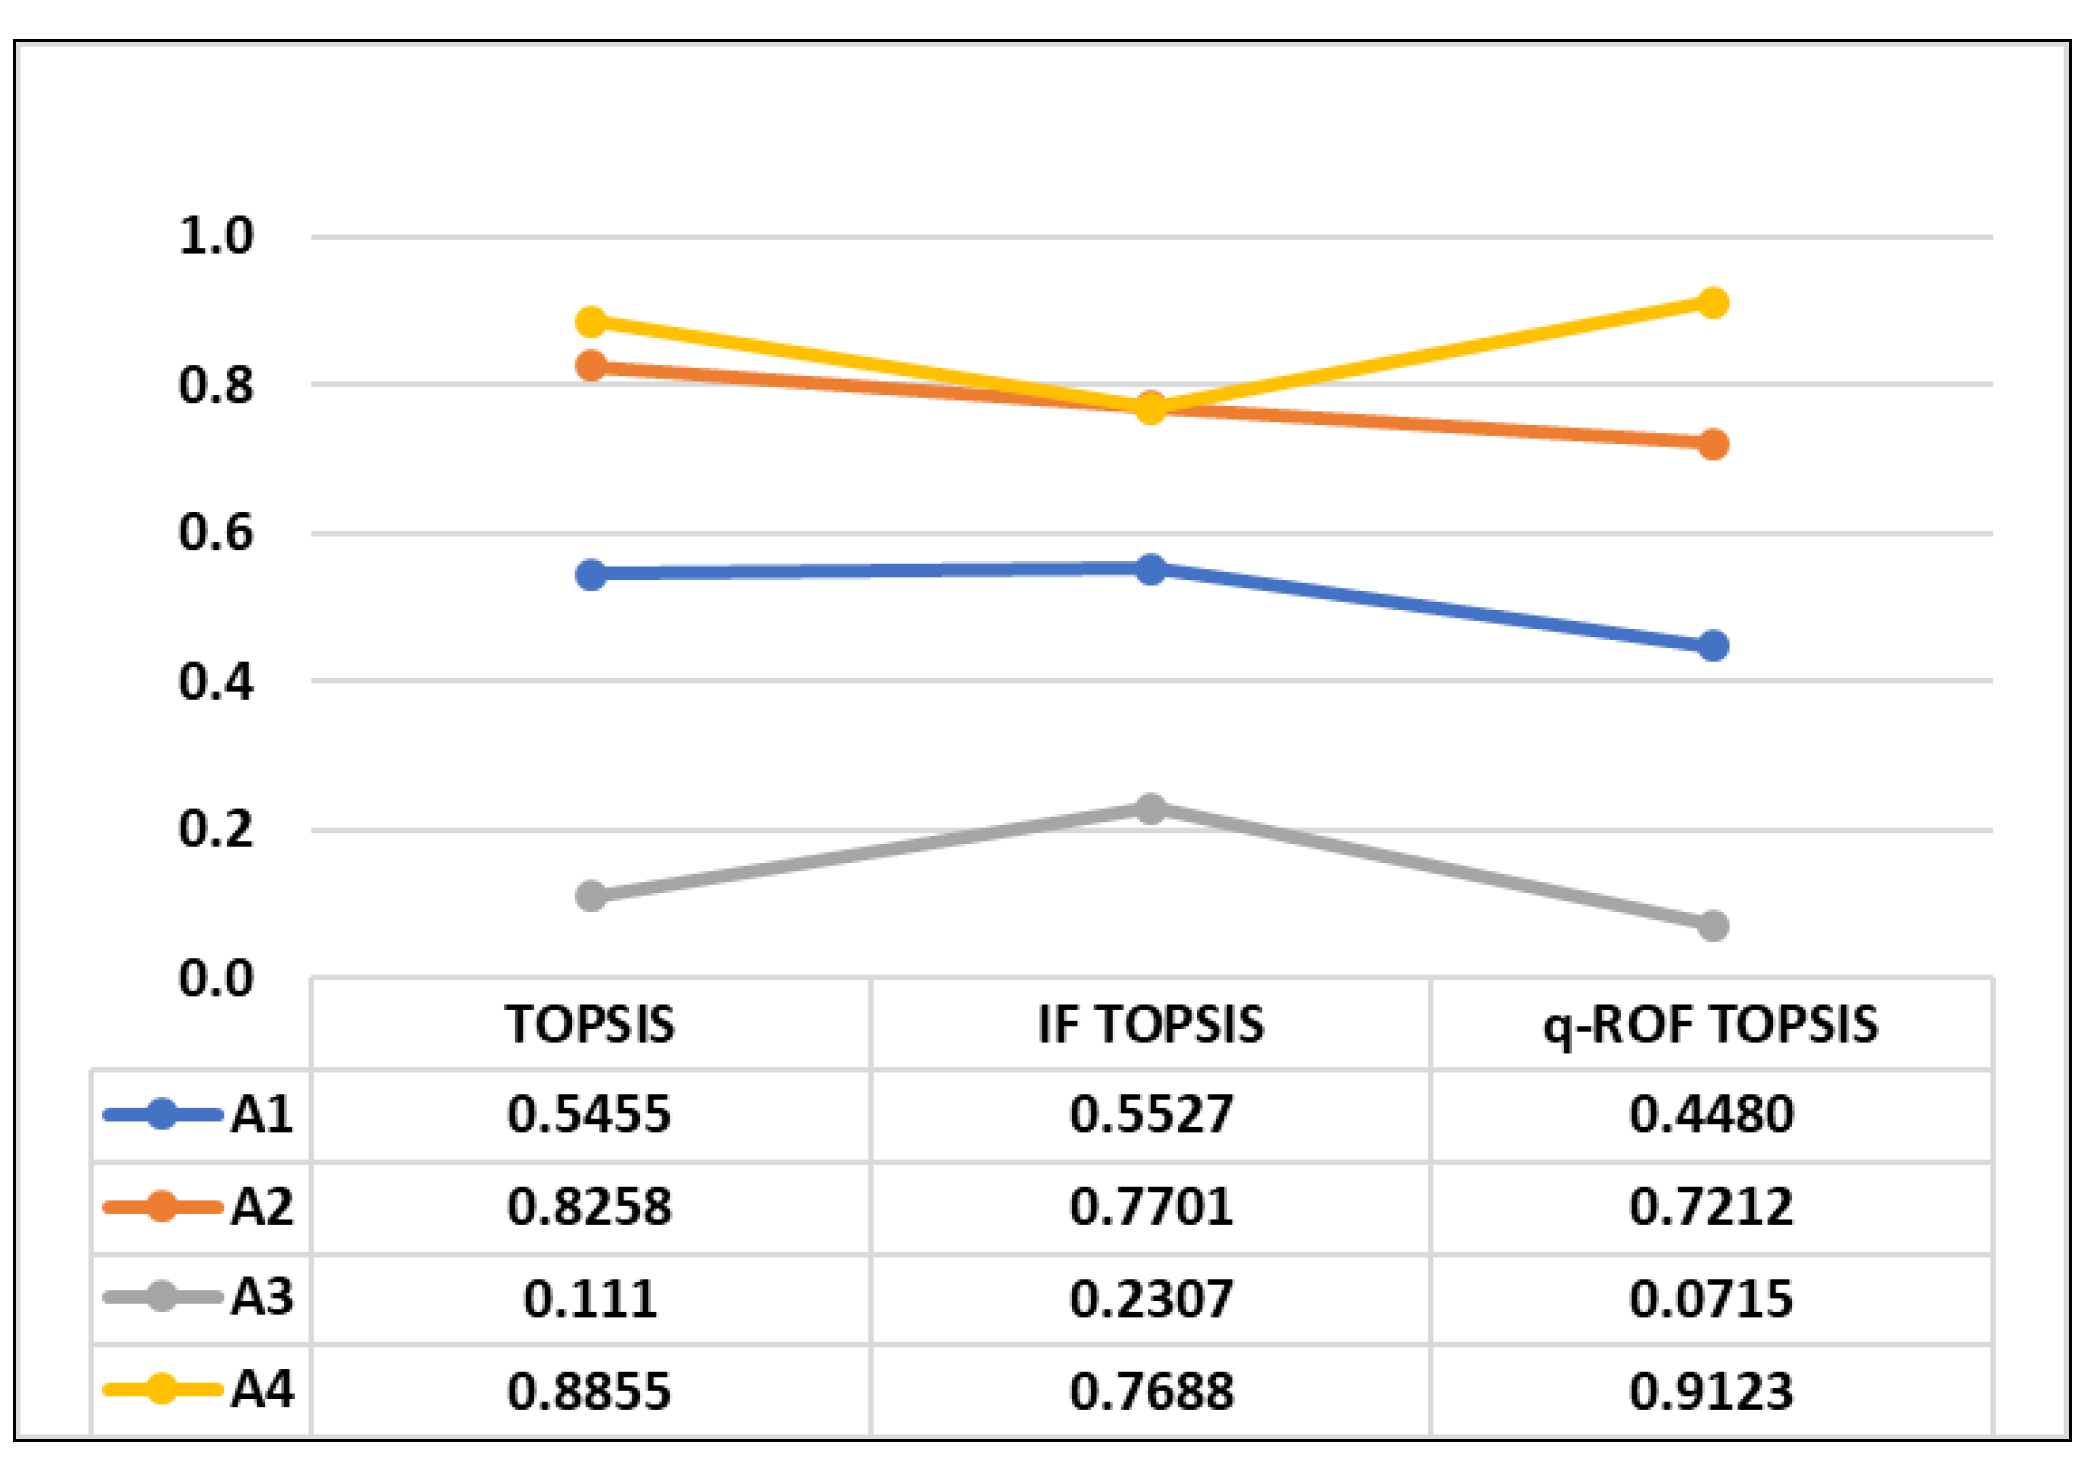
When a comparison is made between IF TOPSIS and q-ROF TOPSIS in Figure 3, it is easily seen that the proposed method discriminates all four alternatives by crystallizing the differences between the first two rankings apparent while the Rouyendegh et al.’s [5] IF TOPSIS method could not differentiate them as the first two rankings are closer and A2 > A4. Besides, given the linguistic term scale (Table 3) is more convenient than Rouyendegh et al. [5] for converting the maximum membership degree value as it is (0.95). Namely, the maximum value in the scale of Rouyendegh et al. [5] is 1.00, and if the DM ratings include even one maximum value (1.00), regardless of other values, the weighting aggregating operator makes the result maximum for that alternative because of its formula. There are many maximum values in DM evaluations of Rouyendegh et al. [5], and it affects the precision of the result negatively. As a result, the given linguistic term table resolves the weakness of the q-ROFWA operator formula.
Although there are only four suppliers, unlike IF TOPSIS, the given method is able to clearly distinguish the ratings of all alternatives. Based on q-ROF sets, linguistic terms of the proposed method express decision-makers’ evaluations to a greater extent. A nine-level linguistic term scale is used for both determination of expert and criteria weights, however, Rouyendegh et al. [5] use five- and seven-level scales successively. Finally, the results of parameter analyses show the parametric advantage of the suggested model, it is compatible with the default q level which is 3. Namely, it can be easily observed that the increase in the q level, which represents the uncertainty, does not have any negative effect on the rating of the selected supplier.
6. Conclusions
In this paper, the structure of q-ROF TOPSIS was explored as a hybrid method to green supplier selection and compared it with classical TOPSIS and IF TOPSIS methods. Due to the increasing environmental awareness and sensitivity of the customers, the manufacturers have started to make their products environmentally sensitive in order to remain competitive. Therefore, environmental awareness arises in the supply chain. Depending on the ever-increasing importance of GSCM, choosing the most suitable green supplier for companies has become critical.
q-ROF sets provide DMs more freedom of expression than other fuzzy sets to evaluate the alternatives, however, there are few MCGDM methods. Therefore, q-ROF TOPSIS method was adapted to green supplier selection, four alternatives were ranked by three DMs according to 10 criteria, including environmental criteria, and the most suitable green supplier was selected. The proposed method was compared with classical TOPSIS and IF-TOPSIS methods. According to the results, q-ROF TOPSIS methodology achieved better results than others. A parameter analysis was also conducted regarding the q level of fuzziness. The most important outcome of this study is the proposed green supplier selection method that crystallizes differences between alternatives and makes the best option apparent in a subjective environment. Moreover, the given linguistic term table remedies the drawback of the q-ROF weighting aggregating operator formula. The suggested model in this paper is parametric in terms of uncertainty and gives stable results comparing to IF TOPSIS method.
In further research, the number of alternatives and criteria can be increased, our q-ROF TOPSIS method might be compared to other green supplier selection MCDM methods, cross-country GSS case studies might be implemented with the proposed method, q-ROF can be extended to other MCDM methods, such as VIKOR, PROMETHEE, etc., and q-ROF TOPSIS might be compared with these methods.
Author Contributions
Conceptualization, A.P., B.D.R.B.E. and Y.S.Ö.; methodology, A.P., B.D.R.B.E. and Y.S.Ö.; software, A.P., B.D.R.B.E. and Y.S.Ö.; validation, A.P., B.D.R.B.E. and Y.S.Ö.; formal analysis, A.P., B.D.R.B.E. and Y.S.Ö.; investigation, A.P., B.D.R.B.E. and Y.S.Ö.; resources, A.P., B.D.R.B.E. and Y.S.Ö.; data curation, A.P., B.D.R.B.E. and Y.S.Ö.; writing—original draft preparation, A.P., B.D.R.B.E. and Y.S.Ö.; writing—review and editing, A.P., B.D.R.B.E. and Y.S.Ö.; visualization, A.P., B.D.R.B.E. and Y.S.Ö.; supervision, B.D.R.B.E.; project administration, B.D.R.B.E. All authors have read and agreed to the published version of the manuscript.
Funding
This research received no external funding.
Institutional Review Board Statement
Not applicable.
Informed Consent Statement
Not applicable.
Conflicts of Interest
The authors declare no conflict of interest. The funders had no role in the design of the study; in the collection, analyses, or interpretation of data; in the writing of the manuscript, or in the decision to publish the results.
References
- Sarkis, J.; Zhu, Q.; Lai, K.-H. An organizational theoretic review of green supply chain management literature. Int. J. Prod. Econ. 2011, 130, 1–15. [Google Scholar] [CrossRef]
- Deshmukh, A.J.; Vasudevan, H. Emerging supplier selection criterion in the context of traditional vs. green supply chain management. Int. J. Manag. Value Supply Chain. 2014, 5, 19. [Google Scholar] [CrossRef]
- Büyüközkan, G. An integrated fuzzy multi-criteria group decision-making approach for green supplier evaluation. Int. J. Prod. Res. 2012, 50, 2892–2909. [Google Scholar] [CrossRef]
- Qin, J.; Liu, X.; Pedrycz, W. An extended TODIM multi-criteria group decision making method for green supplier selection in interval type-2 fuzzy environment. Eur. J. Oper. Res. 2017, 258, 626–638. [Google Scholar] [CrossRef]
- Rouyendegh, B.D.; Yildizbasi, A.; Üstünyer, P. Intuitionistic fuzzy TOPSIS method for green supplier selection problem. Soft Comput. 2020, 24, 2215–2228. [Google Scholar] [CrossRef]
- Noci, G. Designing ‘green’vendor rating systems for the assessment of a supplier’s environmental performance. Eur. J. Purch. Supply Manag. 1997, 3, 103–114. [Google Scholar] [CrossRef]
- Handfield, R.; Walton, S.V.; Sroufe, R.; Melnyk, S.A. Applying environmental criteria to supplier assessment: A study in the application of the Analytical Hierarchy Process. Eur. J. Oper. Res. 2002, 141, 70–87. [Google Scholar] [CrossRef]
- Lu, L.Y.; Wu, C.; Kuo, T.-C. Environmental principles applicable to green supplier evaluation by using multi-objective decision analysis. Int. J. Prod. Res. 2007, 45, 4317–4331. [Google Scholar] [CrossRef]
- Chiou, C.; Hsu, C.-W.; Hwang, W. Comparative investigation on green supplier selection of the American, Japanese and Taiwanese electronics industry in China. In Proceedings of the 2008 IEEE International Conference on Industrial Engineering and Engineering Management, Singapore, 8–11 December 2008. [Google Scholar]
- Grisi, R.M.; Guerra, L.; Naviglio, G. Supplier performance evaluation for green supply chain management. In Business Performance Measurement and Management; Springer: Berlin, Germany, 2010; pp. 149–163. [Google Scholar]
- Hsu, C.-W.; Hu, A.H. Application of analytic network process on supplier selection to hazardous substance management in green supply chain management. In Proceedings of the 2007 IEEE International Conference on Industrial Engineering and Engineering Management, Singapore, 2–4 December 2007. [Google Scholar]
- Hsu, C.-W.; Hu, A.H. Applying hazardous substance management to supplier selection using analytic network process. J. Clean. Prod. 2009, 17, 255–264. [Google Scholar] [CrossRef]
- Büyüközkan, G.; Çifçi, G. A novel fuzzy multi-criteria decision framework for sustainable supplier selection with incomplete information. Comput. Ind. 2011, 62, 164–174. [Google Scholar] [CrossRef]
- Büyüközkan, G.; Çifçi, G. Evaluation of the green supply chain management practices: A fuzzy ANP approach. Prod. Plan. Control 2012, 23, 405–418. [Google Scholar] [CrossRef]
- Zhang, H.-C.; Li, J.; Merchant, M. Using fuzzy multi-agent decision-making in environmentally conscious supplier management. CIRP Ann. 2003, 52, 385–388. [Google Scholar] [CrossRef]
- Humphreys, P.; McCloskey, A.; McIvor, R.; Maguire, L.; Glackin, C. Employing dynamic fuzzy membership functions to assess environmental performance in the supplier selection process. Int. J. Prod. Res. 2006, 44, 2379–2419. [Google Scholar] [CrossRef] [Green Version]
- Vachon, S.; Klassen, R.D. Green project partnership in the supply chain: The case of the package printing industry. J. Clean. Prod. 2006, 14, 661–671. [Google Scholar] [CrossRef]
- Yang, Y.; Wu, L. Grey entropy method for green supplier selection. In Proceedings of the 2007 International Conference on Wireless Communications, Networking and Mobile Computing, Shanghai, China, 21–25 September 2007. [Google Scholar]
- Kumar, A.; Jain, V. Supplier selection: A green approach with carbon footprint monitoring. In Proceedings of the 2010 8th International Conference on Supply Chain Management and Information, Hong Kong, China, 6–9 October 2010. [Google Scholar]
- Feyzioglu, O.; Büyüközkan, G. Evaluation of green suppliers considering decision criteria dependencies. In Multiple Criteria Decision Making for Sustainable Energy and Transportation Systems; Springer: Berlin, Germany, 2010; pp. 145–154. [Google Scholar]
- Bai, C.; Sarkis, J. Green supplier development: Analytical evaluation using rough set theory. J. Clean. Prod. 2010, 18, 1200–1210. [Google Scholar] [CrossRef]
- Bin, L.; Hong-Jun, L. A research on supplier assessment indices system of green purchasing. In Proceedings of the 2010 International Conference on Measuring Technology and Mechatronics Automation, Changsha, China, 13–14 March 2010. [Google Scholar]
- Yeh, W.-C.; Chuang, M.-C. Using multi-objective genetic algorithm for partner selection in green supply chain problems. Expert Syst. Appl. 2011, 38, 4244–4253. [Google Scholar] [CrossRef]
- Humphreys, P.; McIvor, R.; Chan, F. Using case-based reasoning to evaluate supplier environmental management performance. Expert Syst. Appl. 2003, 25, 141–153. [Google Scholar] [CrossRef]
- Humphreys, P.; Wong, Y.; Chan, F. Integrating environmental criteria into the supplier selection process. J. Mater. Process. Technol. 2003, 138, 349–356. [Google Scholar] [CrossRef]
- Yan, G. Research on green suppliers’ evaluation based on AHP & genetic algorithm. In Proceedings of the 2009 International Conference on Signal Processing Systems, Singapore, 15–17 May 2009. [Google Scholar]
- Li, X.; Zhao, C. Selection of suppliers of vehicle components based on green supply chain. In Proceedings of the 2009 16th International Conference on Industrial Engineering and Engineering Management, Beijing, China, 21–23 October 2009. [Google Scholar]
- Chen, C.C.; Tseng, M.L.; Lin, Y.H.; Lin, Z.S. Implementation of green supply chain management in uncertainty. In Proceedings of the 2010 IEEE International Conference on Industrial Engineering and Engineering Management, Macao, China, 7–10 December 2010. [Google Scholar]
- Kuo, R.J.; Wang, Y.C.; Tien, F.C. Integration of artificial neural network and MADA methods for green supplier selection. J. Clean. Prod. 2010, 18, 1161–1170. [Google Scholar] [CrossRef]
- Wen, U.-P.; Chi, J. Developing green supplier selection procedure: A DEA approach. In Proceedings of the 2010 IEEE 17Th International Conference on Industrial Engineering and Engineering Management, Xiamen, China, 29–31 October 2010. [Google Scholar]
- Kuo, R.J.; Lin, Y.J. Supplier selection using analytic network process and data envelopment analysis. Int. J. Prod. Res. 2012, 50, 2852–2863. [Google Scholar] [CrossRef]
- Hashemi, S.H.; Karimi, A.; Tavana, M. An integrated green supplier selection approach with analytic network process and improved Grey relational analysis. Int. J. Prod. Econ. 2015, 159, 178–191. [Google Scholar] [CrossRef]
- Awasthi, A.; Chauhan, S.S.; Goyal, S.K. A fuzzy multicriteria approach for evaluating environmental performance of suppliers. Int. J. Prod. Econ. 2010, 126, 370–378. [Google Scholar] [CrossRef]
- Büyüközkan, G.; Çifçi, G. A novel hybrid MCDM approach based on fuzzy DEMATEL, fuzzy ANP and fuzzy TOPSIS to evaluate green suppliers. Expert Syst. Appl. 2012, 39, 3000–3011. [Google Scholar] [CrossRef]
- Banaeian, N.; Mobli, H.; Fahimnia, B.; Nielsen, I.E.; Omid, M. Green supplier selection using fuzzy group decision making methods: A case study from the agri-food industry. Comput. Oper. Res. 2018, 89, 337–347. [Google Scholar] [CrossRef]
- Javad, M.O.M.; Darvishi, M.; Javad, A.O.M. Green supplier selection for the steel industry using BWM and fuzzy TOPSIS: A case study of Khouzestan steel company. Sustain. Futures 2020, 2, 100012. [Google Scholar] [CrossRef]
- Chen, J.; Zeng, S.; Zhang, C. An OWA distance-based, single-valued neutrosophic linguistic topsis approach for green supplier evaluation and selection in low-carbon supply chains. Int. J. Environ. Res. Public Health 2018, 15, 1439. [Google Scholar] [CrossRef] [Green Version]
- Sahu, N.K.; Datta, S.; Mahapatra, S.S. Establishing green supplier appraisement platform using grey concepts. Grey Syst. Theory Appl. 2012, 2, 395–418. [Google Scholar] [CrossRef]
- Ramakrishnan, K.R.; Chakraborty, S. A cloud TOPSIS model for green supplier selection. Facta Univ. Ser. Mech. Eng. 2020, 18, 375–397. [Google Scholar]
- Cao, Q.; Wu, J.; Liang, C. An intuitionsitic fuzzy judgement matrix and TOPSIS integrated multi-criteria decision making method for green supplier selection. J. Intell. Fuzzy Syst. 2015, 28, 117–126. [Google Scholar] [CrossRef]
- Zadeh, L.A. Fuzzy sets. Inf. Control 1965, 8, 338–353. [Google Scholar] [CrossRef] [Green Version]
- Atanassov, K.T. Intuitionistic fuzzy sets. Fuzzy Sets Syst. 1986, 20, 87–96. [Google Scholar] [CrossRef]
- Yager, R.R. Pythagorean Membership Grades in Multicriteria Decision Making. IEEE Trans. Fuzzy Syst. 2013, 22, 958–965. [Google Scholar] [CrossRef]
- Yager, R.R. Generalized Orthopair Fuzzy Sets. IEEE Trans. Fuzzy Syst. 2017, 25, 1222–1230. [Google Scholar] [CrossRef]
- Yager, R.R.; Alajlan, N. Approximate reasoning with generalized orthopair fuzzy sets. Inf. Fusion 2017, 38, 65–73. [Google Scholar] [CrossRef]
- Pinar, A.; Boran, F.E. A q-rung orthopair fuzzy multi-criteria group decision making method for supplier selection based on a novel distance measure. Int. J. Mach. Learn. Cybern. 2020, 11, 1749–1780. [Google Scholar] [CrossRef]
- Wang, R.; Li, Y. A Novel Approach for Green Supplier Selection under a q-Rung Orthopair Fuzzy Environment. Symmetry 2018, 10, 687. [Google Scholar] [CrossRef] [Green Version]
- Wei, G.; Gao, H.; Wei, Y. Some q-rung orthopair fuzzy Heronian mean operators in multiple attribute decision making. Int. J. Intell. Syst. 2018, 33, 1426–1458. [Google Scholar] [CrossRef]
- Liu, P.D.; Wang, P. Some q-Rung Orthopair Fuzzy Aggregation Operators and their Applications to Multiple-Attribute Decision Making. Int. J. Intell. Syst. 2018, 33, 259–280. [Google Scholar] [CrossRef]
Figure 1.
Steps of GSS with q-ROF TOPSIS.

Figure 2.
Q Parameter analyses.

Figure 3.
Comparison among classical TOPSIS, IF TOPSIS, and q-ROF TOPSIS methods.


Table 1.
Criteria and explanations.
| Criteria | Explanation |
|---|---|
| Quality (C1) | Quality of standards, quality rejection rate, quality commitment, and quality systems. |
| Cost (C2) | Supplier costs related to production, purchase and procurement. |
| Service and Delivery (C3) | Supplier quality of service, delivery capability, flexibility for new conditions. |
| Sustainability (C4) | Sustainability for procurement procedures |
| Technology (C5) | Supplies adaptation to existing and new technologies |
| Green Manufacturing System (C6) | Supplier respect for environmental issues, such as hazardous and recyclable packaging during production. |
| Green Supplier Image (C7) | Green customers rate, the capability of green purchasing, environmental responsibilities. |
| Cooperation (C8) | Compatibility, flexibility, and trust. |
| Green Application (C9) | Responsibility for environmental issues, such as disposal, recycling, and reusing products, minimum carbon emission, energy and water consumption, etc. |
| Environmental Management and Control (C10) | Dealing with environmental policies, plans, environmental management system, international certifications like ISO 14.000,14.001, etc. |
Table 2.
Supplier names and properties.
| Supplier Name | Region | Employees | Exportation |
|---|---|---|---|
| Supplier A (A1) | Marmara/Turkey | 200–500 | Exports to 4 countries |
| Supplier B (A2) | Marmara/Turkey | 200–500 | Exports to 4 countries |
| Supplier C (A3) | Central Anatolia/Turkey | 200–500 | - |
| Supplier D (A4) | Marmara/Turkey | 200–500 | Exports to 6 countries, such as Russia, Germany, Italy, and Spain. |
Table 3.
Linguistic terms for ratings.
| Linguistic Terms | ||
|---|---|---|
| Extremely high (EH) | 0.95 | 0.15 |
| Very high (VH) | 0.85 | 0.25 |
| High (H) | 0.75 | 0.35 |
| Medium high (MH) | 0.65 | 0.45 |
| Medium (M) | 0.55 | 0.55 |
| Medium low (ML) | 0.45 | 0.65 |
| Low (L) | 0.35 | 0.75 |
| Very low (VL) | 0.25 | 0.85 |
| Extremely low (EL) | 0.15 | 0.95 |
Table 4.
Decision-maker ratings of four alternative companies.
| DM1 | DM2 | DM3 | ||||||||||
|---|---|---|---|---|---|---|---|---|---|---|---|---|
| Criteria/Alt. | A1 | A2 | A3 | A4 | A1 | A2 | A3 | A4 | A1 | A2 | A3 | A4 |
| C1 | VH | VH | H | EH | H | EH | VH | EH | H | VH | H | EH |
| C2 | VH | EH | H | VH | VH | VH | H | EH | VH | EH | H | EH |
| C3 | H | VH | H | VH | VH | VH | M | VH | VH | VH | ML | H |
| C4 | H | VH | M | EH | M | EH | VL | EH | H | VH | M | VH |
| C5 | M | VH | ML | VH | H | VH | ML | EH | H | EH | VL | EH |
| C6 | H | VH | VL | EH | VH | VH | M | VH | M | VH | ML | VH |
| C7 | M | H | VL | VH | H | VH | M | VH | M | VH | H | EH |
| C8 | EH | VH | VH | EH | VH | EH | VH | H | EH | H | EH | VH |
| C9 | H | VH | EL | EH | M | H | M | VH | VH | VH | M | EH |
| C10 | VH | EH | VH | EH | VH | VH | VH | EH | EH | EH | VH | EH |
Table 5.
q-ROF Aggregated Decision Matrix.
| C1 | C2 | C3 | C4 | C5 | C6 | C7 | C8 | C9 | C10 | |
|---|---|---|---|---|---|---|---|---|---|---|
| A1 | [0.802; 0.302; 0.770] | [0.850; 0.250; 0.718] | [0.814; 0.290; 0.758] | [0.704; 0.406; 0.836] | [0.685; 0.427; 0.844] | [0.765; 0.349; 0.799] | [0.638; 0.475; 0.859] | [0.929; 0.177; 0.577] | [0.742; 0.375; 0.814] | [0.886; 0.222; 0.665] |
| A2 | [0.897; 0.212; 0.646] | [0.929; 0.177; 0.577] | [0.850; 0.250; 0.718] | [0.897; 0.212; 0.646] | [0.886; 0.222; 0.665] | [0.850; 0.250; 0.718] | [0.814; 0.290; 0.758] | [0.885; 0.229; 0.666] | [0.824; 0.279; 0.748] | [0.929; 0.177; 0.577] |
| A3 | [0.790; 0.314; 0.781] | [0.750; 0.350; 0.812] | [0.650; 0.469; 0.853] | [0.493; 0.634; 0.855] | [0.420; 0.693; 0.841] | [0.440; 0.692; 0.836] | [0.562; 0.598; 0.847] | [0.886; 0.222; 0.665] | [0.462; 0.699; 0.824] | [0.850; 0.250; 0.718] |
| A4 | [0.950; 0.150; 0.518] | [0.920; 0.188; 0.598] | [0.832; 0.271; 0.740] | [0.936; 0.169; 0.560] | [0.920; 0.188; 0.598] | [0.909; 0.200; 0.623] | [0.886; 0.222; 0.665] | [0.894; 0.223; 0.649] | [0.929; 0.177; 0.577] | [0.950; 0.150; 0.518] |
Table 6.
Importance weights of criteria in linguistic terms.
| Criteria | DM1 | DM2 | DM3 |
|---|---|---|---|
| C1 | EH | H | H |
| C2 | H | M | H |
| C3 | MH | M | L |
| C4 | H | EH | H |
| C5 | M | L | EH |
| C6 | H | H | EH |
| C7 | M | H | L |
| C8 | L | L | M |
| C9 | H | EH | M |
| C10 | H | H | H |
Table 7.
Weights of criteria.
| Criteria | Weights |
|---|---|
| C1 | 0.1269 |
| C2 | 0.1004 |
| C3 | 0.0792 |
| C4 | 0.1227 |
| C5 | 0.0862 |
| C6 | 0.1193 |
| C7 | 0.0827 |
| C8 | 0.0568 |
| C9 | 0.1155 |
| C10 | 0.1103 |
Table 8.
q-ROF Aggregated Weighted Decision Matrix.
| C1 | C2 | C3 | C4 | C5 | C6 | C7 | C8 | C9 | C10 | |
|---|---|---|---|---|---|---|---|---|---|---|
| A1 | [0.445; 0.859; 0.653] | [0.450; 0.870; 0.630] | [0.391; 0.906; 0.580] | [0.371; 0.895; 0.614] | [0.320; 0.929; 0.548] | [0.409; 0.882; 0.626] | [0.291; 0.940; 0.524] | [0.445; 0.906; 0.551] | [0.389; 0.893; 0.612] | [0.497; 0.847; 0.646] |
| A2 | [0.531; 0.821; 0.667] | [0.532; 0.840; 0.635] | [0.417; 0.896; 0.593] | [0.525; 0.827; 0.662] | [0.460; 0.878; 0.609] | [0.475; 0.848; 0.657] | [0.396; 0.903; 0.587] | [0.402; 0.920; 0.540] | [0.449; 0.863; 0.644] | [0.547; 0.826; 0.648] |
| A3 | [0.436; 0.863; 0.650] | [0.377; 0.900; 0.601] | [0.293; 0.942; 0.518] | [0.250; 0.946; 0.518] | [0.188; 0.969; 0.438] | [0.219; 0.957; 0.483] | [0.252; 0.958; 0.470] | [0.403; 0.918; 0.544] | [0.228; 0.959; 0.472] | [0.464; 0.858; 0.645] |
| A4 | [0.603; 0.786; 0.666] | [0.520; 0.845; 0.634] | [0.403; 0.902; 0.586] | [0.574; 0.804; 0.662] | [0.496; 0.866; 0.612] | [0.534; 0.825; 0.658] | [0.454; 0.883; 0.602] | [0.410; 0.918; 0.539] | [0.555; 0.819; 0.654] | [0.578; 0.811; 0.649] |
Table 9.
Positive Ideal Solution Values.
| Criteria | μ v π |
|---|---|
| C1 | [0.6028;0.7860;0.6660] |
| C2 | [0.3769;0.9000;0.6015] |
| C3 | [0.4173;0.8960;0.5926] |
| C4 | [0.5743;0.8042;0.6622] |
| C5 | [0.4963;0.8656;0.6119] |
| C6 | [0.5343;0.8253;0.6583] |
| C7 | [0.4539;0.8828;0.6022] |
| C8 | [0.4450;0.9063;0.5511] |
| C9 | [0.5550;0.8188;0.6543] |
| C10 | [0.5782;0.8112;0.6486] |
Table 10.
Negative Ideal Solution Values.
| Criteria | μ v π |
|---|---|
| C1 | [0.4356;0.8632;0.6497] |
| C2 | [0.5318;0.8405;0.6349] |
| C3 | [0.2931;0.9418;0.5185] |
| C4 | [0.2496;0.9456;0.5179] |
| C5 | [0.1875;0.9688;0.4381] |
| C6 | [0.2192;0.9571;0.4831] |
| C7 | [0.2522;0.9584;0.4697] |
| C8 | [0.4019;0.9197;0.5397] |
| C9 | [0.2284;0.9594;0.4716] |
| C10 | [0.4637;0.8582;0.6449] |
Table 11.
Separation measures between the alternatives and the final result.
| Alternatives | |||
|---|---|---|---|
| A1 | 0.0688 | 0.0558 | 0.4480 |
| A2 | 0.0347 | 0.0899 | 0.7212 |
| A3 | 0.1157 | 0.0089 | 0.0715 |
| A4 | 0.0109 | 0.1137 | 0.9123 |
Publisher’s Note: MDPI stays neutral with regard to jurisdictional claims in published maps and institutional affiliations. |
© 2021 by the authors. Licensee MDPI, Basel, Switzerland. This article is an open access article distributed under the terms and conditions of the Creative Commons Attribution (CC BY) license (http://creativecommons.org/licenses/by/4.0/).
Share and Cite
MDPI and ACS Style
Pınar, A.; Babak Daneshvar, R.; Özdemir, Y.S. q-Rung Orthopair Fuzzy TOPSIS Method for Green Supplier Selection Problem. Sustainability 2021, 13, 985. https://0-doi-org.brum.beds.ac.uk/10.3390/su13020985
AMA Style
Pınar A, Babak Daneshvar R, Özdemir YS. q-Rung Orthopair Fuzzy TOPSIS Method for Green Supplier Selection Problem. Sustainability. 2021; 13(2):985. https://0-doi-org.brum.beds.ac.uk/10.3390/su13020985
Chicago/Turabian StylePınar, Adem, Rouyendegh Babak Daneshvar, and Yavuz Selim Özdemir. 2021. "q-Rung Orthopair Fuzzy TOPSIS Method for Green Supplier Selection Problem" Sustainability 13, no. 2: 985. https://0-doi-org.brum.beds.ac.uk/10.3390/su13020985
Note that from the first issue of 2016, this journal uses article numbers instead of page numbers. See further details here.