Article

Assessing the Performance of Modal Interchange for Ensuring Seamless and Sustainable Mobility in European Cities

by
Elisa Conticelli
*,
Gianluca Gobbi
,
Paula Isabella Saavedra Rosas
and
Simona Tondelli
Department of Architecture, University of Bologna, 40136 Bologna, Italy
*
Author to whom correspondence should be addressed.
Sustainability 2021, 13(2), 1001; https://0-doi-org.brum.beds.ac.uk/10.3390/su13021001
Submission received: 28 December 2020 / Revised: 13 January 2021 / Accepted: 15 January 2021 / Published: 19 January 2021
(This article belongs to the Special Issue Urban Transport Sustainability)

Abstract

:
In the European Union, more than 70% of the population lives in urban areas. Achieving more efficient and low-carbon mobility is crucial to ensuring urban systems are sustainable and tackling important challenges, such as reduction of CO2 emissions, air and noise pollution, and traffic congestion. Identifying effective strategies and design solutions that boost multimodal mobility and effective interchange among different sustainable means of transport can be a significant contribution in this area. This paper presents an easy-to-use methodology to assess the performance of policy measures and design solutions-oriented to foster modal interchange, with special regard to the configuration of the interchange hubs. The methodology is based on identifying key factors necessary to ensure an efficient multimodal interchange and the different types of interchanges that are frequently present in the urban realm. By grouping the key factors into nine different domains, and by weighing the key factors in relation to their importance, the methodology creates a decision support system to assess the performance of the current interchange, as well as of different planning and design scenarios. This methodology has been developed in the framework of the Interreg Europe MATCH-UP project and is conceived to support both designers and decision-makers whenever they have to reorganise existing transport hubs and policies, or design and plan new ones.

1. Introduction

The constant rise of the global population, its concentration in urban areas and the massive use of private cars have been increasing traffic congestion and its adverse consequences on the environment and on human health, posing a big challenge to urban and metropolitan contexts.
It is estimated that traffic flows will reach about 64% of all the travels made around the world [1], while cars are currently generating around 12% of total CO2 emissions in Europe [2] which are the main cause of the global warming. Furthermore, traffic pollution is responsible for great damages to human health: In 2016, premature deaths, due to air particulate were around 4.2 million worldwide [3], of which about 500,000 in Europe [4]. Traffic also has important economic implications in terms of loss of efficiency of the productive system. On average, the economic losses, due to traffic congestion are estimated at around 1% of the EU’s GDP annually [5].
To revert this trend, a shift towards more sustainable and inclusive mobility is clearly recognised as a global target. Indeed, the UN-Habitat New Urban Agenda [6] asks for the promotion and prioritisation of public and non-motorised transport, to reduce congestion and pollution, while improving efficiency, connectivity, accessibility for all, health, and quality of life, thus stressing the role of public and shared transport, as well as of walking and cycling as sustainable means of transport.
To make the shift towards more sustainable means of transport effective for reducing traffic congestion, pollution, and GHG emissions, walking, cycling and public transport should be better interconnected. This means to promote intermodality, i.e., the use of different sustainable means of transport optimally combined to ensure a seamless journey [7,8], thus contributing to reduce traffic and to free public spaces previously occupied by cars.
The importance to have more interconnected means of transport is recognised worldwide. In the US, the National Centre of Intermodal Transportations (NCIT) has been pushing towards a national intermodal system [9], while in China there is a strong commitment in introducing more interconnected transport systems by defining proper planning and design criteria for building new stations or adapting the existing ones [10]. In Europe, there is a clear political commitment for promoting multimodal and interconnected transport [11]. Indeed, the European Commission considers transport efficiency a policy priority for reducing CO2 emission; it can be obtained not only by improving infrastructures and shifting passengers to modes with lower carbon emissions, but also by enabling passengers to plan door-to-door multimodal trips [12]. On the same vein are the most relevant European policy documents on transport: The Action Plan on Urban Mobility [13] and the White paper on transport policies [14] stress the need of ensuring greater integration, interoperability, and interconnection of transport networks, while the ELTIS guidelines [15] for developing Sustainable Urban Mobility Plans consider intermodality as a key topic for more sustainable cities. Modal interchange and multimodality are also promoted by the Europe 2020 strategy [16], which encourages to focus on smart and interconnected transport as key elements for supporting EU economic growth. More recently, also the Commission Communication “Sustainable and Smart Mobility Strategy—putting European transport on track for the future” [17] emphasises the role of multimodal transport for increasing the efficiency of the transport systems and boost the EU sustainable growth, while the EU Green Deal Strategy states the need to move towards multimodality by strengthening the concept of Mobility as a Service [18]. The Commission Staff Working Document Evaluation of the White Paper [19] released in December 2020 includes multimodality among the key measures to reach the main objectives of the White Paper, together with decarbonisation, digitalisation, deployment of alternative fuels, concepts for sustainable urban mobility, social issues. Therefore, it is essential that planning policies and design decisions are clearly oriented to promote seamless journeys by strengthening the connection among transport services and infrastructures, to create an interconnected and reliable mobility system that is easily accessible by people.
Several policy measures have been proposed for promoting multimodal transportation, mainly by disincentivising private vehicle usage and promoting public transport and active mobility [20], while many research projects and initiatives have been led to foster modal interchange in the European context [21]. Moreover, the role of technological enablers for enhancing multimodal transport (e.g., ICT-enabled web, mobile, and big data applications) has been largely investigated, underlining the interest of research in this field [22,23,24].
Despite these attempts, the predominant use of private cars is still high, especially in those trips that are not well covered by public transport [25]. Therefore, specific measures and tools for improving the interchange between services by designing urban spaces suitable for easy interchange are still needed [26,27]. To be competitive towards the use of private motorised vehicles, multimodal mobility necessarily has to be reliable, safe and comfortable, while ensuring more flexibility in the user’s daily travel, giving particular attention to the interchanges, which are the places where people can change between public and private transport, which is the user’s least appreciated part of the trip [28], as well as between and within public transport modes [29], where the possibility to ensure direct journeys is limited, therefore an interchange between different transport services is strongly needed [27]. Besides, it is necessary to enable policymakers to consider multimodal mobility comprehensively, thus enabling to keep sectorial transport and urban policies together, as well as planning and design decisions.
Starting from these assumptions, this paper presents the results of the Interreg Europe MATCH-UP project, which aims at boosting an effective modal interchange among different low-carbon means of transport by identifying and exchanging Good Practices of modal interchange among different territories, with a special focus on interchange hubs. Notably, the project addresses the transport hubs as the places where people change from one means to the other, considering both those features that can be influenced at the policy level, by favouring a better integration between sectorial planning decisions for managing and coordinating the interchange among transport modes and services, as well as its design characteristics. Beyond considering the tangible (design) and immaterial (policies and technologies) influence of interchangeable on the user’s experience of travel, the project also addresses the level of integration of the transport node within the urban realm, considering the hub at the same time as transport node and as an urban place [30,31].
To this aim, a methodology has been defined to assess the performance of the modal interchange that happens in urban interchanges, with the aim to assist decision-makers and designers in comparing different planning and design scenarios, and thus, selecting the most promising ones. The main structural elements of the methodology refer to identifying different types of an urban interchange and the most relevant factors influencing its performance against nine specific dimensions, affecting both the policy and design level.
The first step of the methodology is identifying the main types of interchange hubs that occur in the urban realm (primary stations, secondary stations, metropolitan stations, outskirt park and ride interchanges), which should allow different connections among means and between the means and the urban context and need diversified facilities and services according to their importance. Secondly, it considers the key design and planning factors that enable an effective modal interchange in the transport hubs. These factors are grouped into nine different interchange dimensions, which are detailed with reference both to policy and design levels. Each identified key factor is then weighted according to its importance in comparison with other factors and in relation to the interchange rank. A result is an easy-to-use tool through which the user can assess and compare different project or policy scenarios against their effectiveness in supporting modal interchange among low carbon means of transport.
The article is organised as follows: In the first section, different types of transport interchange are identified and described, while in the second section, the key factors for a seamless interchange are introduced and discussed. The third section describes the proposed methodology, explaining the functioning based on the weights given to the different key factors, in relation to the interchange importance and the two decision levels (policy or design). Finally, the main results and findings are discussed.

2. Interchanges in the Urban Environment

An interchange node can be generally defined as a place where two or more means of transport interconnect. It is possible to identify a considerable number of interchange hubs, ranging from the airports, concerning mainly long-distance and intercontinental travels, to the main railway stations, hosting long-distance high-speed train services, and hubs hosting transport services for shorter trips, at the urban or regional level.
The scientific discussion mainly focuses on public transport interchanges [9,32,33], i.e., places where at least two means of public transport are present, thus avoiding park and ride facilities, where only one type of public transport is involved. Given the importance of the urban dimension and the focus on the urban realm, in this research we decided to focus on those interchanges that are usually present in urban areas, thus avoiding airport interchanges—that are normally located outside the urban context—and by including park and ride interchanges. This allows the research findings to address not only big cities, but also medium-size ones, where approximately 70% of the world’s population live [34] and can benefit from interconnected transport systems.
Transport interchanges can be classified in different ways. One way is to classify the interchanges by considering the two main transport modes involved, thus concentrating on two means at a time [9]. Typical transport interchanges identified through this method are: Airport/railway, railway/bus, coach/car interchanges. Another way focuses on the main transport means that characterise the hub [32], by identifying specific parameters for the categorisation, such as location, level of daily demand (passengers/day), catchment area that the hub is able to attract, types of transport modes that need to be catered and services provided. A typical example of this classification has been applied in the research concerning the railway stations [10,27,31,35,36]. An additional, but less specific, way of classifying the interchanges relate only to the location and importance of the hub in the territory, by considering categories, such as: Hubs within the urban centres, suburban hubs, regional centres and public transport stops [37]. In this research, we propose a classification that first considers of all those interchange hubs that are present in urban areas. Secondly, we identify four categories based on the importance of the means of transport involved, represented by the distances covered by those means of transport, their catchment areas and their commercial speed, and the daily frequentation of the hub (Table 1).
Category A includes primary interchange nodes identifiable by the high-speed train stations that host high-speed and intercity train services, ensuring long-distance connections. These hubs are frequently connected with a bus station and with other important transport services, such as regional and local railway transport, as well as the peri-urban and urban public transport. Finally, many other means that usually serve the city locally, such as sharing services, taxis, and bikes, are frequently present near these hubs, needing dedicated spaces and proper connections. Taxis need dedicated parking areas to pick up the passengers and well-structured facilities for bicycles are needed, such as bicycle racks, but also guarded bike parks. The bike- and car-sharing systems can complete the panorama of possible means of transport connected to the others in the immediate surroundings of these hubs through specific access points or parking zones. The interchanges belonging to category A have the highest importance and consequently require the highest level of services.
Category B is in most of the cases identifiable with the main railway station of capital cities and differs from the previous one for the lower importance of the railway connections, which are characterised by intercity and interregional trains or long-distance coaches, especially when the railway services are not present. Category B interchanges also present a reduced supply of services and facilities with respect to category A.
Category C refers to the interchanges of urban mass transit, such as metro, subways, or Bus Rapid Transit (BRT). They are basically the smallest stations, but can ensure a certain number of interconnections with short-distance urban transport. These means are then fundamental in high-density cities, having high capacity and commercial speed, but a limited number of stops to grant the speediness of the service. Therefore, complementary transport facilities are necessary to cover the first/last mile of the trip. The Category C interchanges ensure a lower level of services for passengers than the previous categories, considering the high frequency of the transit that implies less waiting time.
Finally, the Category D directly involves the park and ride interchanges, parking lots usually located in the city outskirts, which are mainly dedicated to shifting from car to public transport or shared means. They are mainly used by people coming by car from the suburbs or nearby towns which are far from the major public transport connections. They can leave their car and reach the city centre by using public transport, avoiding increasing congestion and air and noise pollution in the central part of the city. Also, in these interchanges, a minimum level of services is required.
The identification of the different types of node is fundamental for identifying different types of facilities and service levels that are requested for ensuring an effective interchange at the design level and then for assessing the presence of those services and facilities in specific situations.

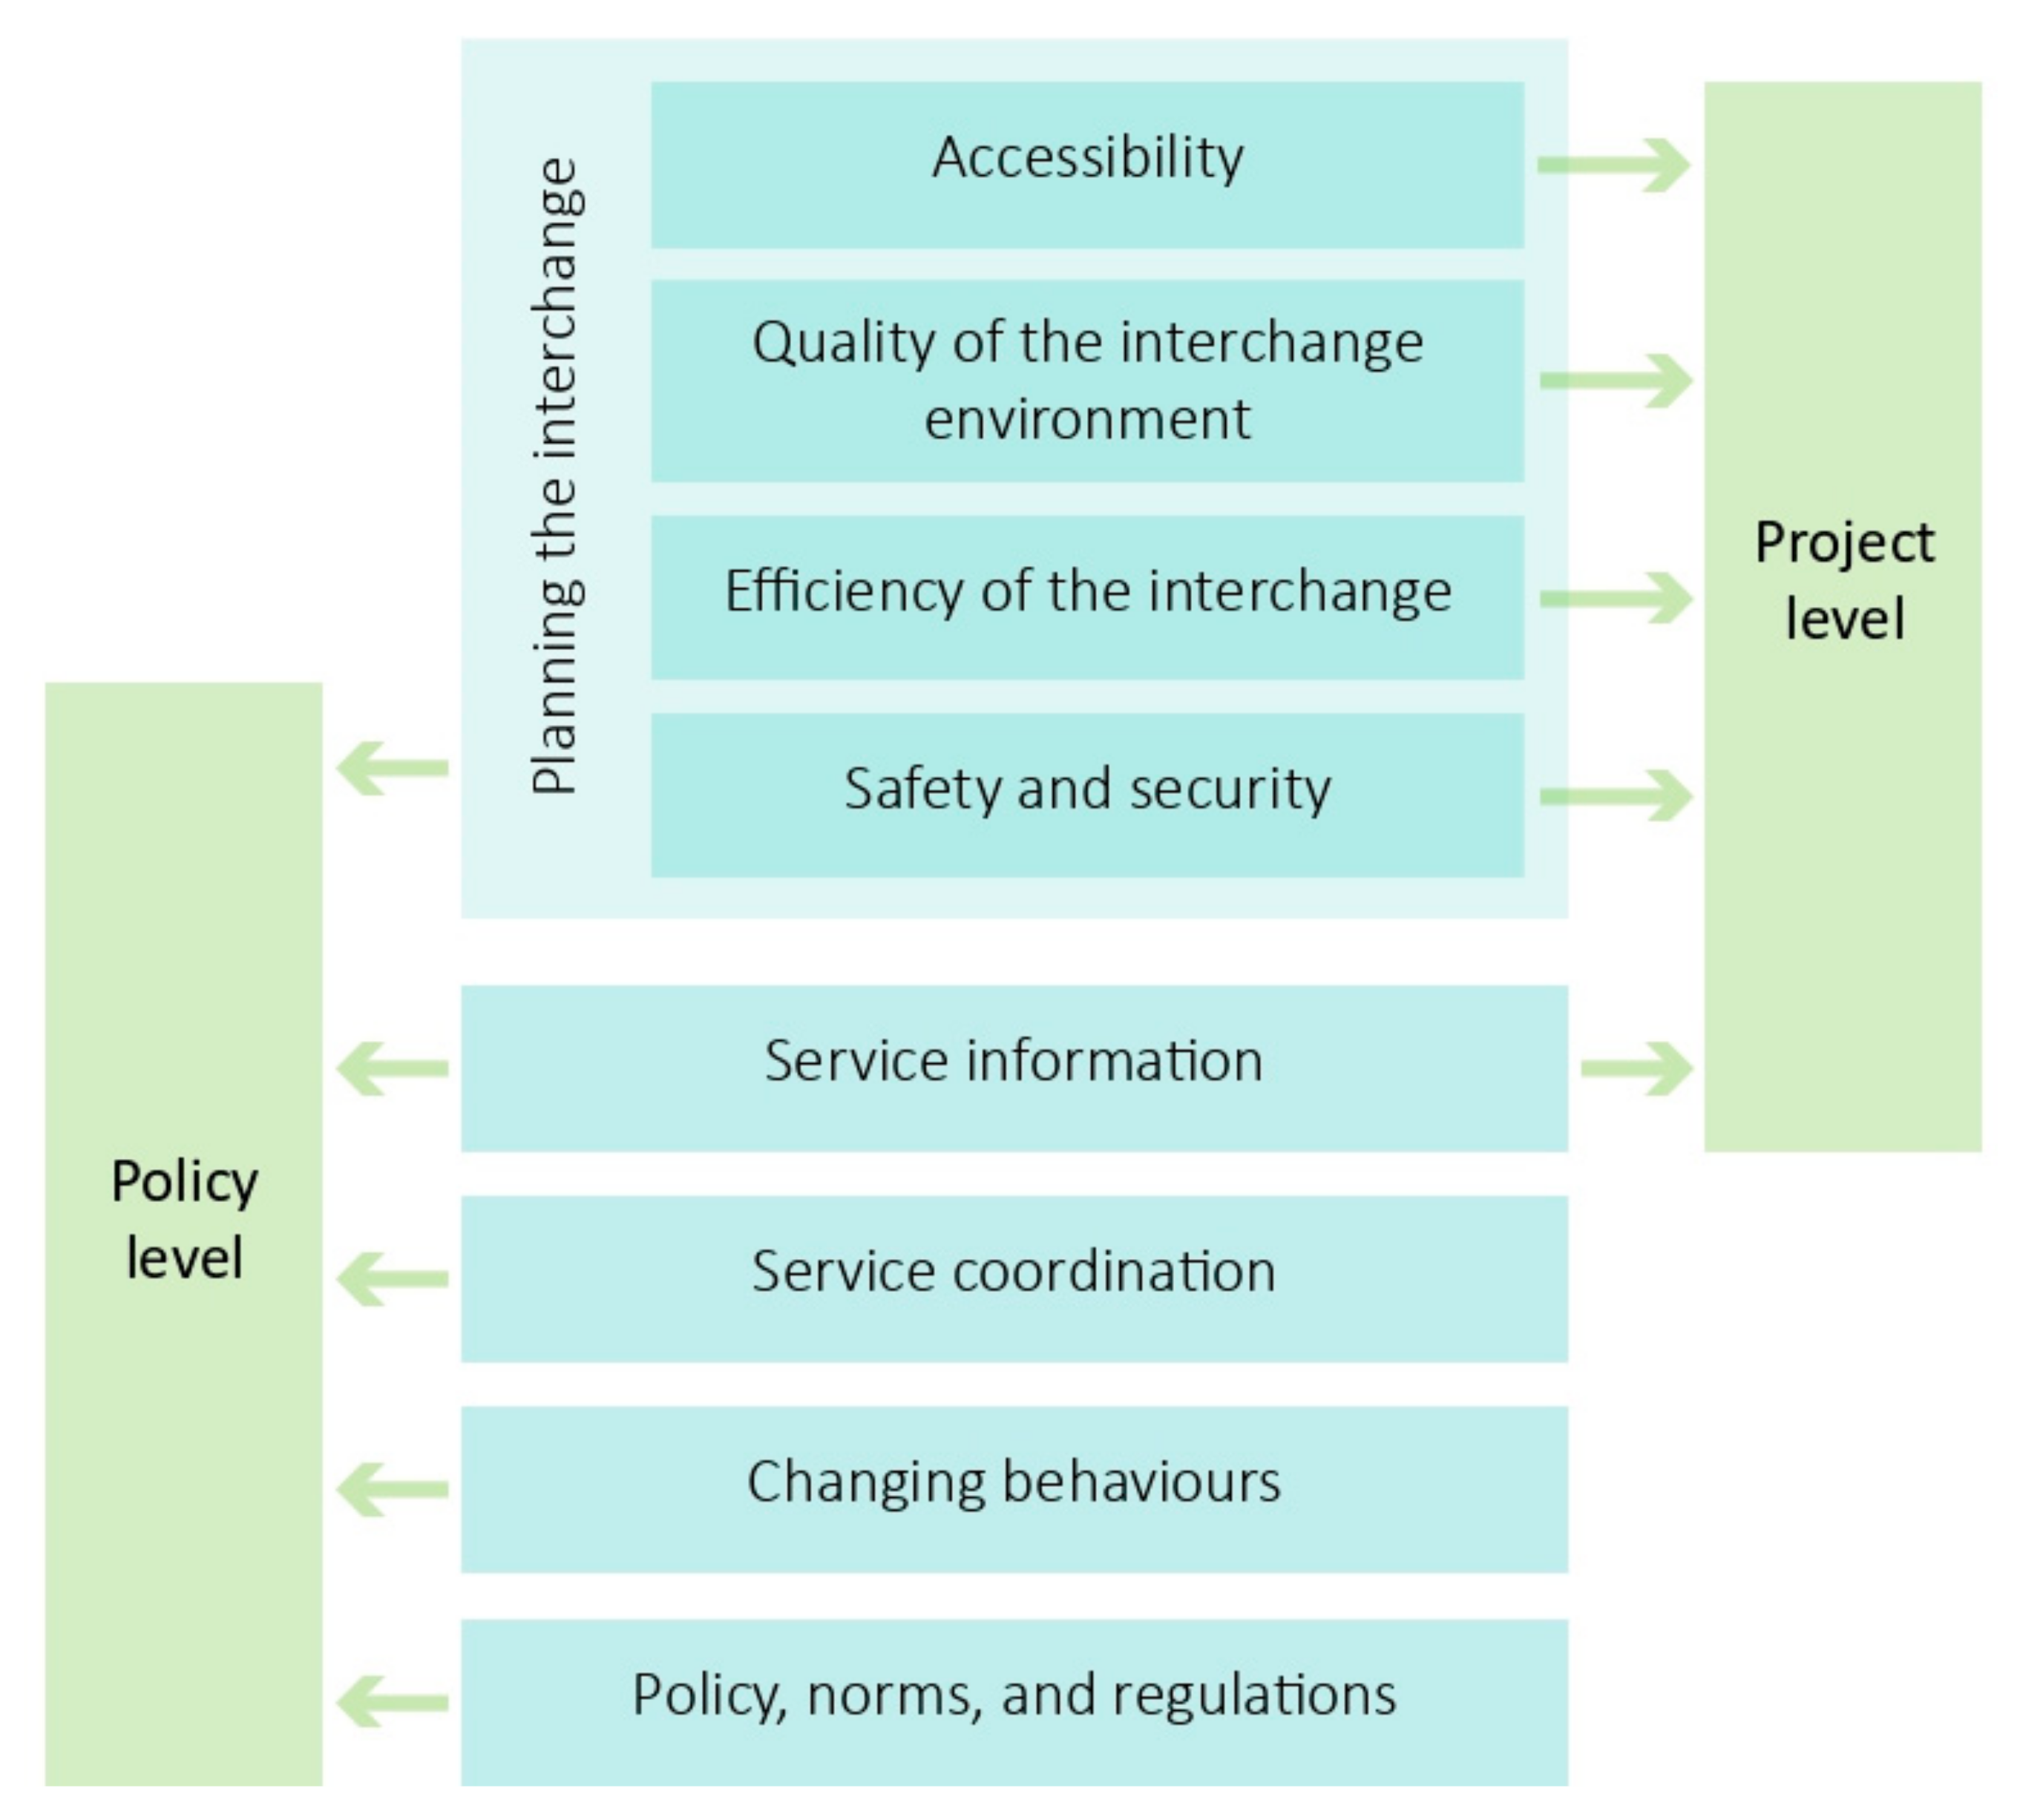
3. Key Factors for Seamless Interchanges

The physical and functional design of the interchange hub has a crucial role in assuring an effective interchange. Hernandez and Monzon [38] analyse several studies concerning transport interchanges, highlighting different dimensions that should be taken into account, not only related to the efficiency of the transport connections, but also to the urban and perceived dimensions that play a crucial role in attracting users and in increasing the quality of time spent within the interchanges. They reveal that accessibility, information provision, safety and security and comfort are the most frequent factors affecting the quality of the interchange, followed by layout, internal connections, ease of movement, waiting for areas and services, and facilities. This topic has been addressed by reports and manuals issued by major cities and institutions, such as the Asian Development Bank [39] and the City of London [40], as well as by several research projects, such as the FP7 City-HUB and FP7 NODES.
Moreover, modal interchange could be affected by other measures that refer not only to the local scale, but rather to the policy level. Well-coordinated transport services, as well as tailored norms and regulations for good management and design of the interchange [41], can optimise the travel experience of users [42], influencing the performance at the local level, while policies oriented to change people’s behaviour towards more sustainable and multimodal mobility can produce interesting results with low investments.
Within this framework, MATCH-UP project investigates both policy and project-oriented aspects affecting the interchange, starting from the analysis of 15 Good Practices of modal interchange collected within the four territories involved in the project. The Good Practices involve low carbon means of transport and affect both the local scale and the policy level.
Within the framework of MATCH-UP project, the good practices have been analysed and discussed by the project partners and their relevant stakeholders operating in the mobility sector to identify first of all the domains that mostly describe the nature and performance of the interchange, with regards both to policy measures and node features, and consequently the main key factors (KFs) within each domain that influence the reliability and efficiency of the interchange. In our research, a KF is intended as a design or a policy feature of a certain domain that can influence the performance of the interchange. Basing on the results of this discussion and taking into account the above-mentioned studies, the research has finalised the identification of the KFs that should be considered for assessing the performance of the policies and the hubs’ design.
Totally, a set of 52 KFs has been selected; they have been clustered into the following nine main domains that characterise the interchange:
  • Accessibility
  • Quality of the Interchange Environment
  • Safety and Security
  • Efficiency of the Interchange
  • Planning the Interchange
  • Service Information
  • Service Coordination
  • Initiatives Intended to Change Citizens’ Behaviours
  • Policies, Norms and Regulations
These domains can affect differently the policy and project levels. While Service Information is equally relevant for both the policy and project levels, even if with specific facets, Accessibility, Quality of the Interchange Environment, Safety and Security, and Efficiency of the Interchange can be influenced mostly at the project level, being related with the specific features that characterise the hub spaces and organisation. These four domains are particularly relevant in those planning measures that aim to integrate the transport and the urban role of the hub. Therefore, they have also been considered as simple KFs within the Planning the Interchange domain, which is relevant at the planning level and comprises all the aspects that encourage better integration between transport and planning policies affecting the hub too. Instead, Service Coordination, Initiatives Intended to Change Citizens’ Behaviours, and Policies, Norms and Regulations are less influenced by the interchange hub’s configuration, but can have a big role at the policy level (see Figure 1).
Moreover, the KFs considered within the policy level domains refer mainly to policy goals that we can find within urban and transport policies oriented to promote multimodal transport, while the other KFs refer mainly to design features, characterising the interchanges.
In the following paragraphs, the nine different domains are described, together with the related KFs that have been put at the basis of the assessment methodology developed.

3.1. Accessibility

This category is recognised as highly crucial for ensuring an effective and reliable interchange [10,38,40,42,43,44,45]. It considers a broad spectrum of factors that ease the accessibility of the interchange nodes, ranging from the embedment of the universal design principles in the hub’s space configuration to the presence of different transit access points and to the quality and quantity of nearby pedestrian paths and cycle lanes.
The universal design principle applied in transportation is aimed at creating accessible and inclusive infrastructures, providing the same opportunities to all, avoiding discrimination in access, and ensuring social integration [46]. Notably, it focuses on designing more accessible spaces for all means, on ensure high-quality spaces in every condition and for every ability, being permanent or temporary. Additional facilities, as the presence of dedicated staff and services helping people to get assistance for moving inside the node, are recommended in the main transport hubs (cat. A,B) where distances and path complexity are high.
High levels of pedestrian accessibility should be present not only within the transport hubs, but also in their urban surroundings, linking the different transport access points together and with the city pedestrian network. It is important to consider that, in every type of hub, walking is always present as a means of transport and a privileged option for actually moving from a means to another and within the hub spaces. This micro-mobility is crucial for ensuring an effective interchange [47] inside the node and in the immediate surroundings; therefore, it should be taken into high consideration, as well as the physical space where the interchange should happen, by reducing unsafe situations mainly in road crossings or by decreasing physical and visual barriers.
Similarly, the hub design should provide good accessibility conditions to all the means of transport reaching the node. Cycling is another privileged choice to access the transport hub [48], therefore ensuring good accessibility and safety of the area to cyclists is another important factor to consider [49] for every type of transport node. This means basically to provide proper and secure spaces for parking the bicycles near the access points to the other means, positively influencing this transport choice [48]. Moreover, the transport hub has to be easily accessible not only by walking and cycling, but also for those who reach the node by car or motorcycle; therefore proper parking areas for private motorised vehicles are necessary. Their configuration varies depending on the hub’s importance, ranging from parking slots to overseen guarded parking with subsidiary services.
The provision of taxi stands and kiss and ride lanes for short time car parking in the node proximity are other important factors to consider in the main transport hubs (cat. A,B). They must be located in a position that guarantees a safe and quick get on and get off.
If the city is provided with an e-car recharging network, the parking areas where commuters leave their own car for the whole day can be equipped with this facility. The same principle is valid for any shared mobility service. Likewise, dedicated parking areas and access points to bike and car-sharing services eventually present in the urban context should be located near the hub to ease the interchange.
Finally, it worth also mentioning wayfinding as a complementary KF to the general layout of the interchange space, that reduces the need of signing [40] by giving indications about the networks and the spaces of the interchange, based on the cognitive attitudes of the users to interpret them [50]. Adopting wayfinding solutions is particularly important in the biggest interchanges, where layouts and paths are complex and articulated and a more careful design of the wayfinding expedients is therefore needed.
The KFs related to the Accessibility domain are listed in Table 2.
As mentioned before, accessibility should be considered also at the policy level, as a general principle to ensure an efficient interchange, by adopting governance models and policy measures that set priorities and accessibility conditions [42], as well as a maximisation of the multimodality in the interchanges. In our methodology, we integrated these concepts into the Efficiency of the Interchange domain.

3.2. Quality of the Interchange Environment

Similar to Accessibility, this category is of great importance to design high-quality interchange environments and to ensure the waiting time is pleasant [44,51]. It relates to the interchange comfort and refers to the availability of facilities affecting the waiting time [10,38,40,45], from the basic ones, which should be present in each interchange, to additional facilities and services provided in biggest interchanges. The category also considers the “urban” dimension of the node in relation to the surrounding urban environment [30,31,43] with which it should be somehow connected.
While cleanliness and good maintenance are features requested in each node, the importance of the interchange is the main deciding factor that affects the type and level of facilities required, which have the role of making the node not only a pleasant place for passengers, but also for people that can pass through the interchange for other reasons [31]. Toilets, seats, and covered areas are other basic facilities that should be provided at each interchange, while additional facilities, such as catering, Wi-Fi connection, collection lockers, and waiting areas are needed in the bigger nodes, where the waiting time can be longer. The most important hubs are frequently conceived also as catalysts of many and diversified commercial, retail, and entertainment facilities making the hub place a destination in itself [10]. This affects the extent to which the hub can integrate with the urban realm where it is embedded—being not an enclave, but a piece of the city.
To the same extent, it is crucial to increase the interchange node permeability to pedestrian paths to integrate it in the urban area, overcoming the barriers that can hamper the connections with the surroundings [52].
Another important factor tightly linked with the previous ones relates to the perception that the passengers and city users have when passing through or near the hub. Perception is affected by the legibility and the architectural features adopted for designing the node, elements that should be well studied, to reinforce the role of the hub as a landmark, mainly for the hubs located in central urban areas (cat. A,B,C). The creation of well-designed paths, attractive frontages, and clear perceptual links between internal and open spaces [40], as well as natural enlightened areas [10] are key aspects for improving the perception of the transport infrastructure as an urban place, stimulating its frequentation.
This category can have a role also at the policy level. The adoption of design standards aimed at making the interchange not only an element of the transport networks, but also an urban place, valorising the time spent during the interchange, is an important factor that should characterise integrated transport and urban policies, dealing with promoting multimodal integrated transport means within the cities.
Table 3 lists all the KFs considered as relevant for the Quality of the Interchange Environment domain.

3.3. Safety and Security

This category examines another critical aspect characterising the transport interchanges: Safety and security, inside and around interchange [38,44,45]—preventing both accidents or dangerous situations, due to the intersection of different means of transport, as well as crime and disorder [40], and undermining the real and perceived safety of the users.
Traffic safety is, therefore, an important factor to consider, which can be increased by minimising the interferences between pedestrians and transport flow, adopting good design solutions that prevent accidents and injuries to passengers.
Concerning personal security, design expedients, such as avoiding isolated, dark, or segregated areas, as well as a security management system based on the installation of video surveillance and security supervisions, are other KFs that have to be ensured in each hub.
Safety and Security issues can have a role also at the policy level, stimulating specific measures aimed at increasing these aspects. In our methodology, they have been considered as KFs for ensuring the efficiency of the interchange at the policy level.
Table 4 lists all the KFs considered as relevant for the Safety and Security domain.

3.4. Efficiency of the Interchange

While the assessment of the Quality of the Interchange Environment considers the urban dimension of the interchange, the “efficiency” refers to the general functioning of the interchange as a transport hub. It takes into consideration specific KFs like the availability of space for daily transport activities and for future improvements, the organisation of facilities directly tied to transport, and the presence of proper signals for drivers and users.
The availability of appropriate space for vehicles [53] stopping and passing by is a crucial condition for interchange centres, avoiding time losses. Fast circulation inside the node raises the overall commercial speed of trips and consequently the appeal of public transport. The presence of appropriate signals for all types of drivers approaching the hub is also an important factor to consider. Kiss and ride lanes, parking areas, cycling paths and facilities, taxi stands should be clearly signalled, reducing congestion and confusion in the interchange node and urban surroundings. This is valid for every type of interchange hub—both big interchange nodes or small stations or Outskirt park and ride interchanges.
The proximity among the access points of the different means of transport with short pedestrian distances is a crucial feature [43,45] to ensure comfortable and quick transfer from a means to another, reducing time for the transfer and guaranteeing a reduced effort for the users.
The efficient fare payment system and ticket validation is another KF that increases the general efficiency of the transport node [45]. The level of service varies from the different types of interchanges, from dedicated ticket offices to automatic machines, but a minimum level of facilities, such as ticket vending and validation machines, should be ensured in every node or within its immediate surroundings.
Another aspect to consider is the possibility to expand or reorganise the interchange node by hosting new means of transport, enhance the existing ones or to simply rearrange the node to adapt it to new needs. When designing interchange nodes, it is important, where possible, to leave adequate space in the nearby of the hub and adopt flexible configurations, to ensure easy reorganisations of the node. This factor might be disregarded in the bigger hubs that host many transport modes and have been reorganised and enlarged with several urban constraints, due to the existing urban infrastructures and buildings in the surroundings [9].
Table 5 lists all the KFs considered in this study within the Efficiency of the Interchange domain.

3.5. Planning the Interchange

Adopting proper policies favouring the interchange planning is crucial not only at the design level, but also when specific urban and transport policies oriented to encouraging modal interchange are defined. Planning the interchange in our study refers to a policy approach based on integrating different urban and transport policies and planning oriented to boost an efficient modal interchange [54]. The search for close proximity in the localisation of different transport hubs and stops, the establishment of minimum requirements for fare payment and tickets validation or for ensuring safety and security are factors becoming relevant policy goals at the policy level. Therefore, transport and urban policies oriented to increase interchange efficiency can anticipate the factors that we have already described at the design level, such as Accessibility, Quality of the Interchange Environment, Safety and Security, and Efficiency of the Interchange.
Table 6 lists all the KFs considered within the Planning the Interchange domain.

3.6. Service Information

An important domain that can influence the decision to use public transport is related to the provision of information [55]. This is particularly crucial when we consider the interchanges and the transport services and ancillary facilities involved. The availability of real-time information is fundamental for planning a journey. Customers aim to save time and effort all along the journey by receiving reliable information to plan the trip [25]. Therefore, this category has important implications—both at the policy and design levels.
The service information provided can vary according to the importance of the interchange. The systematic provision of basic information material and devices, such as timetables and real-time information panels, is a necessary requirement for each interchange and affects both integrated transport policies and design solutions.
At the design level, in the most important interchange nodes, these basic information services can be complemented by the presence of information offices and dedicated staff. Likewise, at the policy level, two main kind of information services can be provided to support users and customers in planning their trips and managing possible disruptions or delays, namely: The establishment of traditional information services, such as call centres or booking services, accompanied by online information tools, such as apps and website providing real-time information and the possibility to book. The availability of both digital and physical information points is conceived for making the information accessible to all, including older adults or disabled people, that can benefit more from one service or the other, depending on their level of disability or degree of digitalisation.
Table 7 lists all the KFs included in the Service Information domain at both policy and project level.

3.7. Service Coordination

This category of KFs (listed in Table 8) mainly refers to the policy level. It examines the general coordination between the services carried out by different operators and the provision of adoptable schemes in cases of service disruptions—both for minor delays and critical events. It can also comprise the availability of an integrated fare scheme allowing easy payments and access to different transport services, and the standardisation and promotion of the Mobility as a Service (MaaS) approach.
An important factor in this domain is the possibility to synchronise the departure times of different transport means at a mobility hub, finding a balance between minimising the waiting time and giving enough time for the transfer [56]. Several studies have been elaborated on this topic [57,58,59,60] highlighting its importance for better management of the public transport services. This aspect considers the timetable coordination of the scheduled services, but also the delay management, i.e., the possibility to adapt the scheduled time for better addressing possible delays of one means that should be kept synchronised with the others. This last aspect is even more important when transport services are less frequent.
Another important factor for ensuring efficient transport service coordination is the easiness of the payment for each service. The most effective and spread solution is to provide an integrated ticketing service [33], including public transport services and facilities in force in the hub and within the functional urban area. The availability of a unique payment method for many transport services can have a positive effect also for promoting Mobility as a Service (MaaS) approach among the city residents, changing their attitude from owning a vehicle to accessing multiple choices of shared and collective means of transport, choosing the one that best fits with the trip planned [42]. Stimulating MaaS approach has advantages for the whole city by reducing street occupancy and reducing traffic emissions and congestion.
Finally, it is important to introduce standardisation of design concepts to ensure the legibility of the interchanges independently from their location in the city [40]. Maintaining common formal and structural elements among the interchanges hubs and stops, such as signals, facilities, furniture design, and communication and information material and services, can ease identification and direction inside the hub. Standardisation can produce important effects at the design level, stimulating better accessibility and quality of the node design. These aspects have been already tackled in this paper within the Accessibility and Quality of the Interchange Environment domains.

3.8. Changing Behaviours

Within this category, the policy actions that are beneficial to change behaviours are analysed, to boost the adoption of mobility behaviours based on multimodality and on the use of more sustainable means of transport, such as active mobility, public transport, and shared vehicles.
These soft measures are gaining more and more importance, since they raise the awareness on the effects of unsustainable mobility behaviours and on the benefits of changing towards more sustainable and healthy mobility lifestyles. An interesting example promoted at European level is the European Mobility Week [61] where local authorities are invited to present initiatives for mobilising people towards more sustainable mobility behaviours. The 2018 edition was focused on multimodal mobility, and 765 actions were submitted, highlighting, on the one hand, the importance of the topic for boosting sustainable mobility, and on the other hand, a big involvement from the local authorities and public bodies in raising awareness on the benefits of multimodal mobility.
At the local level, there are many examples of traditional sensibilisation actions through communication campaigns to show the advantages and environmental benefits of sustainable transport, and of bottom-up approaches tended to engage the users in promoting these different behaviours. Moreover, more innovative approaches based on the learning by doing and gamification have been implemented.
The learning-by-doing approach is a key policy strategy to educate people, and especially youngsters, to adopt more sustainable mobility behaviours [62], while bottom-up approaches see users directly involved in proposing specific initiatives and measures for changing towards alternative means of transport.
Gamification is a way to stimulate new behaviours through a competition between citizens, who become players and are rewarded if they change their behaviours [63]. This practice is frequently used in the transport sector to incentivise a voluntary shift towards sustainable mobility without impositions [64] and has achieved successful results.
Table 9 lists all the KFs considered within the Changing Behaviours domain.

3.9. Policies, Norms and Regulations

This domain considers the establishment of different forms of collaboration, set by shared protocols and agreements, and joint initiatives that are aimed to achieve high levels of integration in the management of the transport networks and services among the different stakeholders. By considering the interchange node, where multiple transport companies might operate, efficient and innovative cooperation and business model schemes are necessary to ensure a seamless interchange experience.
Besides agreements and protocols, a significant aspect refers to how the decision-making process takes place. The co-creation of shared solutions through the activation of round tables involving the key decision-makers and transport companies responsible for the services connected with the interchange can produce positive effects in boosting the modal interchange. Similarly, the engagement of citizens and users in co-creating mobility services and solutions [65] can produce valuable results for achieving high-quality levels of services and facilities for passengers within the interchange.
Table 10 contains all the KFs considered within the Policies, Norms and Regulations domain.

4. The Decision Support System for Assessing the Interchange

The identification and role of the nine identified domains and related KFs and the different types of interchange occurring in the urban contexts have been assumed as the basis for setting a decision support system for supporting decision-makers and designers to maximise the performance of the interchange through the assessment of different policy and design scenarios. These scenarios can represent existing situations currently in place, such as interchange configurations or urban and transport policies in force in a certain context, or projects and policy proposals, that can potentially increase the effectiveness of the interchange. The method takes the form of an easy-to-use Decision Support System (DSS) useful for supporting designers and decision-makers in making informed decisions towards more incisive solutions boosting multimodal and interconnected mobility, by comparing the results of different solutions and deciding which ones are more effective against the nine different domains. Starting from the selected domains and related KFs, the decision support system has been built upon the following main stages:
  • Determining weights for the KFs within each domain, to consider the different roles they have for influencing the performance of the interchange;
  • In case of project level domains, determining the relevance of the KFs according to the node ranking, to highlight the different level of services, facilities, and complexity against each interchange category;
  • Definition of the KFs quality scoring system to rate the performance of the case studies and the identification of relevant thresholds to assess the overall performance;
  • Finetuning and normalisation of the scores.
The automation of the assessment procedure has been managed by two Excel sheets: The former is related to the policy level, and the latter attains the node features (design level). Both sheets are designed for providing the results of the assessment and both host a matrix where each record represents a KF weighted according to its role in the functioning of the interchange.

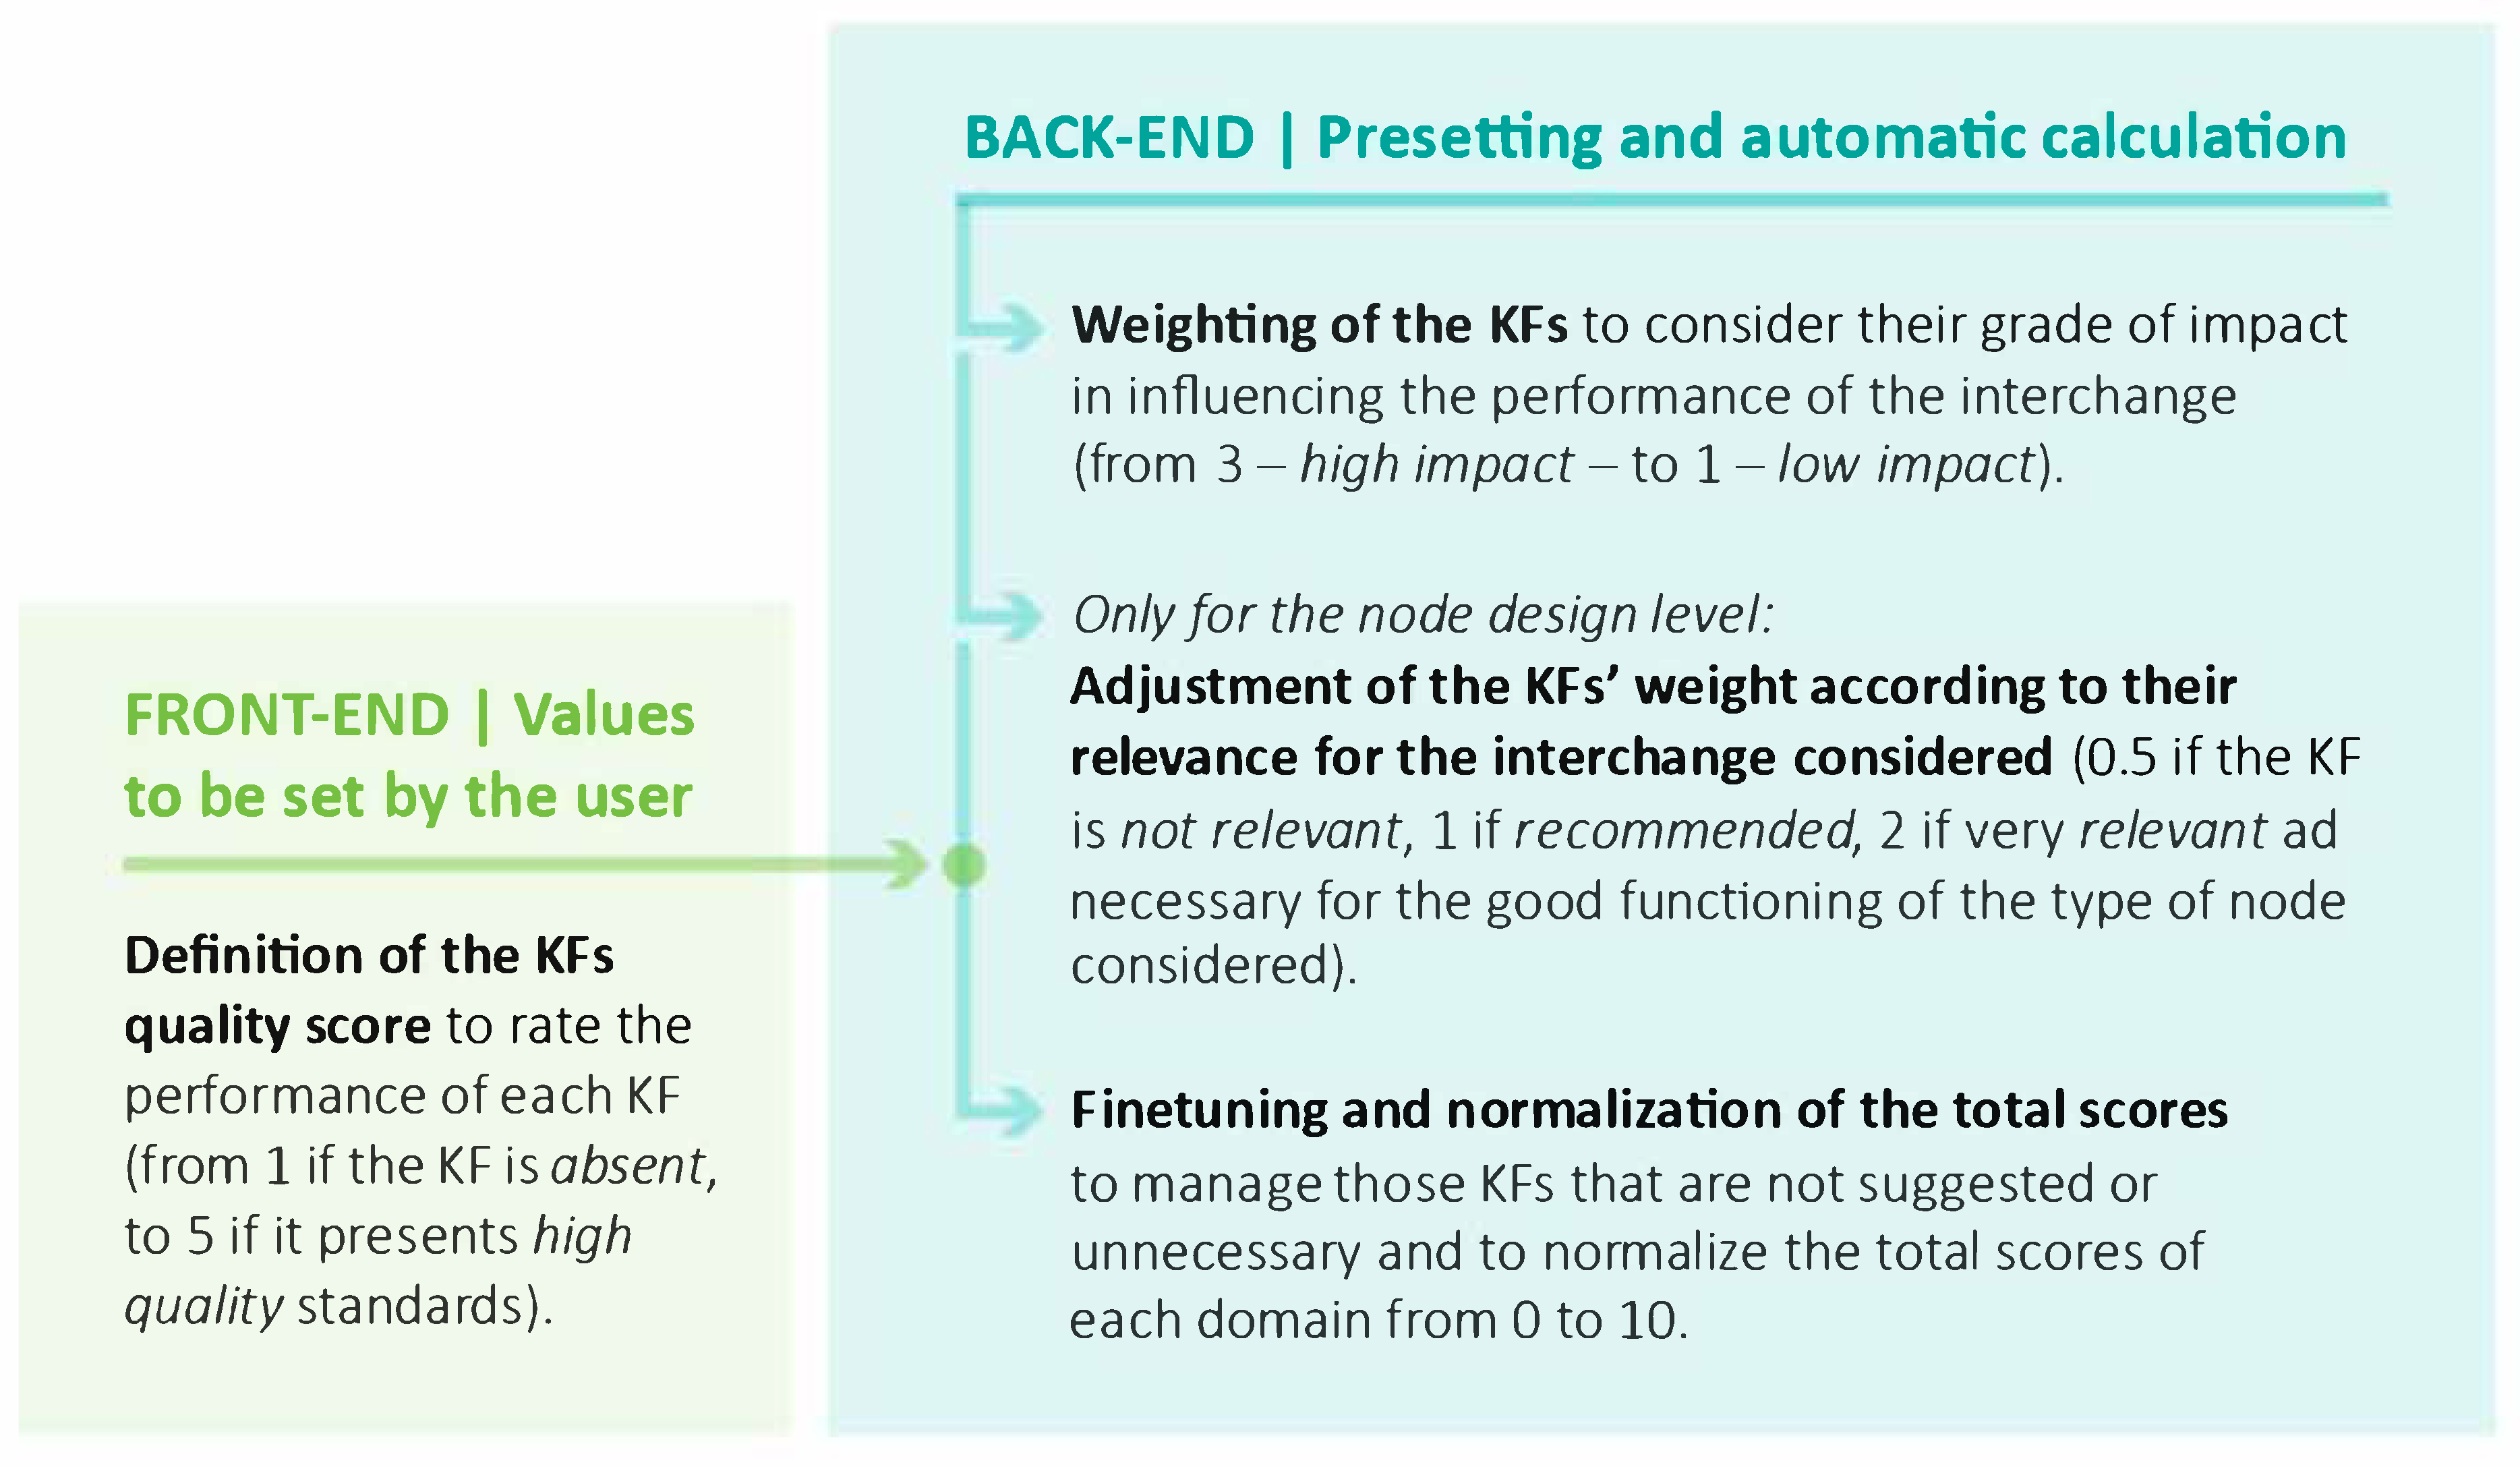
4.1. Determining Weights for the KFs

In our methodology, not all the KFs have the same importance for ensuring an effective interchange. To weight the KFs, MATCH-UP project partners and their stakeholders have been involved by providing a rating of the KFs comprised in the same domain. This task has been led for all the nine domains. Notably, this participatory process foresaw that around 20 people among project partners and their stakeholders provided their own rating of each KF belonging to the same domain by considering its relative impact for ensuring an efficient interchange in comparison with the other KFs belonging to the same domain. The experts used the following scores to rate the KFs’ impact:
  • 3 = high impact: The impact of the KF is high for ensuring the success and the performance of the interchange in that specific domain, in terms of services and functionalities provided;
  • 2 = medium impact: The impact of the KF is medium, therefore its absence is significant, but does not impede the overall functionality and efficiency of the interchange in that specific domain;
  • 1 = low impact: The impact of the KF is low, therefore its absence does not significantly alter the overall performance of the interchange in that specific domain.
In Table 11, the results of the weighing of the KFs included in the Service Coordination domain is shown as an example. The same procedure has been led for all the KFs related to the nine domains.
At the end of this stage, we obtained the final rating of the KFs’ impact by calculating the average of the scores provided by the experts for each KF, in case of different opinions.

4.2. Determining the Relevance of the KFs according to the Node Ranking

The determination of the KFs weights described before has been led for all the domains, thus considering the policy and project levels. If this score attribution is considered to be enough for the policy level, additional considerations are needed at the project level, according to the different types of interchange hubs. Therefore, additional analysis has been foreseen for the KFs included within those domains that are relevant at the project level, to consider their relevance and necessity with reference to the type of interchange hubs. To achieve this aim, a set of three numeric values has been identified to recognise different situations:
  • 0.5 = the KF is considered as not relevant and unnecessary to the specific node type;
  • 1 = the KF is recommended for the good functioning of the interchange, but is not necessary to the specific node type;
  • 2 = the KF is very relevant and necessary for the good functioning of the node type considered.
These three values do not represent an additional weighing of the KFs, but rather a numeric value that registers three different situations. The experts have also been involved in this task, by providing their rating about the level of relevance each KF presents against the node category. According to this second analysis, we highlighted the differences in terms of necessity in the presence of certain KFs instead of the others. As an example, if we analyse the values associated with the KFs of the Quality of the Interchange Environment domain (see Table 12), in relation with the interchange types, we can see big differences in the definition of certain KFs relevance, according to with the node importance.
After this value attribution, each interchange category owns a different set of weights associated with the KFs included within the design-related domains. These final weights result from the multiplication of the KF impact scores and the KF relevance scores.

4.3. Definition of the Key Factor Quality Scoring

After having weighed the KFs within each domain and according to ranking of the different nodes, the back-end part of the DSS is almost completed. The DSS has been complemented with a front-end section dedicated to collect the user’s appraisal concerning each KF’s quality shown within existing policies and interchanges configuration or even in new policies and projects. This quality appraisal refers to the extent to which each KF can boost multimodality and an effective modal interchange.
The scores included in this section are the only data managed and provided by the user (who can be a policymaker or a designer, depending on the specific element to assess) through a dedicated user interface. More specifically, the possible values the user can select are:
  • 1 = absent: The KF analysed is not present in the policy or in the project assessed;
  • 2 = low quality: The KF is available, but does not fully satisfy minimum quality requirements as perceived by the user;
  • 3 = fair quality: The KF is present and perceived by the user with a sufficient level of quality;
  • 4 = good quality: The KF is present and appreciated by the users. Its quality is good, allowing optimal functioning of the interchange;
  • 5 = high quality: The KF is present with high-quality standards, offering an outstanding example.
This final scoring assesses the performance of each KF in relation to its quality level and allows to appreciate the performance of a policy or an interchange per single domain and as a whole. Indeed, the tool provides the total score by multiplying the quality scores with the KF impact and KF relevance, this last one if the assessment refers to the node design (see Table 13).

4.4. Finetuning and Normalisation of the Scores
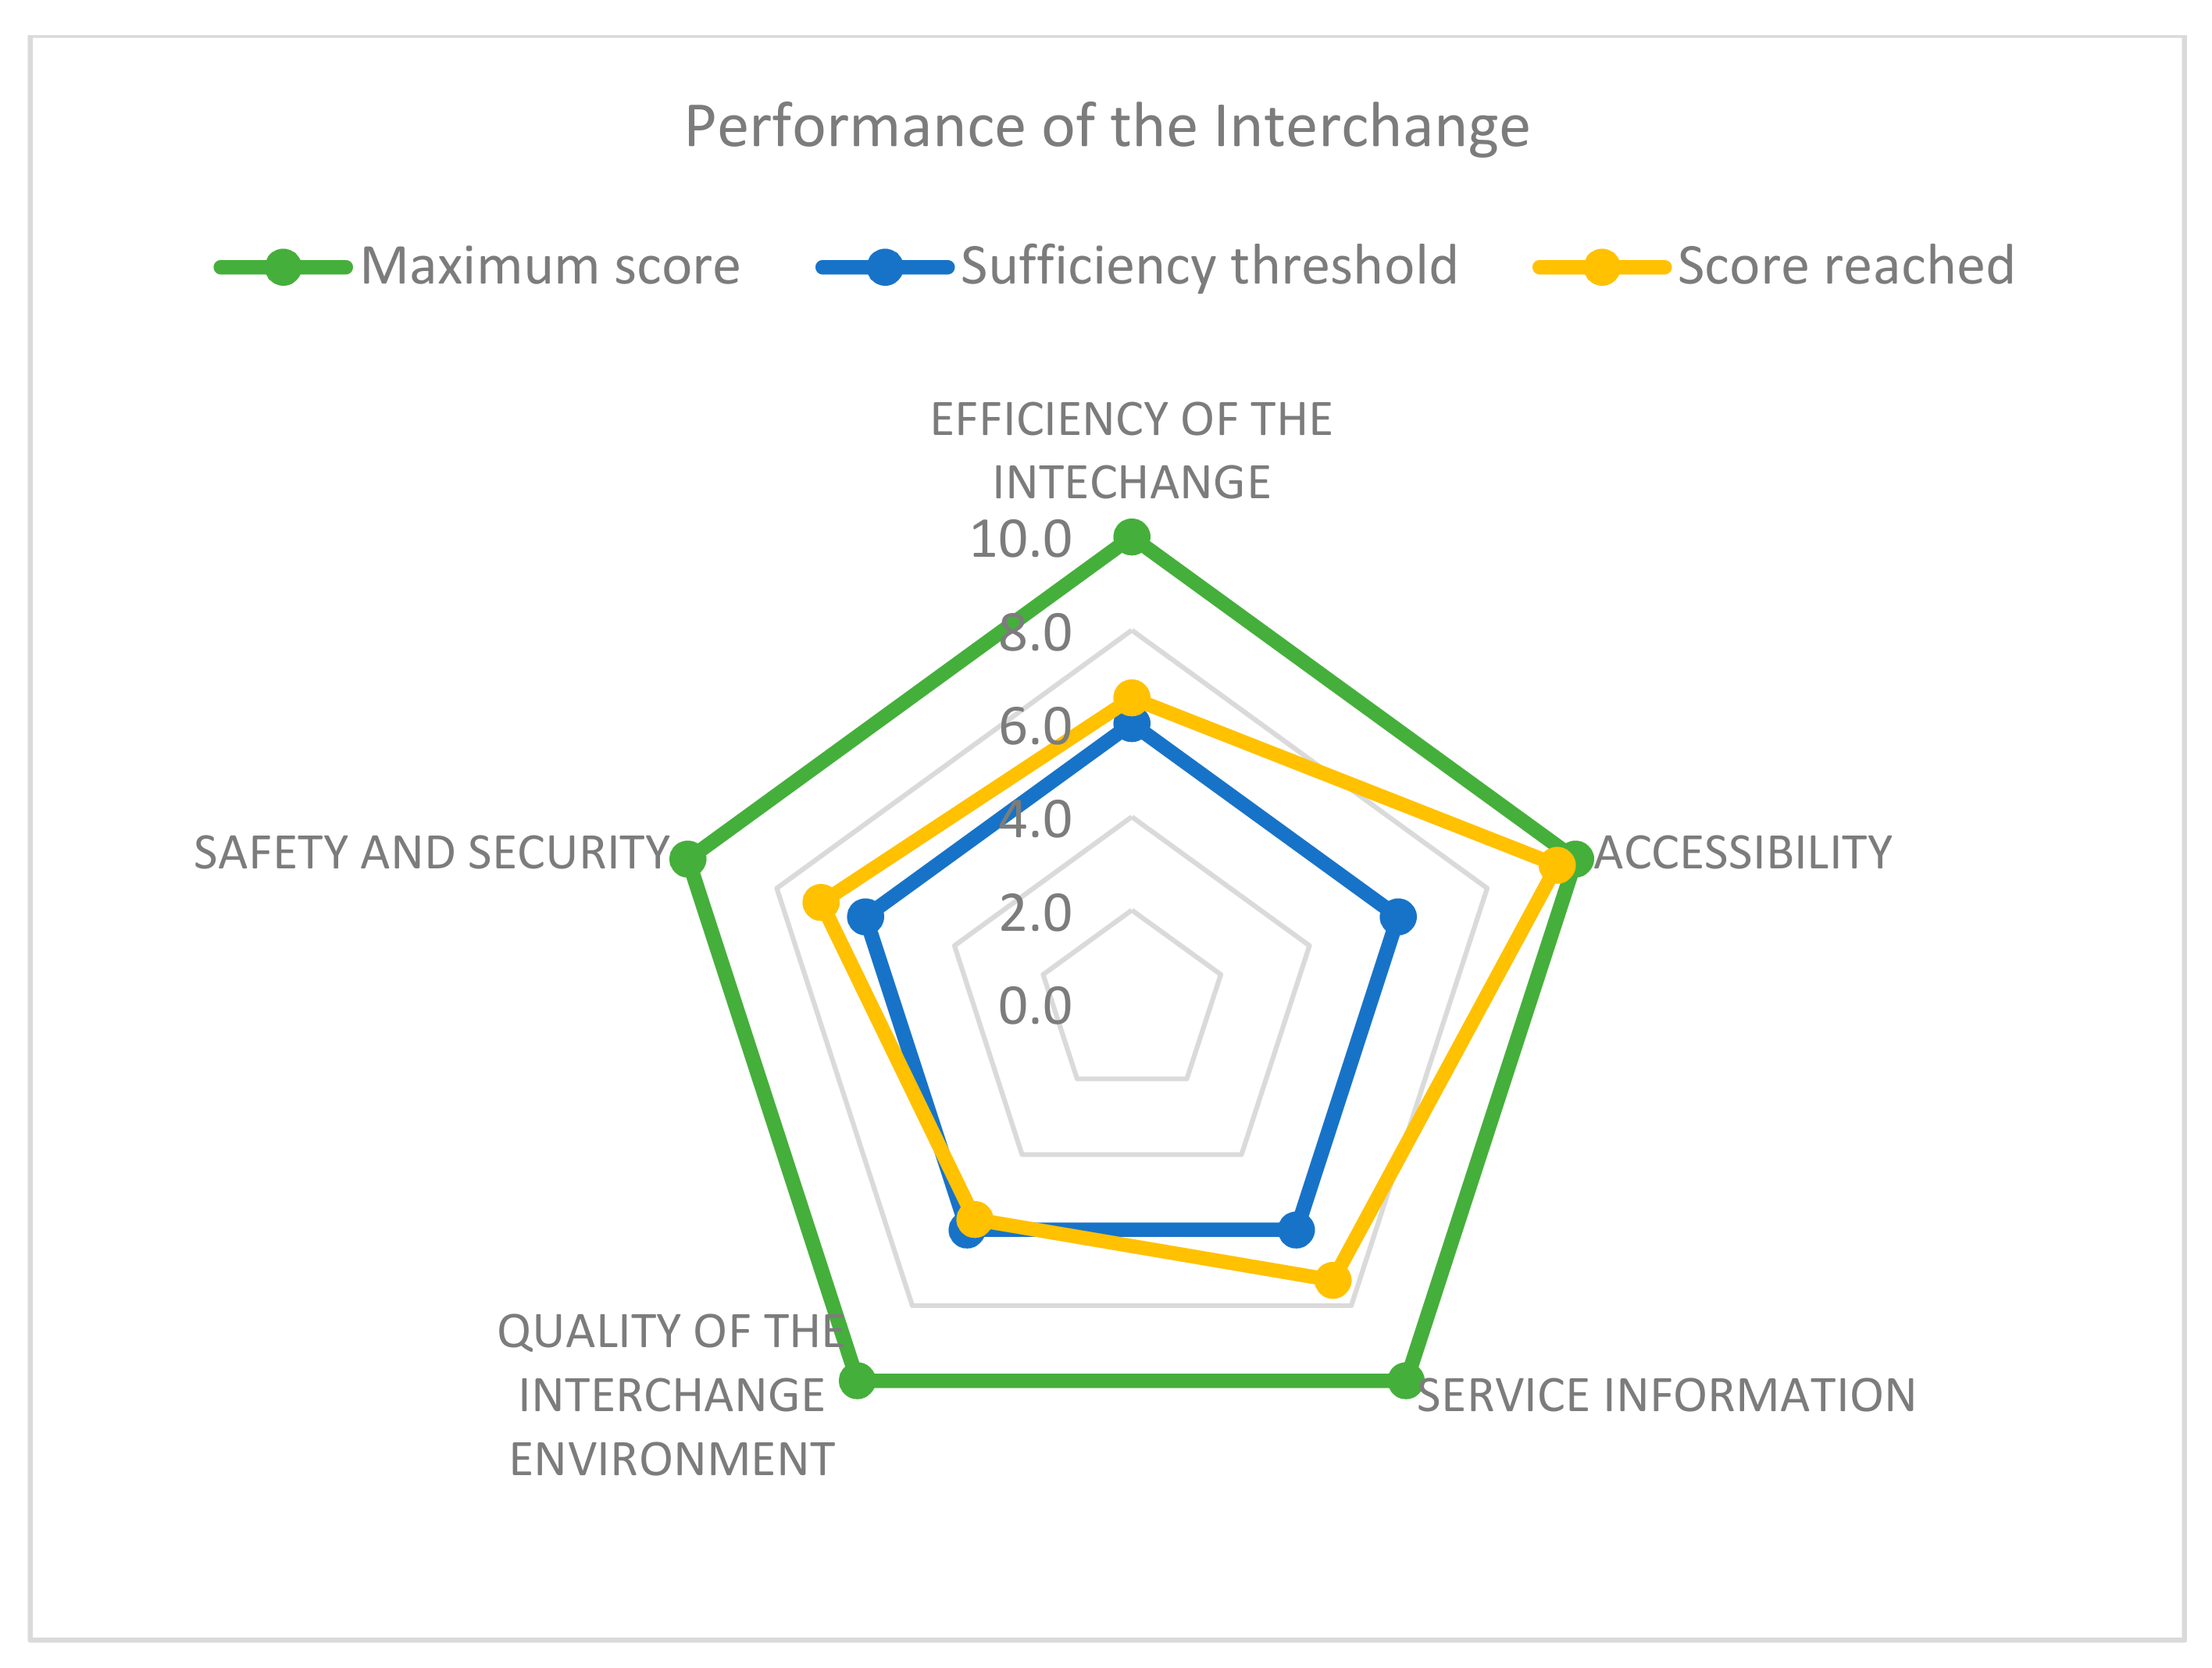
The back-end part of the rating system has been finetuned by adopting specific controls in the node design assessment based on the KF relevance. In particular, if the KF considered is only suggested or unnecessary (KF relevance equal to 1 or 0,5), its influence on the final rating should be negligible in case of low-quality performance or absence of the KF. Therefore, in this case, when the KF presents a low-quality performance or is absent, the total score reached for the same KF is automatically set as equal to 0, otherwise the final product would be positive and increase the final score. At the same time, the calculation of the domain’s thresholds has been set by not considering in the sum those KFs that present a performance score equal to 0. In this way, the low performance or absence of the KF does not influence the total score of the domain, since its presence is not required. Conversely, if the same KF with relevance 1 or 0,5 presents a quality from 3 to 5, the multiplication of the relevance, impact, and quality factors is allowed, increasing the final score of the domain.
The last step for finalising the DSS has been the normalisation of the results to make the data associated with each domain more comparable. The total scores reached in each domain, given by the sum of all the KF performance scores, have been normalised against the highest quality threshold, obtaining a value ranging from 0 to 10, where 6 and 10 represent, respectively, the sufficient and maximum thresholds. The Decision Support System functioning is shown in Figure 2.

5. Results

The proposed tool allows to rate and visualise the performance of a policy or a node (existing or future) against their attitude to boost an effective modal interchange, by considering the performance they reach in each relevant domain. The scores reached in each domain are the result of the evaluation of all the identified KFs within that domain.
To gain a clear and overall picture of the situation, the tool provides a visualisation of the results through a radar graph. This output easily identifies which domains present criticalities and which ones are most performing in a specific case study, being a policy or an interchange hub (Figure 3). The radar graph also visualises two important thresholds, representing the fair and high-quality levels obtained for each domain, allowing to easily interpret the results of the evaluation. The two thresholds are identified by assigning, respectively, the fair quality and the high-quality scores, respectively, 3 and 5, to all the KFs in each domain. Therefore, if the score reached by a certain policy or project under evaluation in specific domains are below the fair level, the radar graph in those domains’ axes will be smaller than the ones of the fair level.
The extent and the regularity of the area visualised in the graph represent the overall performance of the policy or project analysed. The wider and more regular the area, the more the policy or project guarantees satisfactory and balanced outcomes as a whole and in terms of promoting effective interchange. At the same time, it is possible to identify which domains are more critical in terms of ensuring an effective interchange, allowing the decision-maker or the designer to better investigate which are the specific problems behind this low performance. In fact, the high or scarce performance registered in one domain depends on the quality performance, the impact and eventually the relevance scores assigned to each KF within that domain, which are punctual factors that together concur to define the overall situation. Therefore, while the results of the assessment are aggregated per single domain, to modify the behaviour of a specific domain the user has to focus on those factors that are more critical for the definition of the final result. In particular, the user can check the total performance score of each KF and then the quality score assigned to first identify what the total contribution of the KF to the domain’s performance is and secondly if the current quality of the KF must be improved. This allows the user to understand if the low performance score is due to the overall importance of the KF (given by the product of KF impact and relevance) or to the quality score assigned or both, helping the user to better define possible improvements. As an example, it could be better to improve a small part of a KF quality that is of high importance instead of improving a large part a KF quality that present a low importance.
Another key aspect that characterises the DSS is the equal weighting of the nine domains composing the overall evaluation. Indeed, the methodology and the DSS work mainly at the level of the single KF through a very inclusive approach by defining to what extent they concur to increase the performance of the interchange within their domain and inviting decision-makers and designers to focus on their quality level and to take them into account when setting new interchange policies and project or changing the existing ones. Therefore, the nine domains have been considered independently in the sense that we did not compare and weight KFs owning to different domains. In fact, the normalisation process attributes the same maximum values to each domain, giving the same importance to them. Grouping the KFs into domains allows the decision-makers to easily identify specific fields (domains) where to work for improving the performance of the interchange.
The tool has been tested by the MATCH-UP project partners on several policies and projects where the interchange promotion was addressed differently. The testing phase was led by considering current situations and possible new scenarios defined by a change in the current state of the art of a policy or project. This phase was useful also to appreciate the role of the KFs and the domains within the two planning levels, giving important feedbacks that help to reorganise the KFs within the domains and the domains themselves. The results achieved were satisfactory, proving good reliability of the tool.

6. Conclusions

The need to boost policies and solutions to enable a shift towards more sustainable means of transport, such as walking and cycling and public transport, passes through promoting an effective modal interchange. This means to foster the use of different sustainable means of transport that can be optimally combined, ensuring a seamless journey [7,8].
The conditions that determine the good establishment of multimodal travel have been widely studied by scholars and public institutions, achieving the definition of recurrent factors able to realise a seamless interchange, which should be comfortable, reliable, and safe. At the same time, these studies underlined a complexity in deepening all the multifaceted aspects affecting the performance of the interchange, and only a few of them have considered the factors influencing the modal interchange as a whole.
The methodology and the related decision support system developed in this study aimed to fill this gap. It did this by providing a comprehensive and overall assessment of the conditions that affect the effective promotion of the modal interchange among sustainable means of transport and multimodal mobility policies in the urban environment.
The developed tool is available for free [66], and it provide a quick and qualitative assessment method which is aimed at supporting planning and design decisions oriented to promote an effective modal interchange. Indeed, the methodology considers the interchange under two main planning levels, policy and design, being able to evaluate the performance of both the interchange nodes, which are the key places where people change from a means to another, and the transport and mobility-related policies, that can establish good governance, planning, and behavioural conditions for an effective modal interchange.
The methodology took the form of a decision support system, a computer-based system that supports the decision-making activities [67] by providing qualitative results that can be analysed both at the domain and KF levels. Indeed, the tool developed has a twofold intent. On one hand, it supports the analysis of current policies or node configuration, assessing the performance they actually have, identifying possible gaps and shortcomings that can lead to the definition of improvements to undertake. On the other side, it can forecast the performance of new interchange projects and/or policy changes, comparing different future scenarios.
The Decision Support System (DSS) provides a user-friendly interface where the user is asked to insert a judgment upon the quality of all the relevant KFs, and clear visualisation of the results of the assessment in a radar graph. This judgment is a very delicate stage and implies that the user has a minimum level of competences to associate a quality score to each KF. To this regard, it is important to consider that the methodology and the tool are targeted to local administration’s technicians and designers that can clearly identify the nature of the KFs and easily appreciate their quality and role within a certain policy or project.
The DSS is not only able to rate and visualise the performance of a node per each domain, but also to identify which specific factors are more critical for achieving good performance. In fact, the score reached in each domain is the sum of the scores reached by each KF—therefore, if some KFs obtain low quality scores, they determine a general lowering of the domain’s score. It is, therefore, easy to identify which domain is more critical and consequently which KFs are responsible of low performance levels and concentrate on them for improving their quality, for the benefit of the entire domain. This allows the DSS to support an iterative decision-making process, since the decision-maker or the designer can go back to the decisions taken and revise them with progressive adjustments on the specific KFs, to obtain the solutions that guarantee greater effectiveness, also according to possible economic constraints.
The methodology can be improved by further adjusting the KFs and related weights through the direct involvement of the travellers that usually use the transport services and move in the interchange hubs to understand how they perceive all the aspects analysed and their importance in the overall travel experience.
In conclusion, we consider this methodology and the associated tool a good compromise for easily assessing the performance of the interchange and the policies promoting multimodal mobility. Decision-makers, technicians, and designers can benefit from this tool to lead a preliminary assessment of current situations and future planning and design scenarios in terms of their promotion of an effective modal interchange.

Author Contributions

Conceptualization, P.I.S.R. and E.C.; methodology, P.I.S.R., G.G. and E.C.; supervision, S.T. All authors have read and agreed to the published version of the manuscript.

Funding

This research was funded by Interreg Europe (MATCH-UP project).

Institutional Review Board Statement

Not applicable.

Informed Consent Statement

Not applicable.

Data Availability Statement

Data available in a publicly accessible repository. The data presented in this study are openly available in AMS Acta at doi:10.6092/unibo/amsacta/6580, reference number [66].

Acknowledgments

We would thank the MATCH-UP project partners and their relevant stakeholders who took part to this study by contributing to the Key Factors weighing and to test the methodology.

Conflicts of Interest

The authors declare no conflict of interest.

References

  1. Zampano, G. New Solutions to Shape the Future of Urban Mobility. Infrastructure Channel. August 2017. Available online: https://www.infrastructure-channel.com/article/-/content/new-solutions-to-shape-the-future-of-urban-mobility (accessed on 24 April 2020).
  2. European Commission. Reducing CO2 Emissions from Passenger Cars—Before 2020 [Climate Action]. 2020. Available online: https://ec.europa.eu/clima/policies/transport/vehicles/cars_en (accessed on 12 May 2020).
  3. World Health Organization. Ambient (Outdoor) Air Pollution. 2 May 2018. Available online: https://www.who.int/en/news-room/fact-sheets/detail/ambient-(outdoor)-air-quality-and-health (accessed on 12 May 2020).
  4. European Environment Agency. Air Quality in Europe—2019 Report; EEA Report No. 10/2019; European Environment Agency: Copenhagen, Denmark, 2019. [Google Scholar] [CrossRef]
  5. Panayotis, C.; Ibáñez Rivas, J.N. Measuring Road Congestion; Report EUR 25550 EN; Institute for Prospective Technological Studies. Scientific and Technical Research Series; Publications Office of the European Union: Luxembourg, 2012. [Google Scholar] [CrossRef]
  6. United Nations. New Urban Agenda. In Proceedings of the United Nations Conference on Housing and Sustainable Urban Development—UNHabitat—Habitat III [Report A/RES/71/256], Quito, Ecuador, 17–20 October 2017; Available online: https://habitat3.org/the-new-urban-agenda (accessed on 12 May 2020).
  7. European Commission. Multimodal Personal Mobility, version 2.0; Smart Cities and Communities—Smart Cities Stakeholder Platform; Klug, S., Ed.; European Commission: Brussels, Belgium, 2013; Available online: https://eu-smartcities.eu/sites/default/files/2017-10/Multimodal%20personal%20mobility%20january.pdf (accessed on 24 April 2020).
  8. Allard, R.F.; Moura, F. The Incorporation of Passenger Connectivity and Intermodal Considerations in Intercity Transport Planning. Transp. Rev. 2016, 36, 251–277. [Google Scholar] [CrossRef]
  9. Blow, C. Transport. Terminals and modal interchanges. In Planning and Design; Elsevier: Amsterdam, The Netherlands, 2005. [Google Scholar]
  10. ADB. Improving Interchanges: Introducing Best Practices on Multimodal Interchange Hub Development in the People’s Republic of China; Asian Development Bank (ADB), Ed.; Asian Development Bank: Mandaluyong, Philippines, 2015; Available online: https://www.adb.org/publications/improving-interchanges-multimodal-interchange-hub-development-prc (accessed on 12 May 2020).
  11. European Commission. Urban Agenda for the EU—Pact of Amsterdam; European Commission: Brussels, Belgium, 2016; Available online: https://ec.europa.eu/regional_policy/en/information/publications/decisions/2016/pact-of-amsterdam-establishing-the-urban-agenda-for-the-eu (accessed on 24 April 2020).
  12. Schoemaker, J.; Scholtz, A.; Enei, R. Towards Low Carbon Transport in Europe; European Commission: Brussels, Belgium, 2012. [Google Scholar] [CrossRef]
  13. European Commission. Action Plan on Urban Mobility; Communication from the Commission to the European Parliament, the Council, the European Economic and Social Committee and the Committee of the Regions. EU document: COM (2009) 490; European Commission: Brussels, Belgium, 2009; Available online: https://ec.europa.eu/transport/themes/urban/urban_mobility/action_plan_en (accessed on 12 May 2020).
  14. European Commission. White Paper Roadmap to a Single European Transport Area—Towards a Competitive and Resource-Efficient Transport System; Communication from the Commission to the European Parliament, the Council, the European Economic and Social Committee and the Committee of the Regions. EU document: COM (2011) 144 final; European Commission: Brussels, Belgium, 2011; Available online: https://eur-lex.europa.eu/LexUriServ/LexUriServ.do?uri=COM:2011:0144:FIN:en:PDF (accessed on 2 November 2020).
  15. Wefering, F.; Rupprecht, S.; Bührmann, S.; Böhler-Baedeker, S. Guidelines. Developing and Implementing a Sustainable Urban Mobility Plan; European Platform on Sustainable Urban Mobility Plans; European Union: Brussels, Belgium, 2013; Available online: https://www.eltis.org/sites/default/files/guidelines-developing-and-implementing-a-sump_final_web_jan2014b.pdf (accessed on 12 April 2020).
  16. European Commission. Europe 2020—A European Strategy for Smart, Sustainable and Inclusive Growth; Communication from the Commission—Reference: COM (2010) 2020 final; European Commission: Brussels, Belgium, 2020; Available online: https://eur-lex.europa.eu/legal-content/en/ALL/?uri=CELEX%3A52010DC2020 (accessed on 24 May 2020).
  17. The Council, the European Economic and Social Committee & the Committee of the Regions. Sustainable and Smart Mobility Strategy–Putting European Transport on Track for the Future; Communication from the Commission to the European Parliament—Reference: SWD(2020) 789 final; European Commission: Brussels, Belgium, 2020; Available online: https://eur-lex.europa.eu/legal-content/EN/TXT/?uri=COM:2020:789:FIN (accessed on 2 November 2020).
  18. European Commission. A European Green Deal. Striving to Be the First Climate-Neutral Continent; European Commission: Brussels, Belgium, 2020; Available online: https://ec.europa.eu/info/strategy/priorities-2019-2024/european-green-deal_en (accessed on 12 May 2020).
  19. European Commission. Evaluation of the 2011 White Paper on Transport. “Roadmap to a Single European Transport. Area—Towards a Competitive and Resource Efficient Transport System” [Commission Staff Working Document Evaluation of the White Paper—Reference: SWD (2020) 411 Final]; European Commission: Brussels, Belgium, 2020; Available online: https://ec.europa.eu/info/law/better-regulation/have-your-say/initiatives/2080-Evaluation-of-the-2011-White-Paper-on-Transport (accessed on 12 April 2020).
  20. Tsirimpa, A.; Polydoropoulou, A.; Pagoni, I.; Tsouros, I. A reward-based instrument for promoting multimodality. Transp. Res. Part F Traffic Psychol. Behav. 2019, 65, 121–140. [Google Scholar] [CrossRef]
  21. Giannopoulos, G.A.; Tsami, M.T. Defining common goals for future intermodal mobility. In Proceedings of the Mobility Convention 2014 Transportation of Tomorrow, Enabling Smarter Intermodality, Cologne, Germany, 6–7 November 2014. [Google Scholar]
  22. Harris, I.; Wang, Y.; Wang, H. ICT in multimodal transport and technological trends: Unleashing potential for the future. Int. J. Prod. Econ. 2015, 159, 88–103. [Google Scholar] [CrossRef] [Green Version]
  23. De Sá, M.; Duarte, C.; Carriço, L.; Reis, T. Designing Mobile Multimodal Applications. In Multimodality in Mobile Computing and Mobile Devices: Methods for Adaptable Usability; Igi Global: Hershey, PA, USA, 2010. [Google Scholar] [CrossRef] [Green Version]
  24. Ding, L. Multimodal transport information sharing platform with mixed time window constraints based on big data. J. Cloud Comput. 2020, 9, 11. [Google Scholar] [CrossRef] [Green Version]
  25. Grotenhuis, J.; Wiegmansa, B.W.; Rietveld, P. The desired quality of integrated multimodal travel information in public transport: Customer needs for time and effort savings. Transp. Policy 2007, 14, 27–38. [Google Scholar] [CrossRef]
  26. Liu, R.; Pendyala, R.M.; Polzin, S. Assessment of Intermodal Transfer Penalties Using Stated Preference Data. Transp. Res. Rec. 1997, 1607, 74–80. [Google Scholar] [CrossRef]
  27. Monzón, A.; Hernández, S.; Di Ciommo, F. Efficient urban interchanges: The City-HUB model. 6th Transport Research Arena (TRA) April 18–21, 2016. Transp. Res. Procedia 2016, 14, 1124–1133. [Google Scholar] [CrossRef] [Green Version]
  28. Schakenbos, R.; La Paix, L.; Nijenstein, S.; Geurs, K.T. Valuation of a transfer in a multimodal public transport trip. Transp. Policy 2016, 46, 72–81. [Google Scholar] [CrossRef]
  29. Riley, P.; Bührmann, S.; Hoenninger, P.; Christiaens, J. Intermodal Passenger Transport in Europe—Passenger Intermodality from A to Z. LINK, the European Forum on Intermodal Passenger Travel, Funded by the European Commission’s Directorate-General for Mobility and Transport DG MOVE. Research for Sustainable Mobility. Available online: http://docplayer.net/24689235-Intermodal-passenger-transport-in-europe-passenger-intermodality-from-a-to-z-the-european-forum-on-intermodal-passenger-travel.html (accessed on 2 November 2020).
  30. Bertolini, L. Nodes and places: Complexities of railway station redevelopment. Eur. Plan. Stud. 1996, 4, 331–345. [Google Scholar] [CrossRef]
  31. Conticelli, E. La Stazione Ferroviaria Nella Città che Cambia; Bruno Mondadori: Milan, Italy, 2012. [Google Scholar]
  32. Edwards, B. Sustainability and the Design of Transport Interchanges; Routledge: Abingdon, UK, 2011. [Google Scholar]
  33. Luk, J.; Olszewski, P. Integrated public transport in Singapore and Hong Kong. Road Transp. Res. 2003, 12, 41–51. [Google Scholar]
  34. Demographia. Demographia World Urban Areas, 16th ed.; Demographia: Belleville, IL, USA, 2020; Available online: http://www.demographia.com/db-worldua.pdf (accessed on 12 May 2020).
  35. Facchinetti-Mannone, V. La nodalité des gares TGV péripheriques. Cahiers Sci. Transp. 2005, 48, 45–58. [Google Scholar]
  36. Rete Ferroviaria Italiana, RFI. Classificazione Degli Impianti Ferroviari Aperti al Pubblico; Comunicazione operativa n. 242/RFI del 27 luglio 2007; RFI: Rome, Italy, 2007. [Google Scholar]
  37. Bell, D. Intermodal Mobility Hubs and User Needs. Soc. Sci. 2019, 8, 65. [Google Scholar] [CrossRef] [Green Version]
  38. Hernandez, S.; Monzón, A. Key factors for defining an efficient urban transport interchange: Users’ perceptions. Cities 2016, 50, 158–167. [Google Scholar] [CrossRef] [Green Version]
  39. Chen, C.; Hickman, R.; Saxena, S. Improving Interchanges: Toward Better Multimodal Railway Hubs in the People’s Republic of China; Asian Development Bank (ADB), Ed.; Asian Development Bank: Mandaluyong, Philippines, 2014; Available online: https://www.adb.org/publications/improving-interchanges-prc (accessed on 24 April 2020).
  40. Transport for London. Interchange Best Practice Guidelines 2009—Quick Reference Guide; Transport for London: London, UK, 2009. [CrossRef] [Green Version]
  41. LINK Expert Working Groups. 2010. Available online: http://www.rupprecht-consult.eu/uploads/tx_rupprecht/LINK_recommendations_brochure_fullversion_final.pdf (accessed on 29 October 2020).
  42. ERTRAC Working Group: Joint ERTRAC-ERRAC-ALICE Working Group on Urban Mobility. Integrated Urban Mobility Roadmap. 2017. Available online: https://www.ertrac.org/index.php?page=ertrac-publications (accessed on 27 October 2020).
  43. Lamíquiz Daudén, F.J.; Carpio-Pinedo, J.; García-Pastor, G. Transport interchange and local urban environment integration. XI Congreso de Ingenieria del Transporte (CIT 2014). Procedia Soc. Behav. Sci. 2014, 160, 215–223. [Google Scholar] [CrossRef] [Green Version]
  44. Lucietti, L.; Hoogendoorn, C.; Cré, I. New tools and strategies for design and operation of urban transport interchanges. 6th Transport Research Arena (TRA) April 18–21, 2016. Transp. Res. Procedia 2016, 14, 1240–1249. [Google Scholar] [CrossRef] [Green Version]
  45. Bryniarska, Z.; Zakowscka, L. Multi-criteria evaluation of public transport interchanges. 3rd Conference on Sustainable Urban Mobility, 3rd CSUM 2016, 26–27 May 2016, Volos, Greece. Transp. Res. Procedia 2017, 24, 25–32. [Google Scholar] [CrossRef]
  46. Steinfeld, E. Universal Design of Mass Transportation. In Universal Design Handbook; Preiser, W.F.E., Smith, K.H., Eds.; McGraw-Hill Companies, Inc.: New York, NY, USA, 2001; Chapter 19; pp. 19.1–19.10. [Google Scholar]
  47. Van Soest, D.; Tight, M.R.; Rogers, C.D.F. Exploring the distances people walk to access public transport. Transp. Rev. 2019, 40, 1–23. [Google Scholar] [CrossRef]
  48. Liu, C.; Tapani, A.; Kristoffersson, I.; Rydergren, C.; Jonsson, D. Development of a large-scale transport model with focus on cycling. Transp. Res. Part A 2020, 134, 164–183. [Google Scholar] [CrossRef]
  49. Fistola, R.; Gallo, M.; La Rocca, A.R.; Russo, F. The Effectiveness of Urban Cycle Lanes: From Dyscrasias to Potential Solutions. Sustainability 2020, 12, 2321. [Google Scholar] [CrossRef] [Green Version]
  50. Rüetschi, U.J.; Timpf, S. Modelling wayfinding in public transport: Network space. In Lecture Notes in Computer Science, Spatial Cognition IV. Reasoning, Action, Interaction. International Conference Spatial Cognition 2004, Frauenchiemsee, Germany, 11–13 October 2004; Freksa, C., Knauff, M., Krieg-Brückner, B., Nebel, B., Barkowsky, T., Eds.; Revised Selected Papers; Springer: Berlin/Heidelberg, Germany, 2005; Volume 3343. [Google Scholar] [CrossRef]
  51. Meng, M.; Rau, A.; Mahardhika, H. Public transport travel time perception: Effects of socioeconomic characteristics, trip characteristics and facility usage. Transp. Res. Part A Policy Pract. 2018, 114, 24–37. [Google Scholar] [CrossRef]
  52. Conticelli, E.; Tondelli, S. Railway Station Role in Composing Urban Conflicts. Trimest. Lab. Territ. Mobil. Ambient. (TeMA Lab.) 2011, 4, 47–48. [Google Scholar] [CrossRef]
  53. Desiderio, N. Requirements of Users and Operators on the Design and Operation of Intermodal Interchanges. Technishe Universitat Darmstadt. Fachgebiet Verkehrsplanung und Verkehrstechnik. 2004. Available online: http://www.verkehr.tudarmstadt.de/media/verkehr/fgvv/for/publik/S007.pdf (accessed on 2 November 2020).
  54. Conticelli, E. Assessing the potential of railway station redevelopment in urban regeneration policies: An Italian case study. Procedia Engineering 2011 International Conference on Green Buildings and Sustainable Cities. Procedia Eng. 2011, 21, 1096–1103. [Google Scholar] [CrossRef] [Green Version]
  55. Beirão, G.; Sarsfield Cabral, J.A. Understanding attitudes towards public transport and private car: A qualitative study. Transp. Policy 2007, 14, 478–489. [Google Scholar] [CrossRef]
  56. Currie, G.; Bromley, L. Developing measures of public transport schedule coordination quality. In Proceedings of the 28th Australasian Transport Research Forum (ATRF), Sydney, Australia, 28–30 August 2005; Volume 28. [Google Scholar]
  57. Ceder, A.; Golany, B.; Tal, O. Creating bus timetables with maximal synchronization. Transp. Res. Part A Policy Pract. 2001, 35, 913–928. [Google Scholar] [CrossRef]
  58. Cevallos, F.; Zhao, F. Minimizing transfer times in public transit network with genetic algorithm. Transp. Res. Rec. 2006, 1971, 74–79. [Google Scholar] [CrossRef]
  59. Shafahi, Y.; Khani, A. A practical model for transfer optimization in a transit network: Model formulations and solutions. Transp. Res. Part A Policy Pract. 2010, 44, 377–389. [Google Scholar] [CrossRef]
  60. Liu, T.; Ceder, A. Synchronization of public transport timetabling with multiple vehicle types. Transp. Res. Rec. 2016, 2539, 84–93. [Google Scholar] [CrossRef]
  61. European Commission. Sustainable Urban Mobility: European Policy, Practice and Solutions; European Commission: Brussels, Belgium, 2017. [Google Scholar] [CrossRef]
  62. Schwanen, T.; Banister, D.; Anable, J. Rethinking habits and their role in behaviour change: The case of low-carbon mobility. J. Transp. Geogr. 2012, 24, 522–532. [Google Scholar] [CrossRef]
  63. Yen, B.T.H.; Mulley, C.; Burke, M. Gamification in Transport Interventions: Another Way to Improve Travel Behavioural Change; Working Paper ITLS-WP-18-06; Established under the Australian Research Council’s Key Centre Program; Institute of Transport and Logistics Studies: Sydney, Australia, 2018. [Google Scholar]
  64. Kazhamiakin, R.; Marconi, A.; Perillo, M.; Pistore, M.; Valetto, G.; Piras, L.; Avesani, F.; Perri, N. Using gamification to incentivize sustainable urban mobility. In Proceedings of the 2015 IEEE 1st International Smart Cities Conference, ISC2 2015, Guadalajara, Mexico, 25–28 October 2015. [Google Scholar] [CrossRef]
  65. Sopjani, L.; Stier, J.; Ritzén, S.; Hesselgren, M.; Georén, P. Involving users and user roles in the transition to sustainable mobility systems: The case of light electric vehicle sharing in Sweden. Transp. Res. Part D Transp. Environ. 2019, 71, 207–221. [Google Scholar] [CrossRef]
  66. Conticelli, E.; Saavedra Rosas, P.I.; Tondelli, S.; Gobbi, G. Decision Support System for Evaluating the Performance of Modal Interchange; AMS Acta: Bologna, Italy, 2021. [Google Scholar] [CrossRef]
  67. Chan, N.W.; Samat, N. Decision support system for urban planning. In Sustainable Urban Development Textbook; Chan, N.W., Imura, H., Nakamura, A., Ao, M., Eds.; Water Watch Penang & Yokohama City University: Yokohama, Japan, 2016; Chapter 31; pp. 199–203. [Google Scholar]
Figure 1. The nine domains identified and their relevance to the policy and project levels.
Sustainability 13 01001 g001
Figure 2. The Decision Support System operation.
Sustainability 13 01001 g002
Figure 3. Example of the radar graph obtained after the assessment of an interchange. The Quality of the Interchange Environment score is below the fair threshold, while the Accessibility score is near the high-quality value.
Sustainability 13 01001 g003
Table 1. Interchange node typologies identified in the urban areas.
Reference CategoryInterchange Node
Typology
Transport Means Involved
APrimary stationHigh-speed, intercity train
Regional/Metropolitan train
Interregional/Regional coach
Metro/Bus Rapid Transit (BRT)
Local bus and tram
Taxi
Private car/motorcycle
Sharing services (bike, scooter, car, etc.)
Bicycle
On foot
BSecondary stationIntercity train
Interregional and regional train
Metropolitan train
Interregional/Regional coach
Metro/BRT
Local bus and tram
Taxi
Private car/motorcycle
Sharing services (bike, scooter, car, etc.)
Bicycle
On foot
CMetropolitan stationMetro/Bus Rapid Transit (BRT)
Local bus and tram
Private car/motorcycle
Bicycle
Sharing services (bike, scooter, car, etc.)
On foot
DOutskirt park and
ride interchange
Private car/motorcycle
Metro/BRT
Local bus and tram
Bicycle
Sharing services (bike, scooter, car, etc.)
On foot
Table 2. Key Factors (KFs) relevant to the Accessibility domain.
Accessibility
Key FactorsSub-Categories
Universal designInterchange spaces designed for all passengers, particularly those with reduced mobility (presence of boarding equipment, ramps, escalators, staircase aids for bikes, wheelchairs, strollers, etc.)
Presence of dedicated staff helping people to get assistance inside the node, particularly for those with impairments
Accessible pedestrian routesEnsure routes in the surroundings have the same accessibility standards as within the interchange node’s space and the availability of good connections with the surrounding paths and parking areas
Parking facilities (near the interchange node)Presence of cycle parking areas
Presence of parking areas for private motorised vehicles (cars, motorcycles, etc.)
Presence of recharging facilities for e-cars
Presence of kiss and ride lanes
Presence of taxi stands
Shared mobilityPresence of hiring spots of all the existing sharing systems in the surroundings (car/bike/scooter/e-car-sharing systems)
Wayfinding Basic design solutions to ensure consistent, clear, and understandable signage, to help passengers moving within the interchange node (maps, direction signs, and local main information areas)
Additional design solutions to ensure consistent, clear, and understandable signage, to help passengers moving within the interchange node (totem pole, platform signage, light signals, etc.)
Table 3. KFs relevant to the Quality of the Interchange Environment domain.
Quality of the Interchange Environment
Key FactorsSub-Categories
Urban realmPresence of basic facilities (within or close to the interchange area): Toilets, seats, and covered waiting areas
Presence of facilities that add value to the user’s experience, especially during the waiting time (catering and collection lockers, WIFI, waiting areas, etc.)
Presence of additional services both for travellers and city users (retail) inside and/or nearby the node
Permeability High interchange node permeability from all directions to pedestrians (node as an urban connection, not a barrier)
Perception Clear relationship with the urban realm (e.g., using the same architectural style to reinforce legibility)
CleanlinessHigh standards of cleanliness and maintenance of the node’s spaces (covered spaces, waiting rooms, presence of bins, etc.)
Table 4. KFs relevant to the Safety and Security domain.
Safety and Security
Key FactorsSub-Categories
Traffic safetyMinimised interferences between pedestrians and transport flow, with urban design solutions that ensure high levels of safety, especially in road crossing (lower speed limits near the stops, pedestrian crossings, etc.)
Design for securityDesign of spaces avoiding isolated, dark or segregated areas that can be not safe
Security managementVideo surveillance, security supervision, etc.
Table 5. KFs relevant to the Efficiency of the Interchange domain.
Efficiency of the Interchange
Key FactorsSub-Categories
Efficient vehicle movementsPresence of enough space for movement of transport vehicles involved in the interchange (e.g., vehicles access, manoeuvring or transit area, etc.)
Presence of proper signals for drivers approaching the interchange area (e.g., stop or parking areas, transit routes, service area, etc.)
Proximity (short pedestrian routes for passengers)Presence of short and direct routes for pedestrians connecting facilities and destinations related to the passenger’s trip
Efficient fare payment and tickets validationPresence of ticketing machines in convenient locations to purchase and/or validate tickets near the interchange node
Presence of ticket offices in convenient locations or near the interchange node to purchase tickets
Flexibility in time and useInterchange node design that eases the accommodation of new transport modes or the implementation of the same system
Table 6. KFs relevant to the Planning the Interchange domain.
Planning the Interchange
Key FactorsSub-Categories
Design standards for the interchange as a transport hub Promote efficient physical organisation of interchange spaces for a good movement of passengers and vehicles
Design standards for the interchange as an urban placeEnsure a good level of transport facilities for passengers in the interchange space
ProximityBoost physical proximity between different means of transport
Efficient fare payment and ticket validation in the interchange nodesPromote the necessary equipment of ticketing stations and services to purchase and validate tickets near the interchange node
Level of interchangeFoster the maximisation of the no. of low-carbon means of transport interconnected in the main transport hubs
Safety and securityEnsure good levels of safety (from traffic) and security conditions in the interchange environment
Table 7. KFs relevant to the Service information domain.
Service Information at the Policy LevelService Information at the Project Level
Key-FactorsSub-CategoriesKey-FactorsSub-Categories
Basic components of service information at transport stopsPromotion of a diffused presence of timetables and real-time information panelsBasic components of service informationPresence of fixed timetable panels within the node
Information servicesEnsure the adoption of call centers and other services for delivering information (booking services also)Presence of real-time information and timetable panels within the node
Online information Ensure the availability of apps/websites allowing passengers to access information in advance or while travelling (integrated journey planner)Info point with staffPresence of info points/offices with personal available to help users
Table 8. KFs relevant to the Service Coordination domain.
Service Coordination
Key FactorsSub-Categories
Timetable coordinationAdopt coordinated timetables (departures and arrivals) of different means of transport to reduce transfer time and improve customers’ convenience
Delay managementAdopt procedures connecting services waiting for each other in the event of minor delays, especially when frequencies are low
Adopt procedures in case of significant delays and service disruptions
Ticket coordinationAdopt an integrated multimodal ticketing system
StandardisationFoster uniform technical, service, and design specifications (particularly information, ticketing, interchange design)
MaaSPromote the use of Mobility as a Service (MaaS) approach and infrastructures for organising the service coordination
Table 9. KFs relevant to the Changing Behaviours domain.
Changing Behaviours
Key FactorsSub-Categories
Learning by doingEncourage practical activities and demonstrations that help users discovering the benefits of multimodal, interconnected transport system
SensibilisationPromote communication campaigns that help users discovering the benefits of multimodal, interconnected transport system
GamificationPromote competitions that help users discovering the benefits of multimodal, interconnected transport system
Bottom-up approachesFoster the direct engagement of relevant target groups in organising the activities
Table 10. KFs relevant for Policies, Norms and Regulations domain.
Policies, Norms and Regulations
Key FactorsSub-Categories
Joint governance and initiativesAdopt targeted policy actions, framework conditions, recommendations, norms, etc. involving different transport service providers focused on promoting multimodal low carbon mobility
Coordination and cooperationFoster an interchange facility management agreement, identifying interfaces and responsibilities between all the parties involved in managing and serving the interconnected services
Sharing solutionsActivate and promote round tables and shared decision processes with relevant stakeholders, to build solutions enabling modal interchange and seamless mobility
Adopt participatory processes, involving citizens and transport users, to co-create solutions enabling modal interchange and seamless mobility
Table 11. Example of scores adopted for weighing the KFs of the Service Coordination domain.
Service Coordination
Key FactorsSub-CategoriesKF Impact
3 = high
2 = medium
1 = low
Timetable coordinationCoordinated timetables (coordinated departures and arrivals) of different means of transport to reduce transfer time and improve customers’ convenience3
Delay managementPresence of procedures connecting services wait for each other in the event of minor delays, especially when frequencies are low2
Presence of adoptable procedures in case of significant delays and service disruptions1
Ticket coordinationPresence of a comprehensive multimodal ticketing system3
StandardisationPresence of uniform technical, service, and design specifications (particularly information, ticketing, interchange design)2
MaaSUse of Mobility as a Service (MaaS) approach and infrastructures for organising the service coordination1
Table 12. Example of KFs relevance identification adopted for the Quality of the Interchange Environment domain, represented by the scores in the columns associated with the four different node types selected.
Quality of the Interchange Environment
Key Factors Sub-CategoriesKey Factor
Impact
KEY FACTOR RELEVANCE
A
Primary Station
B
Secondary
Station
C
Metropolitan Stop
D
Outskirt Park
And Ride
Interch
Urban realmPresence of basic facilities: Toilets, seats and covered waiting areas32211
Presence of facilities that add value to the user’s experience, especially during the waiting time (catering and collection lockers, WIFI, waiting areas, etc.)32210.5
Presence of additional services both for travellers and city users (retail) inside and/or nearby the node22211
Permeability High interchange node permeability from all directions to pedestrians (node as an urban connection not a barrier)22221
Perception Clear relationship with the urban realm (e.g., using the same architectural style to reinforce legibility)22210.5
CleanlinessHigh standards of cleanliness and maintenance of the node’s spaces (covered spaces, waiting rooms, presence of bins, etc.)32222
Table 13. Example of the KF quality scoring adopted in the Quality of the Interchange Environment domain for assessing a primary node.
Quality of the Interchange Environment
Key FactorsSub-CategoriesKF
Impact
KF Relevance KF QualityTotal Performance Score
A
Primary
Station
Urban realmPresence of basic facilities: Toilets, seats and covered waiting areas32424
Presence of facilities that add value to the user’s experience, especially during the waiting time 32530
Presence of additional services both for travellers and city users (retail) inside and/or nearby the node22520
Permeability High interchange node permeability from all directions to pedestrians 22312
Perception Clear relationship with the urban realm 2228
CleanlinessHigh standards of cleanliness and maintenance of the node’s spaces 3216
Total score of the domain:64
Publisher’s Note: MDPI stays neutral with regard to jurisdictional claims in published maps and institutional affiliations.

