Research on the Vehicle Emission Characteristics and Its Prevention and Control Strategy in the Central Plains Urban Agglomeration, China


1
College of Resources and Environment, Shanxi University of Finance & Economics, Taiyuan 030006, China
2
School of the Environment, Nanjing University, Nanjing 210046, China
3
School of Geographic & Oceanographic Sciences, Nanjing University, Nanjing 210046, China
*
Author to whom correspondence should be addressed.
Sustainability 2021, 13(3), 1119; https://0-doi-org.brum.beds.ac.uk/10.3390/su13031119
Submission received: 2 December 2020
/
Revised: 11 January 2021
/
Accepted: 11 January 2021
/
Published: 21 January 2021
(This article belongs to the Special Issue Effects of CO2 Emissions Control on Transportation and Its Energy Use)
Abstract
:With rapid economic development and urbanization in China, vehicle emissions are increasingly becoming one of the major factors affecting air quality. The Central Plains Urban Agglomeration (CPUA), which has undergone a fast increase in vehicle population and has an advantageous geographical location, was selected as the study area. Vehicle emissions estimated based on the COPERT IV model in this area changed greatly between 1999 and 2015, during which time the emissions of NOx, CO2, and NH3 increased markedly. Passenger cars and light-duty vehicles were the main contributors to pollutants CO and non-methane volatile organic compounds (NMVOC) emissions. Heavy-duty trucks and buses were the important contributors to pollutants NOx, PM2.5, and PM10. Passenger cars were the major contributors to CO2, CH4, N2O, NH3, and SO2. The city with the most emissions is Zhengzhou, followed by Luoyang, Shangqiu, and Zhoukou. The spatial distribution of vehicle emissions has formed around or tended to concentrate in urban centers. Then, this study also predicts the vehicle emissions from 2015 to 2025 and designs ten policy scenarios for the prevention and control of emissions to evaluate the emission reduction effect. The radical integrated scenario was most effective for controlling CO, NMVOC, NOx, PM2.5, PM10, CO2, N2O, and NH3 emissions than any one scenario by itself.
1. Introduction
In recent years, the environmental problems caused by vehicular pollutants have become increasingly serious in China [1,2]. In particular, the pollution in some large- and medium-sized cities is characterized by a combination of pollutants from coal smoke and vehicle emissions. Vehicle emissions have become one of the main sources of particulate matter and other serious air quality problems, as chemical industries have moved out of urban centers. In 2015, the NOx emission from vehicles totalled 5.85 million tons, accounting for approximately 30% of the total emission of air pollutants in China. The contribution rate of vehicles to the fine particulate matter (PM2.5) concentration reaches 30%, or even more than 50% under extremely unfavored conditions [3]. Air pollution exacerbated by weather has gradually varied from being a local (i.e., city-level) to a regional problem, with such problems being particularly severe in China. In a global economy, many scholars have pointed out that the production of internationally traded commodities in China and other developing countries results in the transfer of implicit carbon emissions—“carbon leakage”, which aggravates the environmental pollution [4]. The contributions of vehicle emissions to regional air pollution are increasing [5,6]. Facing the new round of emission reduction targets in the 13th Five-Year Plan, comprehensive vehicle emission inventories are crucial to conduct air quality assessments and to assist in policy making.
Studies of vehicle emissions and control strategies aim to identify the dominant sources of vehicle-based pollutant and their temporal and spatial distribution characteristics and establish emission control policy suitable for the current situation. Many researchers have studied vehicle emission using different methods for specific areas [7,8,9]. Some Chinese scholars have also researched the emission inventories and characteristics of vehicular pollutants of urban agglomerations in developed areas, including the Beijing-Tianjin-Hebei Region [10], the Yangtze River Delta [11], and the Pearl River Delta [12]. Furthermore, the effect of vehicle emissions reduction options has been evaluated based on emission inventories. For example, Sri et al. (2014) established vehicular CO and NOx emission inventories for southeast Texas in 2005 using the MOVES and MOBILE6.2 models and evaluated them by comparison with the source-oriented air quality modeling method [8]. In China, Li (2015) set up the five reduction scenarios based on the vehicle emission inventory between 2007 and 2011 and assessed their emission reduction effects of Beijing–Tianjin–Hebei region [13]. Liu et al. (2017) forecasted air pollutant emissions by vehicles under the no-control scenario in 2020 in the Pearl River Delta region and then calculated the emissions effect under five reduction scenarios and concluded that the updated standard emission scenario was the best way to substantially reduce air pollutants from vehicles [12].
There are limitations of the abovementioned related studies. For example, most research has tended to focus on the vehicle emission inventories, including either the emission characteristics of vehicle pollution in urban agglomerations with developed economies or the reduction in vehicle emissions from the perspective of scenario analysis. In addition, these evaluations were not sufficiently comprehensive because vehicles using new sources of energy, which have been widely promoted in China in recent years, were not performed as such. With the implementation of a growth strategy in central China, the urban agglomerations in this region (e.g., the Central Plains Urban Agglomeration (CPUA)) have achieved rapid economic development and growth in the number of vehicles, which inevitably emit large amounts of pollutants. However, no study pays attention to the vehicle emissions and reduction strategies of this region. In addition, the disharmonious situation in which the number of vehicles is growing faster than the regional economy has occurred in some less developed regions, especially in the CPUA of China. The potential air pollution problem will exceed our imagination, and the corresponding environmental management measures will be more difficult than in developed areas and emission reduction will be harder.
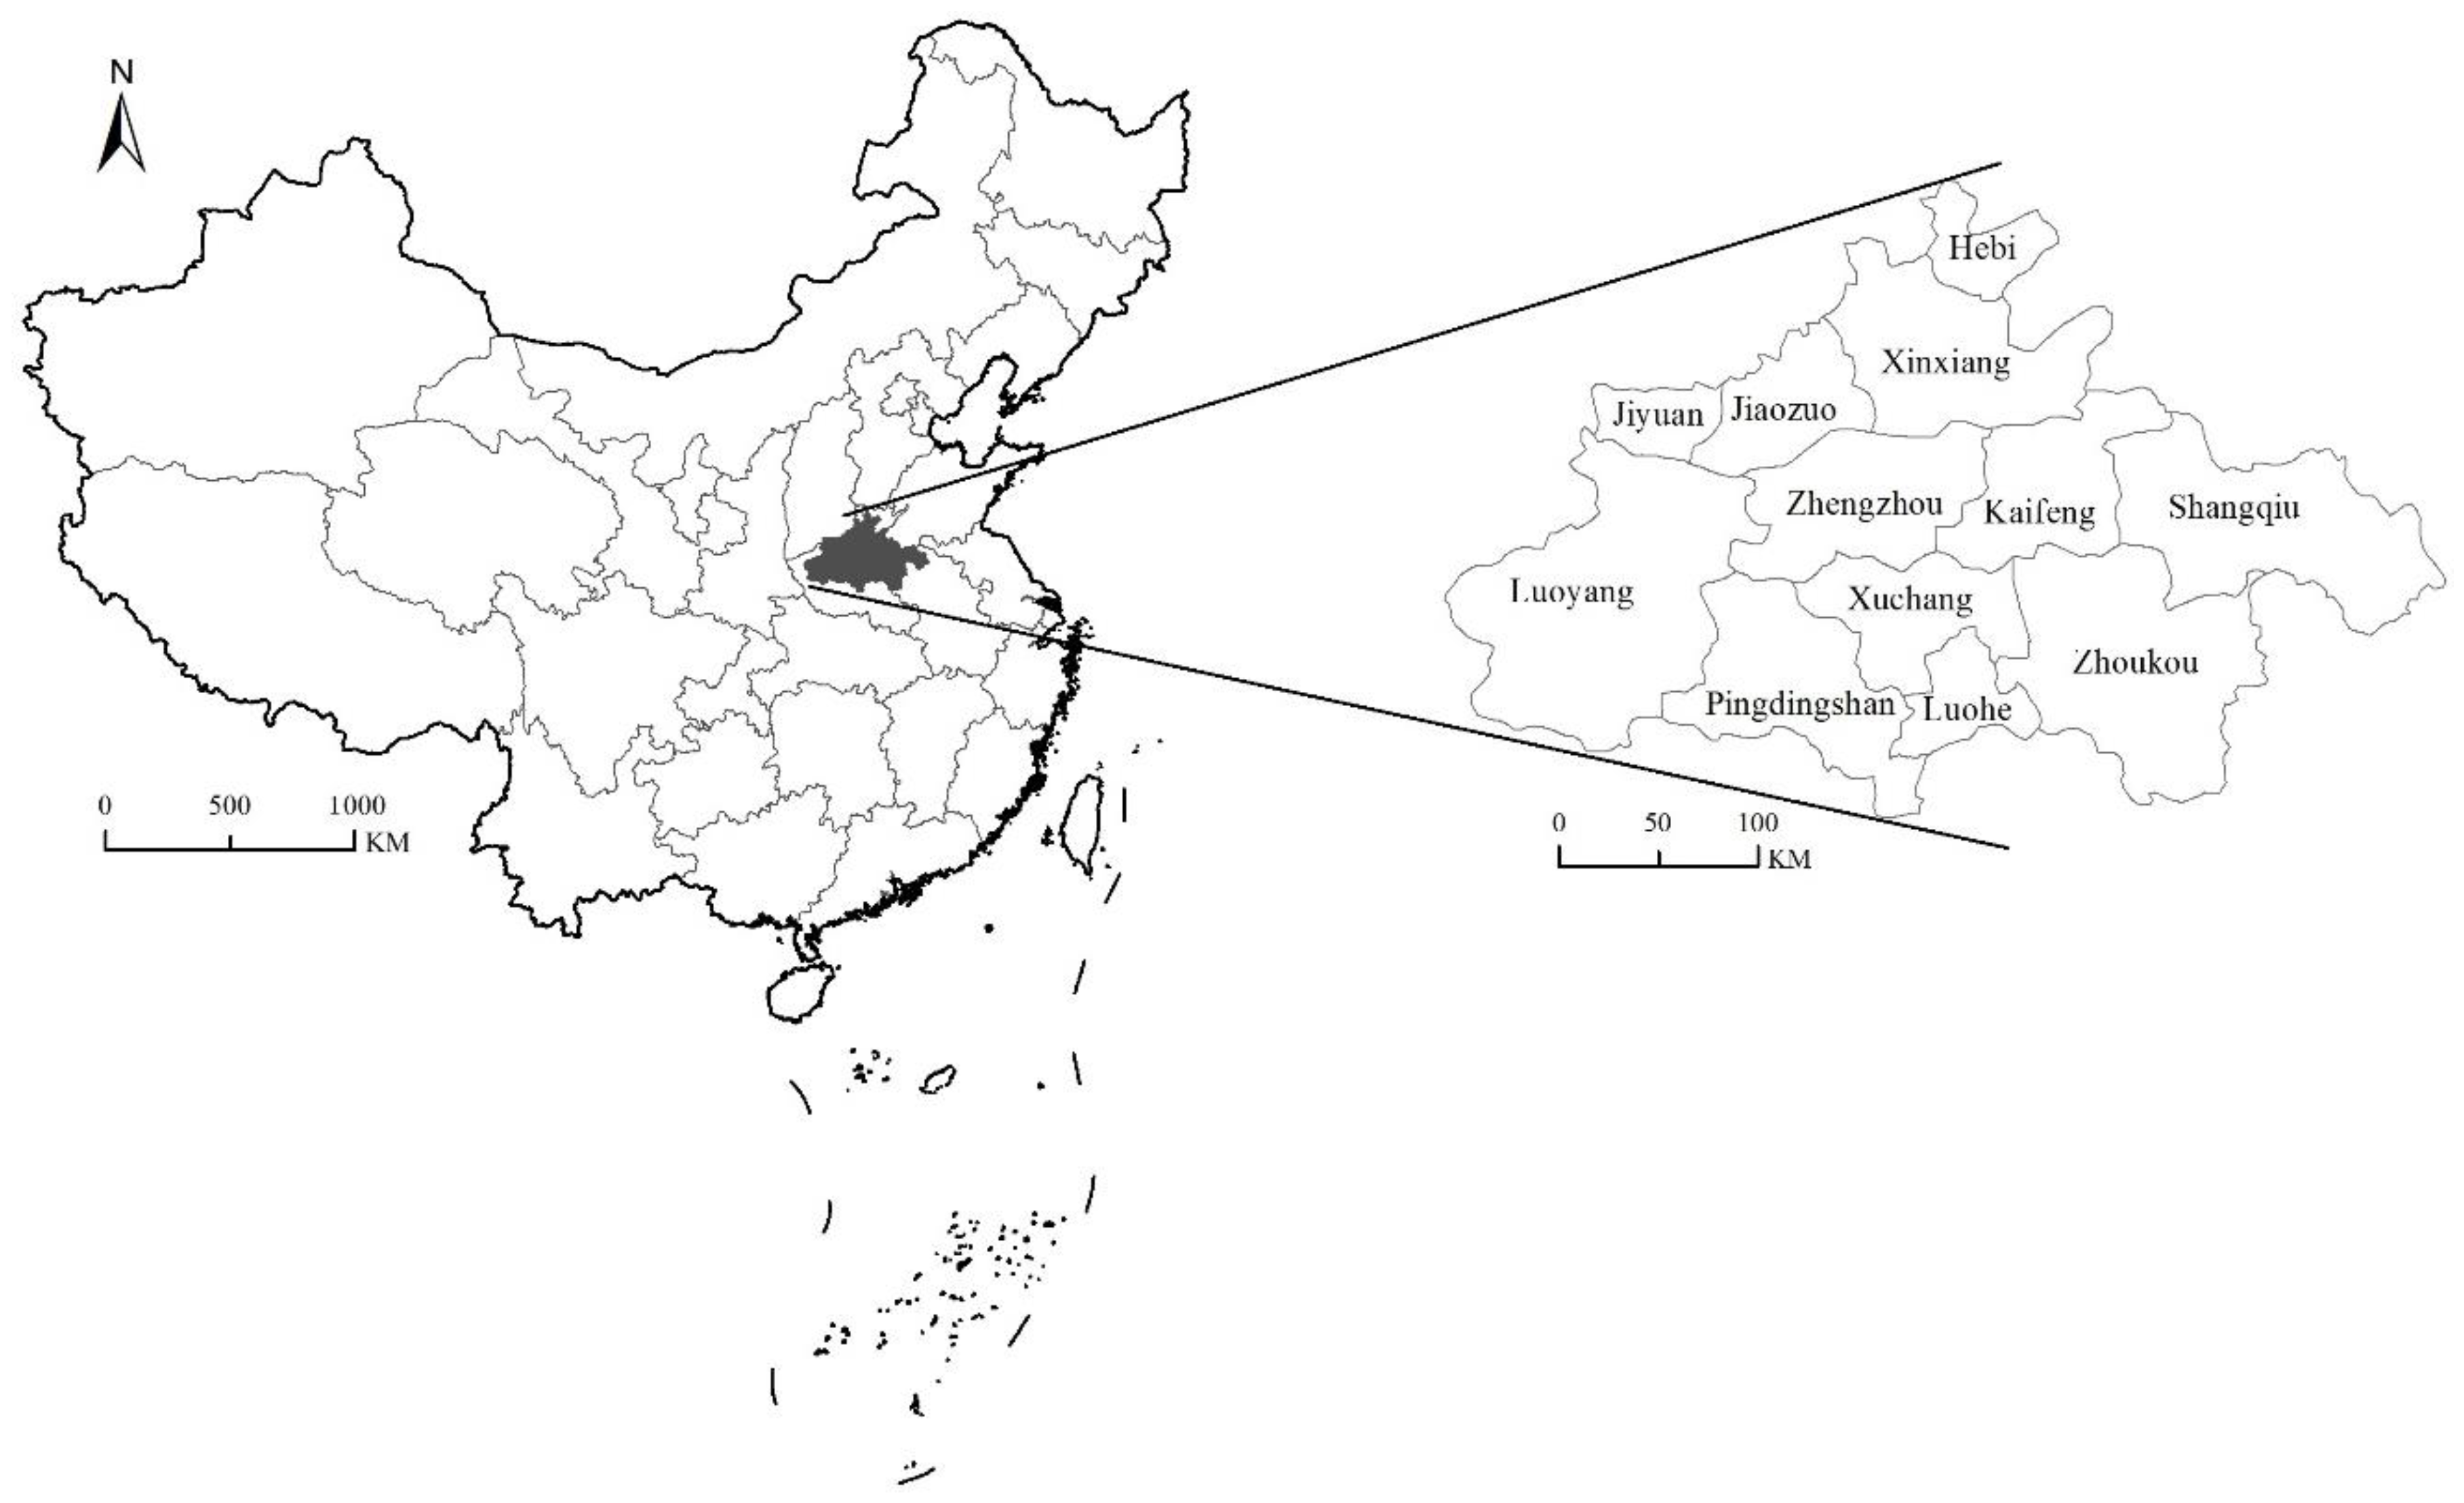
The CPUA, located in Central China, plays an important role in promoting the growth of this region and driving the economic development of the central and western regions of China and has great development potential (Figure 1). The CPUA is the largest urban agglomeration in Central China, with a dense population, a strong economy, a rapid industrialization process, a high urbanization level, and an advantage in its prominent transportation location. However, the CPUA, located in Henan Province in China, is the second largest source of PM2.5 pollution after the Beijing–Tianjin–Hebei region. Scholars studied the on-road vehicle emissions in China and concluded that province-level vehicle emissions were significant in Guangdong, Shandong, Hebei, Jiangsu, and Henan [5]. The first four provinces have been studied by other scholars, but no studies have focused on air pollutants from vehicles in Henan Province. For the past few years, the number of vehicles in the CPUA has continuously increased under the rapid development of the economy as well as the strong support of national policies. In the CPUA, the number of vehicles increased from 1.62 million to 10.66 million between 1999 and 2015, with an annual mean growth rate of 12.66%. The problem of vehicular pollutants has received constant attention. As the new economic growth pole of China, the vibrant economy of this area has brought about the development of freight transportation, contributing to the increase in vehicle number. The freight traffic of highways reached 1915.72 million tons in 2015, and the number of freight vehicles also increased [14]. Moreover, an economic growth plant has been implemented in this region. As a consequence, it is expected that the number of vehicles will further increase. Hence, it is crucial to develop comprehensive and detailed vehicle emission inventories for the CPUA because of its specific conditions.
The purposes of this work are to establish vehicle emission inventories and emission prevention and control strategies for the CPUA. This work focuses on emission reduction policies in the CPUA and predicts the effects of reducing vehicle pollutants under different pollution control strategies based on the development of a multi-pollutant vehicle emissions inventory for the CPUA between 1999 and 2015, and analyzes its emission trends and characteristics. The paper proceeds as follows. Section 1 presents the research background and relevant literatures. Section 2 is dedicated to the underlying methodologies, including the pollutant emission estimation method and design of emission prevention and control scenarios. In Section 3, we present the estimation results and discussion from different aspects, and Section 4 concludes the paper.
2. Methodology
2.1. Emission Estimates
The general method for obtaining vehicle emissions consists of multiplying the number of vehicles in circulation by vehicles kilometers traveled and emission factors, as shown in Equation (1):
where m represents 12 cities in the study area; n represents ten pollutants to be studied; i represents the five vehicle categories, including passenger car (PC), light-duty vehicle (LDV), bus (BUS), heavy-duty truck (HDT), and motorcycle (MC); j represents the emission standards implemented by vehicles; and E, P, VKT, and EF represent the pollutant emissions, vehicle population, the mean annual vehicle kilometers travelled (km), and the pollutant emission factors (g/km) by vehicles in the study area for each year, respectively.
2.1.1. Vehicle Population
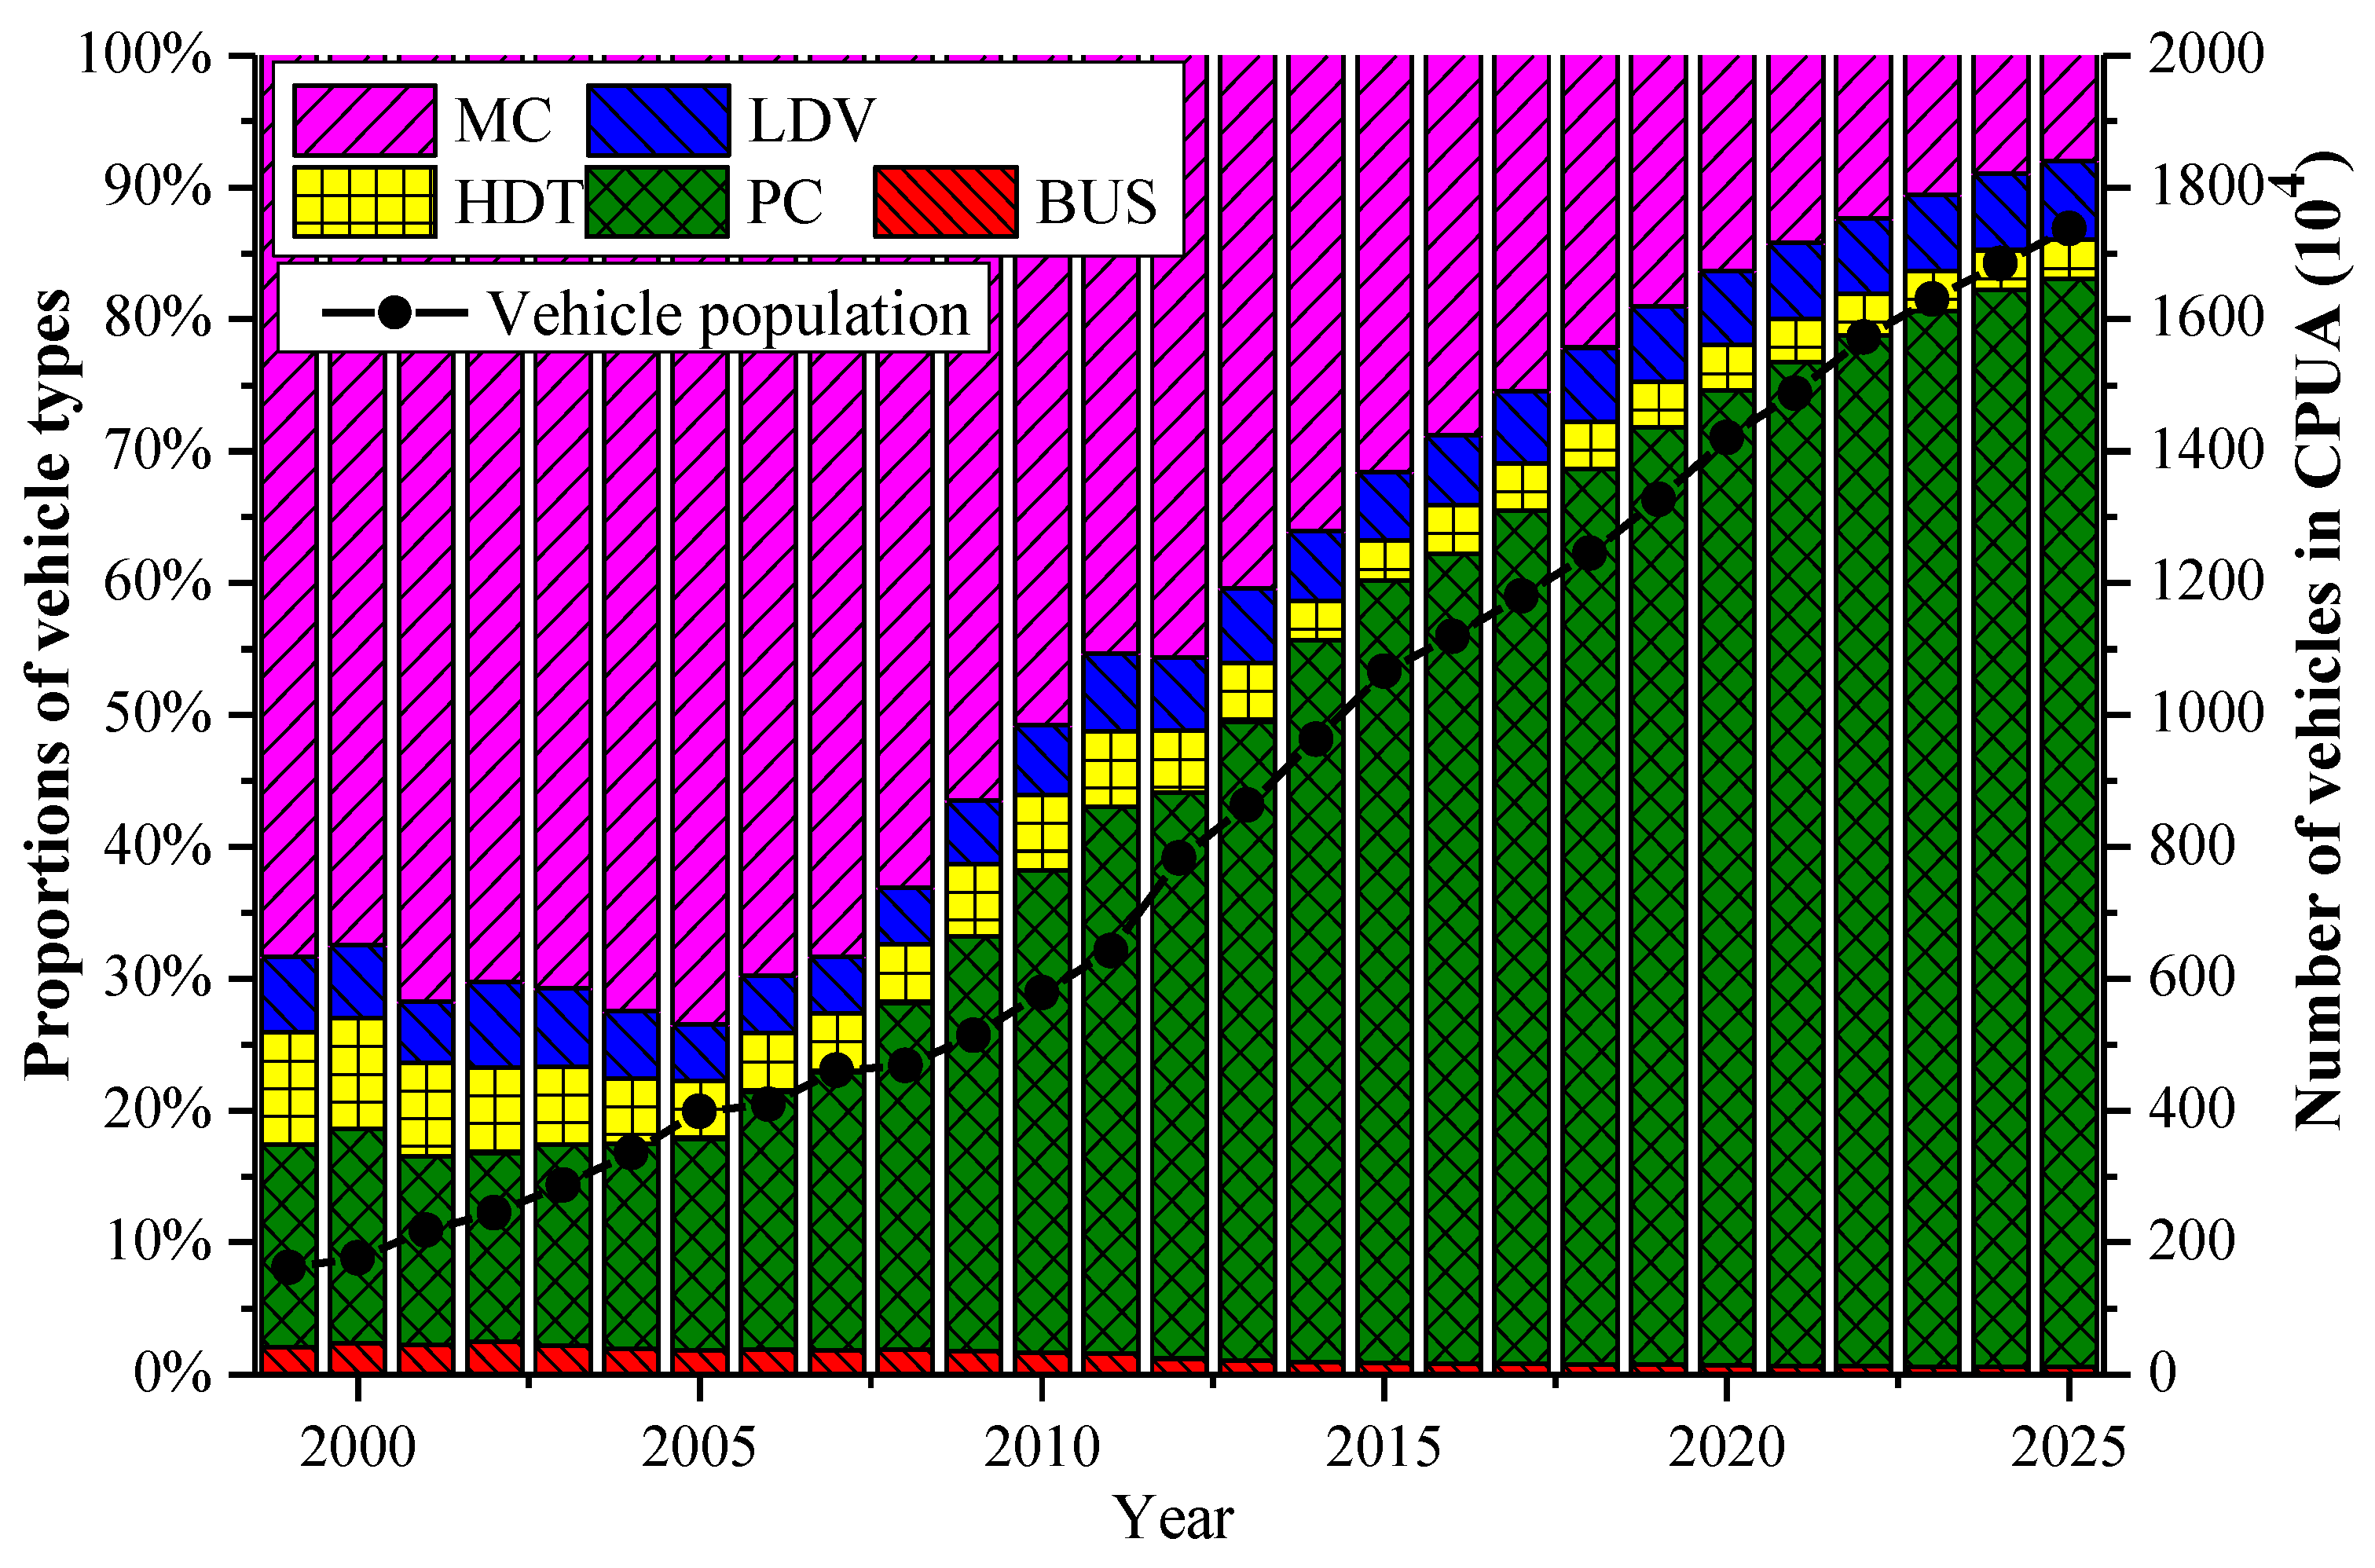
The vehicle population of the 12 cities in the CPUA was obtained from the relevant statistical yearbooks [14,15,16] and the national economic and social development statistical bulletins. This study argues that the newly produced vehicles must implement the new emission standard once it has been promulgated [17,18] (Wang et al., 2010; Sun et al., 2016). For the CPUA, PC implemented State I emission standards in 2000. By 2015, different emission standards have been implemented for all types of vehicles to reduce emissions of pollutants. The timetable for the implementation of vehicle emission standards in the study area is shown in Table 1. PC population in the future (2016–2025) was predicted using the Gompertz method (the fitting parameter values are shown in Table A1 of Appendix A), and the number of the other four types of vehicles was predicted based on the regression curve method [19]. The vehicle populations implemented different vehicle emission standards were calculated based on the new vehicle registration numbers, vehicle survival rates, and the implementation time of the emission standards. The relevant calculation methods and formulas are described in our previous study [20]. The CPUA vehicle populations from 2016 to 2025 are shown in Figure 2.
2.1.2. Vehicle Kilometers Travelled
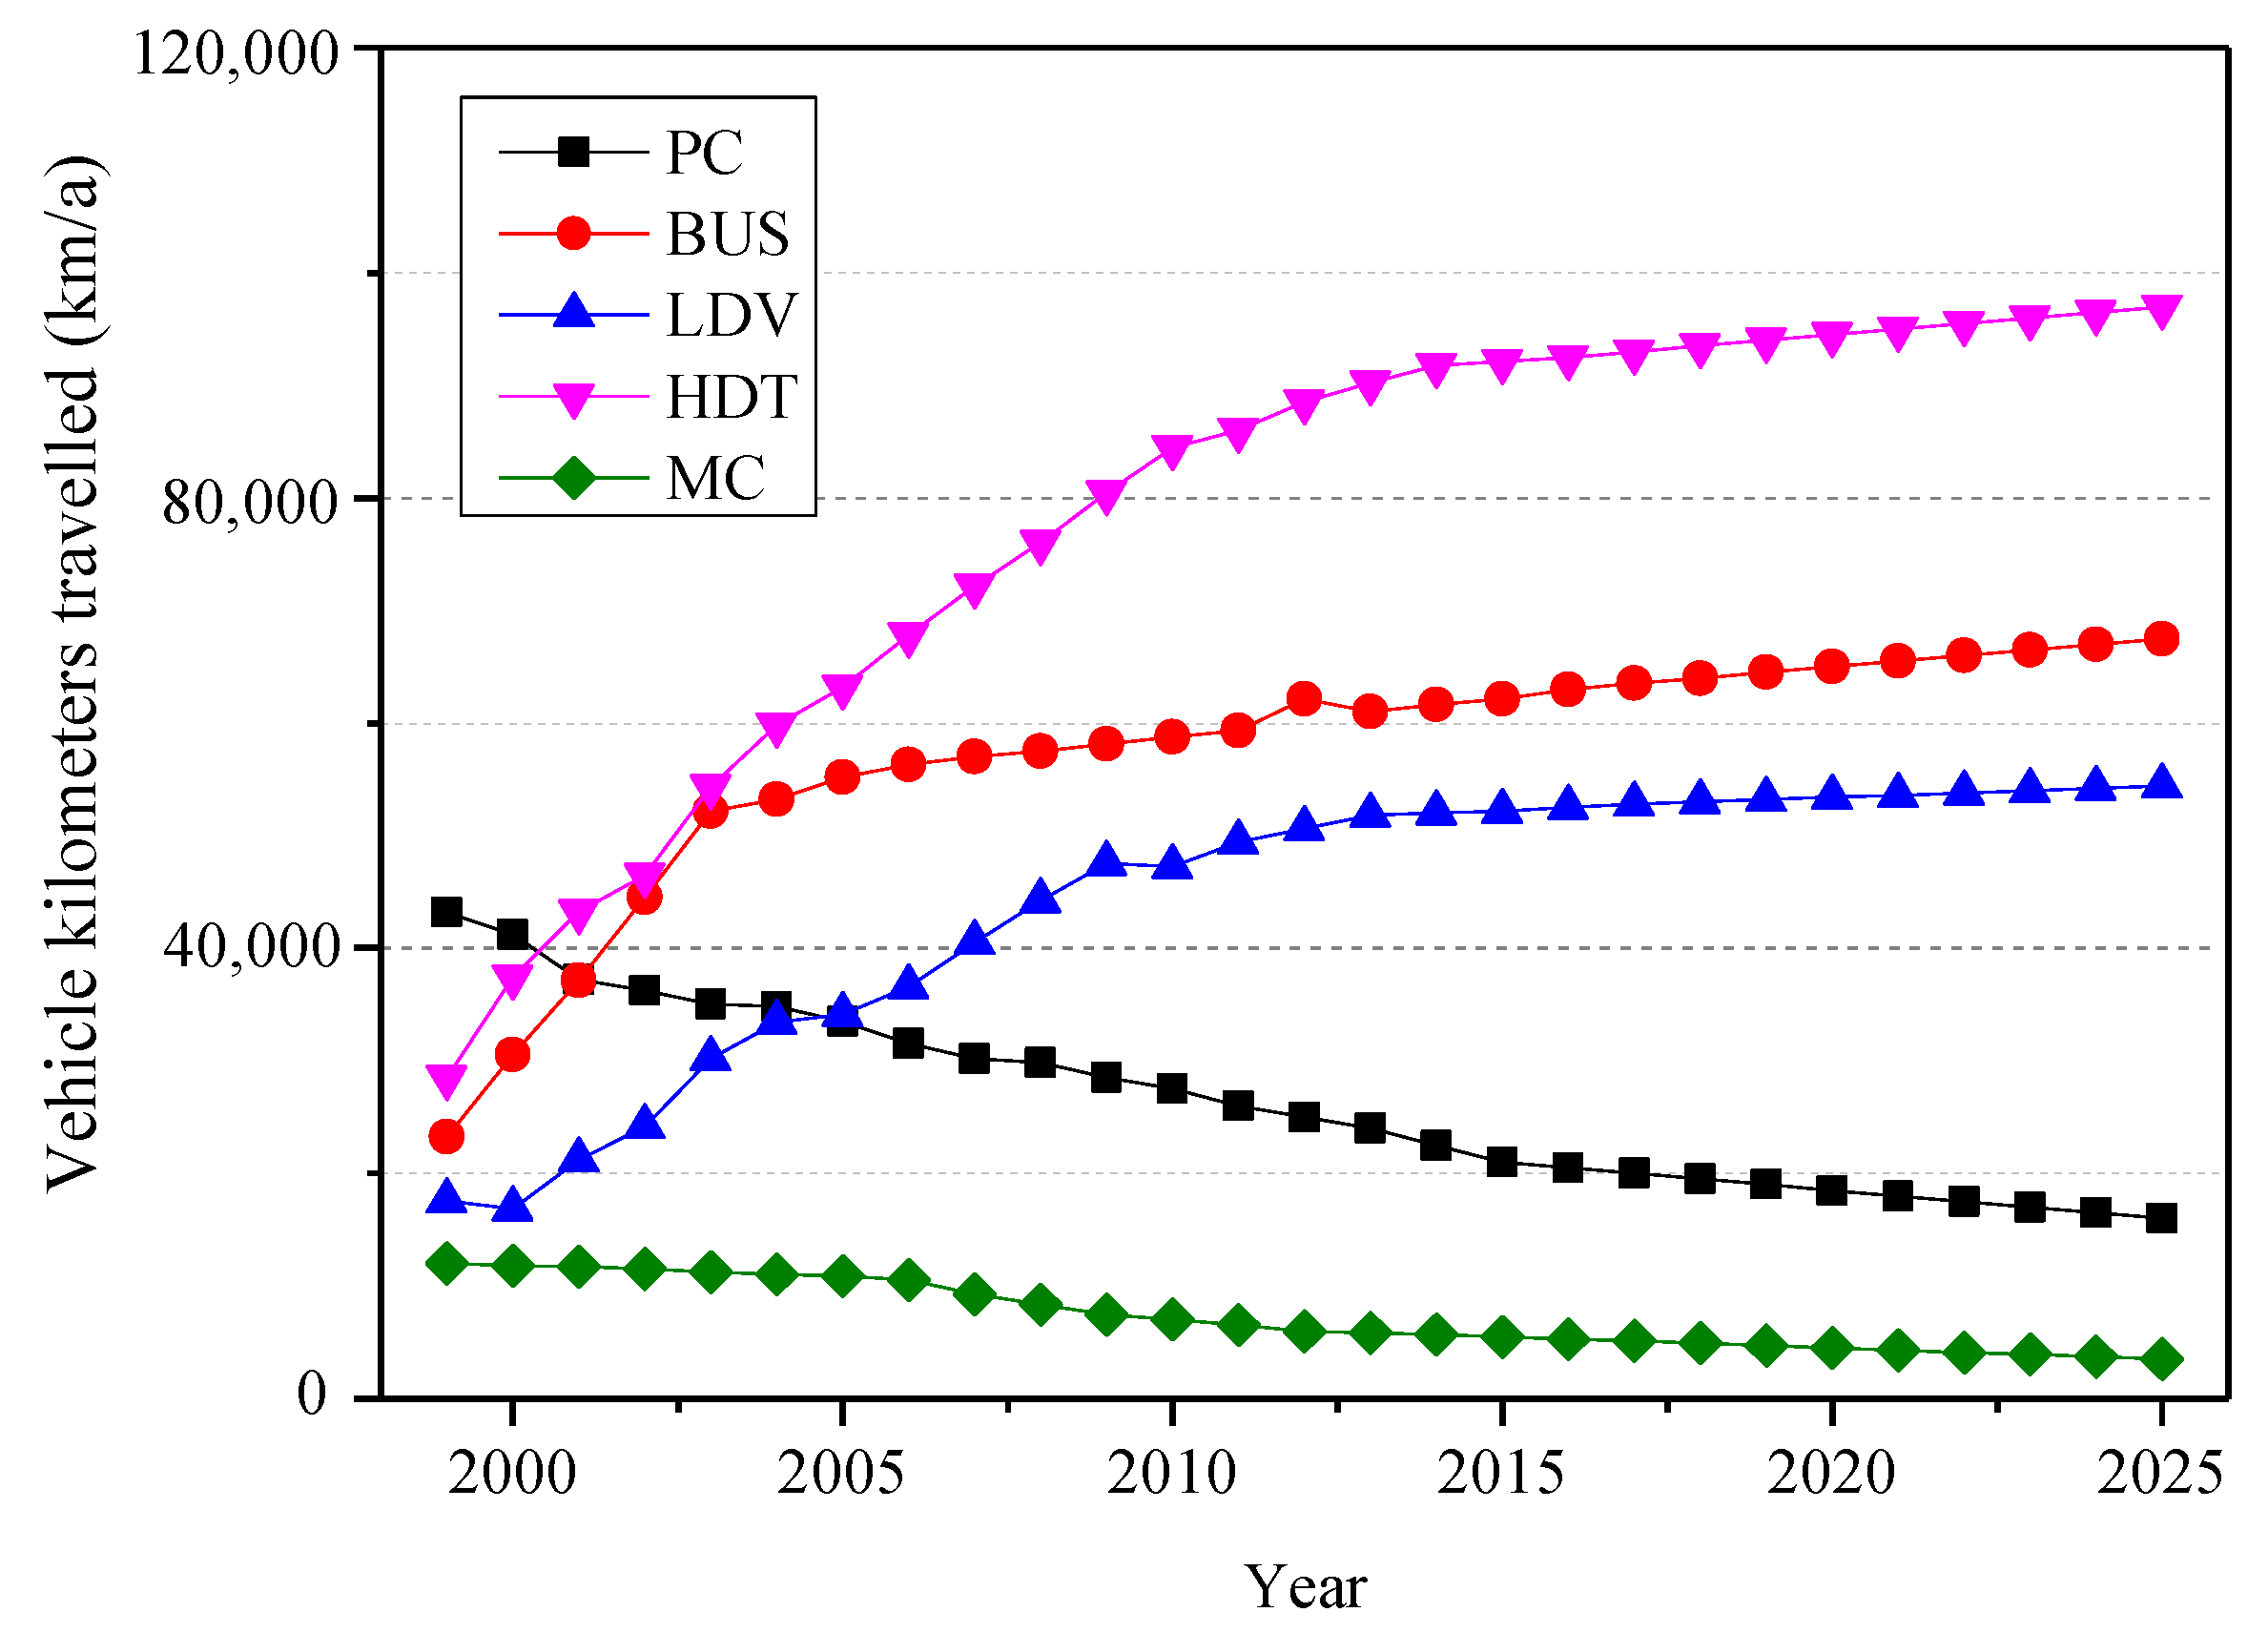
The vehicle kilometers travelled (VKT) is the annual distance travelled by each type of vehicle. The VKT data for different types of vehicles cannot obtained from official statistical records. Data on the VKT by different types of vehicles in the CPUA from 1999–2015 were based on the existing literatures [21,22,23,24,25,26,27] and referred to data on the annual mileage of vehicles in cities with different levels of development in China [23,25,28] as well as technical guidelines for the compilation of inventories of air pollutants from road motor vehicles [29].
Studies have shown that the mean annual VKT data of PCs are related to its retention rate [25], meaning that the average annual VKT data will decrease with the increase of its retention rate. It is well known that the retention rate of PC in cities will continue to increase. Therefore, the correlation between the mean average VKT and retention rate of PC for each city can be established based on the corresponding data between 1999 and 2015, then the average VKT of PC for 2016 to 2025 can be estimated based on the retention rate of PC from 2016 to 2025 obtained above. The annual VKT by HDTs, BUSs, and LDVs were related to the local business activities and increased with economic growth. The annual VKT by HDTs, LDVs, and BUSs for 2016–2025 were thus predicted using the method of elasticity coefficient. The annual VKT of MCs would decrease in the next future years with the restriction on motorcycle applied in each city. The data of the predicted annual VKT by different types of vehicles are exhibited in Figure 3.
2.1.3. Emission Factors
The emission factors of different types of vehicles were calculated based on the Computer Programme to calculate Emissions from Road Transport (COPERT) IV (v 11.2) model. The model requires the input of some parameters related to vehicle emission, including numbers of different vehicle types, fuel quality parameters, average driving speed, and meteorological parameters. The fuel quality parameters (including sulfur contents) were obtained from Chinese national and local fuel standards and exhibited in Table 2. The average driving speeds of the different vehicle types referred to the previous studies [10,17,26,27,30] (Table 3). Meteorological parameters (such as humidity and air temperature) were obtained from the Chinese Meteorological Yearbook [31].
Similarly, the emission factors of the different vehicle types for the future years were predicted based on the predicted parameter values required by the COPERT Ⅳ model [32]. The predicted parameters of emission factors involved fuel consumption, temperature, and humidity. The fuel consumption (gasoline and diesel consumption) was predicted applying the method of linear regressions. The predicted values of mean humidity as well as maximum and minimum temperature of each month were defined as the mean humidity and mean maximum and minimum temperature, respectively, in the same months between 1999 and 2015. Combining these predicted values and the previous studies [33,34,35,36], the pollutant emission factors of the different vehicle types from 2016 to 2025 were estimated.
2.2. Design of Emission Prevention and Control Scenarios
In recent years, a series of laws and regulations and control measures have been issued in the CPUA to strictly control the emission of pollutants. In September 2018, Henan Province issued “Henan Province’s Three-year Action Plan for Tackling Pollution (2018–2020)”, which proposed specific measures for preventing and controlling vehicle pollution, including strengthening vehicle control, developing public transportation, optimizing the traffic structure, implementing stricter emissions and fuel quality standards, promoting vehicles dependent on new energy sources, and eliminating old vehicles. Based on these measures, this study developed one baseline scenario (i.e., a business-as-usual scenario (BAU)), seven single scenarios, and two integrated scenarios for vehicle pollution emission reduction in the CPUA from 2016 to 2025 (Table 4).
2.3. Spatial Allocation Method
Based on information on the road network of the CPUA, in this study, ArcGIS software (ArcMap 10.2) was used to determine the spatial distribution of pollutant emissions in this region in 2015 and to study the spatial distribution characteristics of vehicular pollutant emissions. Link-level vehicle emissions are closely related to many factors including fleet composition, speed, and traffic volume. However, because of the difficulty in obtaining the traffic flow information of the road network in the CPUA, this part does not consider the road traffic flow. Referring to the published literature [18,37], it is considered that this method is also feasible and operable. Using the basic geographic data of the CPUA as the model domain, the road map of 16 cities in the CPUA is divided into 4 × 4 km grids, and the pollutant emissions in each grid are obtained by the following formula:
where Qr,s represents the vehicular emission of pollutant s in grid r, Lr represents the length of the roads in grid r, and Ts represents the total vehicular emissions of pollutant s in each city.
3. Results and Discussion
3.1. Inter-Annual Trends of Different Pollutants from Vehicle Emission
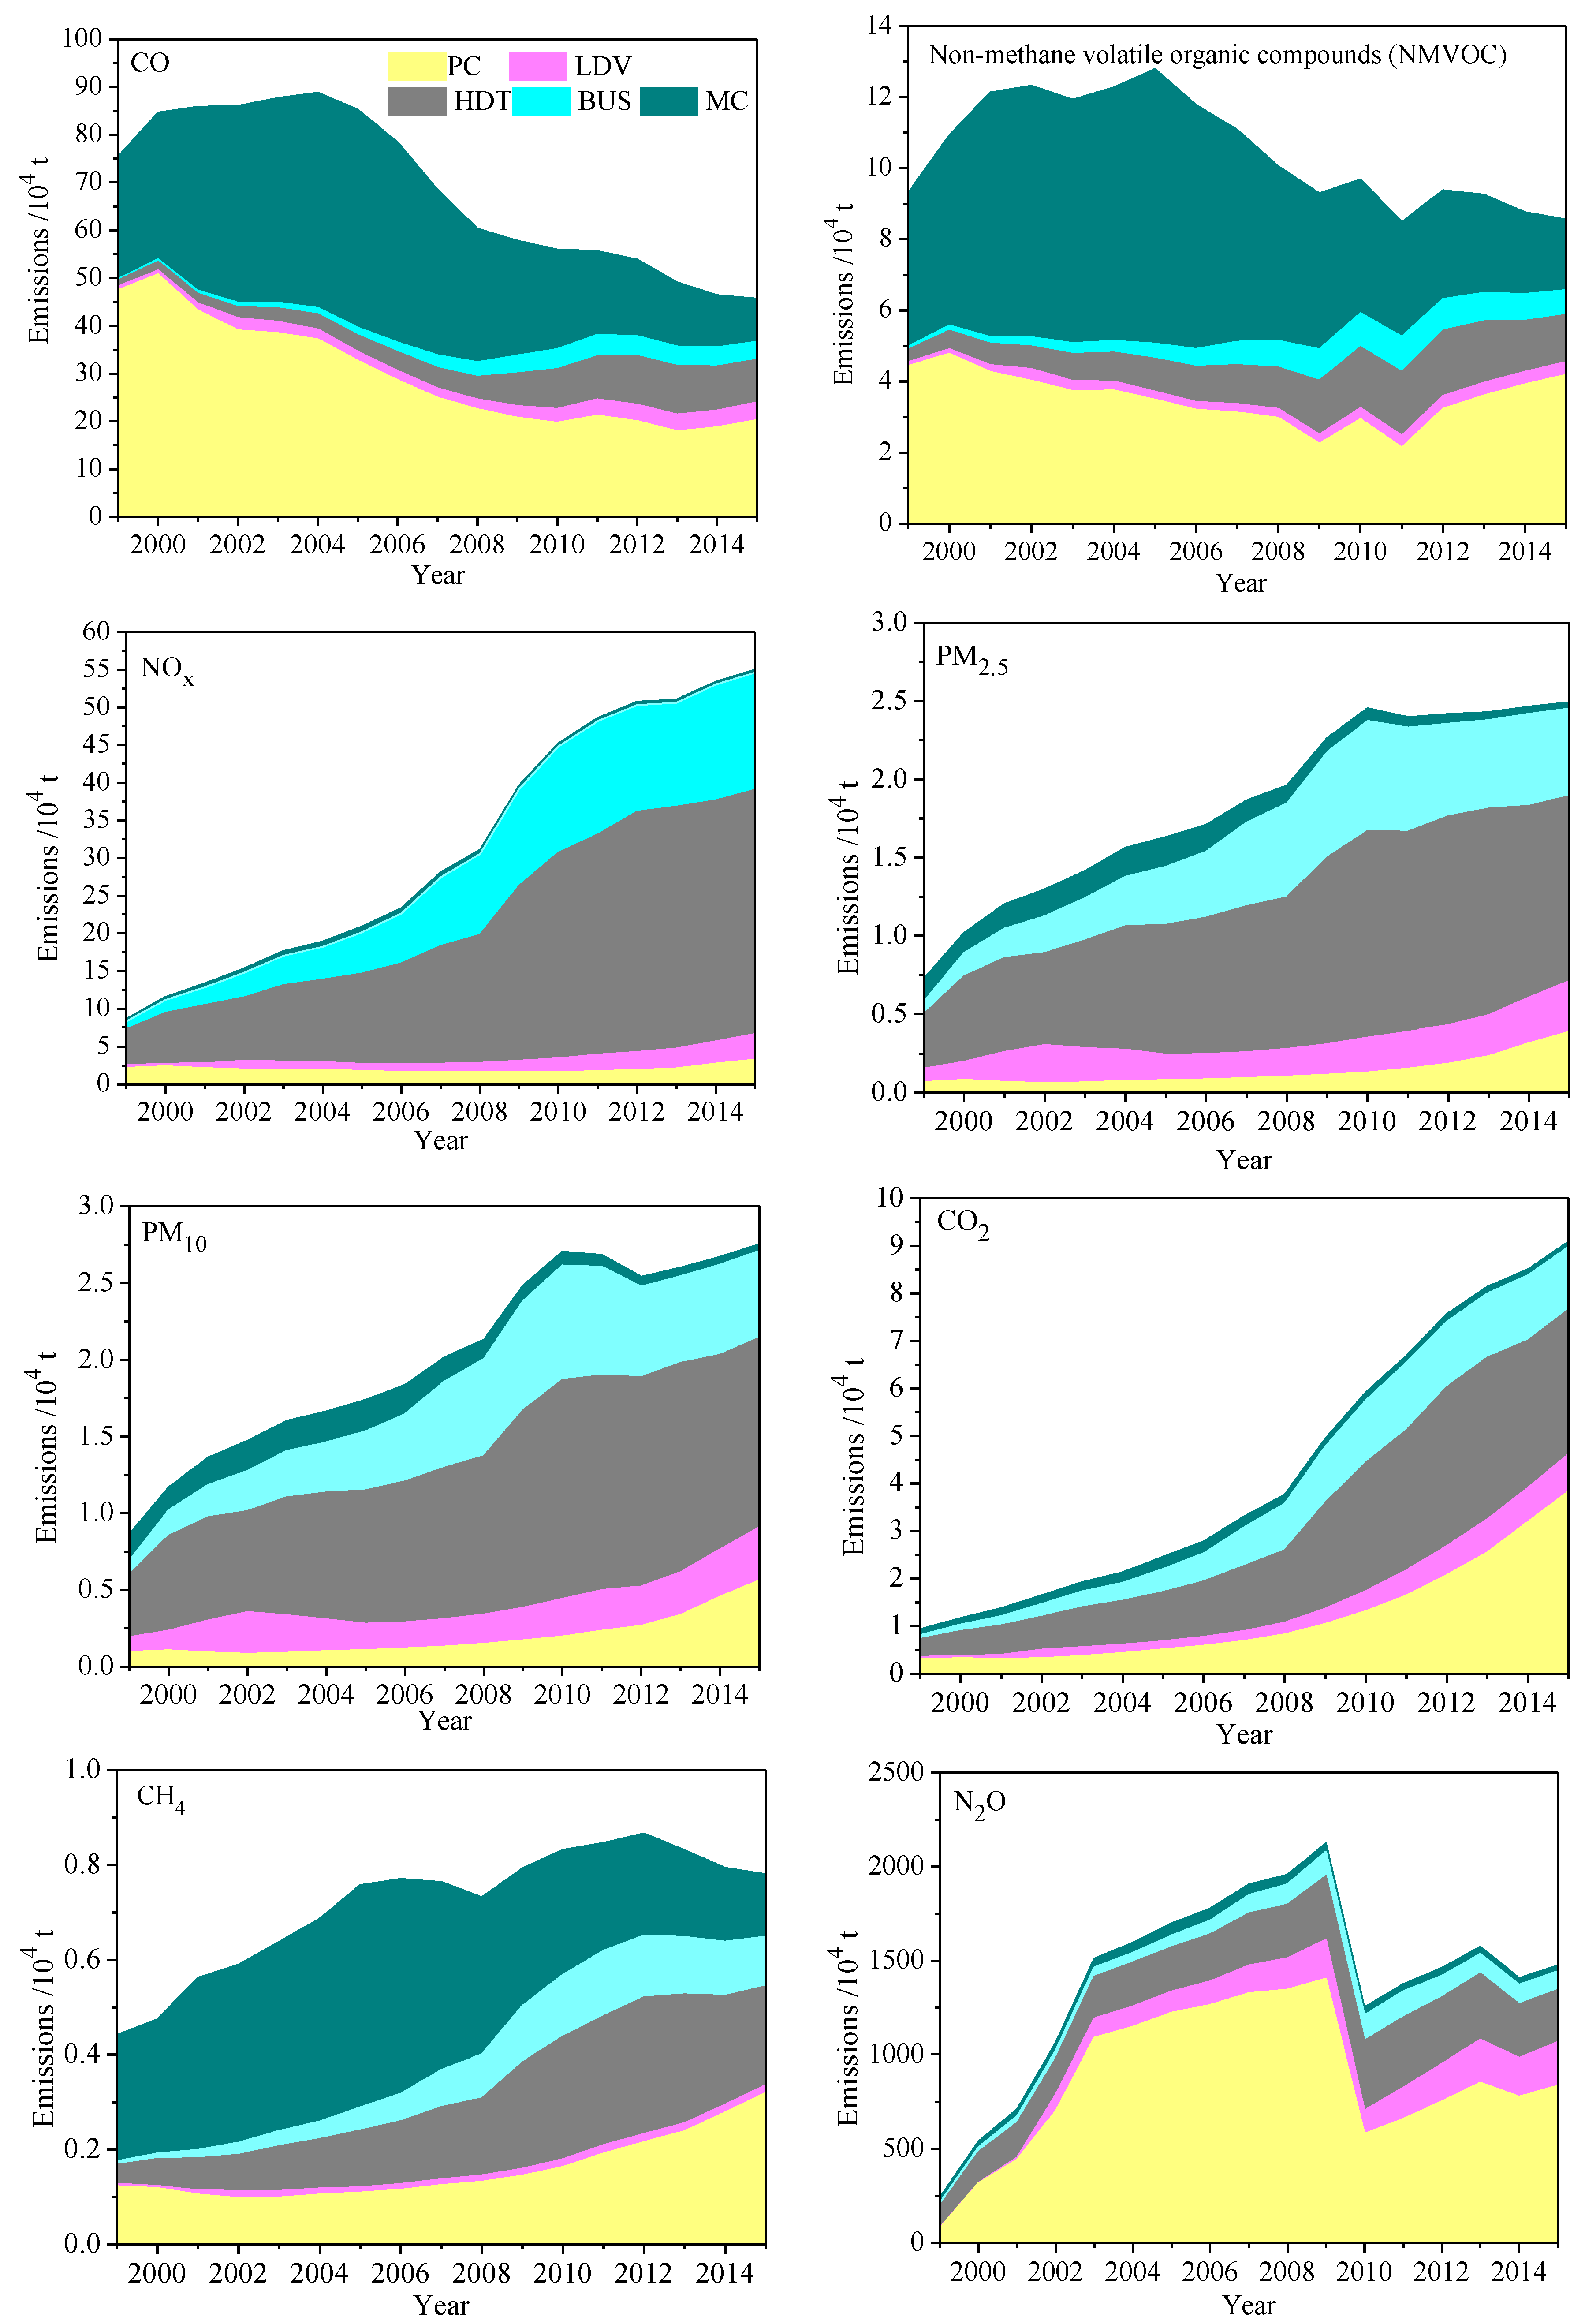
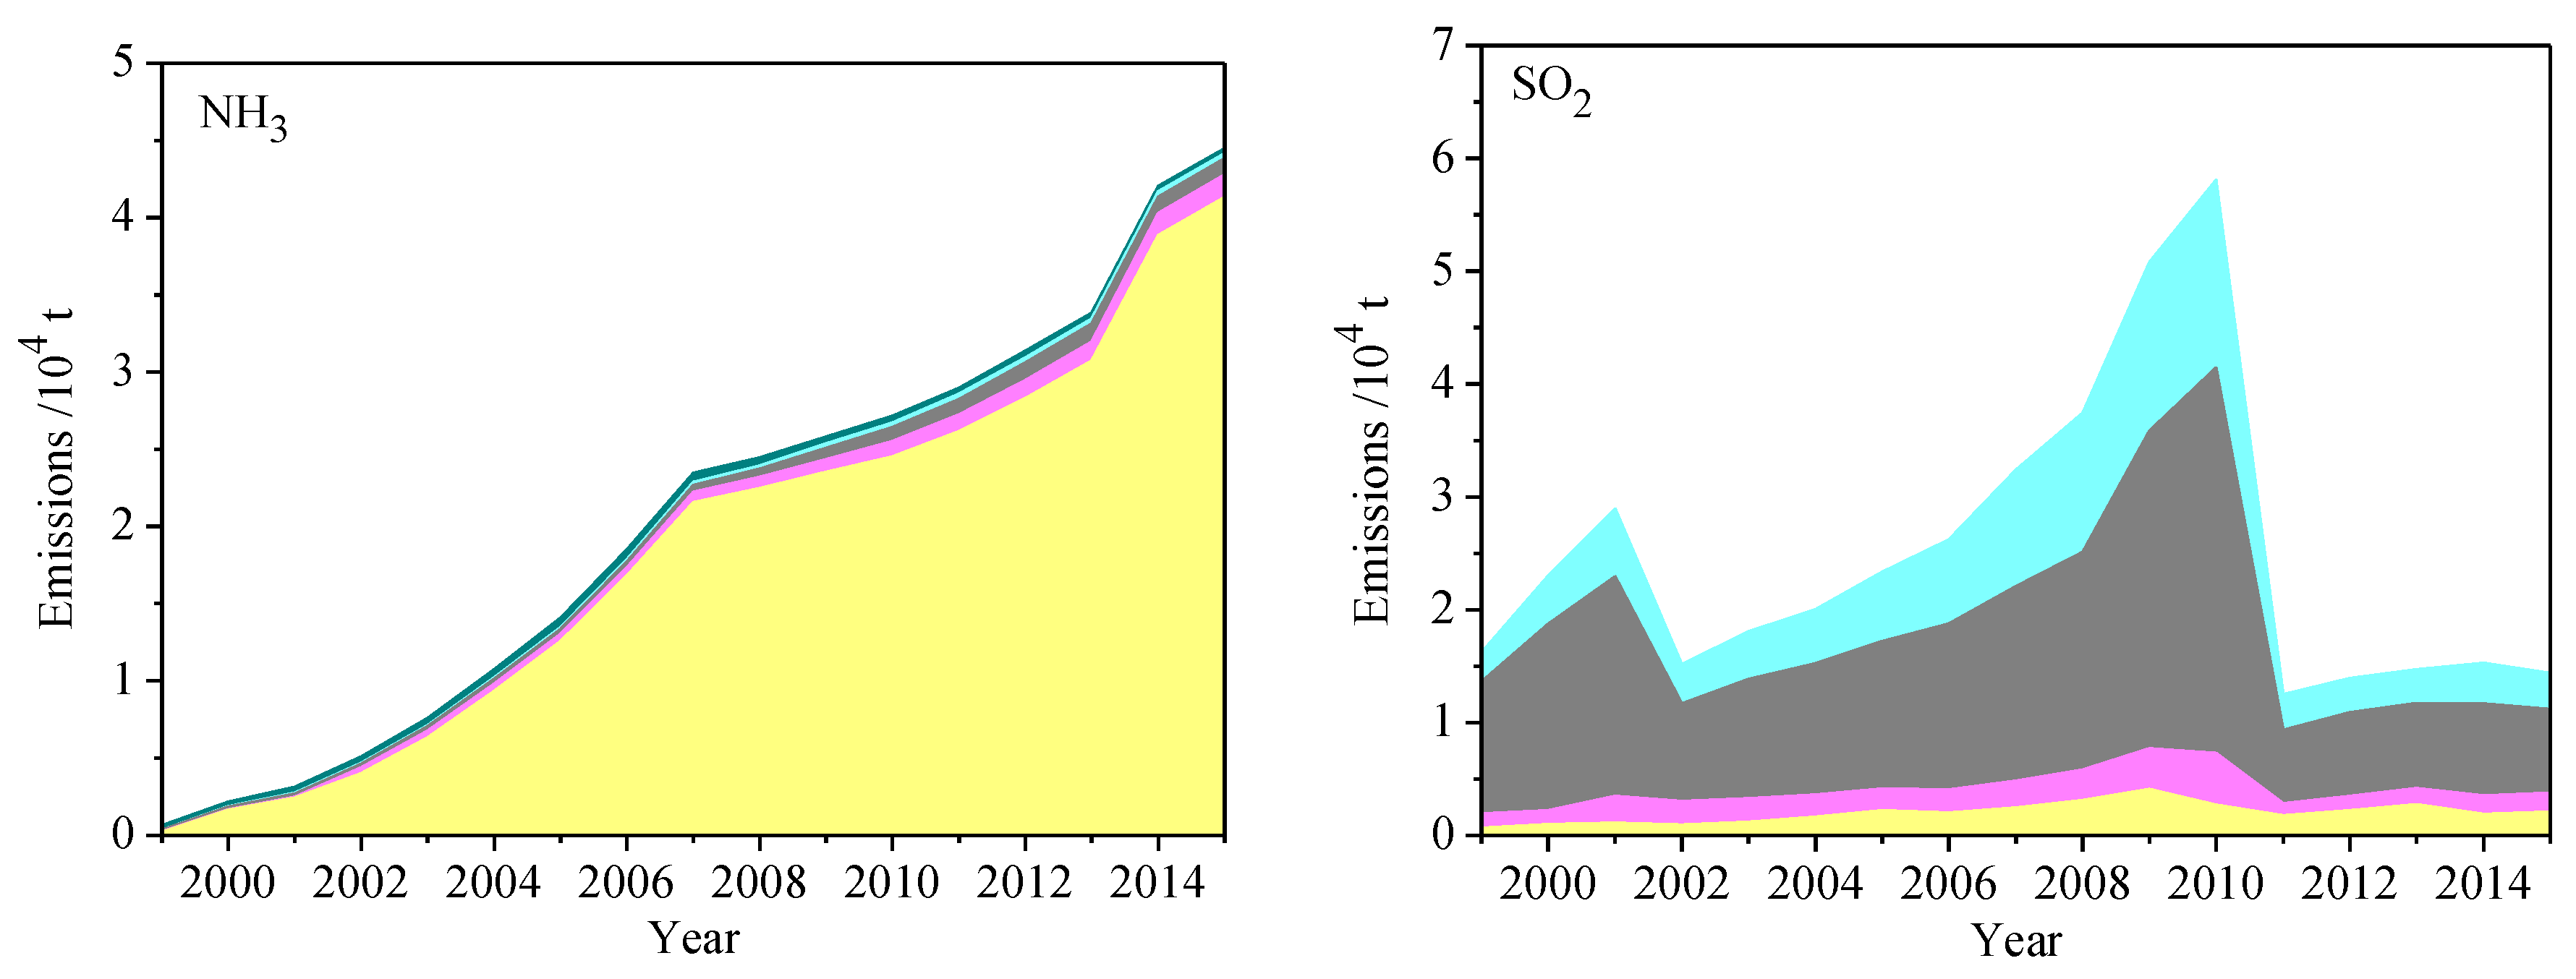
The missions of ten pollutants (CO, non-methane volatile organic compounds (NMVOC), NOx, PM2.5, PM10, CO2, CH4, N2O, NH3, and SO2) from vehicles in the CPUA between 1999 and 2015 were calculated based on Equation (1), as shown in Section 2.1, and the inter-annual change tendency are shown in Figure 4.
The main trend of vehicle CO and NMVOC emissions in the CPUA increased at first then decreased during the study period. Vehicle emissions of CO increased each year by an average of 3.39% between 1999 and 2004. With the stricter emission standards implemented and the elimination of old vehicles, the CO emission decreased from 888.42 Gg in 2004 to 457.27 Gg in 2015. NMVOC emission increased from 92.99 Gg in 1999 to 127.89 Gg in 2015, with the annual mean growth rate of 5.67%. After 2005, the emission of NMVOC decreased gradually to 85.59 Gg in 2015. The main vehicles contributing to CO and NMVOC pollutants were PCs and MCs from 1999 to 2015, and their total contribution rates remained above 63.84% and 63.21%, respectively. Although the number of MCs and their VKT have decreased because of the implementation of motorcycle restrictions in some cities, MCs contribute the largest amount of CO and NMVOC pollutants from 1999 to 2010. In addition, the contribution rates of PCs to CO and NMVOC pollutants increase annually with the increase in the number of PCs, and the contribution rates of PCs to these two pollutants reached 44.39% and 48.93%, respectively, in 2015.
Vehicle NOx, PM2.5, and PM10 emissions generally showed an increasing trend from 1999 to 2015 in the CPUA. Vehicle emissions of NOx, PM2.5, and PM10 were 550.14, 24.92, and 27.54 Gg in 2015, respectively, and these were 536.03%, 244.08%, and 218.85% higher, respectively, than in 1999. The main vehicles contributing to NOx, PM2.5, and PM10 were HDTs and BUSs from 1999 to 2015, and their total contribution rates remained above 66.73%, 58.49%, and 57.66%, respectively. The sustainable increase of NOx, PM2.5, and PM10 emissions was caused for the following reasons. The rapid development of freight transportation resulted in the increase of the VKT and number of HDTs and BUSs in the CPUA over the past decade. Furthermore, the emission factors of these three pollutants under the new emission standards decreased much less than those of CO and NMVOC [38], which means that the increase of the VKT and numbers of HDTs and BUSs offset the reductions in the more stricter vehicle emission standards.
Vehicular CO2 emissions increased by 871% (from 9357.37 Gg in 1999 to 90,860.77 Gg in 2015) from 1999 to 2015. The main vehicles contributing to CO2 pollution from 1999 to 2015 were PCs and HDTs. With the significant increase in the number of PCs, PCs became the largest contributor of CO2 from 2014 to 2015, and its contribution rate reached 42.15% in 2015. This increase indicates that the implementation of the new fuel standard and emission standard in the research area did not effectively reduce the CO2 emission of vehicles. Vehicular CH4 emissions increased from 4.41 Gg to 8.67 Gg from 1999 to 2012, representing an annual increase of 5.47%, and then decreased to 7.81 Gg in 2015. The main contributor to CH4 was MCs from 1999 to 2010, and its contribution rate remained above 31.72%. With the increase in the HDT population, this vehicle type has become the largest contributor to CH4 emissions in recent years. In addition, the contribution rate of PCs cannot be ignored, as its average annual growth rate reached 11.11% from 2005 to 2015. Vehicular N2O emissions show a fluctuating trend, which changed from 0.241 Gg in 1999 to 1.475 Gg in 2015. The largest contributor to N2O pollution was PCs, the contribution rate of which remained above 46.42%. It is worth noting that N2O emission showed a decreasing trend between 2009 and 2010 (from 2.124 Gg to 1.252 Gg) because of the implementation of new fuel standards in 2010. It is well known that the new fuel standards require a reduction in the sulfur content of gasoline (Table 2), and reducing the sulfur content in the fuel is an effective method to decrease vehicle N2O emissions [18]. Vehicle N2O emissions showed a downward trend in certain years, but mainly presented an upward trend (such as from 2010 to 2013 and 2014 to 2015), because the increase in the PC population offsets the decrease in PC emissions caused by the implementation of new fuel standards. Therefore, it is necessary to control the growth of the PCs population to reduce the pollutant emissions.
The NH3 emissions from vehicles showed a trend of continuous growth, which increased by 6823.88% from 0.064 Gg to 4.45 G from 1999 to 2015, which was deemed to be the fastest increase of all the pollutants. The major contributor to NH3 was PCs from 2000 to 2015, and its contribution rate remained above 76.45%. It is well known that the main component of haze is PM2.5 [39]. Behera and Sharma (2010) pointed out that the pollutant NH3 is an alkaline gas that can react with water and acids to form fine particles [40]. Therefore, NH3 is an essential substance for the formation and growth of particulate matter. The Chinese government and society have paid far too little attention to vehicular NH3 pollution, and NH3 emission from vehicles must be decreased. Vehicular SO2 emissions changed in patterns different from the other pollutants in the CPUA; namely, they increased between 1999 and 2015, except for the years of 2002 and 2011, when the SO2 emissions markedly decreased (from 28.95 Gg in 2001 to 15.14 Gg in 2002 and from 58.09 Gg in 2010 to 12.51 Gg in 2011—decreases of 47.72% and 78.47%, respectively). The major contributors to SO2 were HDTs and BUSs from 1999 to 2015, and their total contribution rates remained above 71.71%. SO2 emitted by vehicles is mainly controlled by the sulfur content in the fuel as well as the vehicle population. The fluctuation trend of SO2 emissions during the study period was mainly due to the specification of different sulfur contents in fuel standards implemented in the study area (Table 2).
3.2. Spatial Distribution Characteristics of Vehicle Emissions
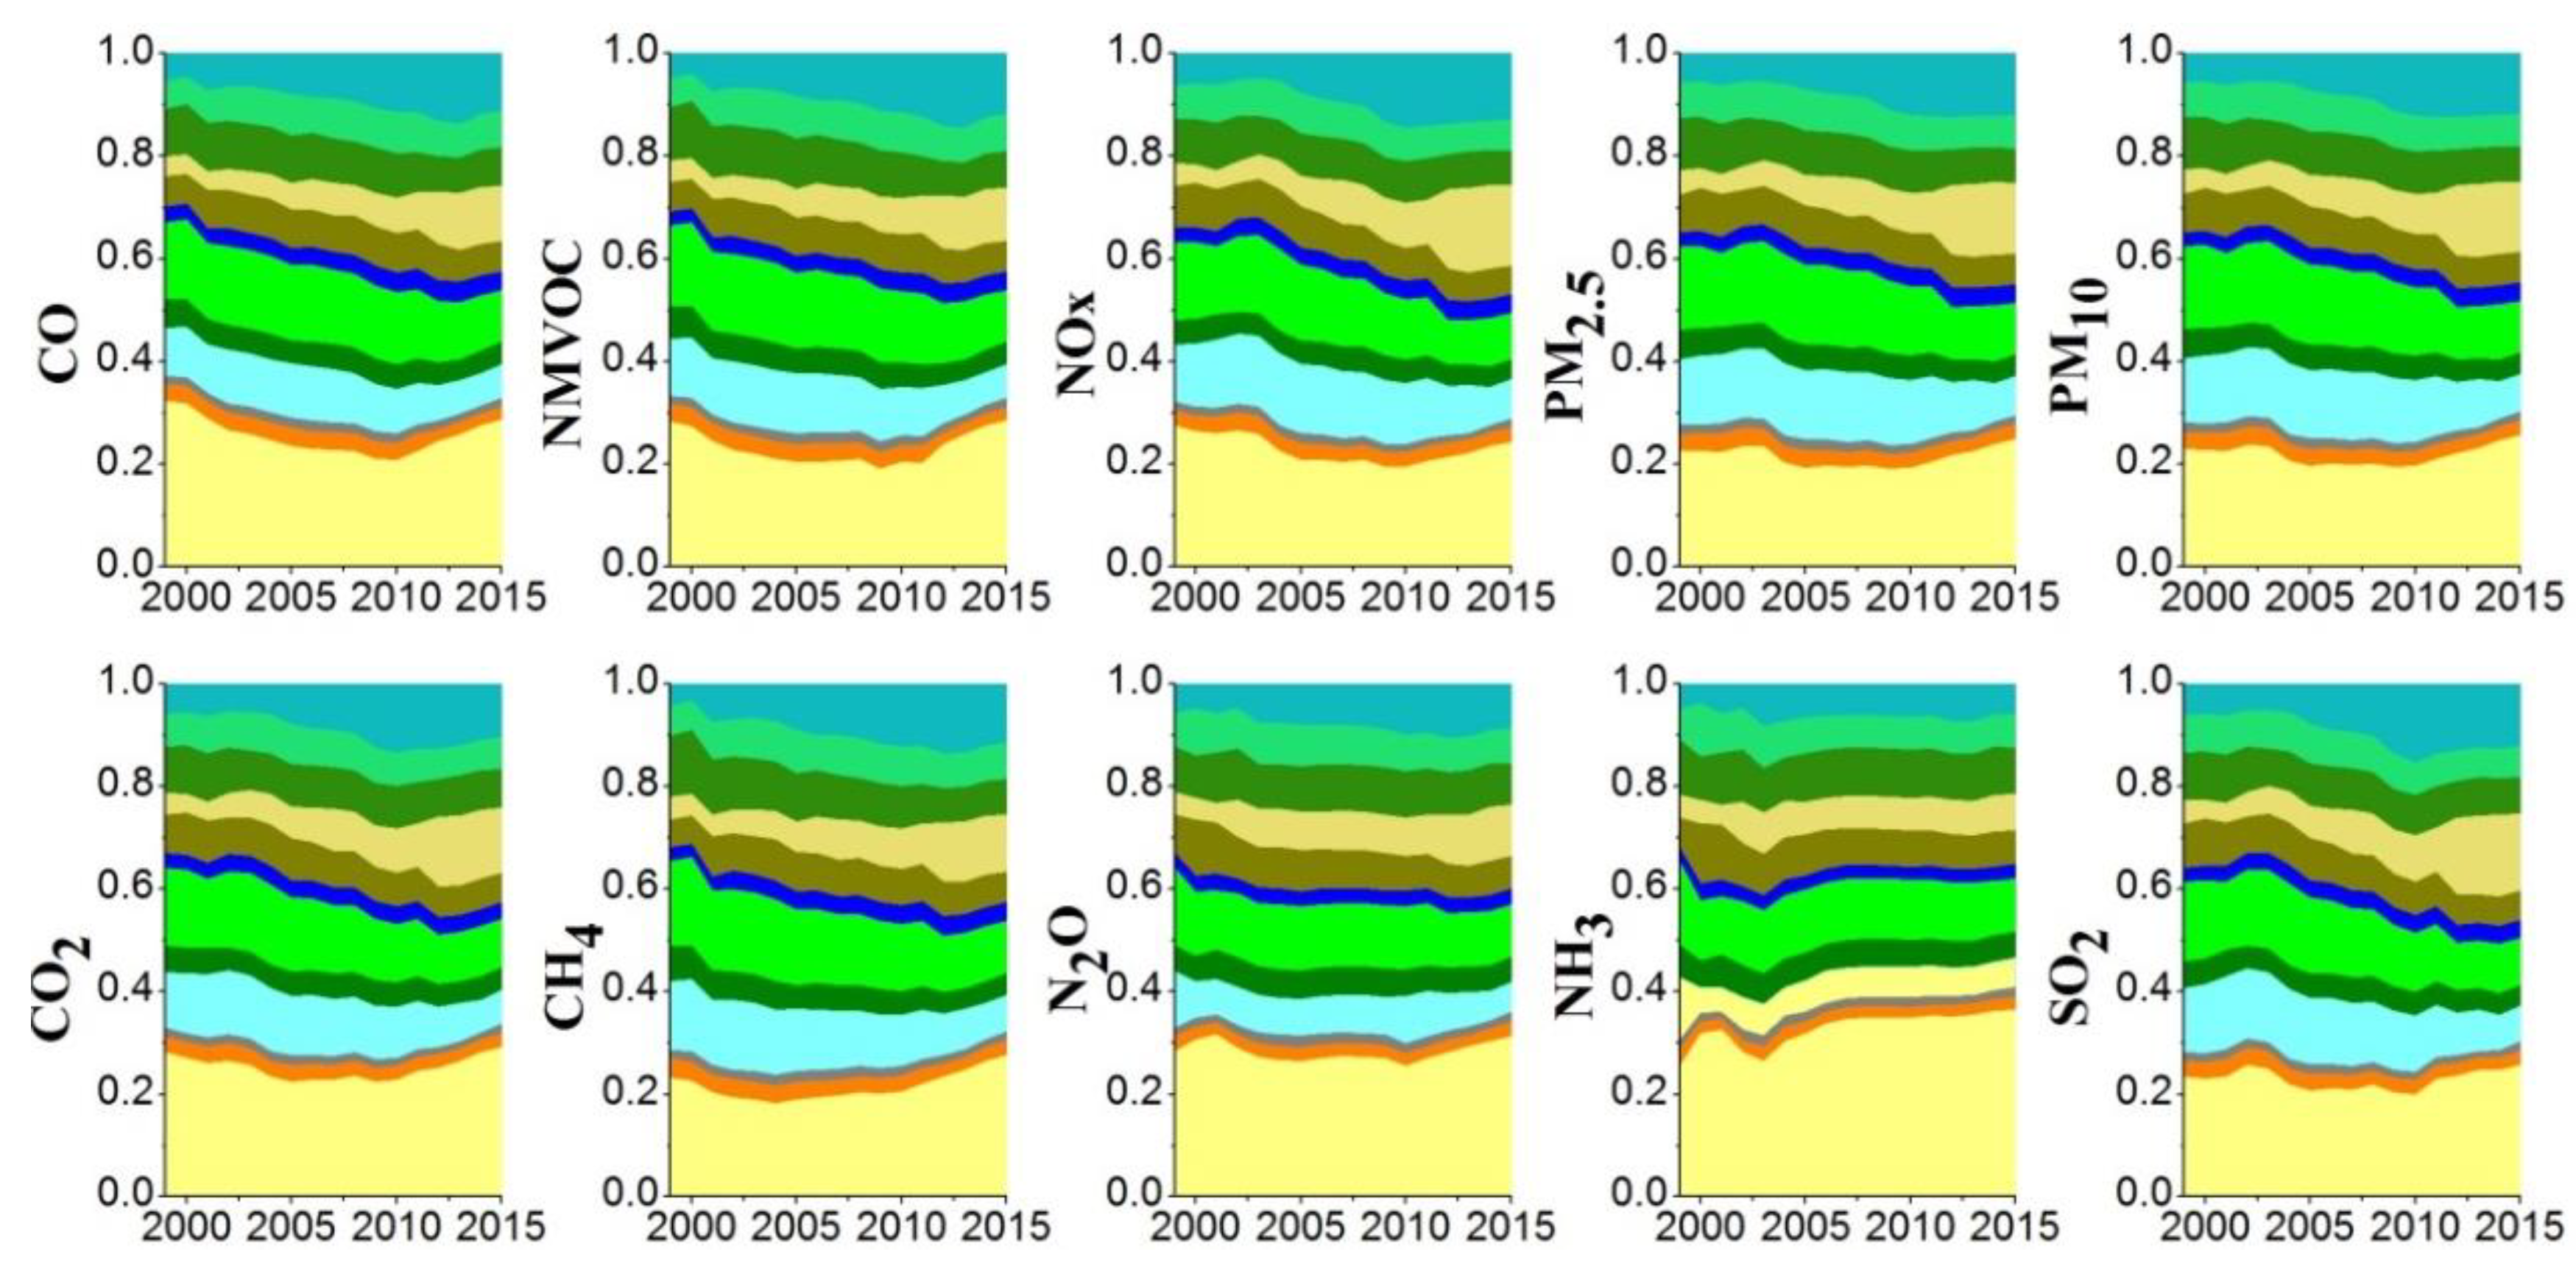
The distribution of emitted pollutants by city is shown in Figure 5. The city that contributed the most to total vehicle pollutant emissions in the CPUA was Zhengzhou, followed by Luoyang, Shangqiu, and Zhoukou between 1999 and 2015. The contributions of vehicular ten pollutant emissions of Zhengzhou to the region remained above 20.68%, 18.97%, 19.49%, 19.07%, 19.44%, 22.35%, 18.22%, 25.55%, 26.53%, and 19.91%, respectively, during the years of this research (Figure 5). In addition, the contribution of vehicle emissions in Zhengzhou to the total regional emissions continued increasing, reaching 28.56%, 28.37%, 24.26%, 4.72%, 25.48%, 29.04%, 27.61%, 31.32%, 36.44%, and 25.59%, respectively, in 2015, as the vehicle population in this city has increased greatly in recent years. The vehicle population increased substantially in Shangqiu and Zhoukou, especially MCs and HDTs, so the contributions of these ten vehicular pollutant emissions in these cities increased. The contributions of CO, NMVOC, NOx, PM2.5, PM10, CO2, CH4, N2O, NH3, and SO2 vehicle emissions in Luoyang and Jiaozuo decreased as the growth trends of the vehicle population in these two cities slowed.
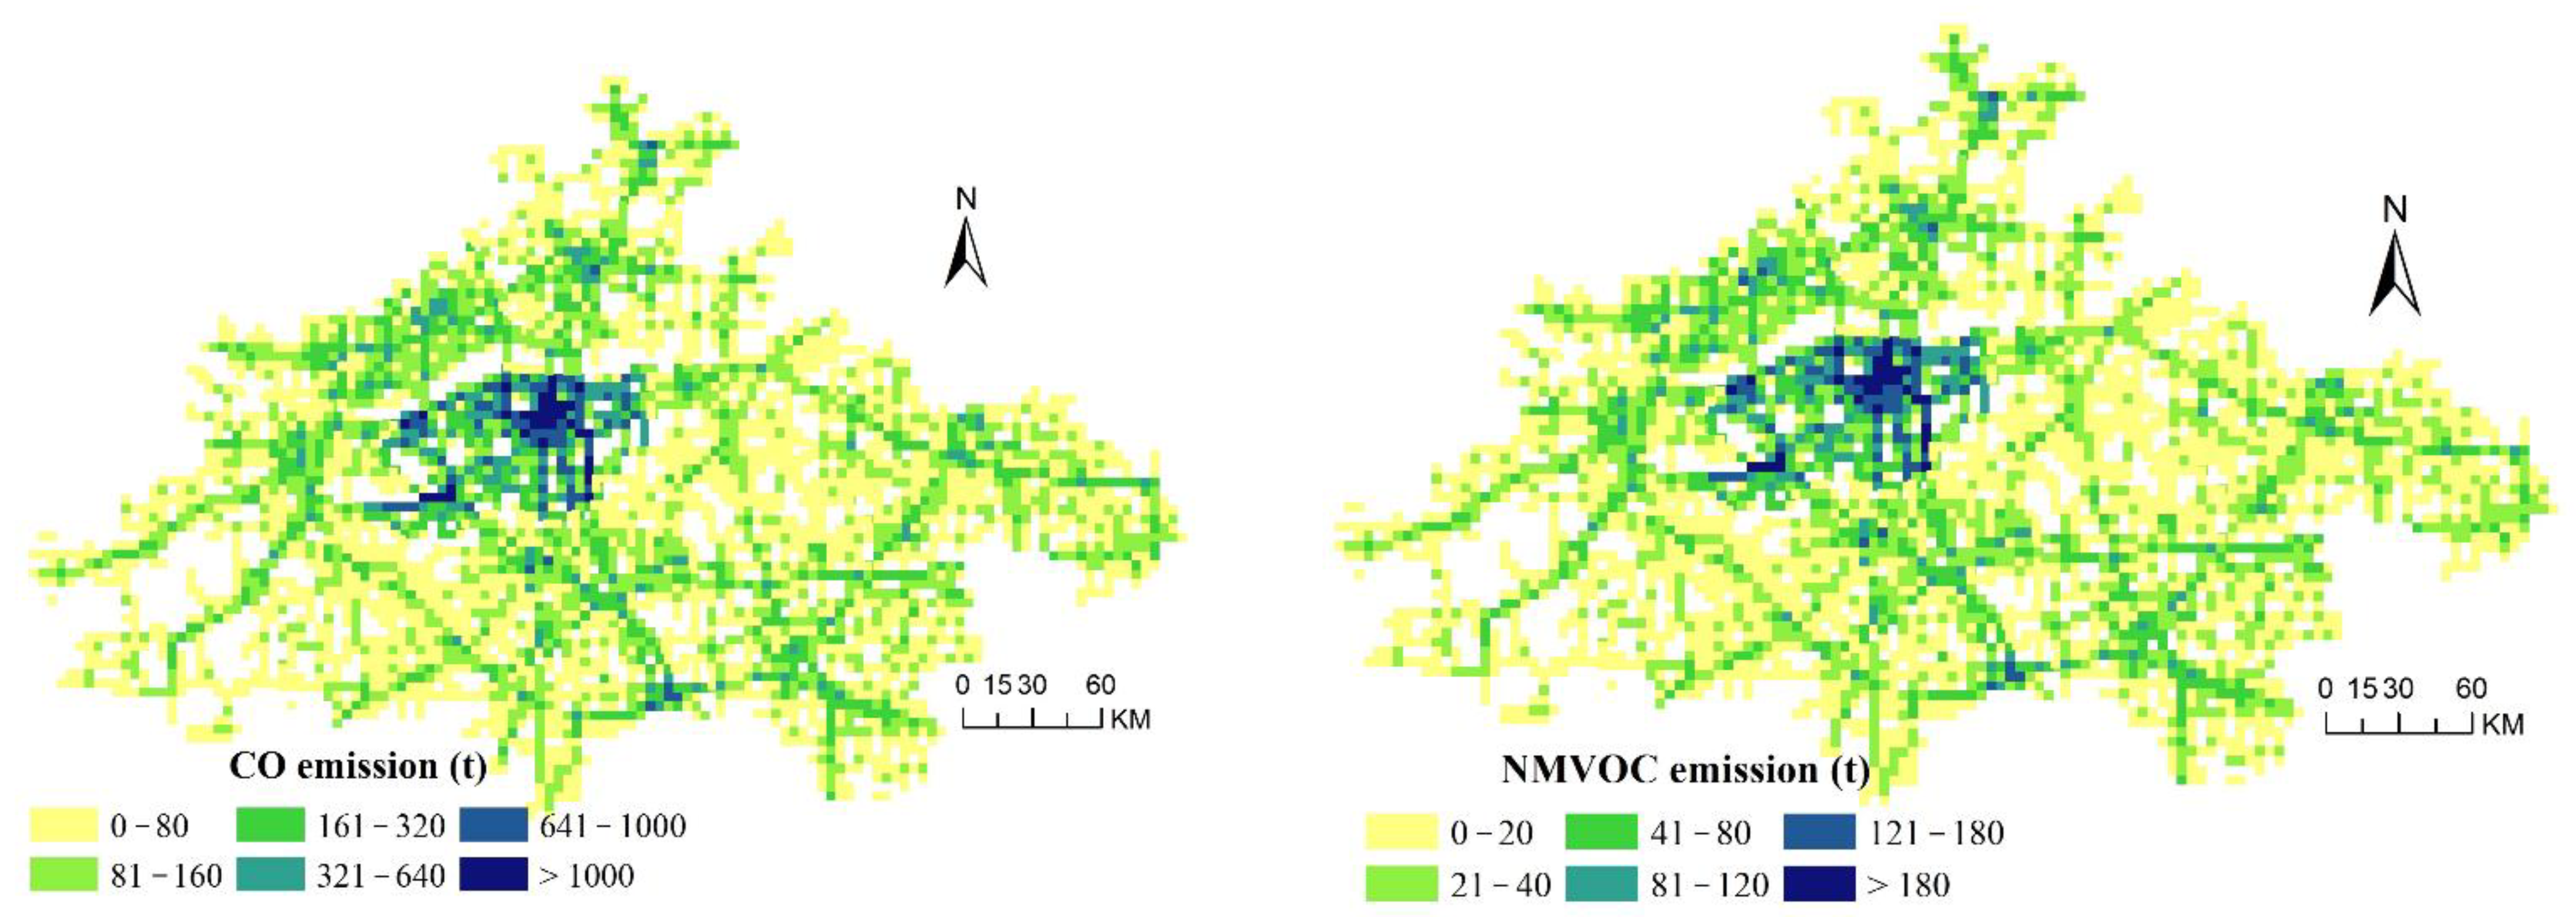
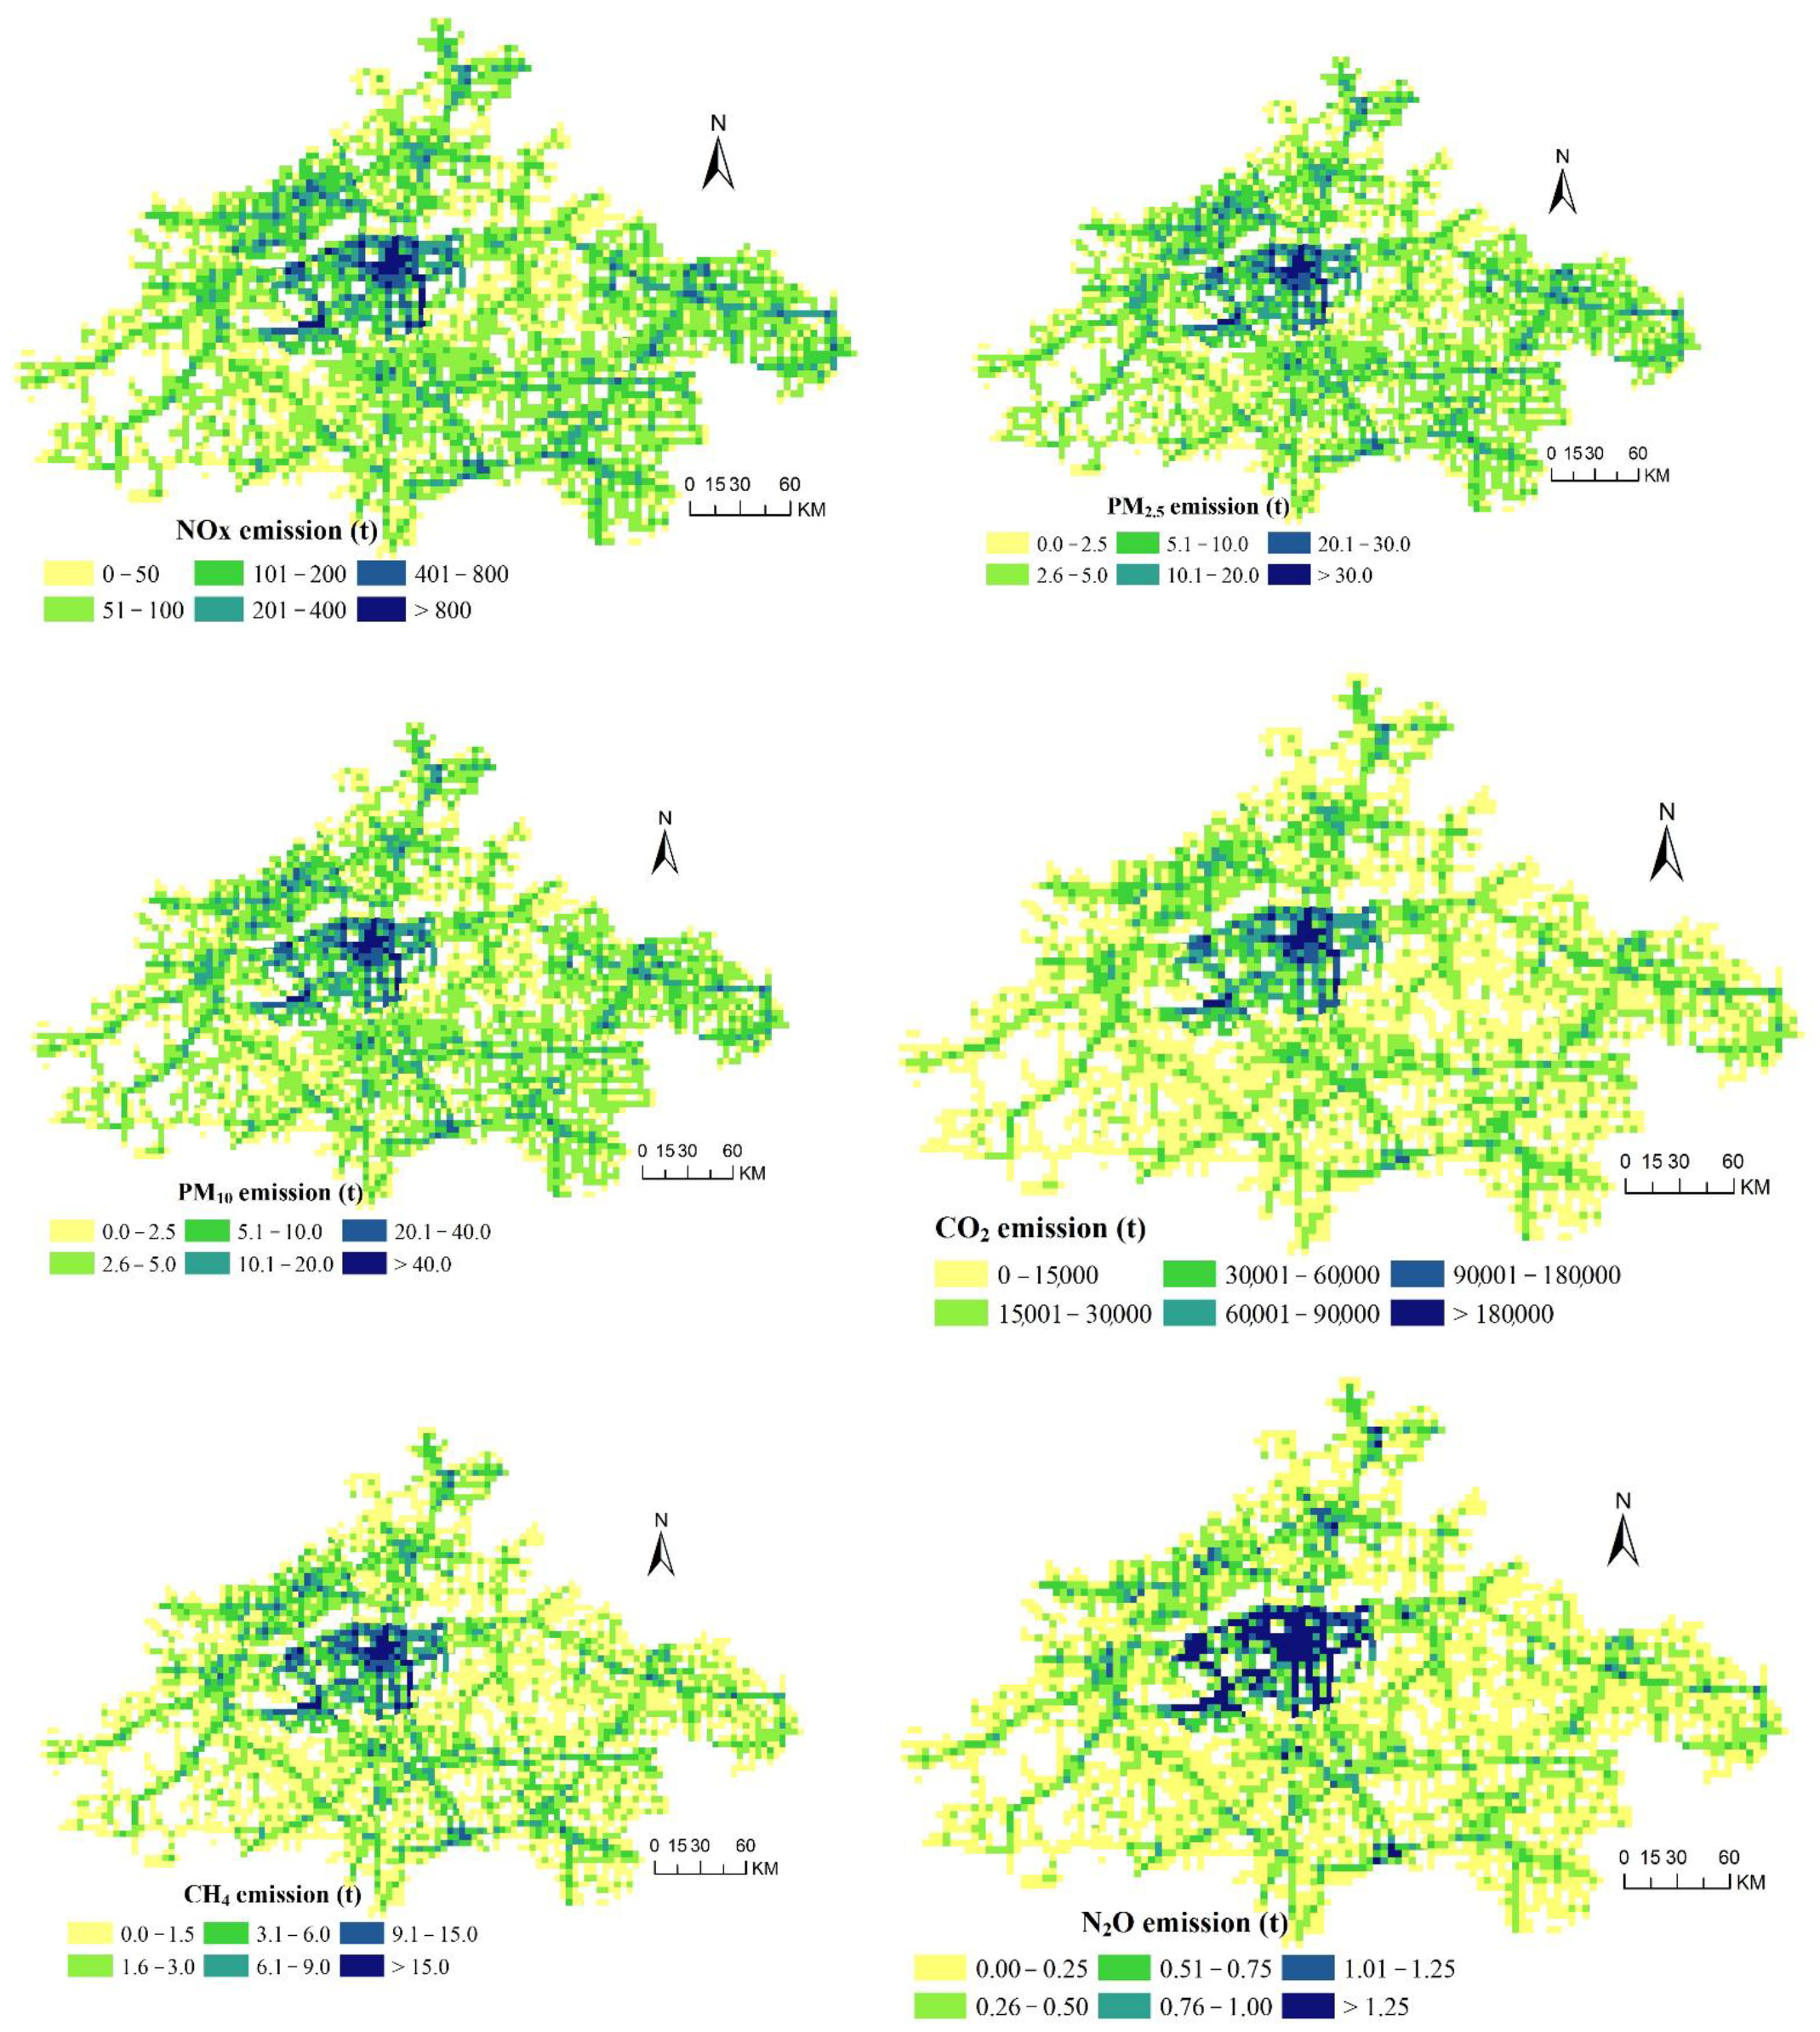
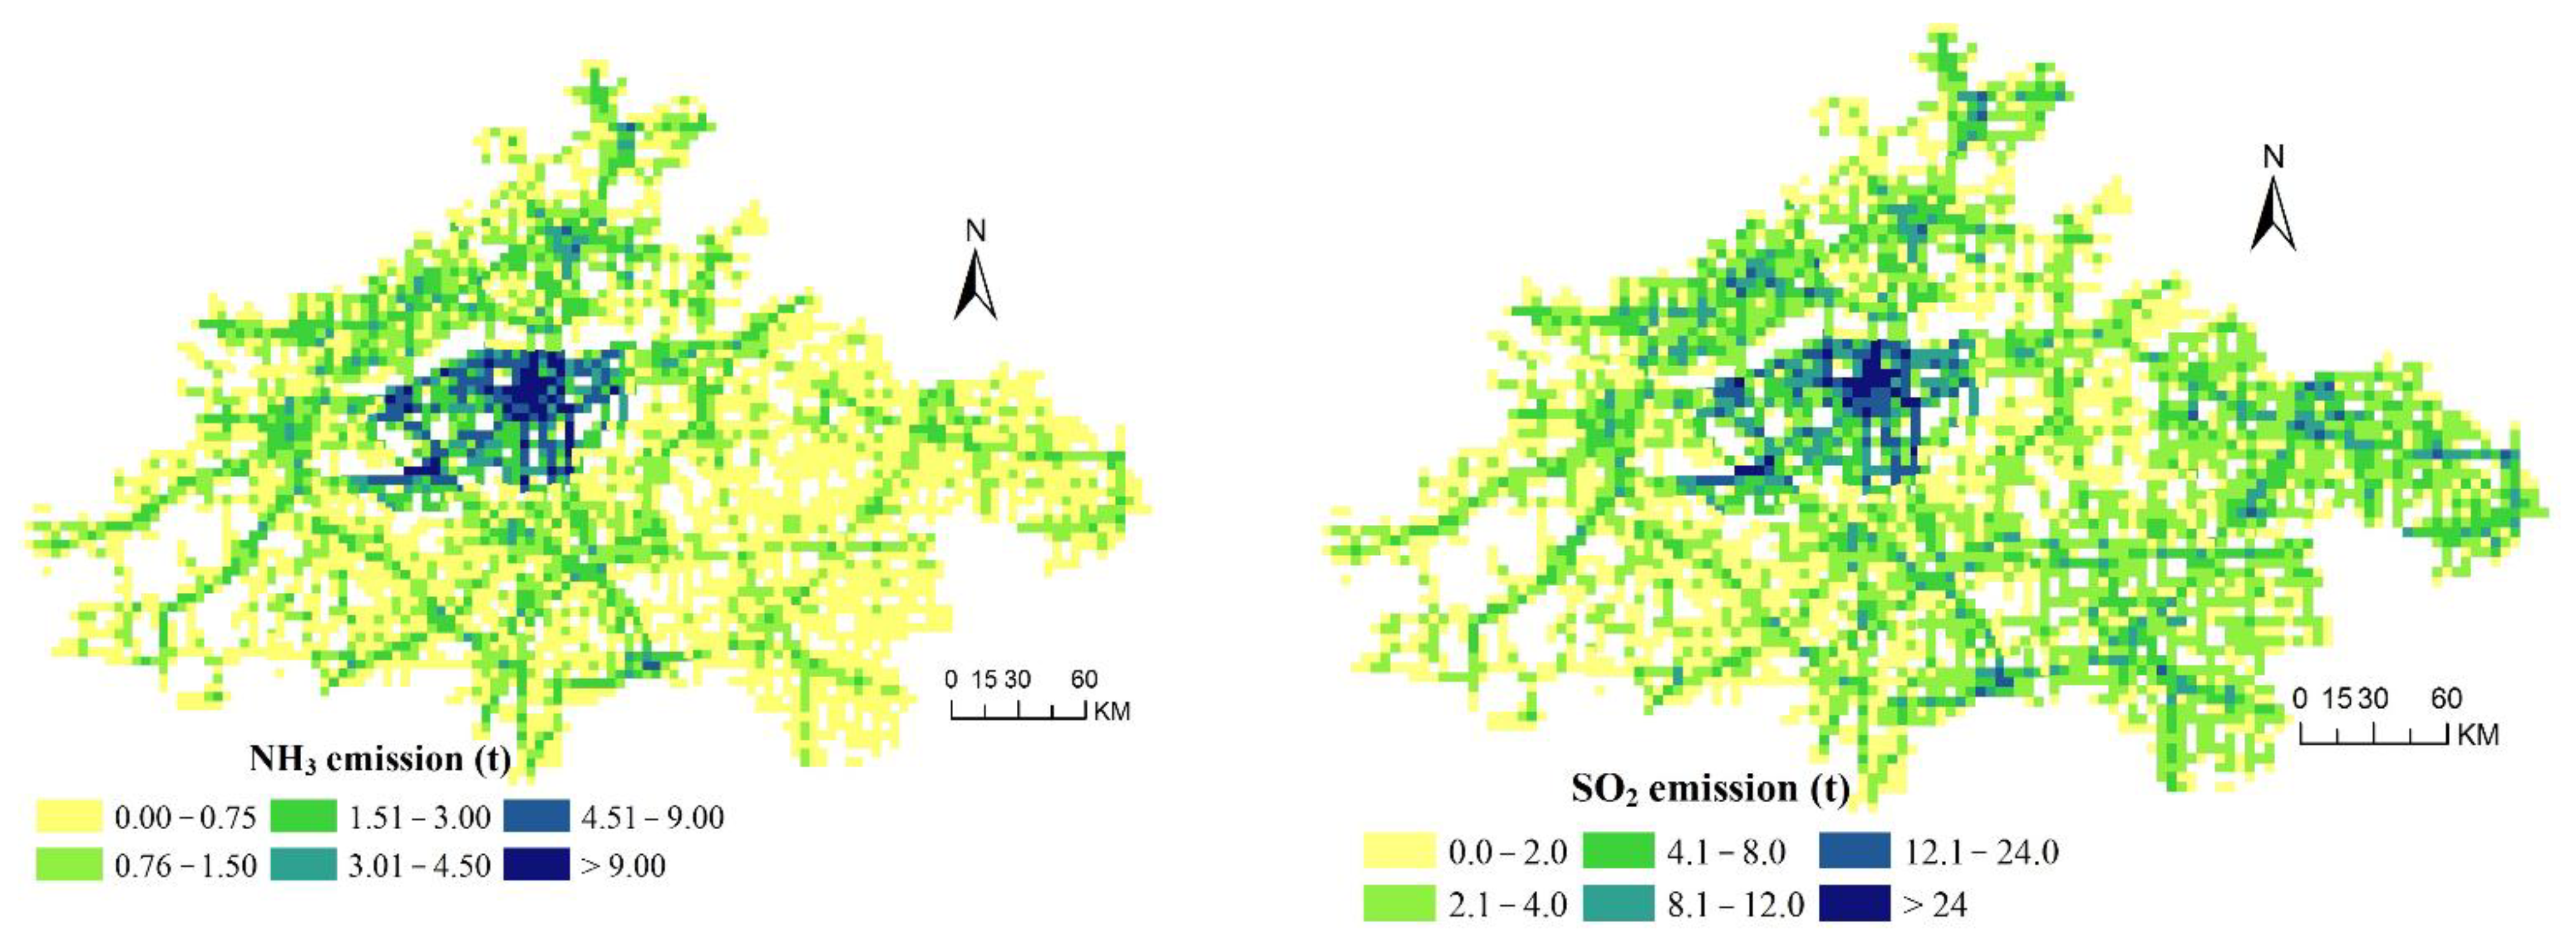
The spatial distributions of ten pollutants from vehicles in the CPUA in 2015 based on the CPUA road information acquired with GIS (geographic information system) software are shown in Figure 6. As shown in the figure, the spatial distributions of vehicle emissions were similar to the distribution of the road network, and the emission of pollutants showed a clear zonal distribution along the highway. Vehicle emissions were significantly higher in the urban centers (especially in Zhengzhou) than in the suburbs, as vehicles were mainly concentrated in urban centers. In addition, the emissions along the road networks on the suburban of the city were more pronounced in the spatial distribution of NOx, PM2.5, PM10, and SO2 as the main source of these pollutants was HDTs, and these vehicles mainly travel on highways.
3.3. The Emission Reduction Effects under Different Prevention and Control Scenarios
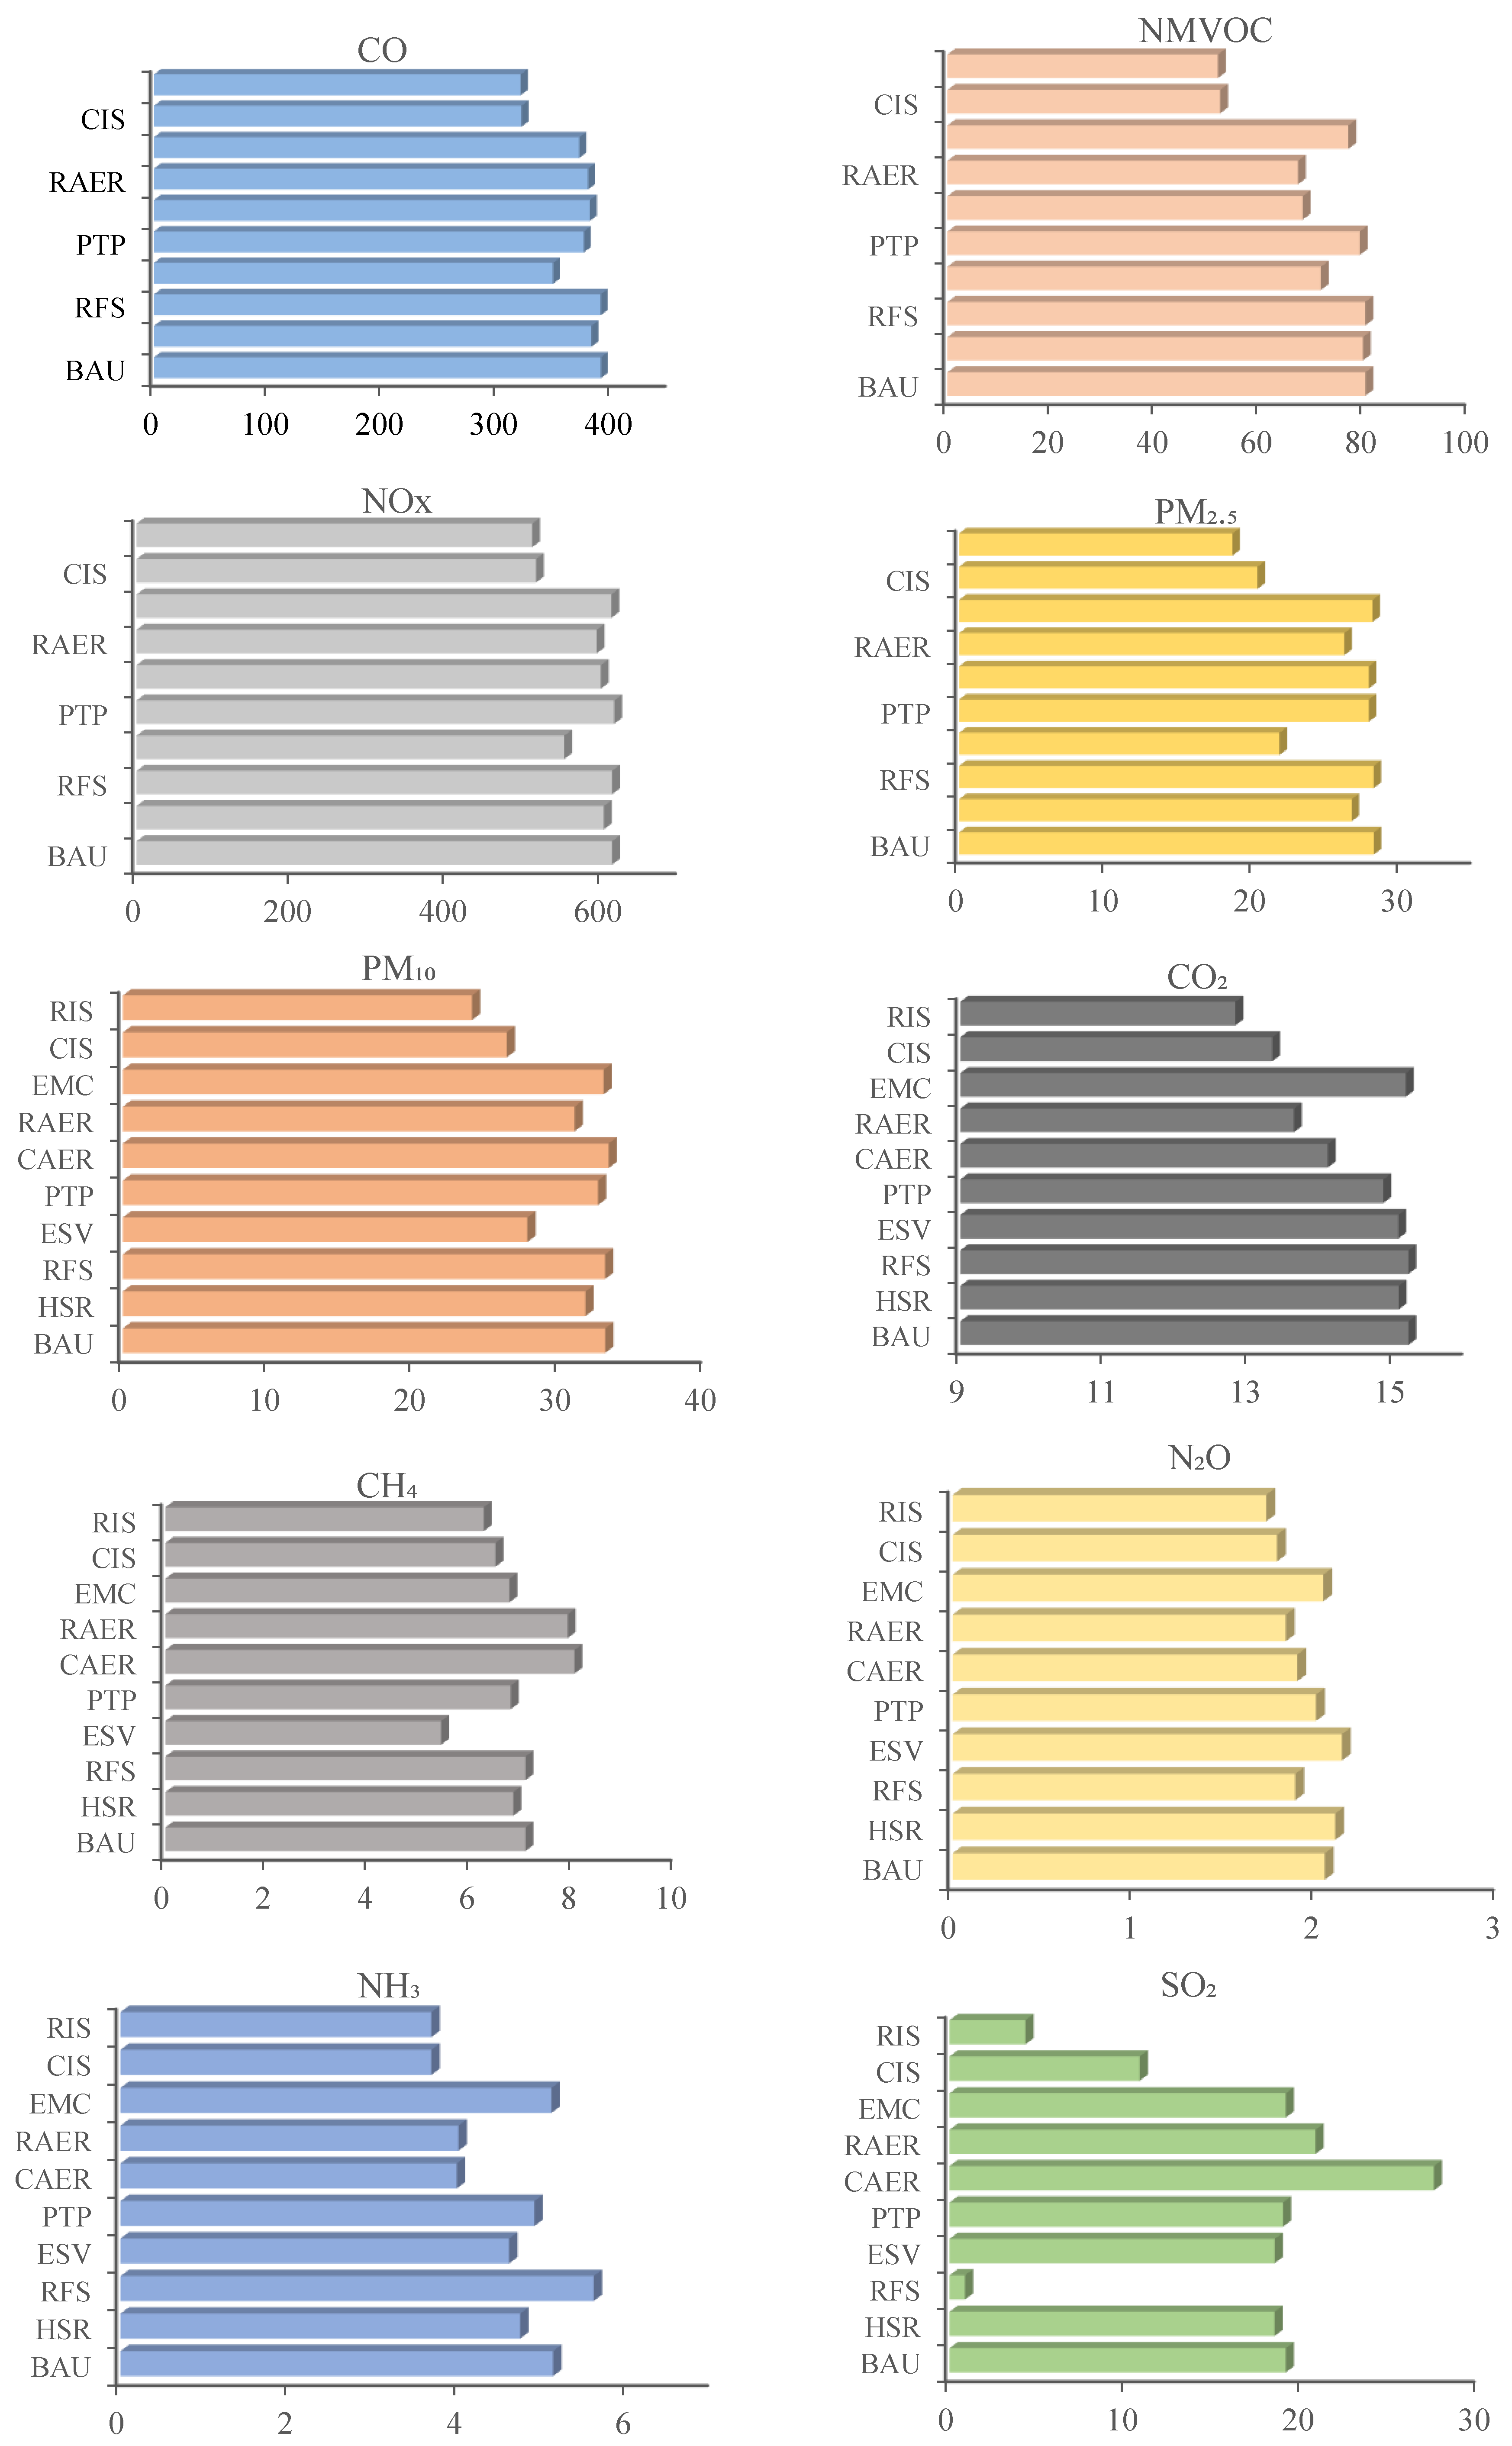
According to the prediction of vehicle populations, VKT, and emission factors of each vehicle type, the emissions of CO, NMVOC, NOx, PM2.5, PM10, CO2, CH4, N2O, NH3, and SO2 in the CPUA under the business as usual scenario in 2025 will be 420.3, 94.1, 586.9, 25.7, 30.6, 129,926.2, 7.1, 2.04, 4.7, and 19.03 Gg, respectively.
The reduction of ten vehicle pollutants differed under the various emission reduction measures (Figure 7). For single scenarios, the CAER and RAER scenarios would reach a certain level of reduction of most pollutants except for pollutants PM10 and CH4 relative to the business as usual scenario; among them, the NMVOC, CO2, N2O, and NH3 pollutants would achieve the maximum emission reduction effect, with reductions of 15.1% and 16.2%, 7.4% and 10.5%, 7.4% and 10.5%, and 22.3% and 21.9%, respectively. However, as the pollutant PM10 was mainly emitted from the upstream phase, its emissions under the CAER scenario were 0.73% higher than those under the business as usual scenario in 2025. It is well known that China’s main sources of electricity is generated by coal-fired power plants. The promotion of natural gas vehicles could effectively reduce PM10 emissions, but its emission reduction effect would not be significant as it would be offset by the high emissions from the upstream phase of electric vehicles. Hence the need for a higher proportion of clean energy to power electric cars in the future without increasing PM10 emission. The CH4 emissions would increase by 13.69% and 11.79% under the CAER and RAER scenarios, respectively, indicating that the reduction in CH4 emission due to the promotion of electric vehicles was offset by the reduction in CH4 emission caused by the promotion of natural gas vehicles. For vehicular SO2 emissions, the CAER scenario would increase SO2 emission by 44.31% relative to the business as usual scenario, and this is due to that the upstream power of electric vehicles is mainly generated by coal-fired power plants. Introducing vehicles powered by natural gas could reduce SO2 emission, but this would be offset by emissions from electricity generated by upstream electric vehicles. Therefore, the emission reduction effect of pollutant SO2 under the RAER scenario was much better than under the CAER scenario.
The ESV scenario would achieve the highest emission reduction effect for NOx, PM2.5, PM10, and CH4 pollutants of the single scenarios, leading to decreases of 10.16%, 22.7%, 16.31%, and 23.43%, respectively, compared with the business as usual scenario. In addition, the ESV scenario also would reduce the emission reduction of other pollutants to a certain extent, but its effect is not significant.
The RFS scenario would not have a significant emission reduction effect on the CO, NMVOC, NOx, PM2.5, PM10, CO2, and CH4 pollutants, but would have a better reduction effect on N2O, reduced by 8.0% relative to the business as usual scenario. It is worth noting that the RFS scenario has the largest decrease in SO2 emission, which decreased by 95.41% relative to the business as usual scenario. This is mainly because raising fuel standards controls the sulfur content in fuel, which is particularly significant for controlling vehicle SO2 emissions. Meanwhile, the NH3 emission would increase 9.51% under the RFS scenario compared with the business as usual scenario. This was because the three-way catalytic converter, which was used by vehicles to convert NOx to nitrogen in order to decrease NOx emission, can produce large amounts of NH3 emission in this process when the oil quality improves [41].
The HSR scenario would achieve emission reduction to a certain extent for all the pollutants except N2O, but this scenario did not represent the most significant emission reduction measure for any of the pollutants, indicating that the CPUA should implement more stringent emission standards. However, the N2O emission factors of HDTs and BUSs increased from the State IV to State VI standards [33]; therefore, the N2O emission under the HSR scenario increased by 2.79% compared with the business as usual scenario.
The PTP and EMC scenarios would reduce emissions of all the pollutants to a certain degree compared with the business as usual scenario, but their emission reduction effects were not significant.
The CO, NMVOC, NOx, PM2.5, PM10, CO2, N2O, and NH3 emissions would reach the significant decrease under the CIS and RIS scenarios. Furthermore, the RIS scenario would reach the maximum reduction effect for these eight pollutants, reduced by 18.04%, 35.33%, 16.99%, 34.04%, 27.80%, 15.79%, 15.78%, and 28.13%, respectively, in 2025 relative to the business as usual scenario. For CH4 and SO2, the RIS scenario again had a better emission reduction effect, decreasing concentrations by 11.59% and 77.41%, respectively.
4. Conclusions
This work estimated the vehicular emission inventories of ten pollutants in the CPUA from 1999 to 2015, and then analyzed its emission inter-annual trends, the main contributors, spatial distributions, and contribution rates of different cities for different pollutants. The results showed that the total vehicle emissions of CO, NMVOC, NOx, PM2.5, PM10, CO2, CH4, N2O, NH3, and SO2 emissions changed from 754.95 Gg, 92.99 Gg, 86.49 Gg, 7.24 Gg, 8.64 Gg, 9357.37 Gg, 4.41 Gg, 0.24 Gg, 0.064 Gg, and 16.19 Gg, respectively, in 1999 to 457.27 Gg, 85.59 Gg, 550.14 Gg, 24.92 Gg, 27.54 Gg, 90,860.77 Gg, 7.81 Gg, 1.48 Gg, 4.45 Gg, and 14.39 Gg, respectively, in 2015. Influenced by the vehicle population, implementation data of vehicular fuel standard, and emission standard, the emissions for these ten pollutants showed different trend over time. It is noteworthy that CO2 and NH3 emissions showed the most notable increase, increasing by 871% and 6823.88%, respectively, in 2015 relative to 1999. The contributions of each vehicle type to each pollutant were different. PCs and LDVs were the main sources of pollutants CO and NMVOC, while HDTs and BUSs were the main contributors to pollutants NOx, PM2.5, and PM10. PCs were the major contributor for other five pollutants. Vehicle emissions varied greatly at the city level. Zhengzhou was the dominant contributor of vehicular pollutant emissions in the CPUA, and vehicle emissions increased substantially in Shangqiu and Zhoukou from 1999 to 2015. The spatial distribution of vehicle emissions showed clear zonal distribution characteristics along the highways. Vehicle emissions were mainly concentrated in urban areas (especially in Zhengzhou) than in the surrounding areas.
Further, this paper also set up the nine reduction scenarios and compared the emission reduction effects under the different prevention and control measures. Relative to the business as usual scenario, by 2025, the ESV scenario would decrease CO, NOx, PM2.5, PM10, and CH4 emissions by 10.79%, 10.16%, 22.7%, 16.31%, and 23.43%, respectively; the RFS scenario would decrease SO2 emissions by 95.41%; the RAER scenario would decrease NMVOC, CO2, N2O, and NH3 emissions by 16.23%, 10.46%, 10.48%, and 22.27%, respectively, while the CAER scenario would not be a satisfactory way of controlling PM2.5, PM10, and SO2 emissions; and the RIS scenario would reduce CO, NMVOC, NOx, PM2.5, PM10, CO2, N2O, and NH3 emissions to a greater extent than the other scenarios. Emissions would be decreased more via the RIS scenario than via the CIS scenario. It is necessary to evaluate the degree to which emissions are decreased by switching to electric vehicles in the future. This would provide accurate data for formulating regional air pollution control measures. The emission reduction effect of single pollution control policy is relatively limited, while the emission reduction effect of all policies combined is very considerable. Therefore, the CPUA still needs to adopt comprehensive control policy to control vehicle pollution emissions from various aspects in the future. With Zhengzhou as the core area, while promoting the implementation of vehicle pollution control policy, the radiation drives the vehicle pollution control level of other cities, so as to carry out the prevention and control work of vehicle pollution within the region synchronously and efficiently, and truly implement regional coordinated governance.
Author Contributions
X.S. and Y.H. conceived and designed the research; X.S. drafted the manuscript and revised the manuscript; Y.H. prepared figures and discussed the results. All authors have read and agreed to the published version of the manuscript.
Funding
This study was supported by the “Scientific and Technological Innovation Programs of Higher Education Institutions in Shanxi” (STIP, 2019L0491; 2020L0251) and the “Philosophy and social science planning project of Shanxi Province in 2019” (2019B173).
Institutional Review Board Statement
Not applicable.
Informed Consent Statement
Not applicable.
Data Availability Statement
Data available in a publicly accessible repository.
Conflicts of Interest
The authors declare no conflict of interest.
Appendix A

Table A1.
The fitting parameter values of the Gompertz model.
| Cities | α | β | R2 |
|---|---|---|---|
| Zhengzhou | −4.3100 | −0.000005 | 0.9892 |
| Kaifeng | −2.7574 | −0.00002 | 0.9816 |
| Luoyang | −3.0382 | −0.00001 | 0.9926 |
| Pingdingshan | −2.3447 | −0.00003 | 0.9688 |
| Xinxiang | −3.2741 | −0.00002 | 0.9846 |
| Jiaozuo | −3.1558 | −0.00001 | 0.9908 |
| Xuchang | −3.1902 | −0.00001 | 0.9887 |
| Luohe | −2.5837 | −0.00002 | 0.9950 |
| Jiyuan | −3.4153 | −0.000009 | 0.9383 |
| Hebi | −3.2700 | −0.00001 | 0.9817 |
| Shangqiu | −2.2993 | −0.00004 | 0.9859 |
| Zhoukou | −2.4985 | −0.00004 | 0.9376 |
References
- Lang, J.; Tian, J.; Zhou, Y.; Li, K.; Chen, D.; Huang, Q.; Xing, X.; Zhang, Y.; Cheng, S. A high temporal-spatial resolution air pollutant emission inventory for agricultural machinery in China. J. Clean. Prod. 2018, 183, 1110–1121. [Google Scholar]
- Sun, S.; Zhao, G.; Wang, T.; Jin, J.; Wang, P.; Lin, Y.; Li, H.; Ying, Q.; Mao, H. Past and future trends of vehicle emissions in Tianjin, China, from 2000 to 2030. Atmos. Environ. 2019, 209, 182–191. [Google Scholar]
- Ministry of Environmental Protection of the People’s Republic of China. China Vehicle Environmental Management Annual Report; Ministry of Environmental Protection of the People’s Republic of China: Beijing, China, 2016.
- Sadik-Zada, E.R.; Ferrari, M. Environmental Policy Stringency, Technical Progress and Pollution Haven Hypothesis. Sustainability 2020, 12, 3880. [Google Scholar] [CrossRef]
- Lang, J.; Cheng, S.; Zhou, Y.; Zhang, Y.; Wang, G. Air pollutant emissions from on-road vehicles in China, 1999–2011. Sci. Total Environ. 2014, 496, 1–10. [Google Scholar] [PubMed]
- Hao, Y.P.; Song, X.W. Research on trends and spatial distribution of vehicular emissions and its control measure assessment in the Yangtze River Delta, China, for 1999–2015. Environ. Sci. Pollut. R 2018, 25, 36503–36517. [Google Scholar]
- Winther, M.; Nielsen, O.K. Technology dependent BC and OC emissions for Denmark, Greenland and the Faroe Islands calculated for the time period 1990–2030. Atmos. Environ. 2011, 45, 5880–5895. [Google Scholar]
- Kota, S.H.; Zhang, H.; Chen, G.; Schade, G.W.; Ying, Q. Evaluation of on-road vehicle CO and NOx National Emission Inventories using an urban-scale source-oriented air quality model. Atmos. Environ. 2014, 84, 99–108. [Google Scholar]
- Fameli, K.M.; Assimakopoulos, V.D. Development of a road transport emission inventory for Greece and the Greater Athens Area: Effects of important parameters. Sci. Total Environ. 2015, 505, 770–786. [Google Scholar]
- Lang, J.; Cheng, S.; Wei, W.; Zhou, Y.; Wei, X.; Chen, D. A study on the trends of vehicular emissions in the Beijing-Tianjin-Hebei (BTH) region, China. Atmos. Environ. 2012, 62, 605–614. [Google Scholar]
- Song, X.; Hao, Y.; Zhang, C.; Peng, J.; Zhu, X. Vehicular emission trends in the Pan-Yangtze River Delta in China between 1999 and 2013. J. Clean. Prod. 2016, 137, 1045–1054. [Google Scholar]
- Liu, Y.H.; Liao, W.Y.; Li, L.; Huang, Y.T.; Xu, W.J. Vehicle emission trends in China’s Guangdong Province from 1994 to 2014. Sci. Total Environ. 2017, 586, 512–521. [Google Scholar] [PubMed]
- Li, Y.Y. Research on Total Amount of Vehicular Emissions in Beijing-Tianjin-Hebei (BTH) Region and Its Abatement Control Strategy. Master’s Thesis, Tianjin University of Technology, Tianjin, China, 2015. (In Chinese). [Google Scholar]
- National Bureau of Statistics of Henan (NBSH). Henan Statistical Yearbook; China Statistics Press: Beijing, China, 2000–2016. [Google Scholar]
- China Automotive Technology & Research Center (CATRC). China Automotive Industry Yearbook; China Automotive Industry Yearbook Press: Tianjin, China, 2000–2016. [Google Scholar]
- National Bureau of Statistics of China (NBSC). International Statistical Yearbook; China Statistics Press: Beijing, China, 2000–2016.
- Wang, H.; Fu, L.; Zhou, Y.; Du, X.; Ge, W. Trends in vehicular emissions in China’s mega cities from 1995 to 2005. Environ. Pollut. 2010, 158, 394–400. [Google Scholar] [PubMed]
- Sun, S.D.; Jiang, W.; Gao, W.D. Vehicle emission trends and spatial distribution in Shandong province, China, from 2000 to 2014. Atmos. Environ. 2016, 147, 190–199. [Google Scholar]
- Guo, X.; Fu, L.; Ji, M.; Lang, J.; Chen, D.; Cheng, S. Scenario analysis to vehicular emission reduction in Beijing-Tianjin-Hebei (BTH) region, China. Environ. Pollut. 2016, 216, 470–479. [Google Scholar] [PubMed]
- Song, X.W.; Hao, Y.P.; Zhu, X.D. Air Pollutant Emissions from Vehicles and Their Abatement Scenarios: A Case Study of Chengdu-Chongqing Urban Agglomeration, China. Sustainability 2019, 11, 6503. [Google Scholar] [CrossRef] [Green Version]
- Lin, X.; Tang, D.; Ding, Y.; Yin, H.; Ji, Z. Study on the distribution of vehicle mileage traveled in China. Res. Environ. Sci. 2009, 22, 377–380. (In Chinese) [Google Scholar]
- Yao, Z.; Wang, Q.; Wang, X.; Zhang, Y.; Shen, X.; Yin, H.; He, K. Emission inventory of unconventional pollutants from vehicles in typical cities. Environ. Pollut. Control 2011, 33, 96–101. (In Chinese) [Google Scholar]
- Yao, Z.L.; Zhang, M.H.; Wang, X.T.; Zhang, Y.Z.; Huo, H.; He, K.B. Trends in vehicular emissions in typical cities in China. China Environ. Sci. 2012, 32, 1565–1573. (In Chinese) [Google Scholar]
- Huo, H.; Zhang, Q.; He, K.; Yao, Z.; Wang, X.; Zheng, B.; Streets, D.G.; Wang, Q.; Ding, Y. Modeling vehicle emissions in different types of Chinese cities: Importance of vehicle fleet and local features. Environ. Pollut. 2011, 159, 2954–2960. [Google Scholar]
- Huo, H.; Zhang, Q.; He, K.; Yao, Z.; Wang, M. Vehicle-use intensity in China: Current status and future trend. Energy Policy 2012, 43, 6–16. [Google Scholar]
- Zhao, X.Y. Research on Vehicle Pollution Emission Characteristics and Control Measure in Zhengzhou. Master’s Thesis, Jilin University, Changchun, China, 2014. (In Chinese). [Google Scholar]
- Zhang, W.K. Research on Establishment of Vehicle Emission Inventory and Its Abatement Scenarios in Zhengzhou. Master’s Thesis, Zhengzhou University, Zhengzhou, China, 2015. (In Chinese). [Google Scholar]
- Wang, Q.D.; He, K.B.; Yao, Z.L.; Huo, H. Research in motor vehicle driving cycle of Chinese cities. Environ. Pollut. Control 2007, 29, 745–748. (In Chinese) [Google Scholar]
- Ministry of Ecology and Environment. Technical Guidelines for Road Motor Vehicle Emission Inventory of Air Pollutants; Ministry of Ecology and Environment: Beijing, China, 2018.
- Wang, H.; Fu, L.; Lin, X.; Zhou, Y.; Chen, J. A bottom-up methodology to estimate vehicle emissions for the Beijing urban area. Sci. Total Environ. 2009, 407, 1947–1953. [Google Scholar] [CrossRef] [PubMed]
- China Meterological Administration (CMA). China Meteorological Yearbook; Meteorological Press: Beijing, China, 2000–2016.
- Wang, R.J. Fuel-Cycle Assessment of Energy and Environmental Impacts from Electric Vehicles and Natural Gas Vehicles. Ph.D. Thesis, Tsinghua University, Beijing, China, 2015. (In Chinese). [Google Scholar]
- Cai, H.; Xie, S.D. Determination of emission factors from motor vehicles under different emission standards in China. Acta Sci. Nat. Univ. Pekin. 2010, 46, 319–326. [Google Scholar]
- Che, W.W. A Highly Resolved Mobile Source Emission Inventory in the Pearl River Delta and Assessment of Motor Vehicle Pollution Control Strategies. Master’s Thesis, South China University of Technology, Guangzhou, China, 2010. (In Chinese). [Google Scholar]
- Zhang, S.J. Characteristics and Control Strategies of Vehicle Emissions in Typical Cities of China. Ph.D. Thesis, Tsinghua University, Beijing, China, 2014. (In Chinese). [Google Scholar]
- Tao, S.C. Emission Inventory and Control Strategies of Road Mobile Sources in Guanzhong Metropolitan Area. Master’s Thesis, Chang’an University, Xi’an, China, 2016. (In Chinese). [Google Scholar]
- Ma, P. Analysis of Vehicle Emission Inventory and Its Uncertain under Two Scales. Master’s Thesis, Northeast Dianli University, Jilin, China, 2015. (In Chinese). [Google Scholar]
- Shen, X.; Yao, Z.; Zhang, Q.; Wagner, D.V.; Huo, H.; Zhang, Y.; Zheng, B.; He, K. Development of database of real-world diesel vehicle emission factors for China. J. Environ. Sci. 2015, 31, 209–220. [Google Scholar] [CrossRef] [PubMed]
- Chan, C.K.; Yao, X.H. Air pollution in mega cities in China. Atmos. Environ. 2008, 42, 1–42. [Google Scholar] [CrossRef]
- Behera, S.N.; Sharma, M. Investigating the potential role of ammonia in ion chemistry of fine particulate matter formation for an urban environment. Sci. Total Environ. 2010, 408, 3569–3575. [Google Scholar] [CrossRef] [PubMed]
- Wang, S.X.; Zhao, B.; Cai, S.Y.; Klimont, Z.; Nielsen, C.; McElroy, M.B.; Morikawa, T.; Woo, J.H.; Kim, Y.; Fu, X.; et al. Emission trends and mitigation options for air pollutants in East Asia. Atmos. Chem. Phys. 2014, 14, 6571–6603. [Google Scholar] [CrossRef] [Green Version]
Figure 1.
Location of the Central Plains Urban Agglomeration.

Figure 2.
Vehicle population in the Central Plains Urban Agglomeration (CPUA) from 1999 to 2025. PC, passenger car; LDV, light-duty vehicle; BUS, bus; HDT, heavy-duty truck; MC, motorcycle.
Figure 2.
Vehicle population in the Central Plains Urban Agglomeration (CPUA) from 1999 to 2025. PC, passenger car; LDV, light-duty vehicle; BUS, bus; HDT, heavy-duty truck; MC, motorcycle.

Figure 3.
The annual vehicle kilometers travelled by different types of vehicles in the CPUA from 1999 to 2025.
Figure 3.
The annual vehicle kilometers travelled by different types of vehicles in the CPUA from 1999 to 2025.

Figure 4.
The emissions of ten pollutants from vehicles in the CPUA from 1999 to 2015.


Figure 5.
Contribution rates of different cities to the total vehicle emissions in the Central Plains Urban Agglomerations (the colors from bottom to top represent: Zhengzhou, Hebi, Jiyuan, Jiaozuo, Kaifeng, Luoyang, Luohe, Pingdingshan, Shangqiu, Xinxiang, Xuchang, and Zhoukou).
Figure 5.
Contribution rates of different cities to the total vehicle emissions in the Central Plains Urban Agglomerations (the colors from bottom to top represent: Zhengzhou, Hebi, Jiyuan, Jiaozuo, Kaifeng, Luoyang, Luohe, Pingdingshan, Shangqiu, Xinxiang, Xuchang, and Zhoukou).

Figure 6.
Spatial distributions of vehicle emissions in the Central Plains Urban Agglomeration (2015).
Figure 6.
Spatial distributions of vehicle emissions in the Central Plains Urban Agglomeration (2015).


Figure 7.
Vehicle emissions under the different scenarios. BAU, business as usual; HSR, high standard replacements; ESV, eliminating substandard vehicles; RFS, raising fuel stands; PTP, public transport priority; EMC, eliminating motorcycles; CAER, conservative alternative energy replacement; CIS, conservative integrated scenario; RIS, radical integrated scenario; RAER, radical alternative energy replacement.

Table 1.
Timetable for the implementation of vehicle emission standards in the Central Plains Urban Agglomeration (CPUA). PC, passenger car; LDV, light-duty vehicle; BUS, bus; HDT, heavy-duty truck; MC, motorcycle.
Table 1.
Timetable for the implementation of vehicle emission standards in the Central Plains Urban Agglomeration (CPUA). PC, passenger car; LDV, light-duty vehicle; BUS, bus; HDT, heavy-duty truck; MC, motorcycle.
| Vehicle Types | State I | State II | State III | State IV | State V |
|---|---|---|---|---|---|
| PC | 2000 | 2004 | 2008 | 2012 | / |
| LDV | 2001 | 2006 | 2008 | 2012 | |
| BUS | 2001 | 2005 | 2008 | 2015 | / |
| HDT | 2001 | 2005 | 2008 | 2015 | |
| MC | 2002 | 2004 | 2010 | / | / |
Table 2.
The sulfur content limit in gasoline and diesel in the CPUA (mg/kg).
| Fuel | 1999 | 2000 | 2001 | 2002 | 2003 | 2004 | 2005 | 2006 | 2007 |
| Gasoline | 1500 | 1000 | 1000 | 1000 | 800 | 800 | 800 | 500 | 500 |
| Diesel | 5000 | 5000 | 5000 | 2000 | 2000 | 2000 | 2000 | 2000 | 2000 |
| Fuel | 2008 | 2009 | 2010 | 2011 | 2012 | 2013 | 2014 | 2015 | |
| Gasoline | 1500 | 500 | 150 | 150 | 150 | 150 | 50 | 50 | |
| Diesel | 5000 | 2000 | 2000 | 350 | 350 | 350 | 350 | 50 |
Table 3.
The average driving speed for different road conditions (km/h).
| Urban | Suburb | Highway | |
|---|---|---|---|
| CPUA | 27 | 40 | 80 |
Table 4.
Description of prevention and control scenarios for vehicles.
| Scenario | Scenario Description |
|---|---|
| Business as usual (BAU) | With 2015 as the base year, the existing vehicle emissions control measures will be maintained, vehicles will be naturally eliminated, and no new emission reduction measures will be implemented. |
| High standard replacement (HSR) | For PCs and LDVs, the State V emission standard will be implemented in 2017 and 2018, respectively, and the State VI emission standard will be implemented in 2020. For BUSs and HDTs, the State V emission standard will be implemented in 2017, and the State VI emission standard will be implemented in 2023. |
| Raising fuel standards (RFS) | The fuel standards of State V and State VI will be implemented in 2017 and 2019, respectively. |
| Eliminating substandard vehicles (ESV) | Yellow-label vehicles (that does not meet exhaust emission standards) and MCs pre-State I standard will be eliminated by 2017. The gasoline vehicles implemented State I and II standards, diesel vehicles implemented State III, and MCs implemented State I and State II emission standards will be eliminated by 2020. The gasoline vehicles implemented State III standards will be eliminated by 2023. |
| Public transport priority (PTP) | The annual vehicle kilometers travelled by PCs and MCs will be 10% and 20% lower, respectively, than those established in the BAU scenario in 2025. |
| Conservative alternative energy replacement (CAER) | The proportion of electric, hybrid, and natural gas-powered BUSs of all BUSs will reach 20%, 30%, and 50%, respectively, by 2025. The proportion of electric, hybrid, and natural gas-powered PCs of all PCs will reach 15%, 10%, and 10%, respectively, by 2025. |
| Radical alternative energy replacement (RAER) | The electricity provided to the electric vehicles will be produced from “clean” energy. The other parameters will the same as those for the CAER scenario. |
| Eliminating motorcycles (EMC) | MCs will be forbidden in all urban areas by 2020, and other control measures will be consistent with the BAU scenario. |
| Conservative integrated scenario (CIS) | The CIS will combine all the control measures except for those in the RAER scenario, and the effects of the reduction measures will be estimated by the effects of each control measure. |
| Radical integrated scenario (RIS) | The RIS will combine all the control measures except for those in the CAER scenario, and the method for calculating the effects of the emission reduction measures will the same as the CIS. |
Publisher’s Note: MDPI stays neutral with regard to jurisdictional claims in published maps and institutional affiliations. |
© 2021 by the authors. Licensee MDPI, Basel, Switzerland. This article is an open access article distributed under the terms and conditions of the Creative Commons Attribution (CC BY) license (http://creativecommons.org/licenses/by/4.0/).
Share and Cite
MDPI and ACS Style
Song, X.; Hao, Y. Research on the Vehicle Emission Characteristics and Its Prevention and Control Strategy in the Central Plains Urban Agglomeration, China. Sustainability 2021, 13, 1119. https://0-doi-org.brum.beds.ac.uk/10.3390/su13031119
AMA Style
Song X, Hao Y. Research on the Vehicle Emission Characteristics and Its Prevention and Control Strategy in the Central Plains Urban Agglomeration, China. Sustainability. 2021; 13(3):1119. https://0-doi-org.brum.beds.ac.uk/10.3390/su13031119
Chicago/Turabian StyleSong, Xiaowei, and Yongpei Hao. 2021. "Research on the Vehicle Emission Characteristics and Its Prevention and Control Strategy in the Central Plains Urban Agglomeration, China" Sustainability 13, no. 3: 1119. https://0-doi-org.brum.beds.ac.uk/10.3390/su13031119
Note that from the first issue of 2016, this journal uses article numbers instead of page numbers. See further details here.