Article

Relationship between Statistics Anxiety and Academic Dishonesty: A Comparison between Learning Environments in Social Sciences

1
Interdisciplinary Studies, Zefat Academic College, Zefat 1320611, Israel
2
Orot Israel College of Education, Rehovot 76110, Israel
3
Western Galilee College, Akko 2412101, Israel
*
Author to whom correspondence should be addressed.
Sustainability 2021, 13(3), 1564; https://0-doi-org.brum.beds.ac.uk/10.3390/su13031564
Submission received: 30 December 2020 / Revised: 25 January 2021 / Accepted: 26 January 2021 / Published: 2 February 2021

Abstract

:
The current research examines the impact of Statistics Anxiety on academic ethical behavior as manifesting in undergraduate social science students attending introductory statistics courses in different learning environments: Covid-19-Emergency Remote Teaching (ERT), Planned Online Environment (POE), and Face-to-Face (F2F) courses. Data were collected from students in academic institutions studying for a bachelor’s degree in the social sciences. Structural Equation Modeling (SEM) was used to examine the relationship between students’ previous academic achievements and Academic Dishonesty mediated by Statistics Anxiety. The results of multi-group analysis show that path coefficients differ between the three learning environments (POE, F2F, and ERT). Specifically, the results support a model in which previous math and academic achievements are significantly related to Academic Dishonesty mediated by Statistics Anxiety in a POE context only. Accordingly, POE statistics learning is less effective than F2F instruction and practice. Our research shows that instructors’ presence in the learning process reduces students’ anxiety levels and unethical behavior. Thus, we recommend that in POE, the instructor’s presence includes supportive, emphatic, and interpersonal interaction to reduce virtual distance. We conclude that introductory courses in statistics need to empower students experiencing Statistics Anxiety for a better sustainable statistical literacy population.

1. Introduction

Sustainability has become an imperative in today’s rapidly changing world, and hence, a key topic in higher education debates and programs worldwide. Colleges and universities play a crucial role in informing the knowledge values and skills of future leaders and citizens [1]. Sustainability is a broad notion comprising environmental, social, and ethical aspects. In this context, higher education institutions play a twofold role: (1) they grant technical knowledge and professional skills (e.g., statistical literacy) to the new generations and focus on their students’ best possible academic outcomes (i.e., excellent grades). (2) They strengthen students’ values, principles, and moral development. Differently stated, higher education institutions are required to foster transparency, responsibility, and ethical decision-making criteria. Their goal is to create responsible, honest, and ethically acting citizens, for which the promotion of academic integrity is key. The foregoing demands active confrontation policies of unethical or dishonest conduct [2].
Thus, sustainable learning and education are a life-long, life-wide, and life-deep challenge addressing the key place technological solutions have in daily contexts and learning settings. These include: the aging population, social exclusion mainly among youths, population concentration in larger cities, persistent unemployment, the absence of informal educational chances, as well as the difficulties of providing sustainable formal education in distant areas [3].
The Covid-19 pandemic forced a rapid transition to a full online teaching mode or Emergency Remote Teaching. This required a quick conversion of face-to-face classroom activities to online environments [4]. Despite that, debates on distance education, remote teaching, online instruction, approaches to pedagogy, new models of education (e.g., mobile journalism) [5], and curriculum design are not new [6]. Moreover, research on postsecondary students’ mental health during the Covid-19 pandemic is emerging [7]. These studies show increasing levels of general anxiety and stress among academic staff and students [8].
Research on undergraduate social sciences students shows that they face anxiety toward statistics, which negatively influences learning and academic performance [9]. Moreover, anxiety and inappropriate academic behavior are related [10]. Mere exposition to statistics courses may at times alter anxiety levels among students [11]. More specifically, students tend to experience Statistics Anxiety along with lack of motivation, poor self-confidence, and the self-conscious inability to employ quantitative data analysis. This has been aggravated by the Covid-19 global crisis, which has led to a paradigm shift in the way learners access educational contents [12], i.e., how introductory statistical courses are delivered during the pandemic global crisis.
Statistics Anxiety has negative consequences for individuals [13,14], including engagement in academically unethical acts [10,15,16]. These are part of an intensifying trend toward academic misbehavior such as plagiarism and cheating [17,18,19]. Academic dishonesty, i.e., unethical academic behavior, is also a practical issue questioning learning’s effectivity in the long run. Academic Dishonesty strongly correlates with subsequent unethical behavior in the workplace [20].
Most students tend to associate statistics-related courses with high anxiety-provoking responses [21]. Hence, several tools have been developed to measure Statistics Anxiety [13] and formulate more successful pedagogic strategies [14]. Yet the specific relationship of Statistics Anxiety and ethical performance is still ambiguous. What is nonetheless clear is that one’s anxiety level is the most remarkable predictor of student performance in statistics courses [14].
Thus far, scholarly studies have focused on different aspects of statistical literacy and Academic Dishonesty, albeit separately. This study fills this gap by examining the impact of Statistics Anxiety on academic ethical behavior as manifesting in undergraduate social sciences students attending introductory statistics courses in different learning environments such as: Emergency Remote Teaching (ERT), Planned Online Environment (POE), and Face-to-Face (F2F) courses. Drawing from the research literature, we discuss the implications and results that better designed introductory courses in statistics may have for supporting statistical literacy courses and that empower students experiencing statists anxiety, for a better sustainable statistical literacy population.

2. Theoretical Background

2.1. Anxiety

A short description of the general phenomenon of anxiety is necessary before clarifying the more specific notion of Statistics Anxiety. The concept of anxiety has been widely researched [22]. It comprises psychological and physiological responses to specific situations, whereby individuals react in advance to future threats, including avoidance behavior [23]. The latter emerges under different strategical forms such as distractions, suppression, and escape, thereby allowing a reduction of unpleasant experiences [24]. Anxiety is an emotionally distressful response that is stimulated by potentially threatening or uncertain situations and outcomes [10]. For some scholars anxiety negatively affects performance within different academic fields [25]. Yet others like Savage and Torgler [26] held that elite sport provides an example of well controlled anxiety impacting performance positively. Macher et al. [27] contended that anxiety has a positive influence on learning behaviors. Nonetheless, the assertion that introductory statistics courses in social sciences induce anxiety, and subsequent negative outcomes underpin many studies and literature reviews [28]. Despite a growing body of literature comparing performance as manifesting in POE and F2F statistics students [29], the scholarly research comparing the manifestations of Statistics Anxiety in F2F, POE, and ERT environments, and their relation to academic misbehavior is scanty. The present research study fills this gap.

2.2. Statistics Anxiety

Statistics Anxiety is a common phenomenon of situational anxiety. It is defined as a momentary feeling of anxiety aroused when taking a statistic course or dealing with a statistical analysis [9], the effects of which may negatively affect performance. Statistics Anxiety is a personal feeling of disturbance, uneasiness, nervousness, and fear connected to statistics. It is determined by situational antecedents such as a statistics course and educational environment [14]. Most scales measuring Statistics Anxiety combine different components of anxious emotions and notions of students’ attitudes [30]. The Statistics Anxiety Rating Scale (STARS) by Cruise and colleagues [31] is one of the most common measuring tools employed in academic settings. It is a widely accepted six-factor model representing Statistics Anxiety’s different dimensions: (1) Worth of statistics refers to the way learners perceive the relevance and usefulness of statistics. Many undergraduate social sciences students often report that the worth of learning statistics is relatively low due to its irrelevance or limited usefulness in their field of study and future career [32]; (2) Interpretation anxiety refers to the anxiety learners experience when they are required to interpret statistical data in order to make statistical decisions during data analysis; (3) Test and class anxiety refers to an anxiety type that arises in situations related to learning processes during statistics course enrollment, attendance, and test assessments; (4) Computational self-concept refers to the way learners perceive their mathematical competence for learning statistics, including their abilities to understand and perform statistical and mathematical computations; (5) Fear of asking for help is a characteristic that is described as the anxiety experienced while trying to ask either an instructor or a fellow student to interpret statistical information when clarifying the material studied in a course; and (6) Fear of statistics teachers refers to the learner’s perception of statistics instructors and statisticians.
Apart from an adverse impact on academic achievement and performance [33], the negative effect of Statistics Anxiety and course performance [9] may lead to academic misbehavior such as cheating and plagiarism. In addition, anxiety and dishonest behavior correlate [10]. Hence, understanding the phenomenon of Statistics Anxiety among undergraduate students in today’s increasingly data-driven world is a key issue as this may allow to reduce its levels and avoid academic misbehavior.
The present research enriches the research literature by highlighting the relationship comprising Statistics Anxiety and Academic Misbehavior. It provides new insights into these phenomena and sheds light on how to minimize statistical anxiety and maximize academic integrity.

2.3. Students’ Previous Academic Achievements and Statistics Anxiety

The phenomenon of Statistics Anxiety may not be accurately understood if detached from its environmental antecedents [30], among which previous academic educational levels are prominent [34]. Research has demonstrated that students’ experiences and attitudes toward mathematics contribute to their attitude toward statistics, which in turn contributes to feelings of Statistics Anxiety. Some students experience Statistics Anxiety because of a lack of mathematics knowledge, lower previous achievement, and negative previous experience in mathematics courses and fear of mathematics [30,35]. Thus, students with less experience in mathematics reported higher levels of Statistics Anxiety and difficulties in following lectures in statistics. Similarly, people with a higher level of knowledge in scientific research and statistics reported a lower level of Statistics Anxiety [34].
As stated, predictors of Statistics Anxiety are: one’s academic major and status, one’s perception of prior experience in mathematics [36], which comprise mathematics level, grade point average, matriculation grade in mathematics. Thus, we posit:
Hypothesis 1 (H1).
Students’ previous achievements will have a negative impact on Statistics Anxiety, meaning that students with higher academic achievements will report lower Statistics Anxiety.

2.4. Academic Dishonesty

Quality education is a synonym of academic integrity [37] and ethics. Combined, these two constitute the cornerstone of all learning processes. Moreover, academic integrity education has changed throughout the years. This has included policy improvements and the role played by the different actors involved. Scholars have stressed the need to strengthen student engagement levels, allow part-time faculty members to participate more actively in disseminating their ideas, foster true student learning, and formulate clear policies and common missions [37] to prevent academic misconduct [38].
Trust, respect, fairness, and responsibility are required components of academic integrity [39]. On the other hand, unethical academic behavior or Academic Dishonesty refers to different misconducts such as cheating, fraudulent behavior, or plagiarizing [40]. Academic Dishonesty is a simultaneously moral and practical issue [2]. A phenomenon like cheating raises the question as to the true extent of learning and its direct implications for a subsequently sustainable professional life [37] in terms of knowledge and unethical behavior. Studies have shown that Academic Dishonesty related behavior has intensified [20], as at some point of their careers, students engage in it [15,41]. This poses a significant ethical and educational problem that undermines the academic system’s integrity, reputation [2], and sustainability, for these are built on the notions of trust in the knowledge produced and shared [42].
Academic Dishonesty can be traced back to different personal and societal factors [15,20,41]. Whereas there is enough scholarly knowledge on the prevalence, nature, and consequences of Academic Dishonesty, relatively little is known about its connection to Statistics Anxiety, including the fact that a person’s behavior is determined by their circumstances [43].

2.5. Statistics Anxiety and Academic Dishonesty

Scholarly studies have shown that anxiety and unethical or dishonest behavior correlate [10]. People experiencing anxiety tend to feel self-threatened and engage in unethical acts to restore confidence [16]. More specifically, studies have shown that anxiety feelings are frequent among students and academy members. An example may be students being required to work on complex and difficult educational tasks. They often turn to dishonest behavior [15] to avoid situations that they identify as potentially triggering anxiety feelings. A further example is highly anxious students who plan to cheat in their statistics course exams, as completing these courses is a compulsory requirement for graduation [14]. Nonetheless, scholarly studies have also revealed that some students are less concerned with others’ opinions of them and adhere to their own moral prescriptions, thereby defining themselves as ethical individuals [44]. Thus, we posit:
Hypothesis 2 (H2).
Statistics Anxiety will have a positive impact on Academic Dishonesty.

2.6. Statistics Anxiety, Students’ Previous Achievements, and Academic Dishonesty

As mentioned above (Section 2.3) students’ previous experience and achievements in mathematics courses [36] (i.e., mathematics level, grade point average, matriculation grade in mathematics) influence their Statistics Anxiety levels. Along with the correlation between dishonest behavior and anxiety [10], consequently, we posit:
Hypothesis 3 (H3).
Statistics Anxiety will mediate the relationship between students’ previous achievements and Academic Dishonesty.

2.7. Learning Environment

A learning environment refers to the “where” and “how” students learn whether physically, digitally, culturally, or contextually. The elements constituting a learning environment are: the people in it, the technologies available, its physical layout, its social and cultural environment [45], and the pedagogical methods employed by teachers [46]. In addition, a learning environment includes the students’ personal characteristics and situations, e.g., their motivation to acquire knowledge, their active participation in the learning environment, and their attitudes toward subject knowledge and course delivery. Research studies have shown that learning environments affect academic achievement [47]. In addition, the scholarly research differentiates among F2F, POE, and ERT.
Moreover, instructional situations have been shown to affect students’ levels of Statistics Anxiety, especially fast-paced statistics courses [48]. Intensified and unorganized teaching contributes to hindering the understanding and assimilation of statistics knowledge. This leads to relatively high levels of Statistics Anxiety, which are additionally intensified when educators make use of an oppressive and heavy pedagogical style. Yet scholars have found that this can be lessened when lessons are entertaining and humorously delivered [49]. In other words, there is a direct relationship between class atmosphere and students’ feelings and attitudes toward statistics.
Furthermore, statistics classes tend to be based on book teaching, which may lead to higher anxiety due to its disconnection from real or “tangible” situations [50]. In this context, employing real-life data in classroom teaching may contribute to lessen Statistics Anxiety levels. In line with this, educators’ immediacy, i.e., verbal and nonverbal expressions or addressing students by name, impacts students’ Statistics Anxiety [51]. More specifically, students tend to overestimate the difficulty of learning statistics, which impacts their sense of discomfort and self-competence. Accordingly, instructors’ positive comments and direction are crucial for alleviating anxiety.
In addition, the scholarly research of statistics learning has discussed and compared POE statistics courses and F2F on-campus learning. Accordingly, learning statistics in POE may be less effective than F2F instruction and practice. The reason for this may be that in F2F statistics courses students can perceive their educator’s concerns and attitudes more concretely [30].
F2F teaching methods are still a common academic practice [52]. Nonetheless, the scholarly research has extensively shown that students perform worse in POE courses than in F2F ones [53] or differently [54]. Parameters include: course completion, grades, and ensuing college enrollment [55].
POE, also termed e-learning or distance learning, has become an increasing phenomenon in recent years. A main reason for this is the flexibility and convenience it offers to students. Moreover, online learning allows increased participation opportunities to students who seldom participate in F2F settings. In addition, it offers opportunities for students who may not otherwise attend F2F lessons for different reasons, such as careers, families, geographic location, weather, crises [52].
As to its mode of instruction, POE differs from regular F2F teaching. It requires that educators develop new teaching skills and get pedagogical support, which they seldom get from their institutions [56]. Moreover, educators are often trained to present material in the classroom, speak clearly, design different kinds of presentations, apply engaging elements such as quizzes, and moderate questions and answers from their audience. Nonetheless, the POE classroom poses qualitatively different challenges. In it, the educator delivers a virtual lecture from home in which not all participants can be seen. This restricts the teacher’s ability to get immediate feedback from his or her students.
Despite the vast discussion of the pros and cons of online learning and teaching in the 21st century [57], the Covid-19 pandemic has forced the whole educational system to adapt to new challenges [58]. Colleges, universities, and schools are moving from in-person courses to unplanned online teaching and learning formats [59]. This is forcing educators to abandon their traditional modes of instruction and interact via the Internet [60]. The appearance of ERT [61] or other online multimedia tools, whether in the format of synchronous or asynchronous lectures, is currently being discussed [62]. Synchronous sessions refer to real-time meetings. Professors and students hold live web-based video conferences via Adobe Connect, Skype, Google Hangout, Zoom, or WebEx platforms. Asynchronous sessions, in turn, refer to posting teaching and learning materials on a platform to let others reply at their own pace. ERT [61] is meant to allow instruction continuity when the semester needs to be abruptly interrupted. Its main goal is that students complete their studies even at the expense of altering course lesson plans. The foregoing forces teachers to simultaneously complete their courses, address their goals, and deal with students’ anxiety. More concretely, the challenge posed is that instructors are compelled to rapidly adapt course plans, activities, and material to the specific demands of online formats. As to student anxiety, it is the result of the abrupt shift when moving to online settings. Anxiety is the expression of sudden life changes, which may include getting disconnected from face-to-face social interactions and exchanging the classroom for one’s home. Accordingly, instructors are required to consider the above besides the instructional ramifications caused by the modifications in course format [63].
Moreover, recent studies have shown that the experience of POE learning diverges intrinsically and meaningfully from ERT courses [64], for ERT comprises quickly developed instructional responses meant to provide temporary support during a crisis period. In addition, ERT is characterized by its lack of pre-planned resources and infrastructures [45]. More specifically, instructors taking part in ERT are usually unprepared for abrupt changes and are required to struggle with the characteristics of an unfamiliar instructional environment. One of the major difficulties they face is having minimal time at their disposal to adapt their course content and teaching methods to an online setting. In addition, teachers cannot know whether all students pay attention, understand their explanations, or have left the meeting [56]. That is the reason these abrupt transitions are regarded as ERT rather than POE [65].

2.8. Statistics Anxiety, Academic Dishonesty and Learning Environments

Learning environments involve social, psychological, and pedagogical features, all of which affect student achievement and attitudes [53]. Research studies have established that students’ attitudes and anxiety explain performance in statistics courses [66]. Moreover, alternative delivery methods such as POE introduce a crucial variable determining student success in statistics courses. In this context, studies discussing the relationship between Statistics Anxiety and delivery methods have shown that POE students tend to withdraw 10 times more than F2F students. Studies have additionally revealed that persistent POE students tend to do as well as F2F ones on examinations. They also tend to do better in terms of homework assignments and grades. Nonetheless, studies have shown that they are about 16% more anxious than F2F students in terms of test, class, and interpretation anxiety [67]. What follows is that POE students tend to show less favorable attitudes toward statistics [68]. More specifically, research has shown that POE and F2F students experience similar levels of anxiety upon the completion of introductory statistics courses. However, studies discussing Statistics Anxiety pre-tests and post-tests administered to graduate students attending F2F and POE courses have shown that POE students experience higher anxiety levels at initial course phases. Nonetheless, these same studies reveal that these differences dissipate at the end of the course. Moreover, scholarly research has compared student performance in POE and F2F statistics courses. Findings are discordant. Some studies have found no difference between these two class modalities. According to one study, students taking part in F2F instruction tend to do better [69]. Others claim that there is no statistically significant difference as to the final grades POE and F2F statistics students obtain. Nonetheless, scholars established that POE students are more prone to dropping courses and fail to take part in assignments and tests [29]. It should be noted that the body of scientific literature comparing the performance of POE and F2F statistics students is growing significantly. Yet, studies comparing the manifestation of Statistics Anxiety in POE and F2F statistics students are still scanty. As shown in the foregoing, research findings concerning the performance of POE and F2F statistics students are discordant. The same applies to the relationship between Statistics Anxiety and statistics performance. That is the reason recent studies have stressed that the relationship between Statistics Anxiety and class format needs to be examined more carefully [68]. Thus, based on the above:
Hypothesis 4 (H4).
There will be differences between learning environments in the relationship between Statistics Anxiety and Academic Dishonesty.

Research Model

Based on the literature above, the research model in Figure 1 presents that Academic Dishonesty is assumed to be influenced by Students’ Achievements with a mediation of Statistics Anxiety.
The research model presents that the factor assumed to influence Academic Dishonesty is Students’ Achievements (measured by mathematics level, grade point average, and matriculation grade in mathematics) with a mediation of the latent variable of Statistics Anxiety (measured by worth of statistics, interpretation anxiety, test and class anxiety, computational self-concept, fear of asking for help, and fear of statistics teachers).

3. Materials and Methods

3.1. Sample and Procedure

Data were collected from students in Israeli academic institutions studying for a bachelor’s degree in social sciences. There was a total of 291 participants, of whom 12% were male students and 88% were female students. Participants’ average age was 22 years. The questionnaires were administered to the participants in three different types of course enrollment: 39% of the students enrolled in POE, 29% in F2F, and 32% in ERT courses, through an online platform after receiving approval from the Ethics Committee. The average time for filling the questionnaires was 12 minutes. Fourteen percent of the participants were excluded from the analysis because their survey instruments were incomplete (less than 80%) or carelessly completed. Among the participants 8% reported high Statistics Anxiety (the mean higher than 4 on the scale from 1 to 5) and 53% reported that they had committed at least one act of academic misconduct.

3.2. Instruments

Statistics Anxiety: The Hebrew version of the Statistics Anxiety Rating Scale (H-STARS) is a shortened version of Cruise et al.’s [31] original STARS scale. It was adapted to the population of Israeli students and found valid and reliable [14]. The 30-item Hebrew version of STARS relates to six distinct subscales: (a) worth of statistics (e.g., I’m never going to use statistics so why should I have to take it?); (b) interpretation anxiety (e.g., Trying to understand the statistical analyses described in an empirical article); (c) test and class anxiety (e.g., Studying for an examination in a statistics course); (d) computational self-concept (e.g., I can’t even understand seventh-grade math; how can I possibly do statistics); (e) fear of asking for help (e.g., Asking a fellow student for help in understanding the research results); (f) fear of statistics teachers (e.g., Statistics teachers talk so fast I cannot logically follow them). Participants responded to each possible anxiety-inducing situation on a 5-point scale, where 1 indicated no anxiety and 5 indicated a great deal of anxiety. Steinberger [14] reported internal consistency reliability values that ranged from 0.80 to 0.94 and were consistent with those reported by Cruise et al. [31]. Following the authors’ recommendation, the calculation of the overall score was conducted by averaging all the questionnaire items so that the higher the score, the higher the level of anxiety.
Academic Dishonesty was measured using both the Academic Misconduct Scale [70], which directly measures Academic Misconduct, and the Academic Integrity Inventory [71], which measures Academic Misconduct indirectly. The Academic Misconduct Scale is a 10-item scale with a Cronbach’s alpha reliability of 0.91. It was adapted and validated for the Israeli context [41]. An example of a question is: “How frequently did you engage in copying material and turned it as your own work?” An exploratory factor analysis using the varimax rotation was conducted to determine the factor structure of Academic Dishonesty. Academic Dishonesty was conceived as multidimensional, with the two different dimensions having sums of squared loadings ranging from 0.63 to 0.86. The participants responded to these questions using a five-point Likert scale, where 1 corresponded to “Very unlikely” and 5 to “Very likely.” The Academic Integrity Inventory [71], adapted and validated for the Israeli context [41], included questions about likelihood of considering misconduct and was based on an 8-item scale with a Cronbach’s alpha reliability of 0.75. An example of a question is: “I personally saw many times students cheating during an exam in my institution.”
Socio-demographic variables: The questionnaire also contained a series of socio-demographic items that related to the participants’ age, gender, high school mathematics level, grade point average, matriculation grade in mathematics, and type of course enrollment.

3.3. Plan of Analysis

We analyzed the data using Structural Equation Modeling (SEM), and full information maximum likelihood estimates were computed by means of the Analysis of Moment Structures (AMOS) program [72]. The model was examined for goodness of fit using χ2, comparative fit index (CFI), and root mean square error of approximation (RMSEA) fit indices. CFI values above 0.90 and 0.95 indicated adequate and good model fit, respectively, and RMSEA values below 0.08 and 0.05 indicated adequate and good model fit, respectively [73,74].

4. Results

The descriptive statistics and correlations between the research variables are presented in Table 1.
The results show that there are positive significant correlations among the components of Statistics Anxiety. However, the only positive significant correlations between Statistics Anxiety and Academic Misconduct were found in the full sample for the components of fear of asking for help and fear of statistics teachers.
Table 2 presents inter-correlations between Statistics Anxiety and the dependent variables of Academic Misconduct and Academic Integrity.
The results show that there are significant positive correlations between Statistics Anxiety and both dependent variables only in the POE (rp = 0.19, p < 0.05 for Academic Misconduct, and rp = 0.37, p < 0.001 for Academic Integrity).
The Academic Dishonesty variable was modeled by the variables of Academic Misconduct and Academic Integrity, by the latent variable of Students’ Achievements (which measured the mathematics level, grade point average and matriculation grade in mathematics) with a mediation of the latent variable of Statistics Anxiety (which itself measured worth of statistics, interpretation anxiety, test and class anxiety, computational self-concept, fear of asking for help, fear of statistics teachers). The data fit the Academic Dishonesty model marginally well (χ2 = 476.680, N = 291, df = 192, p < 0.001, CFI = 0.797, RMSEA = 0.072).

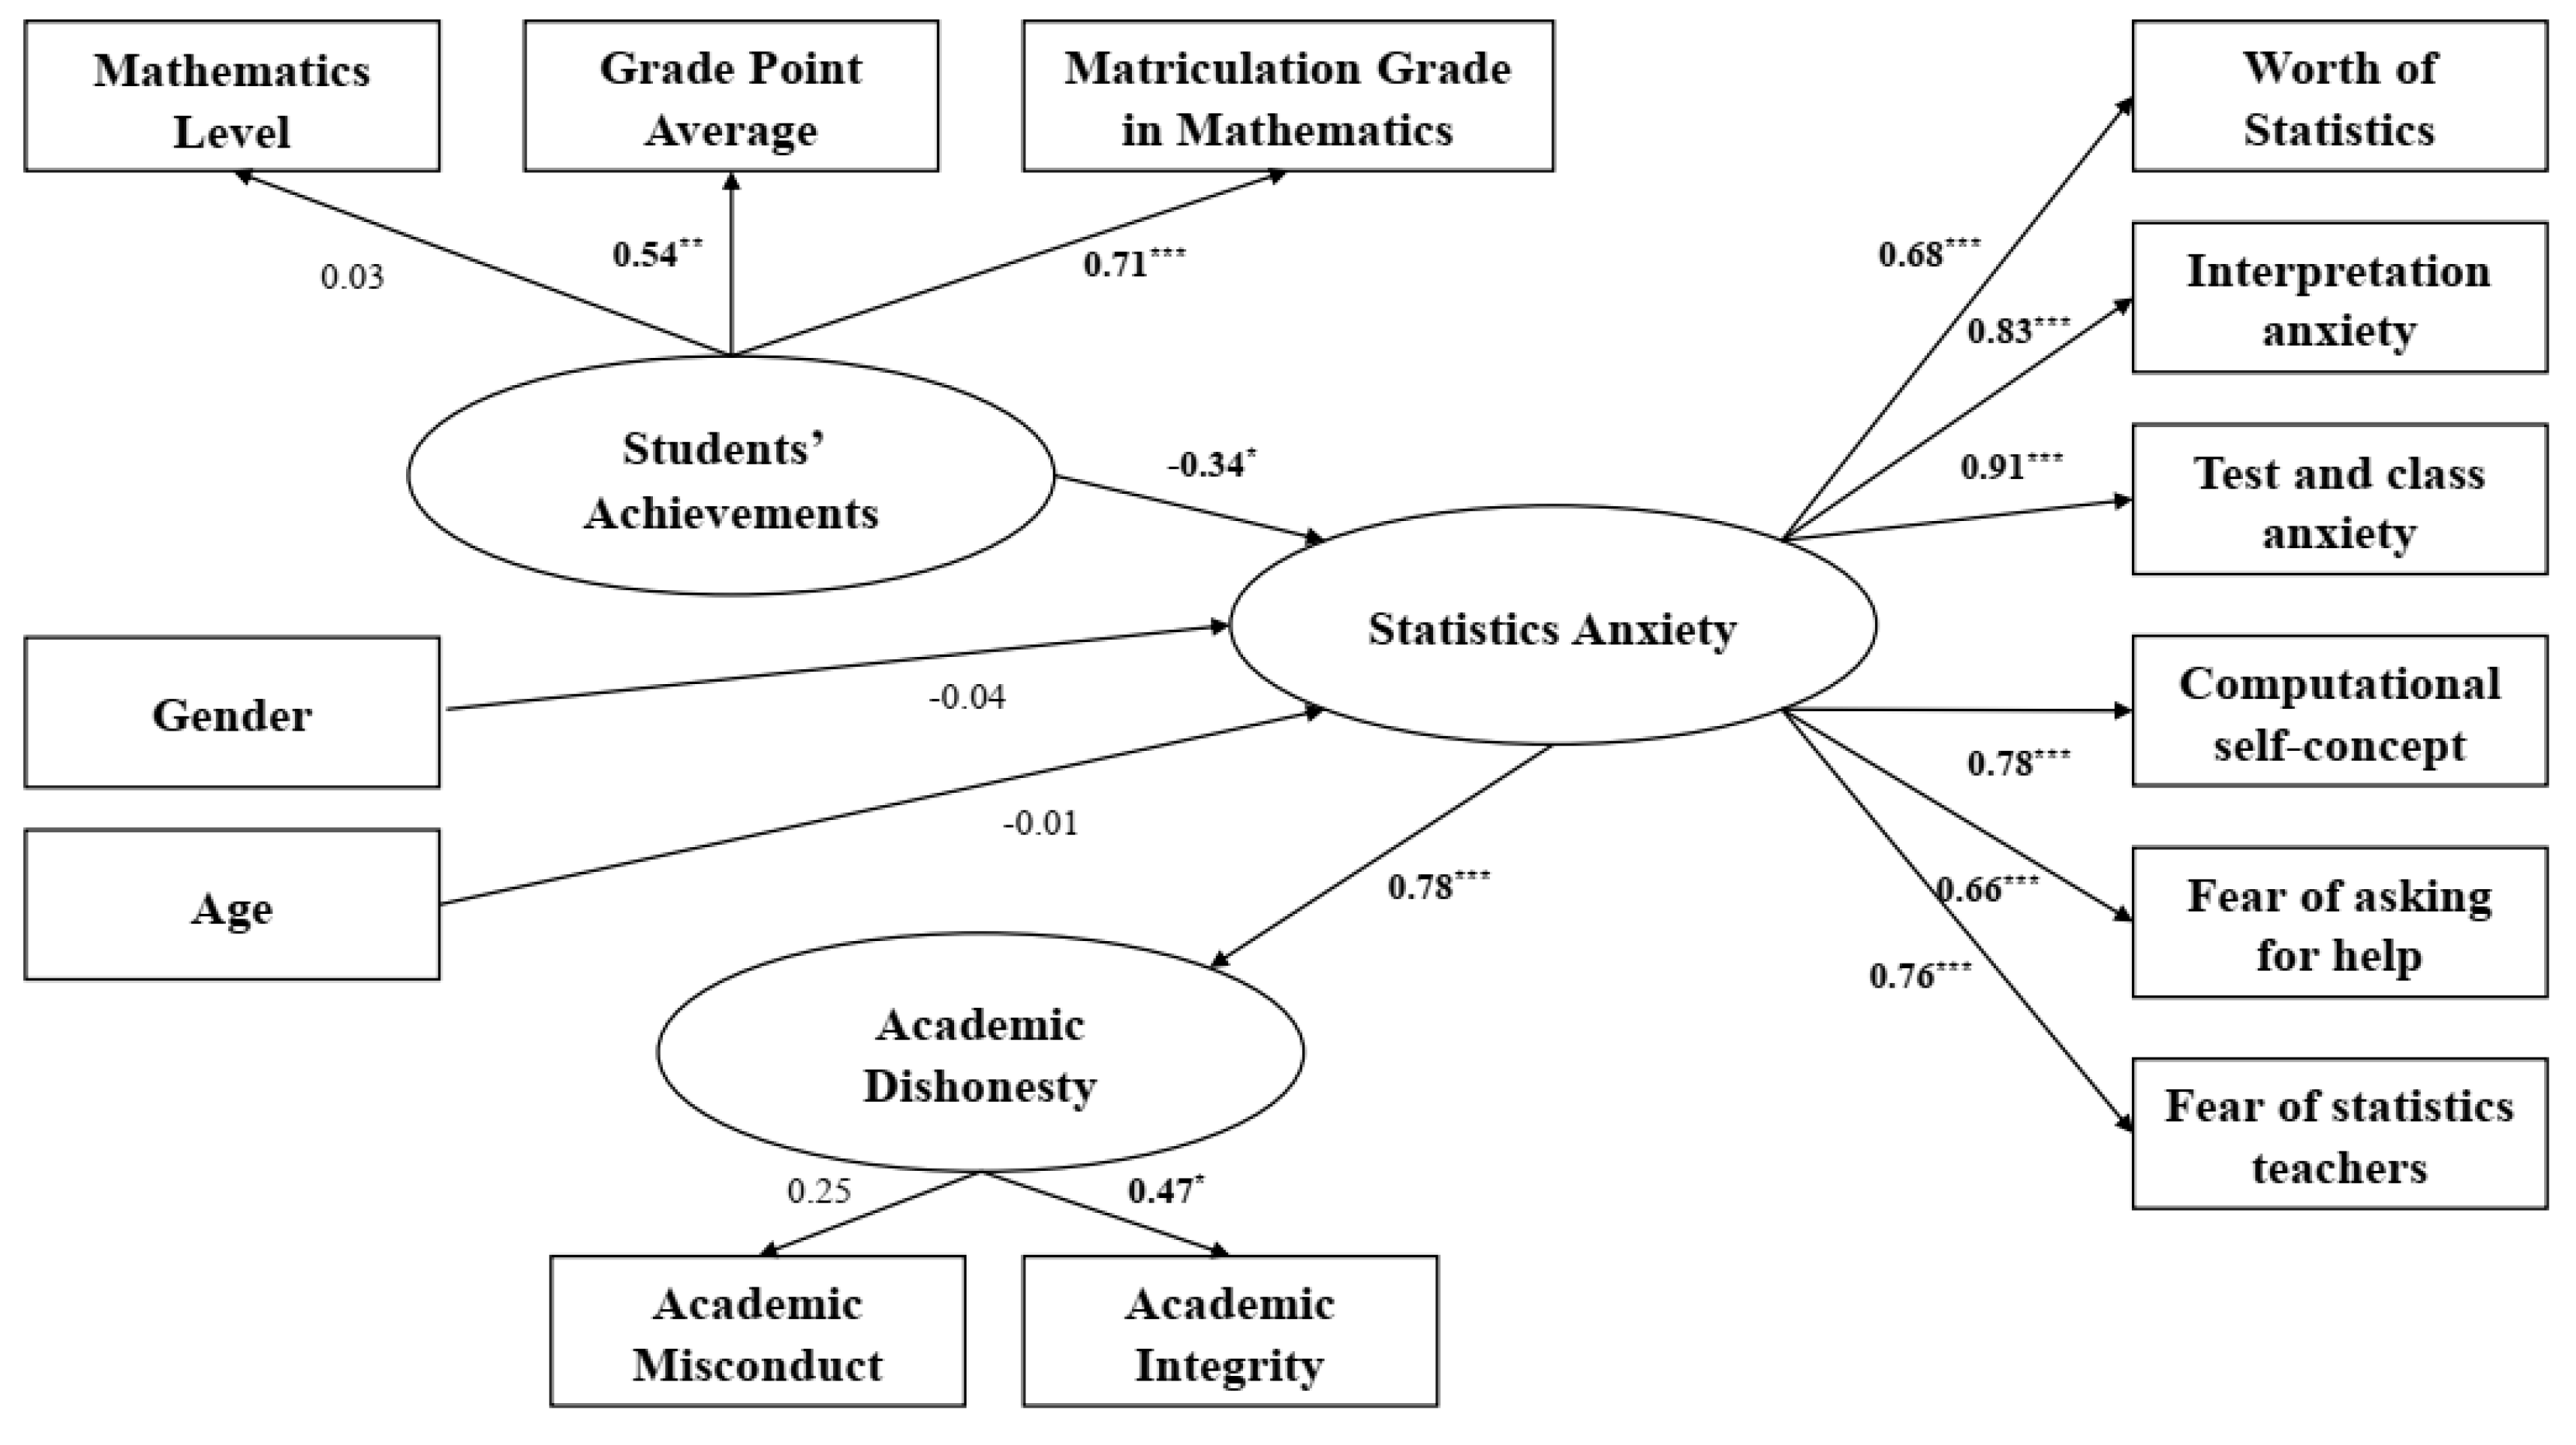
4.1. Academic Misconduct Analysis—POE Sample

The structural model of Academic Misconduct in the POE sample is illustrated in Figure 2.
The results of the analysis indicate that the variance in Academic Misconduct is explained by Students’ Achievements with a mediation of Statistics Anxiety.
As shown in Figure 2, the variable that had the most impact on Academic Misconduct was Statistics Anxiety with the total effect of 78%. Among the most influential components of Statistics Anxiety was test and class anxiety, which had one of the biggest effects (b = 0.91, p < 0.001), meaning that the higher the student’s level of Statistics Anxiety in regard to test and class anxiety, the higher the propensity to cheat. Similarly, the component of Statistics Anxiety regarding interpretation anxiety was found to have a strong significant effect as well (b = 0.83, p < 0.001), while the higher the student’s level of Statistics Anxiety regarding interpretation anxiety, the higher the probability for him or her to engage in behaviors of academic. Another strong factor influencing Academic Misconduct was the component of computational self-concept (b = 0.78, p < 0.001), which means that Statistics Anxiety regarding computational self-concept increases Academic Misconduct.
Other sets of variables that had a significant negative effect on the dependent variable were variables related to Students’ Achievements: matriculation grade in mathematics was found to be significantly negatively influencing the dependent variable through Statistics Anxiety as a mediator (b = 0.71, p < 0.001), meaning the higher the student’s matriculation grade in mathematics, the lower was his or her Statistics Anxiety and, as a result, his or her tendency to engage in acts of Academic Misconduct. The variable of grade point average had a similar effect (b = 0.54, p < 0.01).
In addition, there was a significant negative effect of Students’ Achievements on Statistics Anxiety (b = −0.34, p < 0.05), meaning that the higher the student’s achievements, i.e., grade point average and matriculation grade in mathematics, the lower their Statistics Anxiety.
Unstandardized indirect effects were computed for each of 200 bootstrapped samples, and the 95% confidence interval was computed by determining the indirect effects at the 2.5th and 97.5th percentiles. The bootstrapped unstandardized indirect effect of Statistics Anxiety as a mediator between students’ achievement and Academic Misconduct was −0.006 (p < 0.05), and the 95% confidence interval ranged from −0.011 to −0.002. Thus, this indirect effect was statistically significant, and therefore support for H3 was obtained.

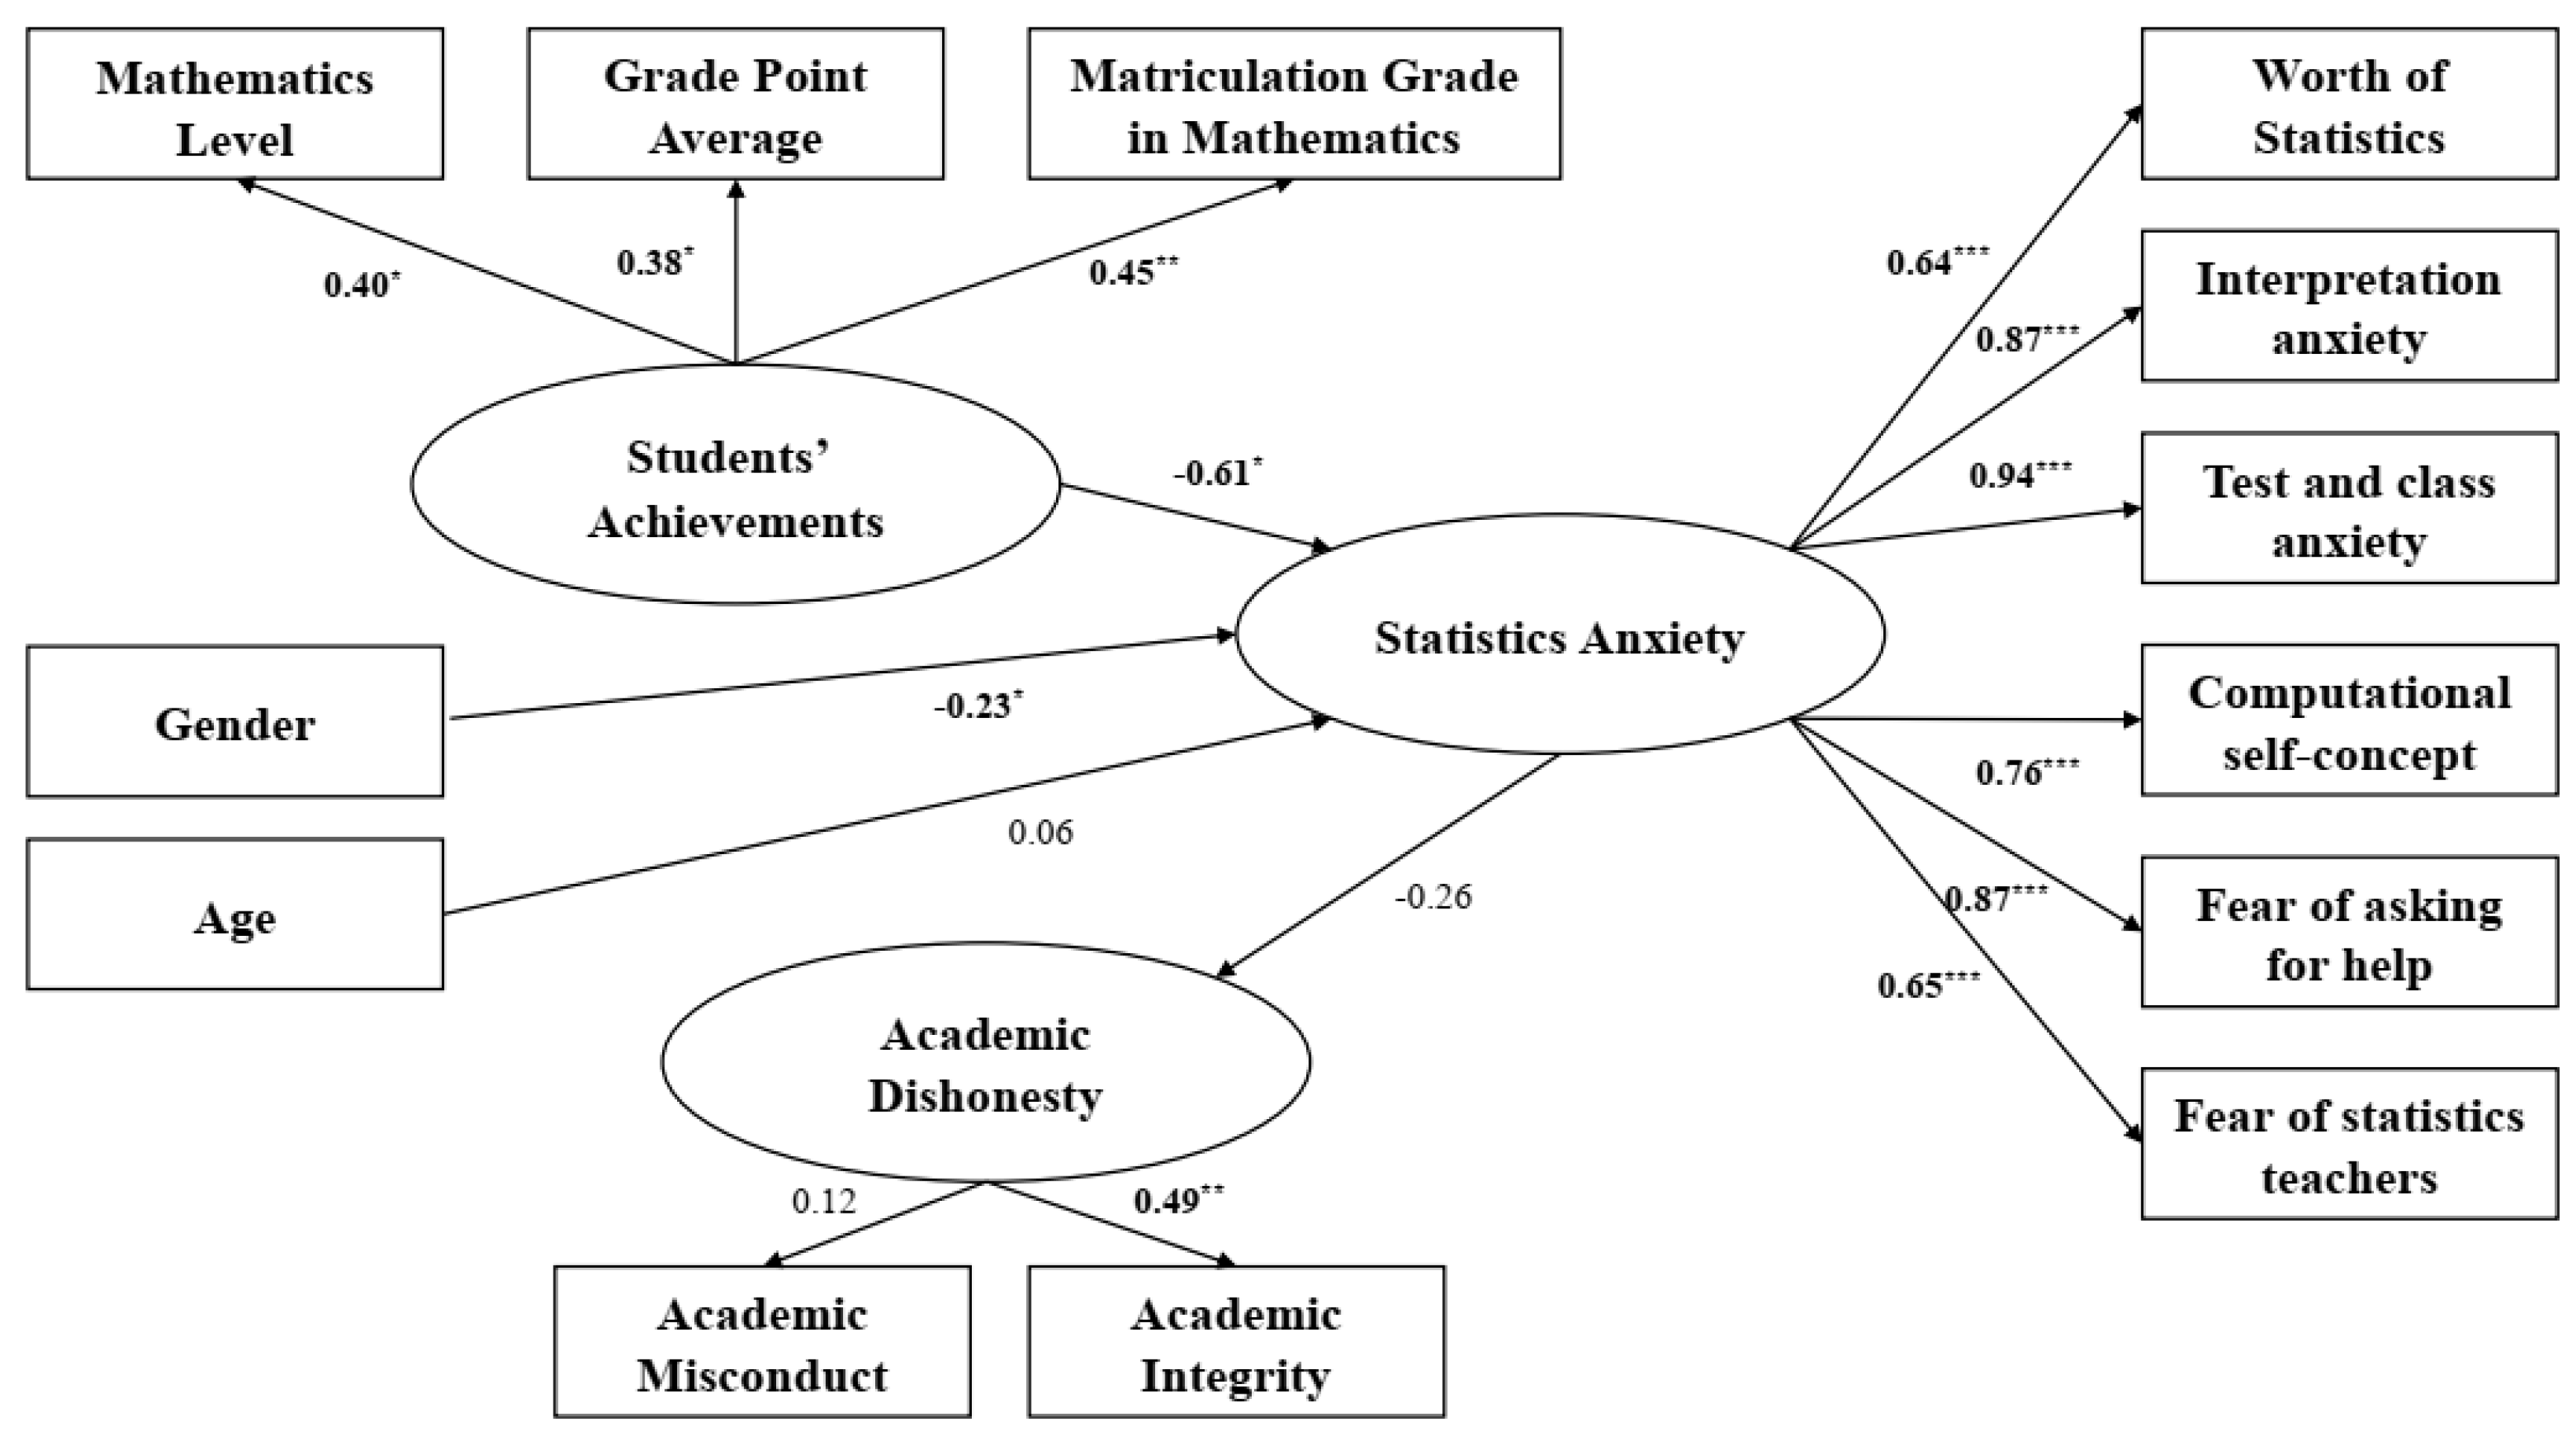
4.2. Academic Misconduct Analysis—F2F Sample

The structural model of Academic Misconduct in the F2F sample is illustrated in Figure 3.
The results of the analysis indicate that the variance in Academic Misconduct is explained by Students’ Achievements with no significant effect of Statistics Anxiety as a mediator.
As shown in Figure 3, matriculation grade in mathematics was found to be significantly negatively influencing Statistics Anxiety (b = 0.45, p < 0.01), meaning the higher the student’s matriculation grade in mathematics, the lower is his or her Statistics Anxiety. The variables of grade point average (b = 0.38, p < 0.05) and of mathematics level (b = 0.40, p < 0.05) had a similar effect.
In addition, there was a significant effect of gender on Statistics Anxiety (b = −0.23, p < 0.05), meaning that female students experience higher Statistics Anxiety than their male counterparts.

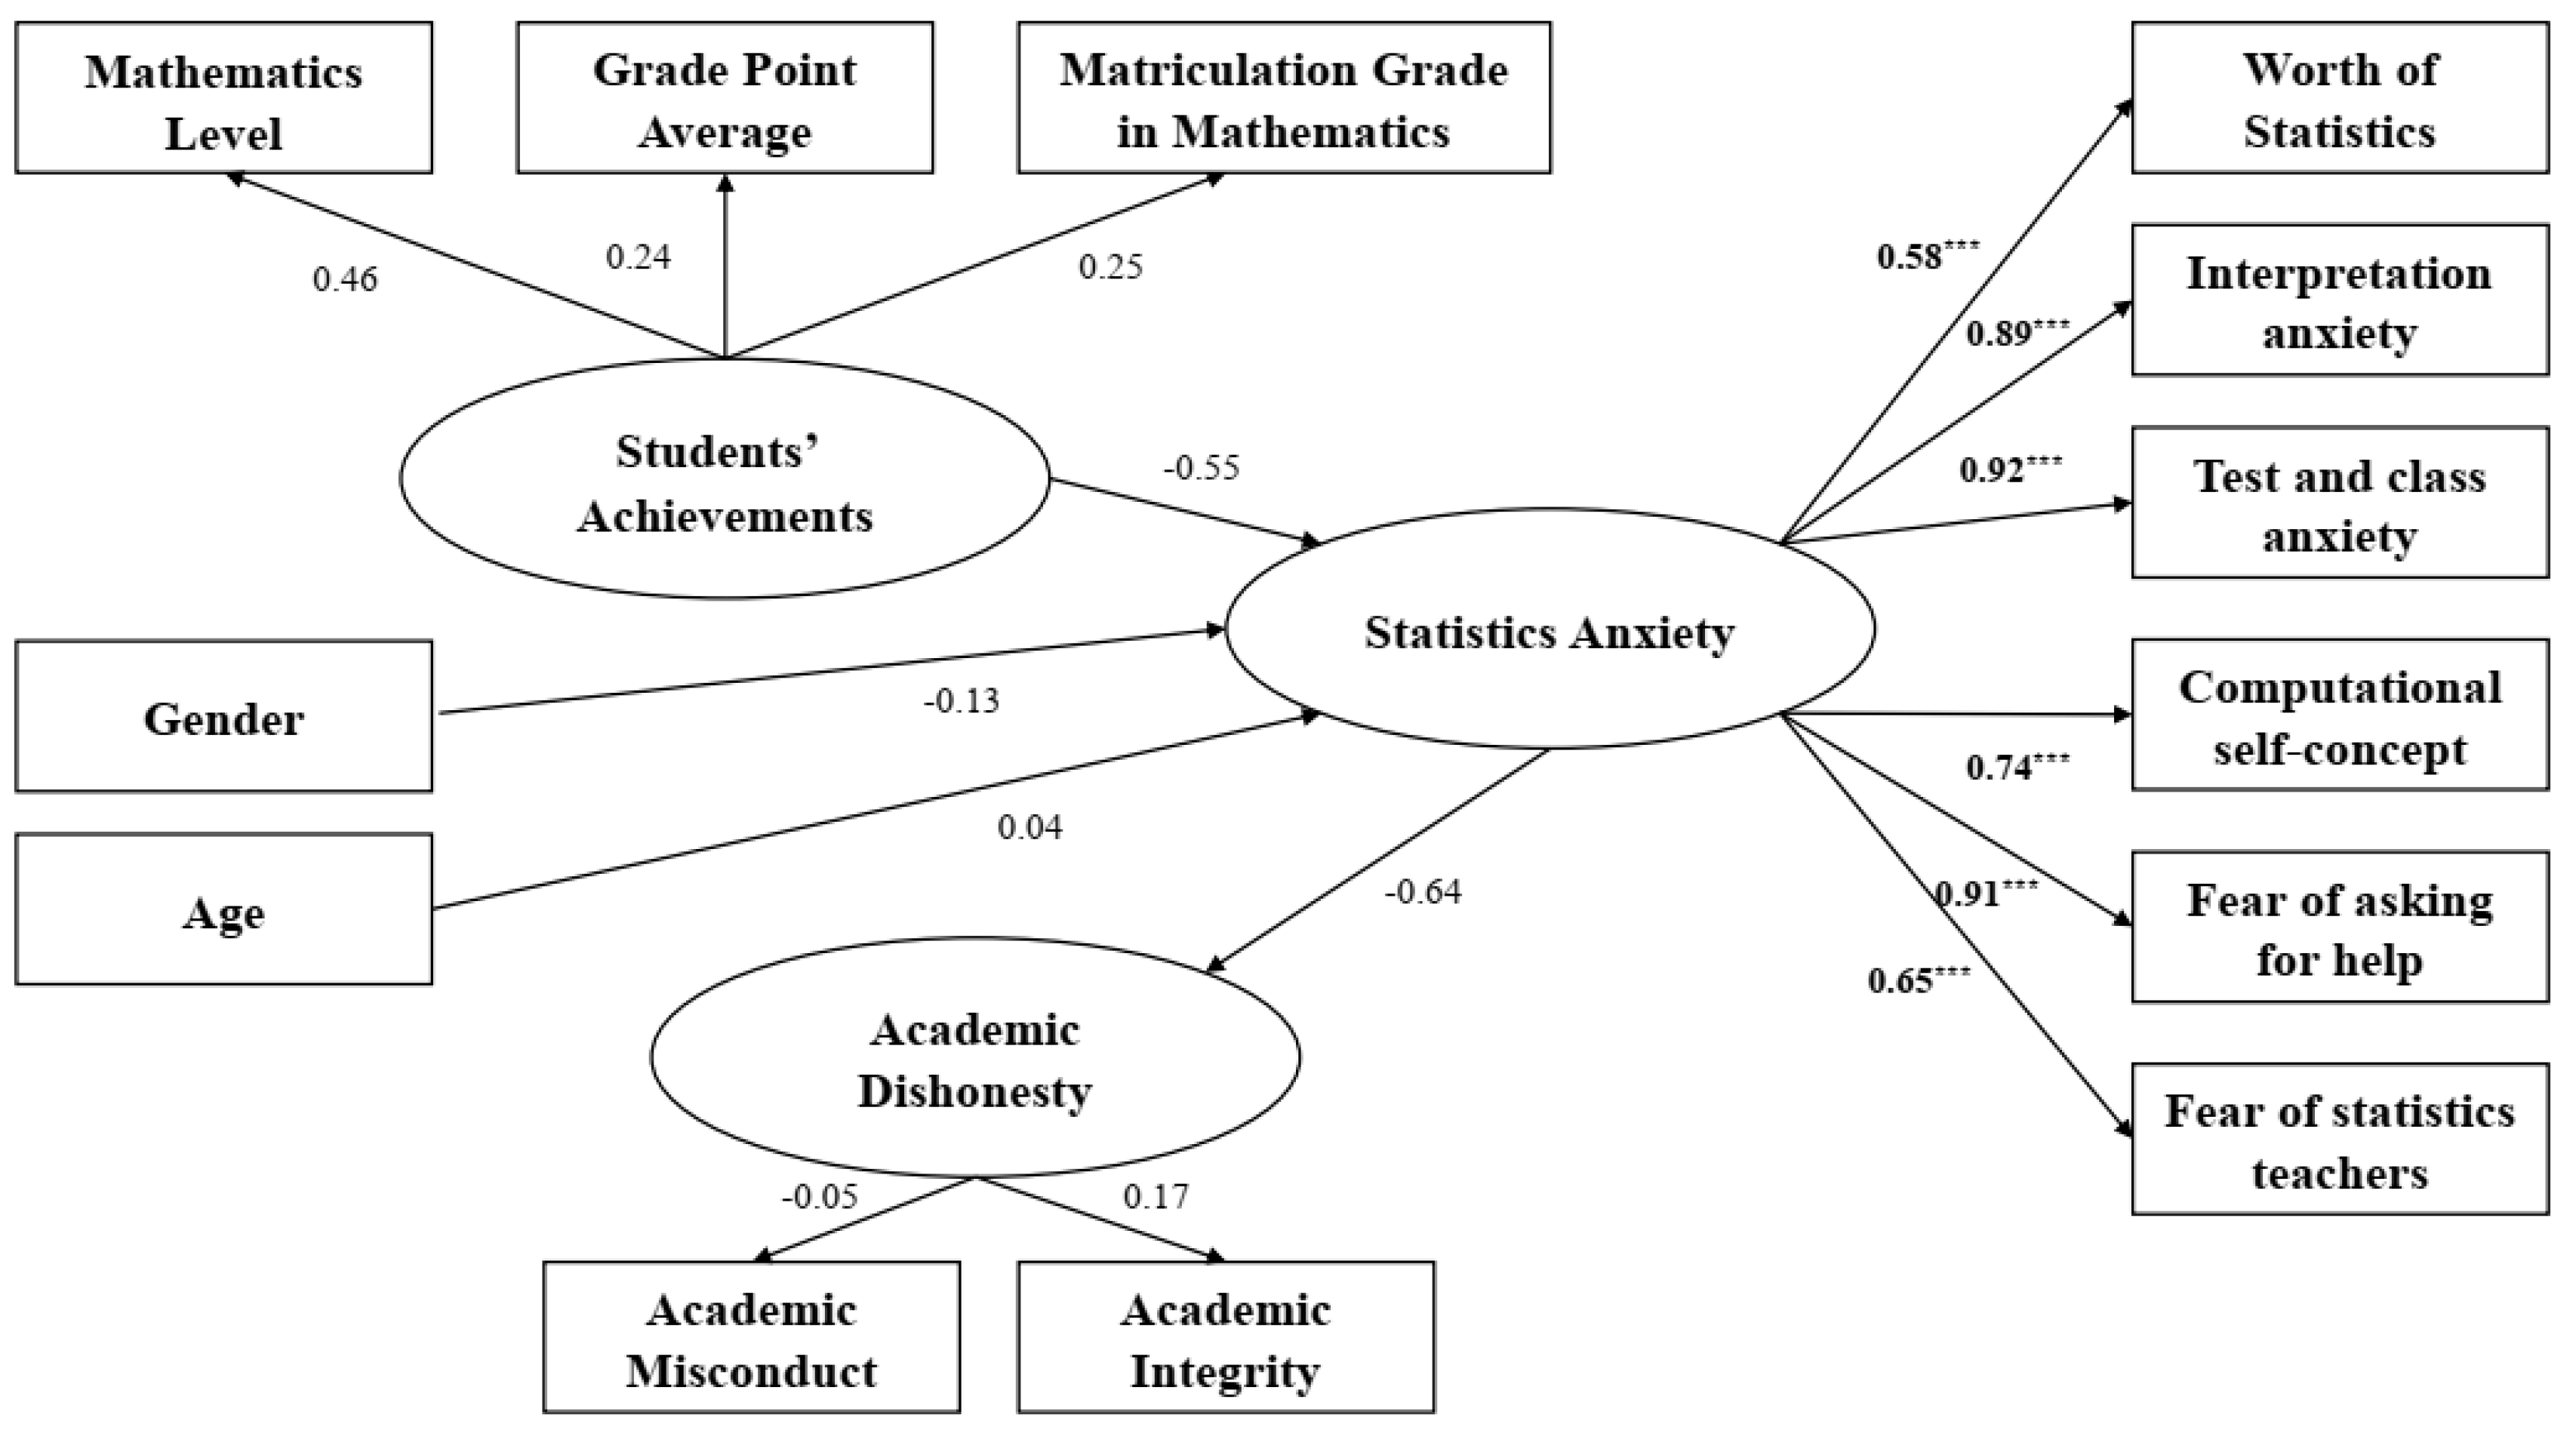
4.3. Academic Misconduct Analysis—ERT Sample

The structural model of Academic Misconduct in the ERT sample is illustrated in Figure 4.
The results of the analysis indicated that the variance in Academic Misbehavior was not explained by Students’ Achievements, as can be seen in Figure 4.
Table 3 summarizes the testing results for the research hypotheses.
As shown in Table 3, the results of the analysis indicated that the significant effect of Students’ Achievements on Academic Dishonesty through the mediation of Statistics Anxiety was found only in the POE sample.
Table 4 presents comparison among the learning environments.
As shown in Table 4, the results of the analysis indicated that there was a significant difference between the POE model and the F2F and the ERT models, while there was no significant difference between the F2F and the ERT models, thus supporting H4.

5. Discussion

This article explains the relationship comprising Statistics Anxiety and Academic Dishonesty. Its goal is to allow better sustainable educational outcomes. As argued earlier, educators form the professional skills (e.g., statistical literacy) of the new generations. Yet they must additionally strengthen their values, principles, and moral development. Today’s undergraduate students are tomorrow’s workforce. As such, they should be able to act ethically in a socially sustainable environment after completing their studies [2]. The present research discussion and conclusion may help educators, instructors, and academic institutions in developing pedagogical infrastructures to avoid unwanted behaviors like cheating and plagiarism, and unwanted attitudes like Statistics Anxiety.
Based on the literature, we constructed a mediation model that evaluated the role of Statistics Anxiety as manifesting in social sciences undergraduate students, which accounts for the relationship of previous academic achievements and Academic Dishonesty. We hypothesized that learning environments and the differences in the mediating role of Statistics Anxiety in students’ learning in POE, F2F, and ERT affect the suggested mediation model.
The results of multi-group analysis showed that path coefficients differ between the three learning environments (POE, F2F, and ERT). Specifically, the results support a model in which previous math and academic achievements are significantly related to Academic Dishonesty mediated by Statistics Anxiety in a POE context only.
The results in this study regarding the impact of previous academic achievements on Statistics Anxiety (H1) and that of Statistics Anxiety on Academic Dishonesty (H2) showed that there is a negative relationship between previous academic achievements (high school math level, high school matriculation grade, and average of academic achievement in the previous semester) in POE and F2F learning environments only. Differently put, the higher the level of previous academic achievements, the lower the anxiety level students experience from statistics in POE and F2F courses. In this context, research has shown that one’s previous experience with mathematics is a significant predictor of Statistics Anxiety. In line with research literature [30] students with a sound math background feel less anxious in an introductory statistic course than those with low math levels. Furthermore, prior math experience may influence the learning strategies employed in an introductory statistics course [30]. Research has revealed that previous successful experiences concerning mathematics studies have a direct impact on one’s level of Statistics Anxiety [35]. As to the absence of such an impact in ERT environments, it may be argued that most F2F and POE courses took place before the Covid-19 eruption, whereas ERT courses took place during the pandemic. Thus, health, economic, and existential uncertainty, along with higher anxiety levels of ERT students due to the Covid-19 pandemic, might lessen the emotional impact of one’s studies, including the specific anxiety derived from the study of statistics. In other words, the psychological distress caused by the pandemic, or the Covid-19 anxiety syndrome [70], may have alleviated or hidden Statistics Anxiety levels. A key reason for this may be that teaching policies during ERT periods tend to be more considerate toward students in terms of class attendance, course requirements, and exams, all of which may contribute to the above. Differently expressed, causality suggests that once the logical causes are alleviated or removed effect levels ought to decrease. (One may object that the above provides a logical explanation only and speculate that an anxiety baseline measurement could additionally explain the differences between F2F and POE learning, if any. Interesting as it might be, this analysis remains beyond the scope of this study, the object of which is to discuss the impact of different learning environments on Statistics Anxiety, and not the general anxiety levels caused by the Covid-19 pandemic. In this context, one may mention in passing that general anxiety levels and distress during the pandemic have increased [75].)
The results regarding a direct effect of Statistics Anxiety on Academic Dishonesty (H2) and the role of Statistics Anxiety as a mediator between previous academic achievements and Academic Dishonesty (H3) was substantiated in the POE context only, thus supporting the Structural Model for Determinants of Academic Dishonesty (Figure 1). Specifically, the Statistics Anxiety of students studying in a POE environment revealed a significant, positive relation to Academic Dishonesty, that is, the higher the level of anxiety, the more these students engage in unethical conduct. Concerning the impact of different learning environments on the suggested mediation model (H4), findings showed an indirect effect between previous achievements and Academic Dishonesty via Statistics Anxiety only in POE, and no parallel relations in F2F and ERT courses. This may be due to the presence of academic instructors, which relieves to some extent the manifestation of anxiety among students. Accordingly, the absence of these during POE course sessions may trigger those feelings. The POE modality allows students to contact their instructors mostly by email only, which introduces the distressing element of delayed response, and hence, uncertainty and anxiety [9]. POE learning is mostly characterized by a student’s interaction with a course website. Communication with instructors is virtual, either by email or through course forums. The foregoing, one may argue, has a direct impact on student’s ethical disinhibition, and hence, academic misconduct. In this context, one may claim that an instructor’s presence has a direct impact on the emotional character of a student’s learning process. An instructor’s manifestations of empathy, as well as the positive classroom climate and open interpersonal relationships purposively fostered by him or her, may improve the general quality of learning process, thus discouraging students from engaging in academic misconduct. More specifically, the scholarly research has shown that students learning nonmathematical disciplines often experience statistical courses negatively and as a threat [13]. Consequently, our findings on POE showed that statistics learning tends to cause to stronger levels of anxiety and procrastination, the impact of which are lower academic self-regulation and intrinsic motivation [68]. Accordingly, POE statistics learning has been shown to be less effective than F2F instruction and practice. For as studies have revealed, attending F2F statistics courses allows students to grasp their instructor’s true concerns and attitudes toward their learning processes.

6. Conclusions and Practical Implications

Our research shows that the instructor’s presence in the learning process reduces students’ anxiety levels, and unethical behavior. Thus, we recommend that in POE, the instructor’s presence should include supportive, emphatic interpersonal interaction in order to reduce virtual distance [76]. Furthermore, we recommend including Social Emotional Learning (SEL) strategies, which foster students challenges of learning, and help them prevent risky personal behaviors like Academic Dishonesty, while additionally preparing them for the demands of changing workplaces [77]. As previously stated, instructors do not only teach content knowledge. They also play a crucial role in informing the knowledge values and skills of future leaders and citizens [1], thus contributing to a better sustainable future.
We further suggest, following Moore’s Theory of transactional distance [78], that teaching processes be adapted to learning environments and platforms and consider students’ needs. A well designed and personalized teaching–learning process adapted to the students’ cognitive and emotional needs may better serve different types of learners (those with and without self-regulated learning, different learning styles, different motivation levels, etc.). Additionally, instructors should develop the student’s sense of ability and trust, both in themselves as learners and in their instructors, along with their abilities to lead the student to success, reduce anxiety, and behave ethically.
In addition, the probability of future wide-scale educational shutdowns due to natural incidents (wildfires, outbreaks) or other human situational incidents (shootings, terror attacks) may lead to further augmented ERT use in the near future [45]. Thus, and in line with research literature [79], there is a necessity to integrate an alternative educational approach to ERT rather than abruptly migrating the previously F2F pedagogy to it. Moore’s Theory of transactional distance [78] or Social Emotional Learning skills [80] are emerging didactic models which may maximize content delivery in virtual environments. Furthermore, we propose adopting the “Route Re-planning,” because ERT requires a different technological–pedagogical preparation. Accordingly, building ERT courses may be guided according to the following pedagogical principles: (a) reorganizing learning subjects in small accessible learning phases built layer by layer, (b) combining synchronous and asynchronous teaching to prevent Zoom Fatigue [81], (c) establishing a climate care environment, which allows positive responsive learning experiences [82] and a reduction of virtual distance, (d) combining individual and group learning activities to maintain engagement and prevent students’ dropouts, (e) converting summative assessment into an ongoing studying phase assessment to better monitor learning processes. The integration of the above-mentioned suggestions in the “unplanned” ERT requires a constant planning of teaching techniques, an appropriate educational infrastructure, as well as a pedagogical methodology, before and during courses.
Yet, one may speculate that POE will become more frequent in the next few years, along with the educational system’s resilience to unexpected events. Consequently, one may expect that ERT occurrences may turn out to be less common. Although this may hold true, one may still argue that the pre-planned character of POE may represent a limitation when it is necessary to provide answers to unforeseen learning.

7. Limitations and Future Research

Despite its practical and theoretical contributions, this research has limitations, which can be addressed in future research. Like any other empirical study, ours is a specific theoretical construct analyzing and reflecting a given practice (its data). In other words, our model offers a particularized, theoretical perspective of a general socio-cultural phenomenon. This entails that research, theory, and practice can all benefit from similar tests focusing on additional contexts and employing different predictors, e.g., including Moore’s Theory of transactional distance instructor–learner interactions. Another limitation is that the reliability of the Academic Dishonesty tool for measuring academic integrity in ERT was very low (0.53) compared to other environments and the reliability obtained in previous studies using the original tool. This may be because students did not know how they would be tested as well as what the test format would be and, thus, could not prepare cheating strategies.
Furthermore, one may object that the results of this study ought not to be extrapolated to other academic institutions outside those mentioned in its sample. Nonetheless, it should be recalled that in the last decades Western academia has undergone a homogenizing process of globalization. Recent scholarly studies have shown that current academic institutions in the West resort to the same canon of thought (mostly Anglo-Saxon, French, and German thinkers), employ similar teaching and research methods, homologate academic degrees, join forces through multiple programs of international cooperation, publish their scholarly works in academically standardizing, international journals, etc. [83,84,85]. All this provides evidence, we assert, that there is a common ground integrating the institutions surveyed in our sample to the rest of the Western academic community.
The global Covid-19 pandemic placed the quality and infrastructure of the educational structure (the learning–teaching processes) in a complex situation. Future research may further examine the advantages and disadvantages of virtual learning compared to F2F learning in different cultures and under different learning conditions.

Author Contributions

The order of the authors indicates their relative contribution to this study. All authors have read and agreed to the published version of the manuscript.

Funding

The APC was funded by Zefat Academic College.

Institutional Review Board Statement

The study was conducted according to the guidelines of the Declaration of Helsinki and approved by the Ethics Committee of Orot Israel College of Education, protocol code 2019001, date of approval 11 July 2019.

Informed Consent Statement

Informed consent was obtained from all subjects involved in the study.

Data Availability Statement

Data sharing not applicable. The data are not publicly available due to participants’ privacy.

Conflicts of Interest

The authors declare no conflict of interest.

References

  1. Lewis, R.A.; Kenerson, M.J.; Sorrentino, C.; Rowse, T.H. Experiencing sustainability education: Insights from a living and learning programme. J. Educ. Sustain. Dev. 2019, 13, 24–44. [Google Scholar] [CrossRef]
  2. Cuadrado, D.; Salgado, J.F.; Moscoso, S. Prevalence and correlates of academic dishonesty: Towards a sustainable university. Sustainability 2019, 11, 6062. [Google Scholar] [CrossRef] [Green Version]
  3. Määttä, K.; Hyvärinen, S.; Äärelä, T.; Uusiautti, S. Five basic cornerstones of sustainability education in the Arctic. Sustainability 2020, 12, 1431. [Google Scholar] [CrossRef] [Green Version]
  4. Green, J.K.; Burrow, M.S.; Carvalho, L. Designing for transition: Supporting teachers and students cope with emergency remote education. Postdigit. Sci. Educ. 2020, 2, 906–922. [Google Scholar] [CrossRef]
  5. Cervi, L.; Pérez Tornero, J.M.; Tejedor, S. The challenge of teaching mobile journalism through MOOCs: A case study. Sustainability 2020, 12, 5307. [Google Scholar] [CrossRef]
  6. Williamson, B.; Eynon, R.; Potter, J. Pandemic politics, pedagogies and practices: Digital technologies and distance education during the coronavirus emergency. Learn. Media Technol. 2020, 45, 107–114. [Google Scholar] [CrossRef]
  7. Hamza, C.A.; Ewing, L.; Heath, N.L.; Goldstein, A.L. When social isolation is nothing new: A longitudinal study psychological distress during COVID-19 among university students with and without preexisting mental health concerns. Can. Psychol. 2020. [Google Scholar] [CrossRef]
  8. Baloran, E.T. Knowledge, attitudes, anxiety, and coping strategies of students during covid-19 pandemic. J. Loss Trauma 2020, 25, 635–642. [Google Scholar] [CrossRef]
  9. Zahan, F.N.; Islam, M.A.; Kawsar, L.A. Relationships among Statistics Anxiety, Depression and Academic Performance. Int. J. Stat. Sci. 2020, 19, 35–52. [Google Scholar]
  10. Kouchaki, M.; Desai, S.D. Anxious, threatened, and also unethical: How anxiety makes individuals feel threatened and commit unethical acts. J. Appl. Psychol. 2015, 100, 360–375. [Google Scholar] [CrossRef] [Green Version]
  11. Onwuegbuzie, A.J.; Da Ros, D.; Ryan, J.M. The components of statistics anxiety: A phenomenological study. Focus Learn. Probl. Math. 1997, 19, 11–35. [Google Scholar]
  12. Ossiannilsson, E. Reflection on 21st century competences, smart learning environments, and digitalization in education. Near East Univ. Online J. Educ. 2020, 3, 87–93. [Google Scholar] [CrossRef]
  13. Ralston, K.; Gorton, V.; Macinnes, J.; Gayle, V.; Crow, G. Anxious women or complacent men? Anxiety of statistics in a sample of UK sociology undergraduates. Int. J. Soc. Res. Methodol. 2020, 24, 79–91. [Google Scholar] [CrossRef]
  14. Steinberger, P. Assessing the Statistical Anxiety Rating Scale as applied to prospective teachers in an Israeli Teacher-Training College. Stud. Educ. Eval. 2020, 64, 100829. [Google Scholar] [CrossRef]
  15. Wenzel, K.; Reinhard, M.A. Tests and academic cheating: Do learning tasks influence cheating by way of negative evaluations? Soc. Psychol. Educ. 2020, 23, 721–753. [Google Scholar] [CrossRef] [Green Version]
  16. Zhang, H.; Shi, Y.; Zhou, Z.E.; Ma, H.; Tang, H. Good people do bad things: How anxiety promotes unethical behavior through intuitive and automatic processing. Curr. Psychol. 2020, 39, 720–728. [Google Scholar] [CrossRef]
  17. Aljurf, S.; Kemp, L.J.; Williams, P. Exploring academic dishonesty in the Middle East: A qualitative analysis of students’ perceptions. Stud. High. Educ. 2020, 45, 1461–1473. [Google Scholar] [CrossRef]
  18. Bretag, T. Handbook of Academic Integrity; Springer: Singapore, 2016. [Google Scholar]
  19. Ransome, J.; Newton, P.M. Are we educating educators about academic integrity? A study of UK higher education textbooks. Assess. Eval. High. Educ. 2018, 43, 126–137. [Google Scholar] [CrossRef] [Green Version]
  20. Bacon, A.M.; McDaid, C.; Williams, N.; Corr, P.J. What motivates academic dishonesty in students? A reinforcement sensitivity theory explanation. Br. J. Educ. Psychol. 2020, 90, 152–166. [Google Scholar] [CrossRef]
  21. Tutkun, T. Statistics Anxiety of graduate students. Int. J. Progress. Educ. 2019, 15, 32–41. [Google Scholar] [CrossRef]
  22. Horwitz, A.V. Anxiety: A Short History; Johns Hopkins University Press: Baltimore, MD, USA, 2013; ISBN 1421410818. [Google Scholar]
  23. Parekh, R. What Are Anxiety Disorders? Available online: https://www.psychiatry.org/patients-families/anxiety-disorders/what-are-anxiety-disorders (accessed on 16 August 2020).
  24. Nitta, Y.; Takahashi, T.; Haitani, T.; Sugimori, E.; Kumano, H. Avoidance behavior prevents modification of fear memory during reconsolidation. Psychol. Rep. 2020, 123, 224–238. [Google Scholar] [CrossRef] [PubMed]
  25. Henrich, A.; Lee, K. Reducing math anxiety: Findings from incorporating service learning into a quantitative reasoning course at Seattle University. Numeracy 2011, 4, 9. [Google Scholar] [CrossRef] [Green Version]
  26. Savage, D.A.; Torgler, B. Nerves of steel? Stress, work performance and elite athletes. Appl. Econ. 2012, 44, 2423–2435. [Google Scholar] [CrossRef]
  27. Macher, D.; Papousek, I.; Ruggeri, K.; Paechter, M. Statistics anxiety and performance: Blessings in disguise. Front. Psychol. 2015, 6, 1116. [Google Scholar] [CrossRef] [Green Version]
  28. Ralston, K. “Sociologists shouldn’t have to study Statistics”: Epistemology and anxiety of Statistics in Sociology Students. Sociol. Res. Online 2020, 219–235. [Google Scholar] [CrossRef]
  29. Frey-Clark, M.; Natesan, P.; O’Bryant, M. Assessing statistical anxiety among online and traditional students. Front. Psychol. 2019, 10, 1440. [Google Scholar] [CrossRef]
  30. Cui, S.; Zhang, J.; Guan, D.; Zhao, X.; Si, J. Antecedents of statistics anxiety: An integrated account. Pers. Individ. Dif. 2019, 144, 79–87. [Google Scholar] [CrossRef]
  31. Cruise, R.J.; Cash, R.W.; Bolton, D.L. Development and validation of an instrument to measure statistical anxiety. In Proceedings of the American Statistical Association Proceedings of the Section on Statistical Education, Las Vegas, NV, USA, 5–8 August 1985; Volume 4, pp. 92–97. [Google Scholar]
  32. Zysberg, L. Statistics for cowards: A field study of the effects of re-designing order and presentation in statistics courses for social science college students. Procedia-Soc. Behav. Sci. 2010, 2, 595–599. [Google Scholar] [CrossRef] [Green Version]
  33. Siew, C.S.Q.; McCartney, M.J.; Vitevitch, M.S. Using network science to understand statistics anxiety among college students. Scholarsh. Teach. Learn. Psychol. 2019, 5, 75. [Google Scholar] [CrossRef]
  34. Onwuegbuzie, A.J. Modeling statistics achievement among graduate students. Educ. Psychol. Meas. 2003, 63, 1020–1038. [Google Scholar] [CrossRef]
  35. Levpušček, M.P.; Cukon, M. That old devil called ‘Statistics’: Statistics Anxiety in University Students and related factors. Cent. Educ. Policy Stud. J. 2020. [Google Scholar] [CrossRef]
  36. Auzmendi, E. Factors related to attitudes toward Statistics: A study with a spanish sample. In Proceedings of the Annual Meeting of the American Educational Research Association, Chicago, IL, USA, 3–7 April 1991. [Google Scholar]
  37. Artiukhov, A.Y.; Liuta, O.V. Academic integrity in Ukrainian higher education: Values, skills, actions. Bus. Ethics Leadersh. 2017, 1, 34–39. [Google Scholar] [CrossRef]
  38. Parnther, C. Academic misconduct in higher education: A comprehensive review. J. High. Educ. Policy Leadersh. Stud. 2020, 1, 25–45. [Google Scholar] [CrossRef]
  39. Sefcik, L.; Striepe, M.; Yorke, J. Mapping the landscape of academic integrity education programs: What approaches are effective? Assess. Eval. High. Educ. 2020, 45, 30–43. [Google Scholar] [CrossRef]
  40. Pan, M.; Stiles, B.L.; Tempelmeyer, T.C.; Wong, N. A cross-cultural exploration of academic dishonesty: Current challenges, preventive measures, and future directions. In Prevention and Detection of Academic Misconduct in Higher Education; IGI Global: Hershey, PA, USA, 2019; pp. 63–82. [Google Scholar]
  41. Peled, Y.; Eshet, Y.; Barczyk, C.; Grinautski, K. Predictors of Academic Dishonesty among undergraduate students in online and face-to-face courses. Comput. Educ. 2019, 131, 49–59. [Google Scholar] [CrossRef]
  42. Miller, L. Digital Integrity as a 21st Century Skill. In Technology and the Curriculum: Summer 2019; Power, R., Ed.; Power Learning Solutions: Montreal, QC, Canada, 2019. [Google Scholar]
  43. Maaja, V.; Tiia, V. The nature of (dis)honesty, its impact factors and consequences. In (Dis)Honesty in Management; Vadi, M., Vissak, T., Eds.; Emerald Group: Bingley, UK, 2013; Volume 10, pp. 3–18. ISBN 978-1-78190-602-6, 978-1-78190-601-9/1877-6361. [Google Scholar]
  44. Wowra, S.A. Moral identities, social anxiety, and academic dishonesty among american college students. Ethics Behav. 2007, 17, 303–321. [Google Scholar] [CrossRef]
  45. Whittle, C.; Tiwari, S.; Yan, S.; Williams, J. Emergency remote teaching environment: A conceptual framework for responsive online teaching in crises. Inf. Learn. Sci. 2020, 121, 301–309. [Google Scholar] [CrossRef]
  46. Popan, E. Learning environment. Salem Press Encycl. 2020. [Google Scholar]
  47. Nguyen, T.H.; Newby, M.; Skordi, P.G. Development and use of an instrument to measure students’ perceptions of a business statistics learning environment in higher education. Learn. Environ. Res. 2015, 18, 409–424. [Google Scholar] [CrossRef]
  48. Pan, W.; Tang, M. Students’ perceptions on factors of statistics anxiety and instructional strategies. J. Instr. Psychol. 2005, 32, 205–214. [Google Scholar]
  49. Lesser, L.M.; Reyes, R., III. Student reactions to the integration of fun material in a high-anxiety subject: A case study in the teaching of College Introductory Statistics. Transform. Dialogues Teach. Learn. J. 2015, 8, 1–19. [Google Scholar]
  50. Neumann, D.L.; Hood, M.; Neumann, M.M. Using real-life data when teaching statistics: Student perceptions of this strategy in an introductory statistics course. Stat. Educ. Res. J. 2013, 12, 59–70. [Google Scholar]
  51. Williams, A.S. Statistics anxiety and instructor immediacy. J. Stat. Educ. 2010, 18, 1–18. [Google Scholar] [CrossRef]
  52. Broeckelman-Post, M.; Malterud, A.; Arciero, A. Can course format drive learning? Face-to-face and and lecture-lab models of the fundamentals of communication course. Basic Commun. Course Annu. 2020, 32, 79–105. [Google Scholar]
  53. Xu, D.; Jaggars, S.S. Performance gaps between online and face-to-face courses: Differences across types of students and academic subject areas. J. High. Educ. 2014, 85, 633–659. [Google Scholar] [CrossRef]
  54. Helms, J.L. Comparing student performance in online and face-to-face delivery modalities. J. Asynchronous Learn. Netw. 2014, 18, n1. [Google Scholar] [CrossRef] [Green Version]
  55. Fischer, C.; Xu, D.; Rodriguez, F.; Denaro, K.; Warschauer, M. Effects of course modality in summer session: Enrollment patterns and student performance in face-to-face and online classes. Internet High. Educ. 2020, 45, 100710. [Google Scholar] [CrossRef]
  56. de Jong, P.G. Impact of moving to online learning on the way educators teach. Med. Sci. Educ. 2020, 30, 1003–1004. [Google Scholar] [CrossRef]
  57. Gacs, A.; Goertler, S.; Spasova, S. Planned online language education versus crisis-prompted online language teaching: Lessons for the future. Foreign Lang. Ann. 2020, 53, 380–392. [Google Scholar] [CrossRef]
  58. Whalen, J. Should teachers be trained in Emergency Remote Teaching? Lessons learned from the COVID-19 Pandemic. J. Technol. Teach. Educ. 2020, 28, 189–199. [Google Scholar]
  59. Lowenthal, P.; Borup, J.; West, R.; Archambault, L. Thinking beyond Zoom: Using asynchronous video to maintain connection and engagement during the COVID-19 Pandemic. J. Technol. Teach. Educ. 2020, 28, 383–391. [Google Scholar]
  60. Fisher, T. Emergency Online Pedagogy. Available online: https://medium.com/berkman-klein-center/emergency-online-pedagogy-28a4535707ae (accessed on 9 June 2020).
  61. Bozkurt, A.; Sharma, R.C. Emergency remote teaching in a time of global crisis due to CoronaVirus pandemic. Asian J. Distance Educ. 2020, 15, i–vi. [Google Scholar] [CrossRef]
  62. Teaching Online: A Penn Nursing Resource. Available online: https://canvas.upenn.edu/courses/1320001 (accessed on 9 June 2020).
  63. Quintana, R.; Quintana, C. When classroom interactions have to go online: The move to specifications grading in a project-based design course. Inf. Learn. Sci. 2020, 121, 525–532. [Google Scholar] [CrossRef]
  64. Hodges, C.; Moore, S.; Lockee, B.; Trust, T.; Bond, A. The difference between emergency remote teaching and online learning. Educ. Rev. 2020, 27, 1–12. [Google Scholar]
  65. Petillion, R.J.; McNeil, W.S. Student experiences of Emergency Remote Teaching: Impacts of instructor practice on student learning, engagement, and well-being. J. Chem. Educ. 2020, 97, 2486–2493. [Google Scholar] [CrossRef]
  66. Onwuegbuzie, A.J.; Wilson, V.A. Statistics Anxiety: Nature, etiology, antecedents, effects, and treatments—A comprehensive review of the literature. Teach. High. Educ. 2003, 8, 195–209. [Google Scholar] [CrossRef]
  67. Hedges, S. Statistics student performance and anxiety: Comparisons in course delivery and student characteristics. Stat. Educ. Res. J. 2017, 16, 320–336. [Google Scholar]
  68. DeVaney, T.A. Anxiety and attitude of graduate students in On-Campus vs. online statistics courses. J. Stat. Educ. 2010, 18, 1–15. [Google Scholar] [CrossRef] [Green Version]
  69. Scherrer, C.R. Comparison of an introductory level undergraduate statistics course taught with traditional, hybrid, and online delivery methods. INFORMS Trans. Educ. 2011, 11, 106–110. [Google Scholar] [CrossRef] [Green Version]
  70. Bolin, A.U. Self-control, perceived opportunity, and attitudes as predictors of academic dishonesty. J. Psychol. 2004, 138, 101–114. [Google Scholar] [CrossRef]
  71. Kisamore, J.L.; Stone, T.H.; Jawahar, I.M. Academic integrity: The relationship between individual and situational factors on misconduct contemplations. J. Bus. Ethics 2007, 75, 381–394. [Google Scholar] [CrossRef]
  72. Arbuckle, J.L.; Wothke, W. Amos 4.0 User’s Guide; SmallWaters Corporation: Chicago, IL, USA, 1999; ISBN 1568272642. [Google Scholar]
  73. Browne, M.W.; Cudeck, R. Alternative ways of assessing model fit. Sociol. Methods Res. 1992, 21, 230–258. [Google Scholar] [CrossRef]
  74. Hu, L.; Bentler, P.M. Cutoff criteria for fit indexes in covariance structure analysis: Conventional criteria versus new alternatives. Struct. Equ. Model. 1999, 6, 1–55. [Google Scholar] [CrossRef]
  75. Bäuerle, A.; Teufel, M.; Musche, V.; Weismüller, B.; Kohler, H.; Hetkamp, M.; Dörrie, N.; Schweda, A.; Skoda, E.-M. Increased generalized anxiety, depression and distress during the COVID-19 pandemic: A cross-sectional study in Germany. J. Public Health 2020, 42, 672–678. [Google Scholar] [CrossRef] [PubMed]
  76. Hillen, S.A.; Päivärinta, T. Perceived support in e-collaborative learning: An exploratory study which make use of synchronous and asynchronous online-teaching approaches. In Lecture Notes in Computer Science (Including Subseries Lecture Notes in Artificial Intelligence and Lecture Notes in Bioinformatics); Springer: Berlin/Heidelberg, Germany, 2012; Volume 7558, pp. 11–20. [Google Scholar]
  77. Elliott, S.N.; Davies, M.D.; Frey, J.R.; Gresham, F.; Cooper, G. Development and initial validation of a social emotional learning assessment for universal screening. J. Appl. Dev. Psychol. 2018, 55, 39–51. [Google Scholar] [CrossRef]
  78. Moore, M.G. The theory of transactional distance. In Handbook of Distance Education; Moore, M.G., Ed.; Routledge: New York, NY, USA, 2013. [Google Scholar]
  79. Mohmmed, A.O.; Khidhir, B.A.; Nazeer, A.; Vijayan, V.J. Emergency remote teaching during Coronavirus pandemic: The current trend and future directive at Middle East College Oman. Innov. Infrastruct. Solut. 2020, 5, 72. [Google Scholar] [CrossRef]
  80. Edgar, S.N.; Elias, M.J. Setting the stage for Social Emotional Learning (SEL) policy and the arts. Arts Educ. Policy Rev. 2020. [Google Scholar] [CrossRef]
  81. Fosslien, L.; Duffy, M.W. How to combat zoom fatigue. Harv. Bus. Rev. 2020. [Google Scholar] [CrossRef]
  82. Robinson, H.; Al-Freih, M.; Kilgore, W. Designing with care: Towards a care-centered model for online learning design. Int. J. Inf. Learn. Technol. 2020, 37, 99–108. [Google Scholar]
  83. Grau, F.X.; Escrigas, C.; Goddard, J.; Hall, B.; Hazelkorn, E.; Tandon, R. Editors’ introduction: Towards a socially responsible Higher Education Institution: Balancing the Global with the Local. In Higher Education in the World 6: Towards a Socially Responsible University: Balancing the Global with the Local; Global University Network for Innovation: Girona, Italy, 2017; Volume 6, pp. 37–51. [Google Scholar]
  84. Hazelkorn, E. Building global education with a local perspective: An introduction to glocal higher education. J. High. Educ. 2016, 87, 456–459. [Google Scholar] [CrossRef]
  85. Hertig, H.P. Universities, Rankings and the Dynamics of Global Higher Education: Perspectives from Asia, Europe and North America; Palgrave Macmillan: London, UK, 2016. [Google Scholar]
Figure 1. Structural model for determinants of academic dishonesty.
Sustainability 13 01564 g001
Figure 2. Structural model for determinants of Academic Misconduct—POE Sample. Notes: * p < 0.05; ** p < 0.01; *** p < 0.001.
Sustainability 13 01564 g002
Figure 3. Structural model for determinants of Academic Misconduct—F2F Sample. Notes: * p < 0.05; ** p < 0.01; *** p < 0.001.
Sustainability 13 01564 g003
Figure 4. Structural model for determinants of Academic Misconduct—ERT Sample. Notes: * p < 0.05; ** p < 0.01; *** p < 0.001.
Sustainability 13 01564 g004
Table 1. Descriptive statistics and inter-correlations among variables.
VariablesMSD1234567–8
1. Worth of Statistics3.081.070.91
2. Interpretation anxiety2.890.990.47 ***0.87
3. Test and class anxiety3.031.090.54 ***0.81 ***0.90
4. Computational self-concept2.580.970.69 ***0.58 ***0.68 ***0.87
5. Fear of asking for help2.381.090.33 ***0.73 ***0.75 ***0.54 ***0.90
6. Fear of statistics teachers2.510.890.59 ***0.55 ***0.60 ***0.72 ***0.50 ***0.83
7. Academic misconduct1.240.470.030.100.010.100.12 *0.15 **0.92
8. Academic integrity2.830.560.050.050.190.020.050.060.68
Notes: Reliability coefficients appear on the diagonal in bold. * p < 0.05; ** p < 0.01; *** p < 0.001; n = 291.
Table 2. Descriptive statistics and inter-correlations between Statistics Anxiety and the dependent variables.
POE (n = 113)Face-to-Face (n = 84)ERT (n = 94)
VariablesMSDrpMSDrpMSDrp
Statistics Anxiety2.770.77-2.850.93-2.660.82-
Academic Misconduct1.280.490.19 *1.310.570.0031.140.300.08
Academic Integrity2.800.500.37 ***2.830.67−0.102.860.51−0.11
* p < 0.05; ** p < 0.01; *** p < 0.001.
Table 3. Hypotheses testing results.
Course TypeConstructsHypothesisβSECRp-ValueSupport
POEStudents’ Achievements → Statistics AnxietyH1−0.340.01−0.090.02 *Yes
Statistics Anxiety → Academic DishonestyH20.780.083.64***Yes
Students’ Achievements → Statistics Anxiety and Academic DishonestyH3−0.27(−0.014; −0.002)0.02 *Yes
Students’ Achievements → Statistics AnxietyH1−0.610.03−1.960.05~Yes
F2FStatistics Anxiety → Academic DishonestyH2−0.260.10−1.130.26No
Students’ Achievements → Statistics Anxiety and Academic DishonestyH30.15(−0.011; 0.034)0.23No
ERTStudents’ Achievements → Statistics AnxietyH1−0.550.04−1.370.17No
Statistics Anxiety → Academic DishonestyH2−0.640.10−1.030.30No
Students’ Achievements → Statistics Anxiety and Academic DishonestyH30.31(−0.001; 0.025)0.11No
Notes: β = standardized regression weight; SE, standardized error; CR, critical ratio. * p < 0.05; ** p < 0.01, *** p < 0.001. Confidence interval of 95% in Brackets.
Table 4. Between-group comparison.
Course TypeNFI Delta-1DFp-ValueDifference
POE vs. F2F0.04522***Yes
POE vs. ERT0.08722***Yes
ERT vs. F2F−0.0017NSNo
General Model0.08344***Yes
Note: * p < 0.05; ** p < 0.01; *** p < 0.001.
Publisher’s Note: MDPI stays neutral with regard to jurisdictional claims in published maps and institutional affiliations.

