1. Introduction
1.1. Climate Change and Urban Regeneration Strategies
The increasing frequency of climate change-related extreme events observed in recent decades is nowadays at the center of the scientific debate and represents one of the key issues of urban planning research. These changes undoubtedly represent one of the major challenges that the global risk society [
1] will have to face, both for their expected impact on cities and territories, and for the consequent economic, social and environmental damages already highlighted by empirical evidences.
As widely recognized in the reports of the International Panel for Climate Change (IPPC), due to their higher population density, urban and metropolitan areas are, at the same time, liable to be the most exposed and vulnerable to multiple risks [
2] and the most responsible for excessive CO
2 emissions from anthropogenic activities (mobility, residence, production activities, etc.), a condition that is further worsened by the frequent absence or ineffectiveness of urban planning [
3,
4]. The relevance of the topic and the need to identify new paradigms for the sustainable transformation of the threatened territories are also recognized in the Global Agenda for Sustainable Development 2030 [
5], which urges to make cities and human settlements inclusive, safe, long-lasting and sustainable (Objective 11), and recommends that policy makers and institutions take urgent measures to tackle climate change and its consequences (Objective 13). The European Union also recognizes that cities play a central role in the challenge of climate change, with the launch of the Covenant of Mayors in 2009, with the adoption of the Adaptation Strategy in 2013 and with the Mayors’ Campaign for Climate Adaptation (Mayors’ Adapt in 2014).
In recent years, the urgency to develop mitigation and/or adaptation measures in response to climate change, possibly also envisaging a radical transformation of the sensitive territories at risk, either from extreme events or by being exposed to chronic degenerative processes [
6,
7,
8], has increased public awareness and concern as to the responsibilities of policy makers in taking action to translate these issues into urban planning agendas. As a consequence, the need has arisen to both improve and extend the skills of urban planners and update territorial governance tools currently available, aiming to develop effective and feasible regeneration and resilience strategies [
9,
10].
The profound crisis of contemporary cities and territories, and of their environmental, economic and social links and identity, has been defined as the
new urban question [
11]. It constitutes the rationale for the renewed awareness in the urban planning community that finally prompted an innovative trans-disciplinary approach to the design of an updated notion of urban welfare, focusing on safety, health, economic development, and social innovation [
12]. From the urban planning perspective, the achievement of these objectives can only be pursued through the overcoming of traditionally sectoral approaches, in favor of an integrated approach to urban complexity [
13,
14,
15].
Among the territorial impacts caused by climate change, coastal flooding in urban areas is undoubtedly one of the most evident, critically triggered by the projected sea level rise (henceforth SLR). As a matter of fact, the extreme sea water levels (ESL) that cause coastal flooding arise from a variety of concurrent non-linear processes (e.g., waves, storm surges, ocean circulation and tectonics, tides), interacting across multiple space and time scales and adding to the long-term sustained effects of sea level rise, which therefore represents a permanent element of the overall risk. In the Adriatic Sea, the occasional contributions from waves and storm surges are not expected to significantly vary under climate change with respect to present climate, as to either intensity or frequency [
16,
17]. This work therefore intentionally only focuses on this latter component, and is intended to complement previous studies that also concentrated on the storm surge contribution in the North Adriatic Sea [
18,
19] by setting the baseline for future risk assessments and allowing a first-pass classification of the exposed areas. In the following, the terms
flood or
inundation therefore refer to the potential submersion of considerable portions of coastal areas, that is, to potential sustained coastline retreat, and not to either episodic extreme events or to the combined effects of extreme weather and sea level rise. Our approach is also grounded in the lively discussion taking place among decision scientists, on how to tackle risk management in the presence of very large uncertainties, and by the now widespread awareness that the current large uncertainties in climate and impact predictions is expected to increase as more and more complex processes are introduced in the models rather than the reverse [
20]. On the contrary, adaptive capacity has been recognized as a key element of social resilience [
20,
21]. In our opinion, this justifies shifting the focus from optimal hazard evaluation to the compelling urgency to develop and implement effective and feasible solutions, that is, to
preparedness.A recent study carried out at ENEA has identified 33 Italian coastal areas that are expected to be submerged as a consequence of SLR [
22]. Among these, the municipality of Ravenna (Northeast Italy) was chosen as the first test case for this work. In particular, we aim to identify the elements of the urban structure that are potentially exposed to an increased risk of flooding, according to future SLR projections under the pessimistic RCP8.5 scenario, by making use of high-resolution spatial information systems (GIS) that allow the elaboration of detailed risk maps. Such an effort is expected to contribute to the design and the adoption of effective local adaptation measures, and to set a methodological framework for the future planning of interventions capable of reducing the fragility of contemporary territories, as a function of their specific characteristics and needs [
23].
1.2. Sea Level Rise and Innovation in the Local Urban Plan: Regulation and Pilot Studies
The need to define an innovative and onward-looking agenda for the development of effective coastal adaptation strategies and updated urban planning tools for coastal cities is now widely acknowledged, as well as the circumstance that many of crucial, yet unsolved, issues lie at the intersection of a variety of so far non-communicating disciplines, such as natural and social sciences, engineering, decision science, and political economy. For these reasons, new joint research activities across traditionally distinct communities and policy makers have been recommended [
24,
25,
26] and are, in fact, constantly emerging, which have prompted an ever increasing number of trans-disciplinary studies, both numerical and observational, focusing on the current and future impacts of extreme events, on shoreline retreat due to sea level rise, or to their joint effects, at different spatial and temporal scales and different levels of complexity, among others, [
19,
22,
27,
28,
29,
30,
31,
32,
33,
34,
35,
36,
37,
38].
A crucial role has been attributed to local governments and administrative bodies in fostering the adaptation of territories to the effects of climate change, along two prevailing directions:
The strategic dimension, i.e., promoting the development of local agendas, that provide the definition of short, medium and long-term strategic plans according to the vision of the administration, also in terms of adaptation to climate change; relevant examples, in the international context, can be found in
Vejle’s Resilient Strategy (2013) [
39],
Rotterdam Climate Change Adaptation Strategy (2013) [
40],
One NYC 2050. Building a strong and fair city (2019) [
41];
The experimental dimension, i.e., implementing participated pilot actions and programs, validating their effectiveness, incorporating best practices into local regulations and exporting solutions to broader/different contexts.
These two complementary directions originate from the well-known dichotomy between the traditional top-down/prediction-first approach, where measured design and implementation is preceded by a multi-criteria analysis of cost-effectiveness, and the innovative bottom-up/policy-driven/experience-based approach, which inverts the traditional top-down framework, by assessing the robustness of policy options under a broader range of future scenarios than that predicted by a limited set of mathematical models, thus shifting from the design of optimal solutions, to the identification of measures that satisfactorily perform under different conditions and assumptions, allowing for considerable uncertainty and variety in the external constraints [
42,
43,
44,
45,
46,
47,
48,
49,
50,
51,
52].
In the Italian national context, however, these issues have been only marginally addressed, and few isolated pilot experiments so far undertook the difficult task of accounting for the projected SLR in spatial planning tools and design techniques, also due to the complex regulative framework prescribed by the national rules.
From the administrative and regulative point of view, the Local Urban Plan (Piano Urbanistico Locale) constitutes the main reference for any intervention on the territory, so that the implementation of any new approach to territorial management can exclusively stem from its foresighted redaction. The possibility of implementing climate change mitigation and adaptation measures is therefore directly linked to the willingness of public authorities to incorporate new perspectives into the update process, broadening their knowledge basis as to potential climate change impacts, and to identify the exposed areas, assess their vulnerability and finally, provide actionable guidelines and directives for risk reduction [
53,
54]. Increased public awareness plays a crucial role in determining such a paradigm shift [
55,
56].
Nevertheless, a few instances of preliminary efforts can be found as to both the strategic and experimental dimension:
The Strategic Metropolitan Plans of Genoa [
57], Venice [
58] and Milan [
59], issued in 2017, 2018 and 2019, respectively, and the case study of the Project LIFE16 Veneto Adapt [
60];
Test-case verification of Local Urban Plans, aiming to provide fact-based information for their objective update, with particular reference to feasible and effective adaptation to climate change impacts. The
Resilient Padua (Padova Resiliente) and
Resilient Mantua (Mantova Resiliente) experiences, in particular, allowed to deliver the
Guide for Climate Adaptation, 2016 [
61] and 2018 [
62], which were coordinated by the Planning Climate Change Lab of the IUAV University of Venice.
On the other hand, SLR impacts have been addressed at the national level by sectorial instruments such as the PAI (Piano di Assetto Idrogeologico—Hydrogeological Stability Plan) and the PGRA (Piano di Gestione del Rischio Alluvioni—Flood Risk Management Plan) [
63]. The former aims to regulate new settlements in areas exposed to hydrogeological risk with the specific scope of supporting urban planning, while the latter is more strictly related to the safety of the territory and to civil protection activities [
64].
This work, albeit preliminary and still in progress, therefore represents an innovative attempt to identify methodologies and operational frameworks that can effectively enable Italian public administrations to soundly respond to SLR-induced threats to coastal cities, and to better adhere to the principle of climate-proof planning, by implementing innovative management tools [
65]. In particular, we will present the first results of the pilot study conducted on the municipality of Ravenna, together with the flood risk maps produced for its seafront, as a first step towards an improved appreciation of the complexity that needs to inspire future municipal planning instruments, and guide the selection of the most suitable interventions. Our approach follows the traditional top-down prediction-first strategy, yet it still represents an improvement with respect to the planning tools that have so far been developed for the city.
2. Materials and Methods
2.1. Definition of Risk Components
According to the UNDRR Report “Living with risk: a global review of disaster reduction initiatives” (2004) [
66], risk is defined as the probability of harmful consequences, or expected loss (of lives, people injured, property, livelihoods, economic activity disrupted or environment damaged) resulting from interactions between natural or human-induced hazards and vulnerable/capable conditions. The reliability of any risk assessment, as well as the effectiveness of adaptation planning, are therefore critically dependent on our ability to project future hazards, to account for the social, economic and environmental vulnerabilities that jointly determine the susceptibility of the exposed elements, and to react to adverse impacts.
In the traditional disaster risk reduction (DRR) framework, risk increases whenever our (often limited) knowledge of the hazard is not translated into effective mitigation or adaptation, or into significant exposure reduction, especially when low-frequency yet high-impact events are considered. Such conceptual understanding is represented by the traditional pseudo-equation for risk, or by any of its variations: Risk = Hazard × Exposure × Vulnerability, or Risk = Probability × Consequence.
Recent research, however, has highlighted the need for a more complex appreciation of the nature of risk, as the overall risk has been recognized to be mainly determined by the coupling of systemic elements, rather than by their accidental superposition [
67]. In this new context, while natural hazards can, in principle, be rigorously measured, other components of risk are still the object of extensive trans-disciplinary discussion among a variety of research fields, including social and political sciences, history, economics and engineering [
68,
69]. It is worth noting that this lively debate in the risk assessment community indeed mirrors the above-mentioned discussion that animates the policy community, and that alternative approaches are being constantly re-designed in a more and more intertwined framework, as they all originate from the growing awareness that idealized decision frameworks clash against the actual capacity and political constraints of the real world and that risk is largely a social construct, depending not only on measurable hazard/exposure/vulnerability components but also on a wide variety of public and private factors that can only be qualitatively appreciated [
24,
70].
On the other hand, in the context of climate studies, a broad definition of vulnerability was early recognized to be a key element to describe climate change impacts more aptly as the result of a variety of complex interacting processes, rather than as the mere consequences of natural phenomena impacting social communities and systems. Indeed, the 4th IPCC Assessment Report already referred to vulnerability as to the synthesis of multiple inter-connections and feedbacks between traditional risk components [
71]. For the sake of transparency and clarity, however, such terminology was then reviewed and harmonized in the Fifth IPCC Assessment Report [
6] where the term vulnerability was in fact replaced by the phrase
risk of climate change impacts, borrowed from the DRR community, together with the definitions of hazard, vulnerability and exposure which will be used in the following.
Our approach combines the evaluation of the physical hazard and the static assessment of the vulnerability (sensitivity and adaptive capacity) and exposure of the town under study, which, in general, depend on its peculiar geological, environmental and socio-economic characteristics, and on the nature of the exposed elements. The city of Ravenna was selected for our application as it was included among the 33 coastal plains at risk of inundation in [
22], and its vulnerability and exposure have been recognized in [
30], as part of their analysis of the effects of scale and input data for the Emilia-Romagna Coast. For the selected area, we aim to produce informative maps that allow drawing a systemic, qualitative and quantitative picture of the urban elements at risk. The following analysis is conducted in the classical DRR framework, where exposure is measured by the elevation over current mean sea level and vulnerability by the nature of the elements potentially affected (e.g., beaches, dunes, buildings), while the magnitude of the hazard is given by the expected SLR alone (i.e., not considering subsidence and transient processes/phenomena). The layer corresponding to the three risk components are then overlapped to produce preliminary risk maps, disregarding for the moment any non-linear coupling between risk components, which would, in principle, imply non-null risks also for the inner areas, both physical (e.g., they would no longer be sheltered from extreme storms and/or waves) and socio-economical (e.g., loss of attractiveness due to the degradation of adjacent buildings). As a matter of fact, a thorough analysis of the overall risk implied for the entire urban settlement would require sustained interaction with all the involved stakeholders, including knowledge sharing and continuous verifications of needs and expectations, so as to determine the weights of alternative combinations of risk components [
72]. This would only be possible if comprehensive databases were available to design complex vulnerability and exposure indicators, accounting for a variety of factors, such as economic conditions and development, social interdependences, adaptive capacity and technological options. In general, such facilities are neither easily available, when existing, nor even conceivable in most cases for the time being, with further development having therefore to rely on a step-by-step approach in selected pilots. Our effort is in fact intended as an outset along this path.
2.2. Climate Change-Induced Hazard Associated to SLR
The extreme sea levels that threaten the coastal environment and economies arise from the superposition of transient extreme events, such as waves and storm surge, and tides onto the relative sea level, thus demanding a comprehensive risk assessment across a range of spatial and temporal scales that demand complex and differentiated approaches [
31]. Vousdoukas et al. (2017) [
32], in particular, lament the lack of comprehensive projections of extreme sea levels that consistently include sea level, tides, waves, and storm surges. This work, however, only focuses on the sea level rise component, whose quantitative estimate in the Mediterranean Sea already constitutes a scientific challenge, due to the inherent diversity of the geological history of the basin and to the complex features of its marine circulation. In addition, the local sea level is also constrained by the water exchanges across the Strait of Gibraltar, which determine the hydraulic jump between the Mediterranean and the adjacent Atlantic Ocean, while the connection with the Black Sea, through the Dardanelles, Sea of Marmara and the Bosphorus, couples the basin hydrology to the land-based hydrological cycle of a vast portion of continental Europe.
If the contributions from continental glaciers and geologic processes are neglected, RSL is the result of a steric component (i.e., expansion/contraction of the water column due to density variations) and of mass variations arising from convergence/divergence of the mean horizontal velocity, horizontal density advection, and surface freshwater budget. The complexity of the calculation of all these terms is thoroughly described in Jordà and Gomis (2013) [
73], with particular reference to the Mediterranean Sea as a paradigmatic example of a semi-enclosed basin where sea level components need to be carefully interpreted. Such difficulties led to a variety of sea level estimates and attribution of changes even under current climate, whose divergence is further enlarged under future scenarios, due to the inherent spread of model projections.
The Mediterranean mean sea level has in fact been observed to deviate from the global values at decadal time scales, exhibiting a decrease in the period 1960–1990, due to a persistent positive anomaly of sea level pressure, then accelerating its increase with respect to the global value, and ending with a stationary period from 2002 onwards [
74,
75,
76,
77]. Model simulations show that mass addition has generally been larger than the steric component, yet the thermosteric trend estimated from observations is still affected by large uncertainties, even as to its sign, while consensus has been reached as to the decrease in the halosteric term, despite apparent inconsistencies between available hydrographic datasets [
17,
73,
78,
79].
As for future projections of RSL (expansion/contraction of the water column plus the effects of ocean dynamics), even recent works still rely on atmosphere and ocean general circulation model (AOGCMs) outcomes from the CMIP5 Coupled Model Inter-comparison Project (CMIP5), at 1° × 1° resolution, to which additional global and regional contributions are added offline [
22,
31,
32]. Although some estimates may choose to neglect the lower order terms, the latter are: (i) the barystatic sea level change, (ii) the GRD-induced sea level change, and (iii) the GIA-induced sea level change. The barystatic sea level rise accounts for water mass transfer from the land to the ocean and has a global effect, while GRD represents the local and instantaneous changes in the geoid and has regional effects, although globally widespread. The GRD includes changes in Earth Gravity, Earth Rotation and viscoelastic solid Earth Deformation. GIA is the Glacial Isostatic Adjustment deriving from the deformation of the Earth’s crust in response to changes in ice mass distribution. A considerable spread between model projections characterizes RLS estimates, which by the end of the century and for the area of the North Atlantic in proximity of the Gibraltar Strait (often used to constrain the Mediterranean sterodynamic sea level, as in Thiéblemont et al. (2019) [
31]), can range from about 40 cm to over 100 cm for the most pessimistic RCP8.5 scenario, with an ensemble mean of about 80 cm, and approximately from 30 cm to 80 cm for the intermediate RCP4.5 scenario, with an ensemble mean of 60 cm [
32]. On the other hand, Thiéblemont et al. (2019) [
31] use a median estimate of about 80 cm and two different high-end scenarios, obtained by considering the upper limit of the likely range and the “worst model” projections to estimate the sea level equivalent of melting glaciers. In their turn, Antonioli et al. (2017) [
22] refer to the SLR range of 530–970 mm reported in the IPCC AR5, and to Rahmstorf’s semi-empirical estimate of about 1.400 mm for the maximum level reached by 2100 [
80], while also presenting a table summarizing possible alternative ranges. As already mentioned, estimates derived from AOGCMs for the interior of the Mediterranean basin are, in general, unreliable due to the insufficient model resolution that impairs the correct representation of the hydraulic control across the Gibraltar Strait and of the local dynamics [
81].
In view of the peculiarities of the local sea level response to global warming, for the present study, an alternative approach has been followed and SLR estimates have been derived from a high-resolution regional simulation of the Mediterranean circulation, based on a configuration of the MITgcm that was specifically adapted for the Mediterranean basin [
82]. The simulation was driven by the dynamically downscaled regional atmospheric fields produced by the Rossby Centre regional atmospheric model RCA4 [
83]. In particular, we used the RCA4 downscaling (0.11-degree resolution, i.e., approx. 12.5 km grid spacing) of the atmospheric component of the CMIP5 global model HadGEM2-ES [
84]. The atmospheric downscale was performed over the European domain defined by the Coordinated Regional Downscaling Experiment [
85] for the HISTORICAL (1970–2005), RCP-8.5 scenario (2006–2100) and the ERA-INTERIM reanalysis (1980–2012). In the current study, only the RCP-8.5 scenario was considered. The MITgcm model has also been laterally constrained by the conditions applied at the Atlantic Ocean’s open boundary. To guarantee consistency with the atmospheric forcing, de-drifted sea level, temperature and salinity fields from the HadGEM2-ES projections were used. Future projected (RCP-8.5) mean values for surface mass balance and dynamic ice sheet from Greenland and Antarctica, and the glacier and land water storage contributions were also added to the sea level variable. In particular, we used data from the Integrated Climate Data Center (ICDC) at Hamburg University. For the pessimistic RCP 8.5 climate change scenario, SLR values (including the local Mediterranean thermosteric component) of 2 cm, 17 cm, and 68 cm were projected for the three time horizons, 2030, 2050, 2100, respectively. Such estimates generally agree with the median values obtained from the GCM-based ensembles, yet they can significantly rise if alternative high-end climate change scenarios are used to drive the regional model.
2.3. Presentation of the Case Study
The Emilia-Romagna Region is in the process of defining a regional strategy for climate change mitigation and adaptation, by implementing effective policies for the reduction of greenhouse gas emissions, and by fostering the adoption of effective counter-measures to limit and control the adverse impacts of future climate scenarios. The regional strategy aims to coordinate all the envisaged measures, from the regional to the municipal level, into a unitary, organic, multisectoral and multiscalar vision, which can only be achieved by the homogeneous planning of all the administrative instruments in force, such as the Local Climate Plans, the PAES (i.e., the Regional Landscape Plan) and the Local Adaptation Plans. The latest regional planning law (Disciplina regionale sulla tutela e l’uso del territorio, n. 24 of 21 December 2017) therefore urged local administrations to update their local planning tools in accordance with the overall regional strategy, by acknowledging scientific evidences and best practices, as well as the specific local characteristics.
In the context of the lively interest manifested by regional institutions, the Municipality of Ravenna was then identified as a relevant case study for our analysis, all the more as it has already been included among the Italian areas most exposed to future SLR [
22]. Ravenna has 157.731 inhabitants with a population density of 241.25 inhabitants/km
2, and it is the second largest municipality in Italy by area [
86].
The Municipality of Ravenna has started drafting the PUG (General Urban Plan), through a broad and in-depth discussion with all institutional, social and economic actors, after having issued a reference strategic document, Il piano delle azioni consapevoli e integrate (Plan for Conscious and Integrated Action) in 2019 [
87]. The latter recommends the construction of Integrated Risks Maps that allow to overlap different informational layers indicating five main goals, in compliance with the two dimensions (strategic and experimental) of the local governance of climate change adaptation:
Goal 1 | Ravenna, a resilient, adaptive and antifragile city;
Goal 2 | Ravenna, a city of sustainable agriculture;
Goal 3 | Ravenna, an international city, interconnected and accessible;
Goal 4 | Ravenna, a mosaic city, multifunctional and creative;
Goal 5 | Ravenna, a regenerated, habitable, welcoming and safe city. Role, design and strategic contents of the overall vision.
Strategic guidelines and design actions are defined for each goal. SLR is specifically, addressed in Goal 1—Strategic outline LS1, Consolidating and redeveloping the Ravenna coast as a maritime park, which recommends the AP1 Design action, Promoting protection interventions and beach nourishment to respond to the risks of subsidence, liquefaction of the soils, sea level rise and coastal erosion, favoring naturalistic engineering techniques.
Adding to the above mentioned specific issue, the National Guidelines for the defense of coasts from erosion and from the effects of climate change (Linee Guida Nazionali per la difesa della costa dai fenomeni di erosione e dagli effetti dei cambiamenti climatici) [
88], constitutes the reference instrument for local intervention planning, which underlines the importance of classifying the areas historically affected by coastal erosion and/or by marine flooding. To this end, the construction of a database of historical storms is indicated as a necessary support instrument for the assessments of current vulnerabilities and their possible evolution, allowing the prevention and management of coastal risks.
For our study, however, we can only refer to the calamitous storm which affected the city of Ravenna in 1979 and caused the first ecological strike in Italy, prompting the birth of the special law against subsidence (10 December 1980, n. 845), finally recognized as a critical local amplifier of relative sea level rise.
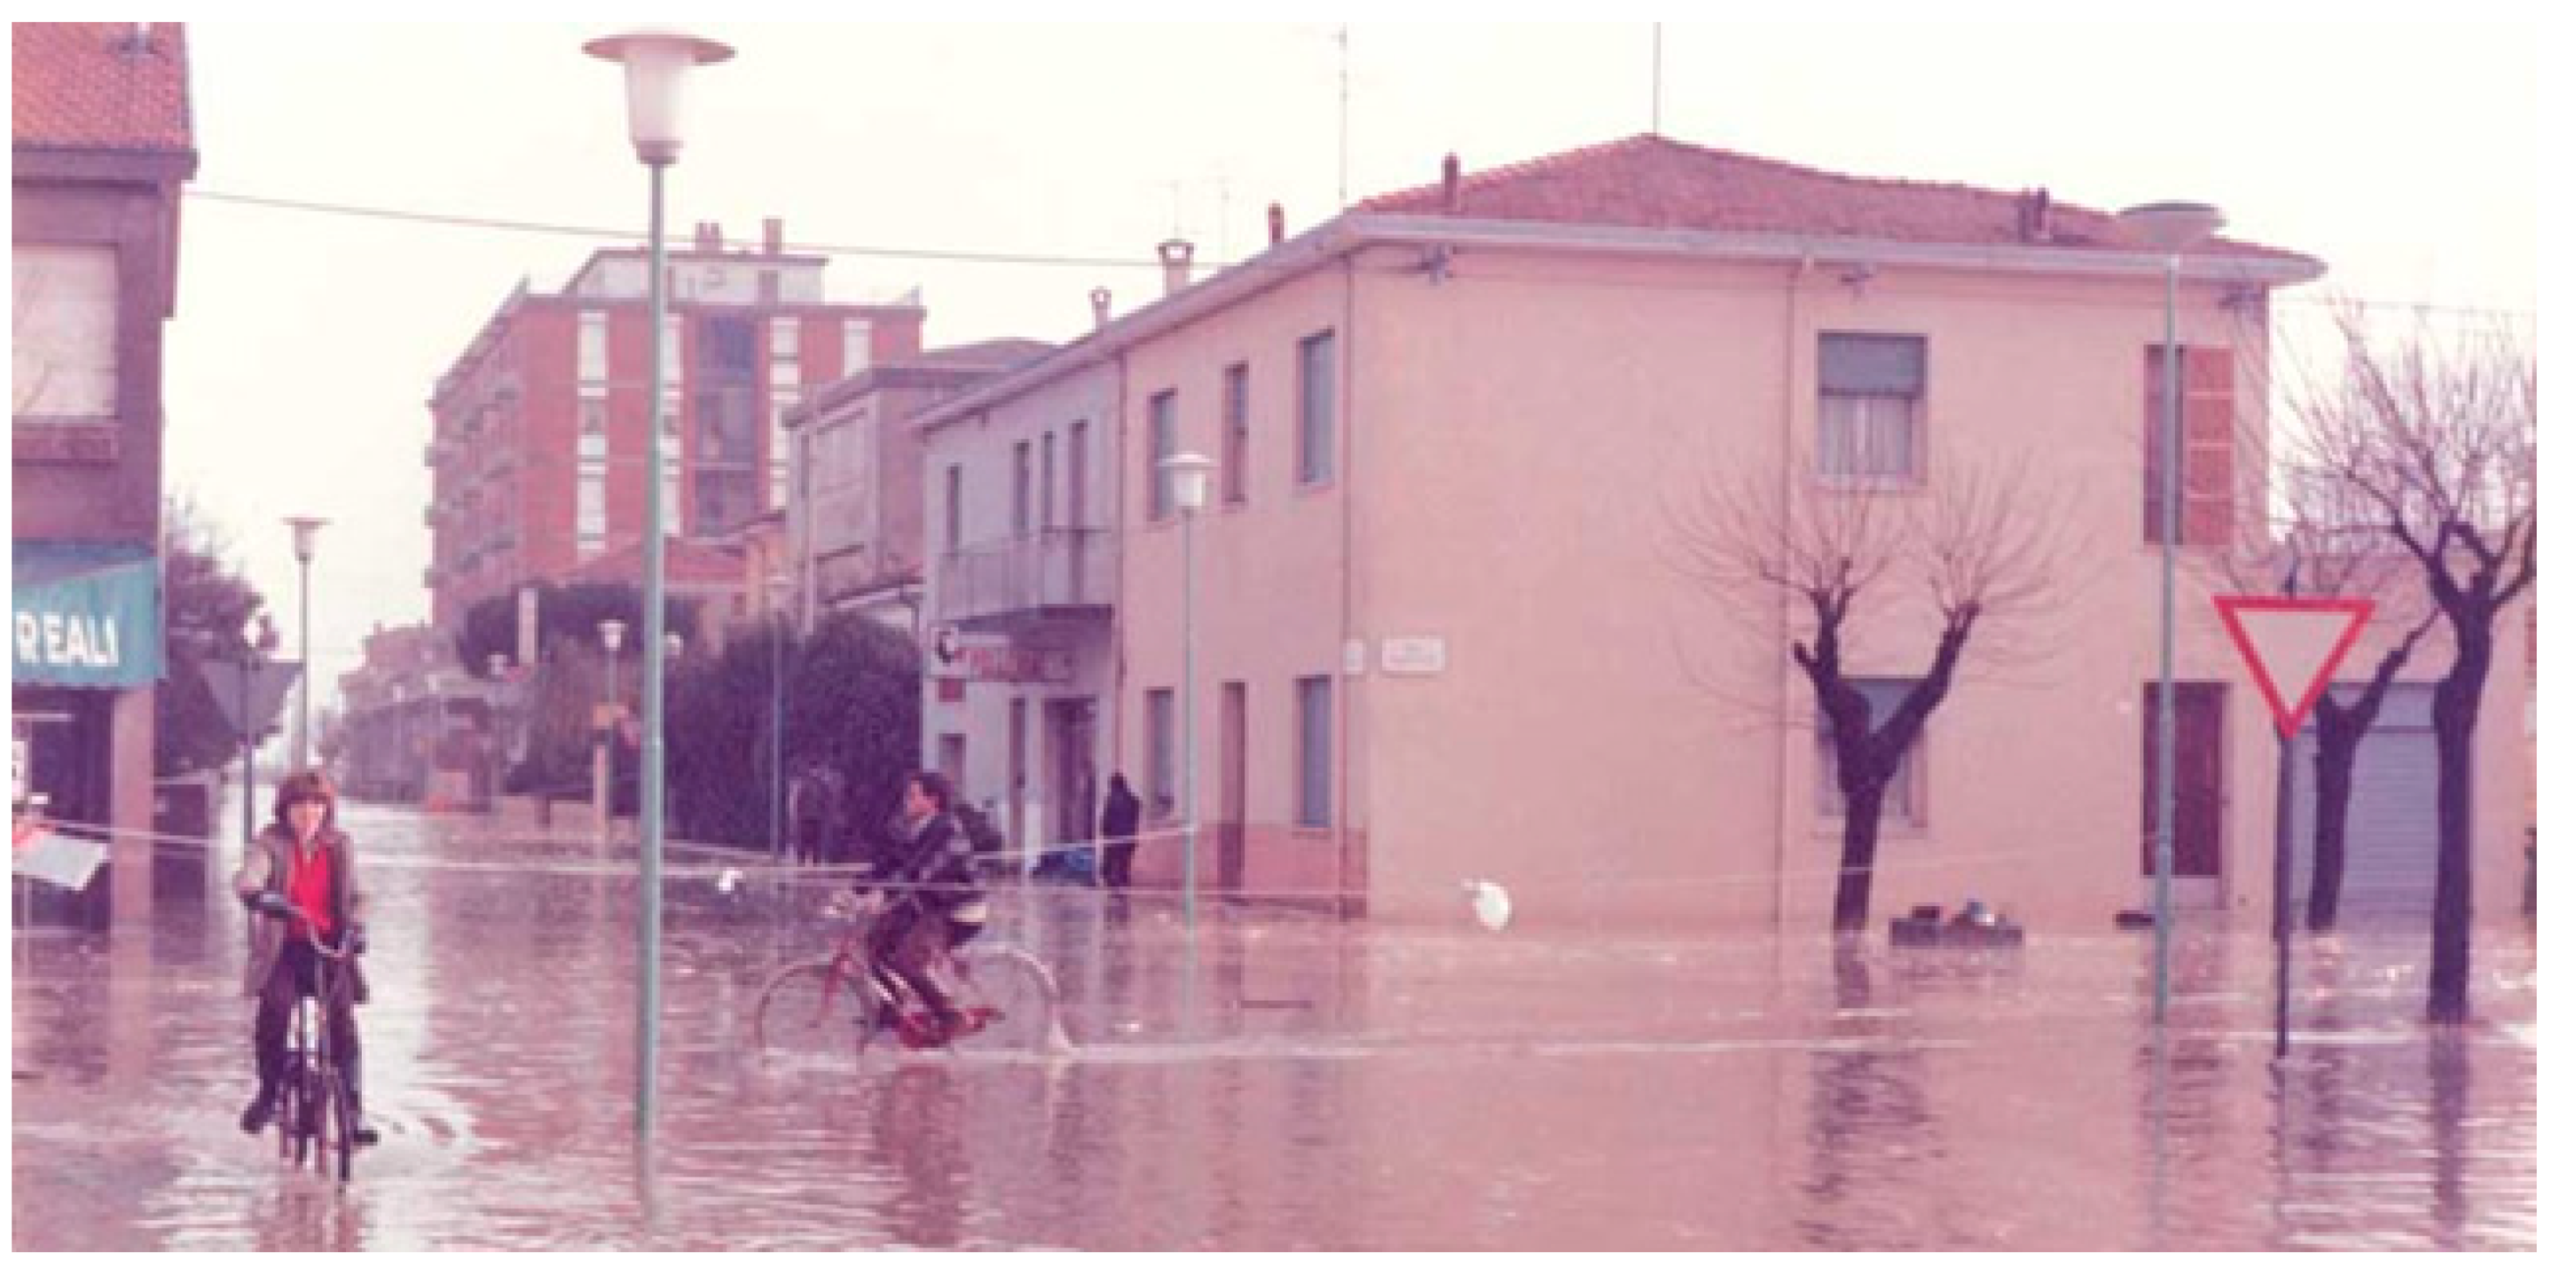
On 22 December 1979, the Adriatic Sea flooded the Ravenna waterfront as well as the neighboring towns, particularly in the areas of Marina di Ravenna (
Figure 1) and Lido Adriano. The damage was estimated at around 100 billion of lire in Ravenna alone, which immediately demanded the Government to declare a state of emergency. Bathing facilities, hotels, industries, pine forests and houses were severely damaged [
89].
In the following, the areas of Marina di Ravenna and Lido Adriano are therefore identified as target areas, which were already indicated as the object of urban regeneration interventions in the Goal 1—Strategic outline LS1-AP1 of the above mentioned Plan. Flood Risk Maps for the three time horizons, 2030, 2050 and 2100, will be therefore drawn as a propaedeutic action to define feasible SLR adaptation options and to supplement the municipal urban planning tool currently in force in Ravenna, i.e., the PSC (Piano Strutturale Comunale—Municipal Structural Plan, 2007). As a matter of fact, the maps included in the PSC-Point B.3.1 (Carte dei Rishi di Origine Naturale—Risks Maps of Natural Origin) indeed account for subsidence and coastal erosion (
Supplementary, Figure S1), but no reference is made to the contribution of an increasing sea level. It is therefore evident that the intended realization of the maritime park must rely on updated tools that support specific adaptation solutions.
2.4. Geodatabase Preparation
In order to produce future potential risk maps, the pessimistic RCP 8.5 scenario was considered, which only allows for a low decrease in greenhouse gas emissions; specifically, reference is made to the first Antarctic scenario, yielding the following values (in cm) for the local sea level rise, in correspondence to the three targeted time horizons (
Table 1).
In addition, the following territorial information layers were used for the construction of the Flood Risk Maps:
excerpt from the Digital Elevation Model (DEM), 10 m resolution, over the territorial extension of the Municipality of Ravenna [
90];
coastline shapefile [
91];
border of the municipality of Ravenna [
92].
Table 2 illustrates the additional georeferenced data from the Ravenna OpenData portal [
93] that were used for the development of a basic technical cartography of the municipal area, as the first step for the elaboration of the Flood Risk Maps using the Q-GIS 3.10.2 software. The layer describing the coastline was then overlapped, as well as the DEM (Digital Elevation Model) of the analyzed area.
The levels corresponding to terrain elevations equal to the SLR projection for each time horizon (2030/2 cm, 2050/17 cm and 2100/68 cm) were then extracted in order to highlight the areas exposed to inundation for the whole extension of Ravenna Municipality. However, only results for the target areas of Marina di Ravenna and Lido Adriano are shown.
Thanks to the Ravenna Urban Planning Service [
94], it was possible to export the GEOTIFF file of “Elaborato 3—Spazi e Sistemi del PSC” (Chart 3—Spaces and Systems of Municipal Structural Plan) [
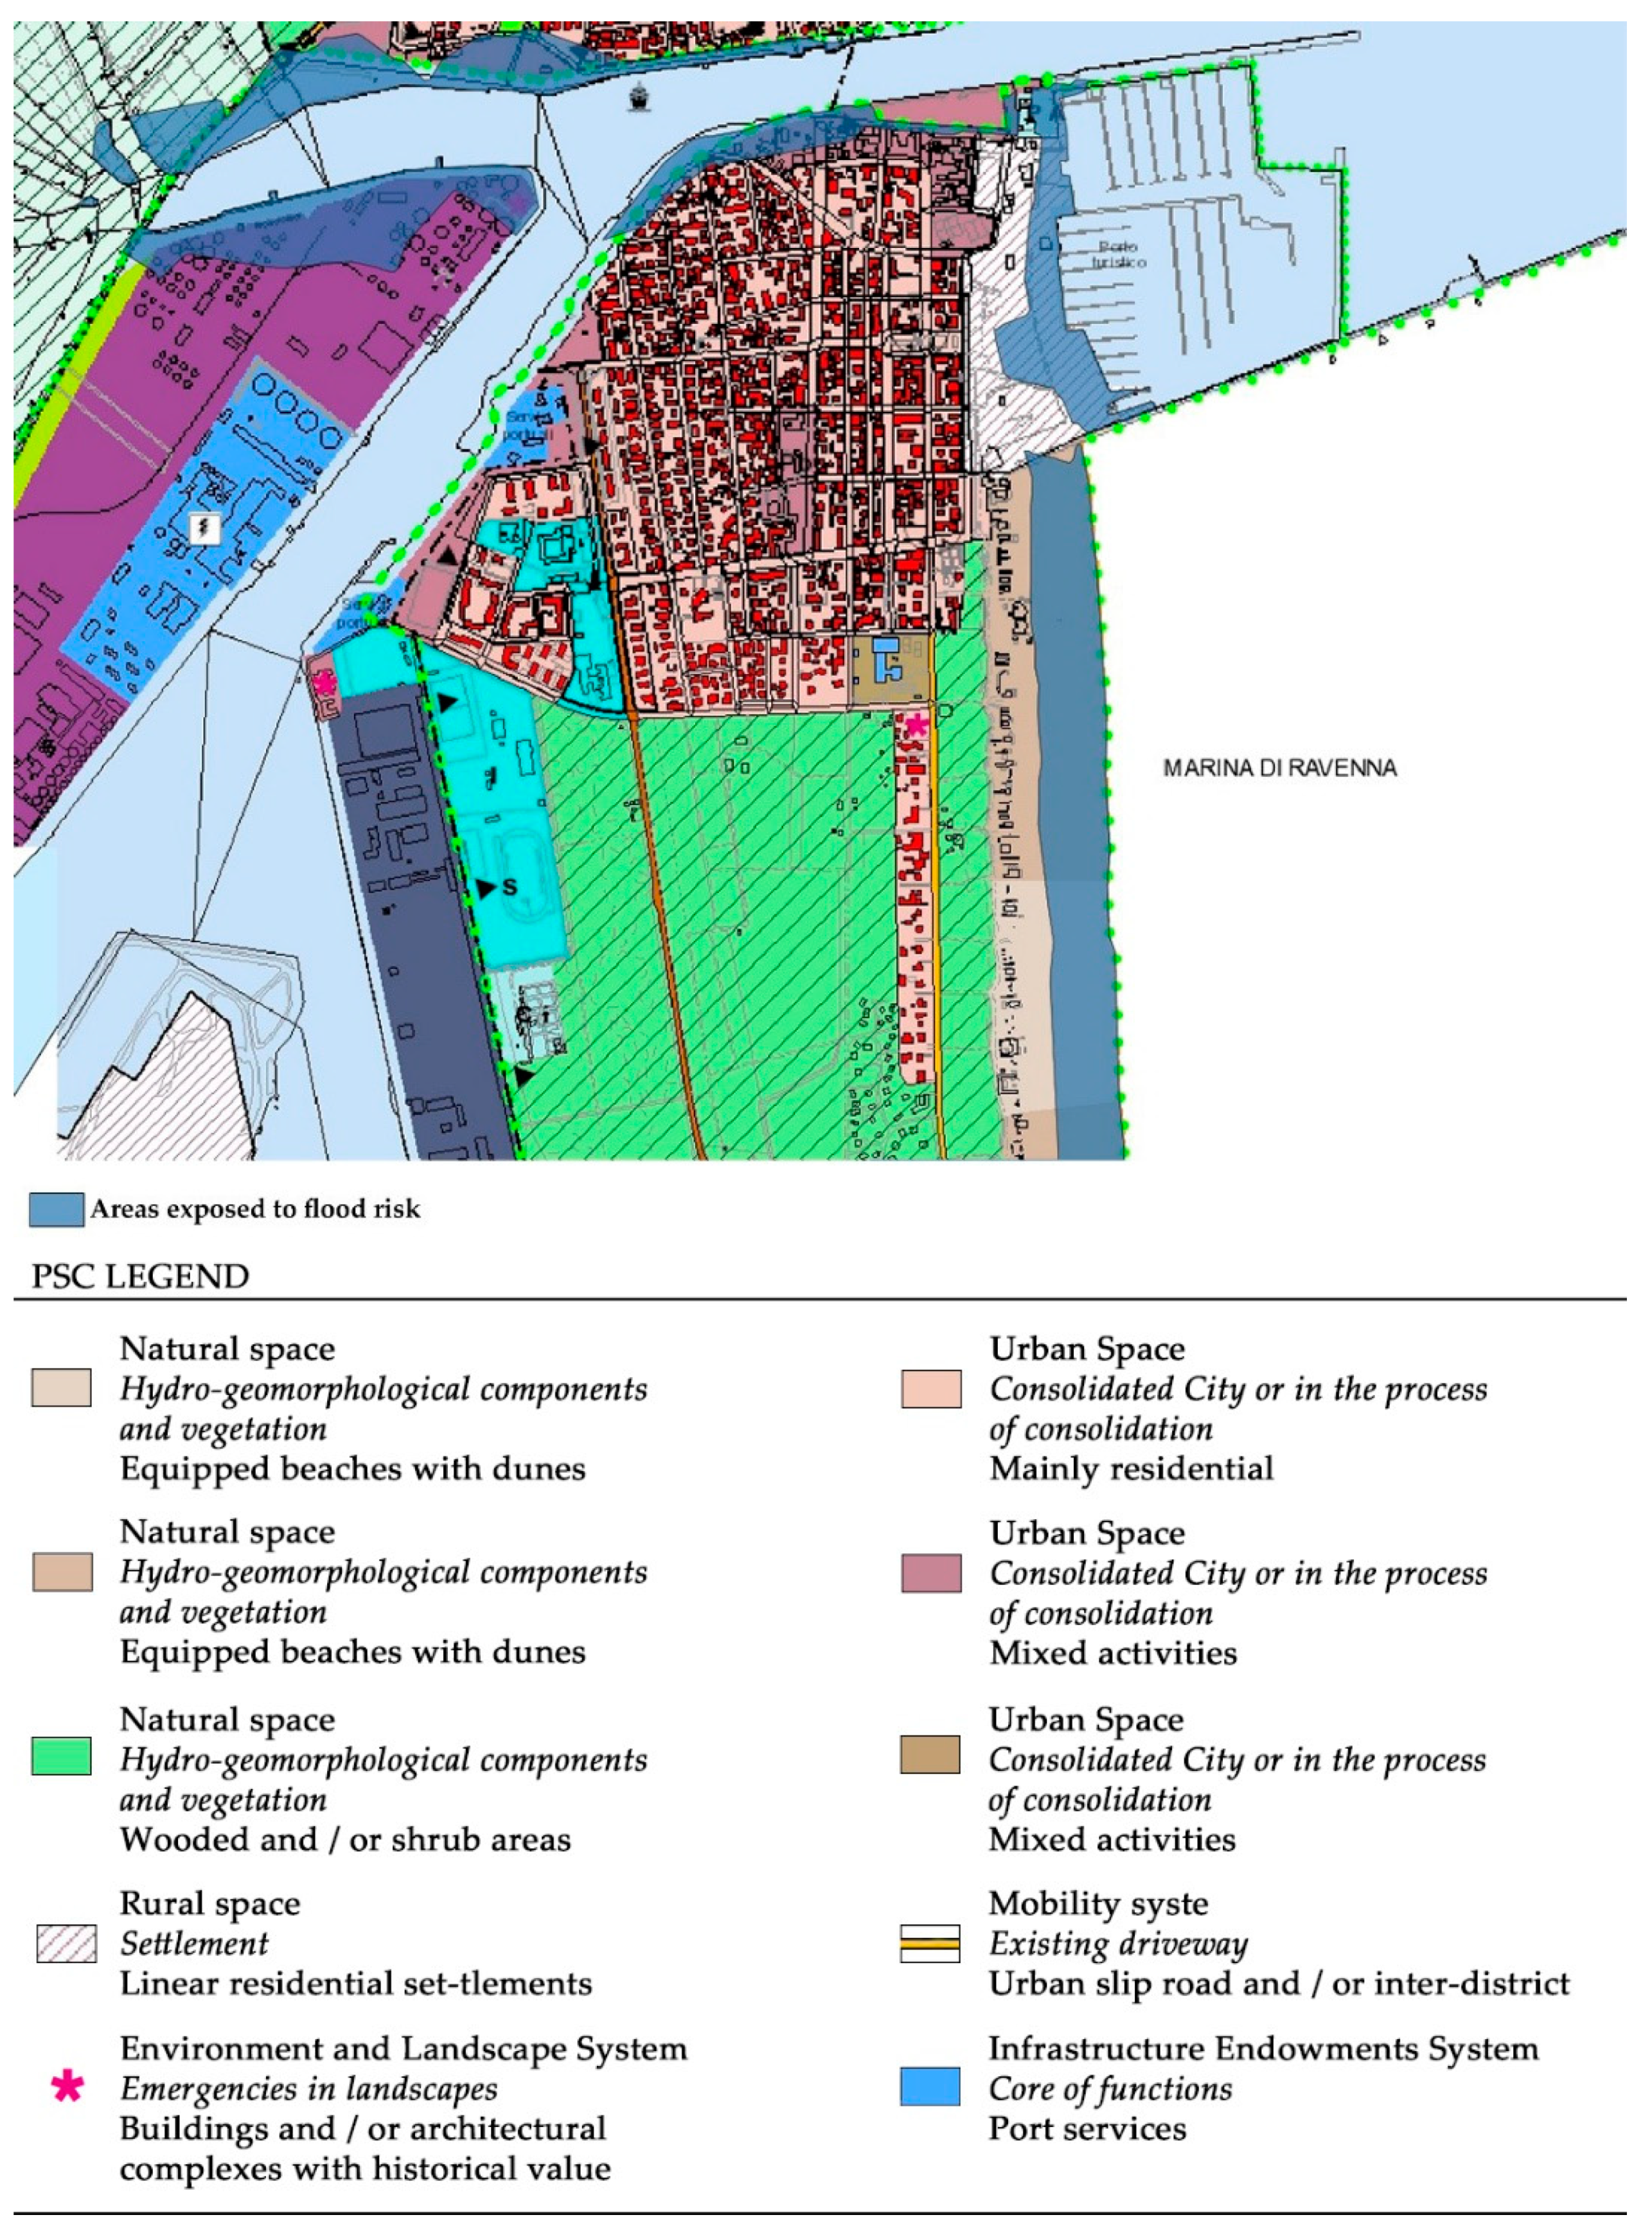
95], which allowed to further highlight the systemic components of the urban structure in the target areas (
Figure 2).
3. Results and Discussion
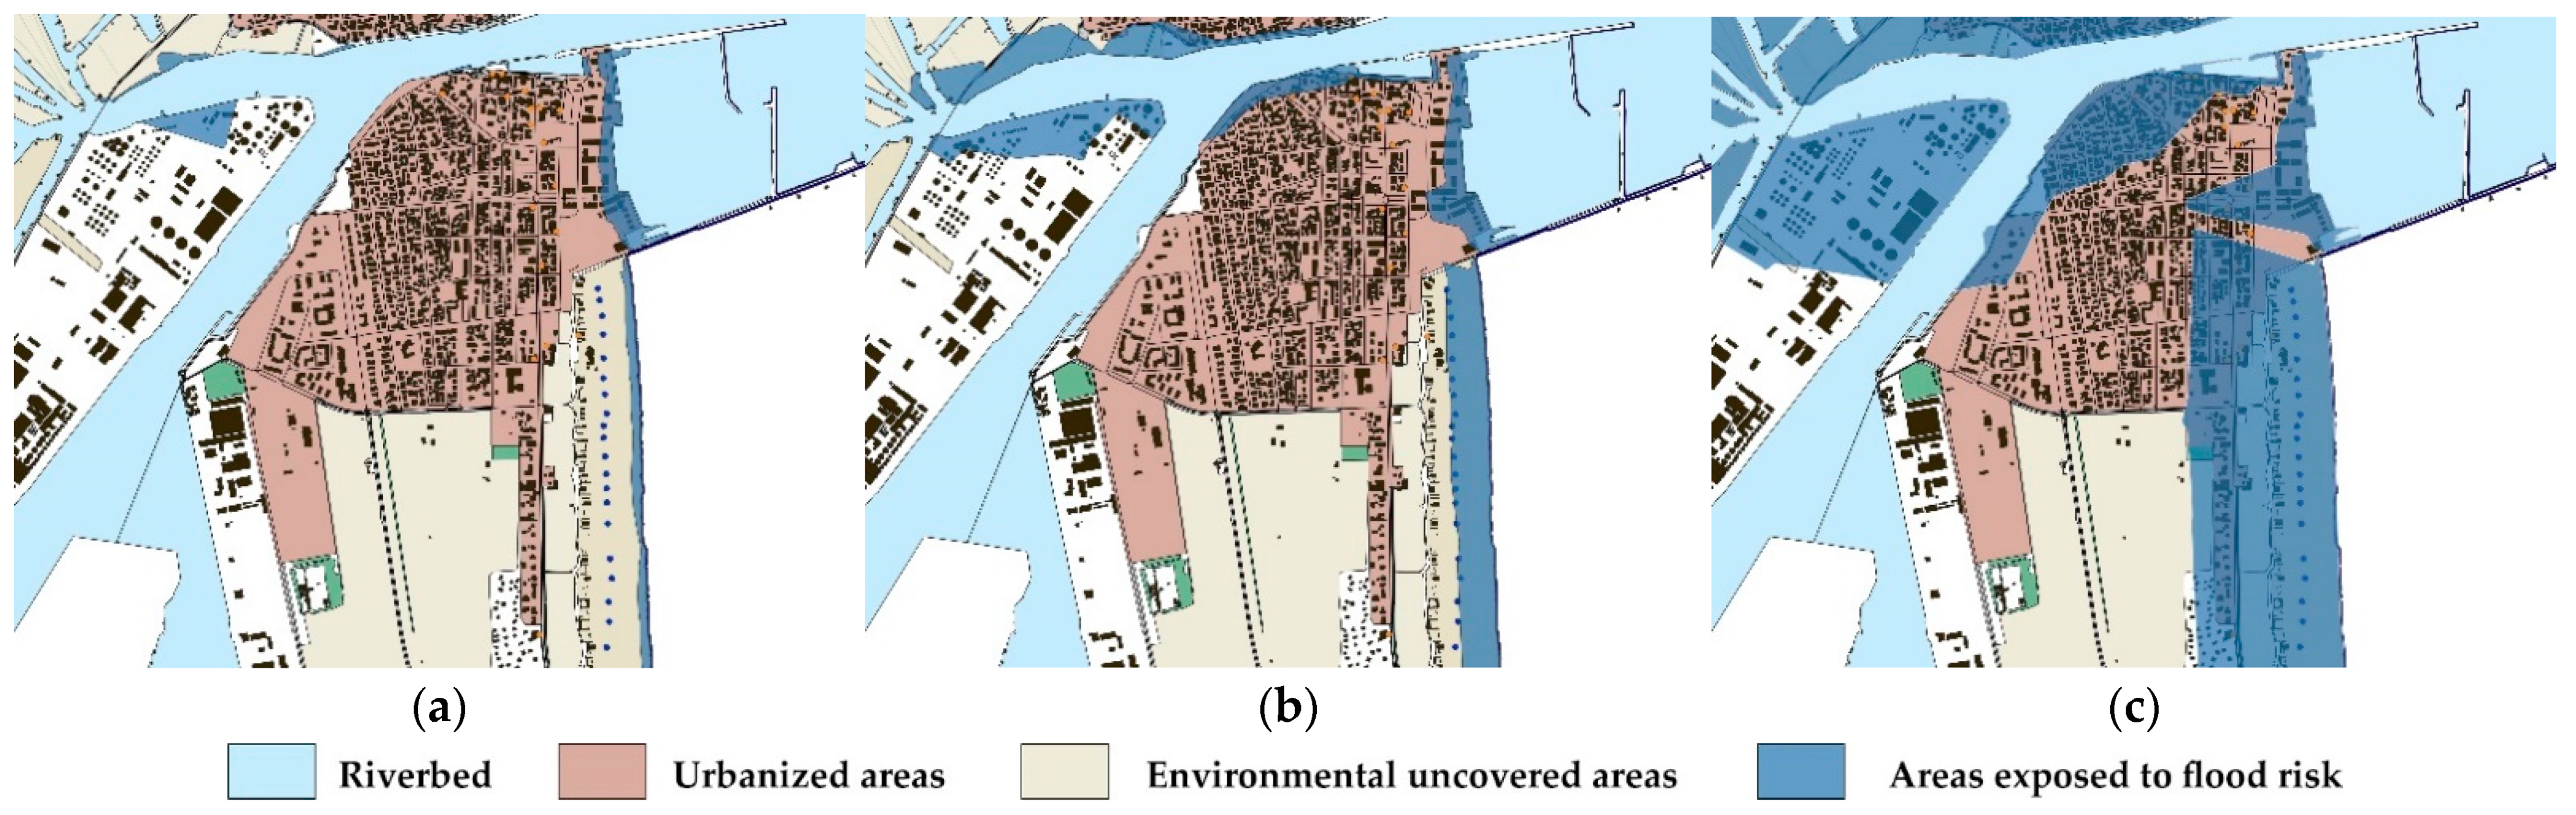
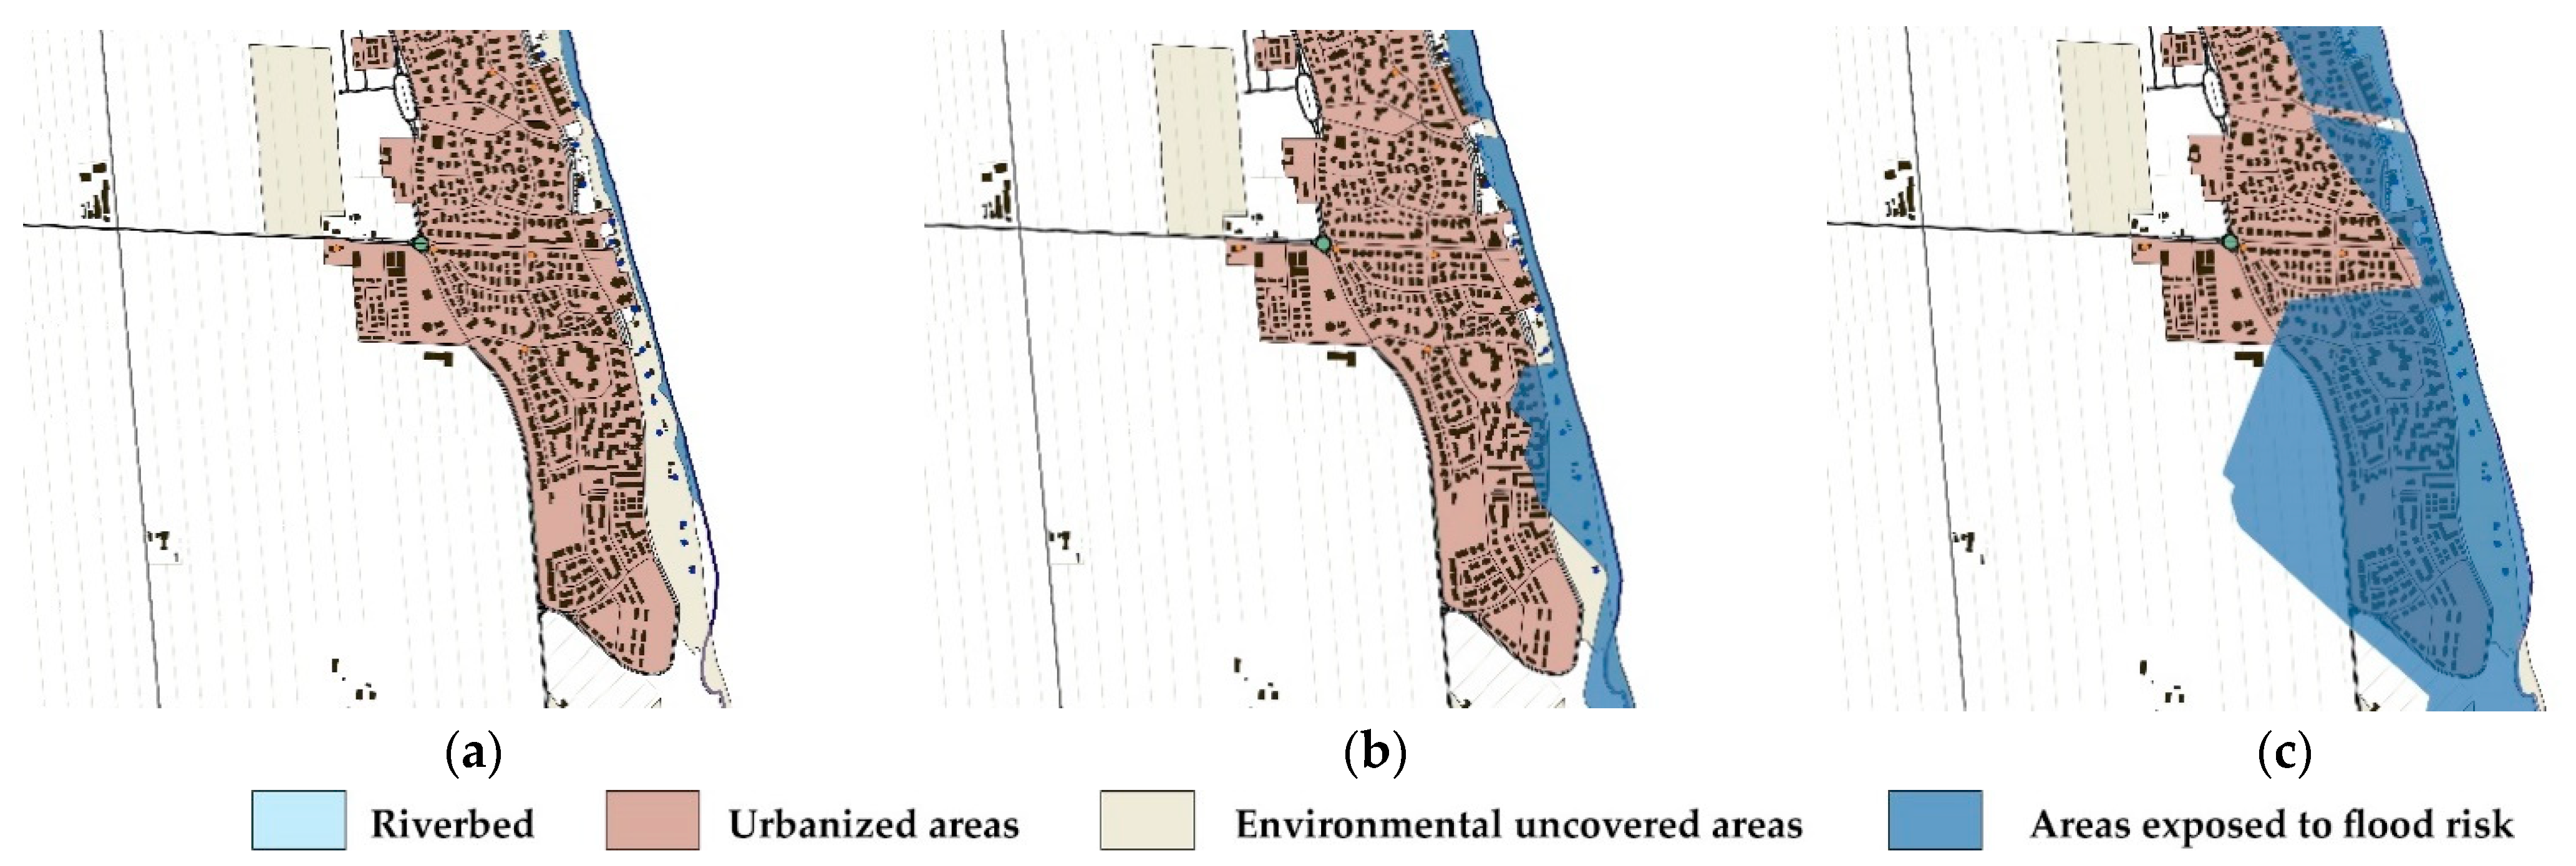
Figure 3 and
Figure 4 show the resulting maps for the target areas Marina di Ravenna and Lido Adriano, respectively, as arising from the superposition of the expected hazard and the ground elevation above current mean sea level (i.e., exposure). At this stage, the information on areas at risk that can be inferred is inherently binary, that is: (a) the area is expected to be submerged under the selected scenario, or (b) it is expected not to.
The progressive involvement of the two main area types classified in the Ravenna OpenData portal (i.e., Urbanized Areas and Uncovered Areas) can be observed, which is quantified in
Table 3 for Marina di Ravenna only. The two different coverage characteristics allow a first evaluation of vulnerability on a qualitative basis. The percentage of flooded area increases from 4% by 2030 to 8% in 2050, up to 25% in 2100, for the first coverage type. For the second, it grows from 4% in 2030, to 27% in 2050 up to 43% in 2100.
From now on, detailed analysis will focus on Marina di Ravenna only, due to its strategic position and for its crucial role as a tourist port.
By overlapping the polygons obtained with the GEOTIFF from “Elaborate 3—Spaces and Systems of the PSC” (Graph 3—Spaces and Systems of the Municipal Structural Plan), it has been possible to further detail the nature of the urban elements at risk and verify the ability of current urban planning instruments to consistently account for future risks, so as to more effectively support public administrative bodies in implementing cost-effective mitigation/adaptation actions, and in prioritizing intervention according to an objective science-based ranking. For the three time horizons considered,
Table 4,
Table 5 and
Table 6 report a first classification of urban areas in Marina di Ravenna, together with the correspondent size (mq) of each class, and the absolute and relative (%) extent of the portion that is projected to be submerged. With reference to the bodies responsible for territorial governance, this evaluation phase is aimed at a possible updating of the planning tool forecasts, and is preliminary to the subsequent identification of priority areas of intervention, and to the definition of mitigation and adaptation actions.
In
Table 7, the affected urban elements were further classified according to three standard systems for territorial analysis: the
Environment and Landscape System, the
Settlement and Urban Morphology System, and the
Infrastructure Endowment and Public Services System. By being more general than the local classification presented in the preceding tables, which depends on the specific nomenclature adopted by each municipality, such aggregation is expected to allow the portability of our approach to different contexts, and help better identify common issues and priorities that should guide national planning choices. The consistent characterization of the whole national territory is indeed dictated by the necessity to concentrate resources on the macro areas that exhibit higher risk scores after objective intercomparison.
For the Ravenna pilot, the components that the local PSC classifies as Natural Area, Rural Area and Environment and Landscape System (”Spazio naturalistico”, “Spazio Rurale”, “Sistema Paesaggistico Ambientale”) were all aggregated and named Environment and Landscape System; the components that fall within the classification of Urban Areas (“Spazio Urbano”) were all aggregated as Settlement and Urban Morphology System; the components that fall within the classification of Mobility Systems and Infrastructure Endowments System (“Sistema della mobilità” e “Sistema delle Dotazioni Territoriali”) were all aggregated as Infrastructure Endowment and Public Services.
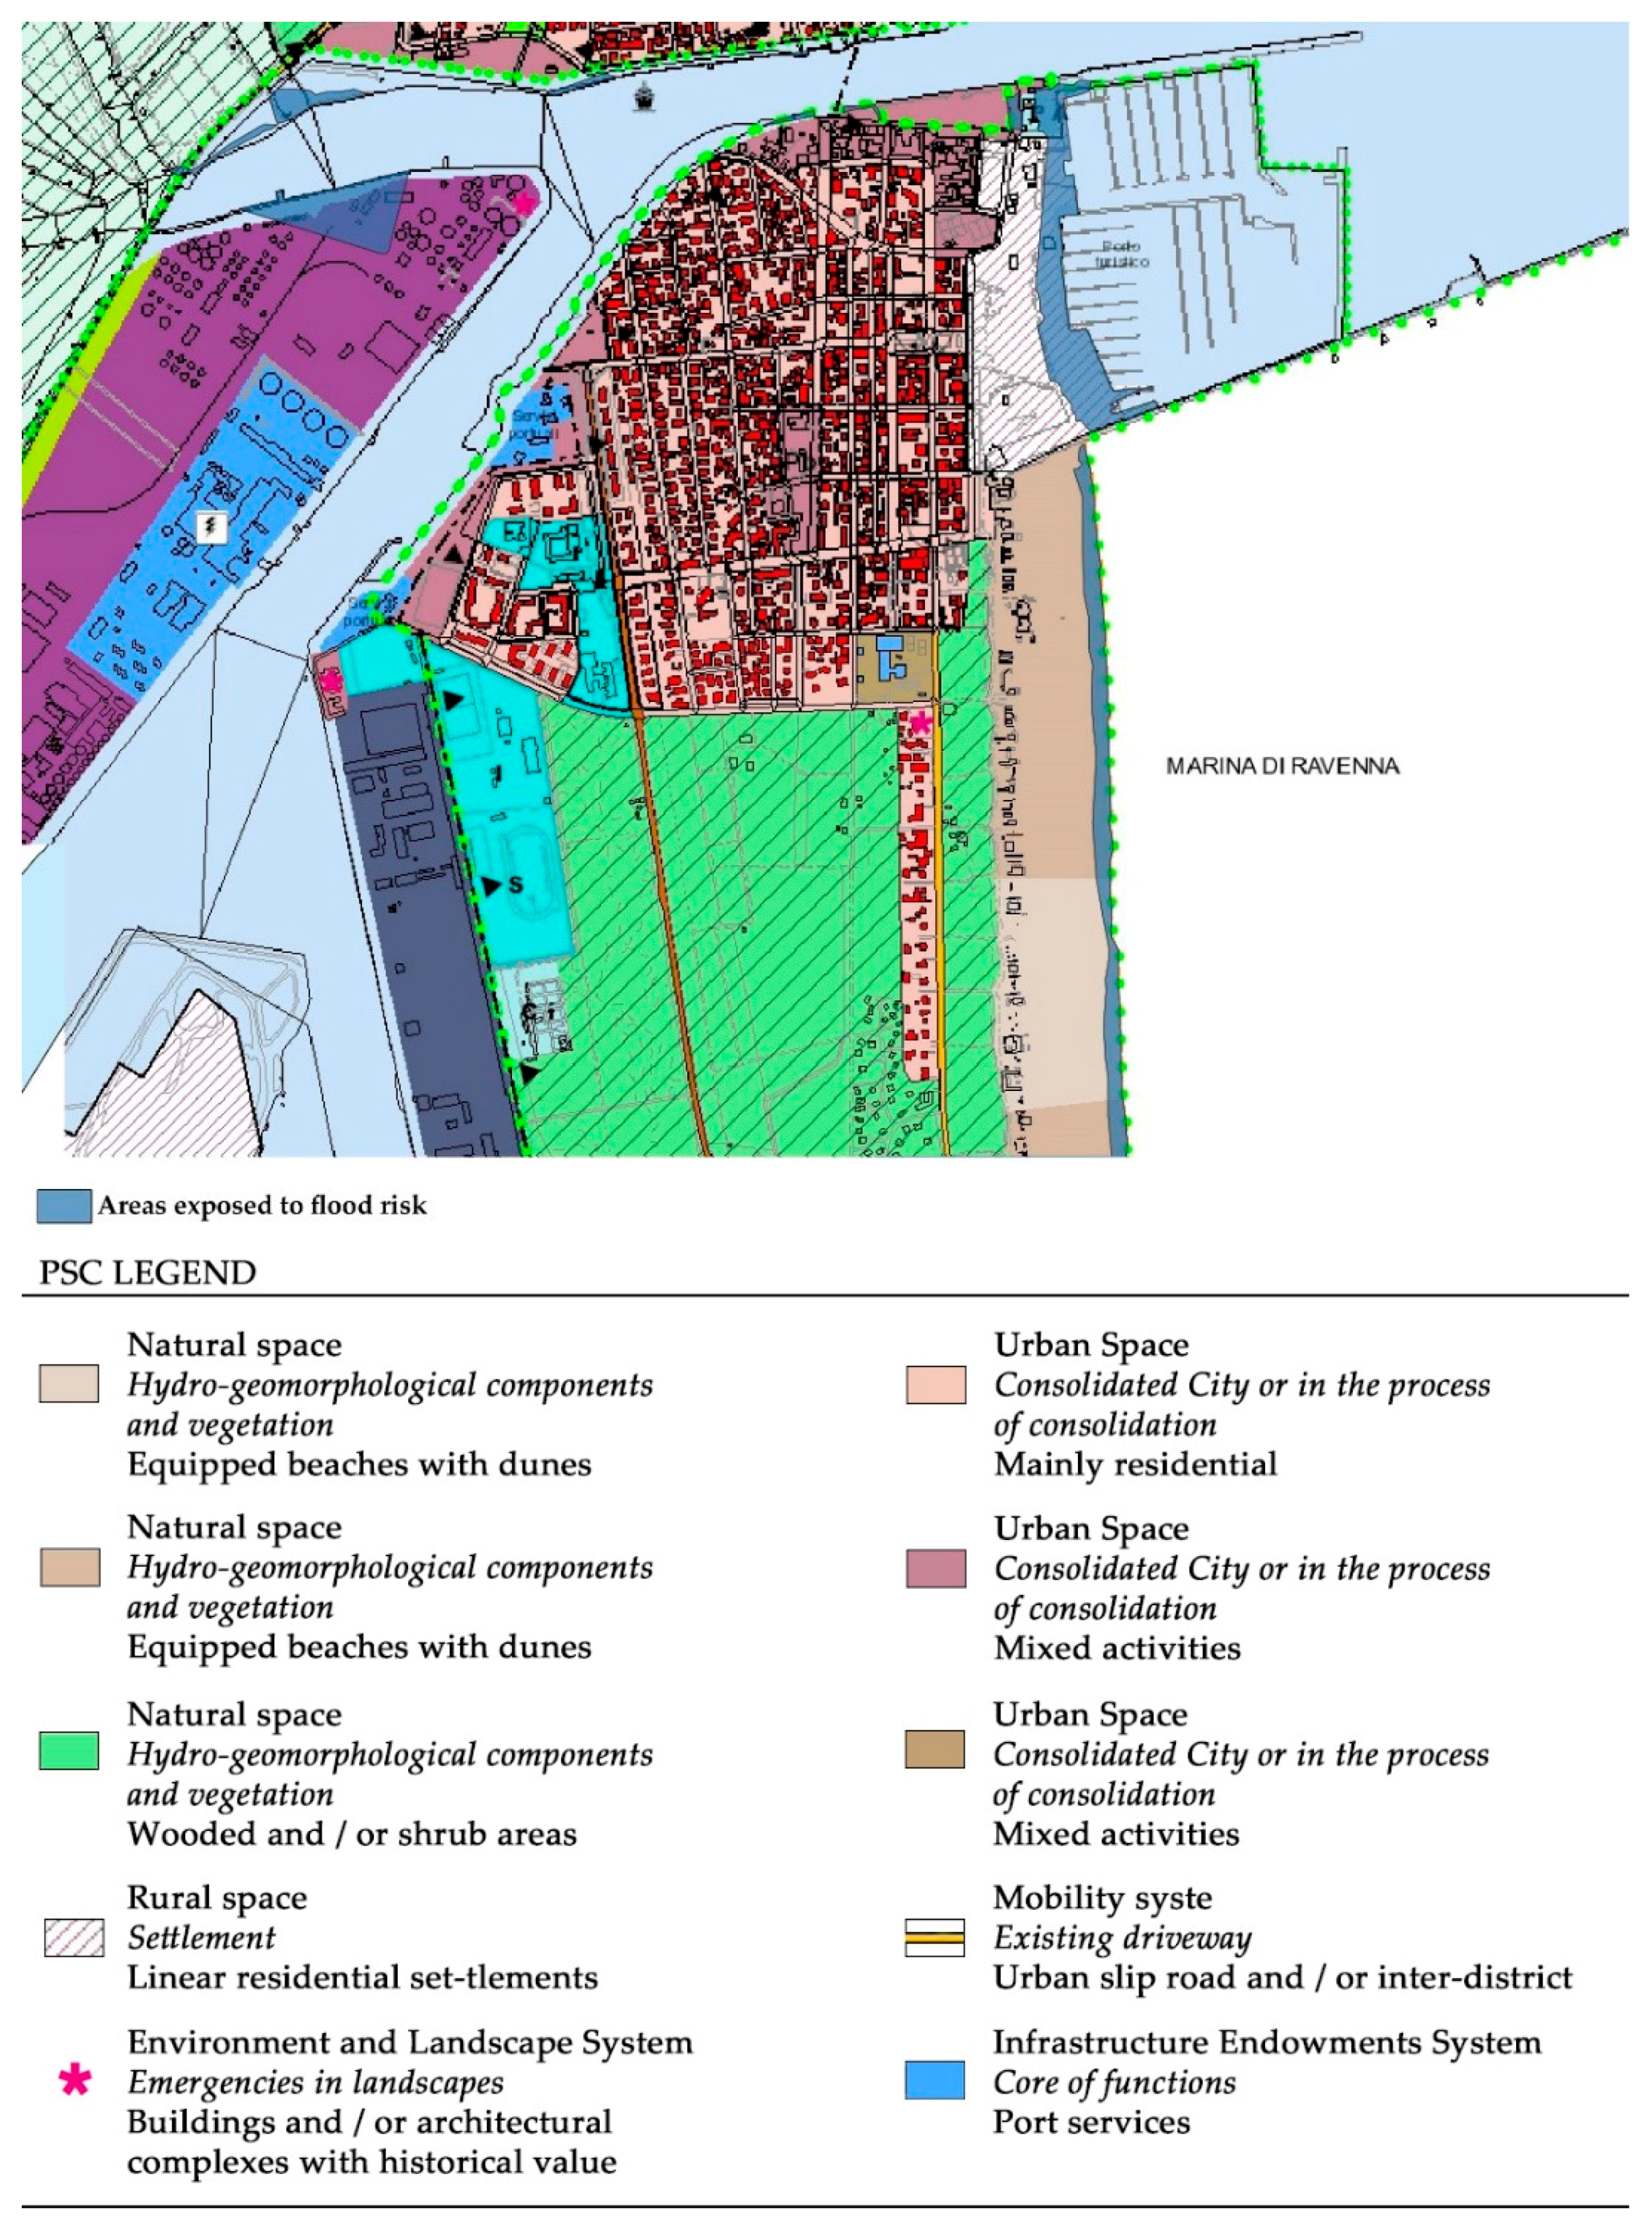
With reference to the 2030 scenario (expected SLR = 2 cm), the aggregated results in
Table 7 show that all the areas exposed to flood risk fall within the
Environmental and Landscape System, albeit only for a small percentage of the total (7%), mainly represented by the beach belt and random settlements in agricultural areas.
As regards to the 2050 scenario (expected SLR = 17 cm), the areas exposed to flood risk fall within the Environmental and Landscape System and the Settlement and Urban Morphology System, with a percentage of the total area of 24% and 3%, respectively. The first also includes wooded areas and some historical and architectural heritage specimens, while the second covers part of the buildings of the consolidated city intended for residence and mixed activities.
Finally, with reference to the 2100 scenario (expected SLR = 68 cm), the areas at risk fall within all three territorial systems (Environmental and Landscape System, Settlement and Urban Morphology System, Infrastructure Endowments and Public Services System), with percentages of each total area of 47%, 35% and 100%. For this scenario, settlements for tourist activities, road infrastructures and part of the port services are also affected, and potential economic losses are expected to significantly increase.
As urban planning regulations mainly govern the Environmental and Landscape System and the Settlement and Urban Morphology System in the short to medium term, this evaluation method can be useful for a first assessment of necessary interventions for the 2030 and 2050 time horizons, helping prioritize site-specific strategies, from the softest mitigation/adaptation measures to the hardest alternative of permanently relocating property, infrastructures and services away from the coast.
4. Conclusions
This work aims to propose a method for locating, quantifying and characterizing coastal urban areas at risk under the projected sea level rise, that is sufficiently general to be exportable to different contexts, and yet informative and useful for the subsequent steps of the urban planning process. When combined with more detailed information on current land use and on the development strategies envisaged by Local Urban Plans, our preliminary analysis allows to smoothly progress to the planning phase on the score of a fact-based classification and priority ranking, and then to further proceed to design climate change adaptation measures that are best suited for each class of urban elements.
An innovative feature of this work is indeed the choice of the municipality scale as the field of application for climate modeling results, as this scale is the only that can effectively describe the overall physical consistency of the elements of the urban structure, and account for their homogeneity or inhomogeneity. Although the described exercise only constitutes a very preliminary step towards a thorough assessment of SLR-induced risks in the urban environment, the explicit treatment of climate change as a main driver of local adverse impacts itself constitutes a step forward in the evolution of urban planning. For zero-order applications, the results can be linearly combined with complementary assessments of other hazards of natural origin, to yield multi-hazard integrated maps and a wider knowledge base for municipal management.
In the selected test case, the Municipality of Ravenna, the resulting Flood Risk Maps indeed represent an objective innovation with respect to the current PSC cognitive framework, by providing information on a potential risk that has so far been overlooked, and by allowing the construction of state-of-the-art, constantly updatable maps that complement those already available, which only account for coastal erosion and subsidence. A first obvious step is to overlap the obtained Flood Risk Maps and the Ravenna PSC.
Future developments include the identification of different intervention categories as a function of the urban components at risk, articulated according to three macro strategies, i.e., defense, adaptation and relocation, with the ambition to set up a reference methodological framework for the implementation of the regulative apparatus of the Local Plan (Norme Tecniche di Attuazione). Such macro strategies are conceptualized through an inductive methodological path, starting from the examination of the best practices in urban design and planning implemented in Italy and Europe, with the aim to merge the top-down approach followed in this work with bottom-up perspectives in a hybrid, highly flexible and collaborative management framework.
In the Ravenna case, as in several other instances over the Italian territory, the ever-increasing awareness that new strategies must be designed, and innovative actions implemented, to tackle climate change impacts at the regional and local scale, has often been neutralized by the inertia of administrative bodies in translating such indication into operative urban planning instruments. This is also due to a chronic lack of shared public data in support to territorial management, that from now on must also account for the newly recognized threats in the traditional risk assessment frameworks. It is therefore highly advisable that public authorities supported the construction of comprehensive and exhaustive databases for future risk assessment, so as to release and constantly update as many informative layers as possible, also accounting for more complex dynamic indicators of exposure and vulnerability, as well as for a sizable ensemble of alternative climate and impact projections. The latter, in particular, is essential for an accurate quantification of hazard uncertainty, while the former are crucial for the constant verification of the implemented measures and for robust and dynamic risk assessment. It has in fact been observed that improved climate data often produce wider rather than smaller ranges of uncertainty in their predictions, while local impacts appear to depend more on the sensitivity and relative resilience of a given community than on the magnitude of environmental change. For this reason, a key catalyzer of future urban resilience will definitely be the ability of city managers, economists, sociologists, climatologists and urban planners to multiplicate their mutually re-enforcing efforts in creating a common ground for participative joint programs and projects. The need to blend quantitative and qualitative information, and to root risk assessment in the robust appraisal of complex phenomena, compels experts to overcome the limits of technical information, and to freely build and exploit a wider knowledge platform based on both inter-disciplinary scientific literature and experience, in order to achieve a balanced picture of the challenges posed to urban planning. This effort is not guaranteed to always provide absolute risk quantification, yet it significantly contributes to research advancement by accelerating knowledge exchange, setting the basis for improved future evaluations.
Supplementary Materials
The following are available online at
https://0-www-mdpi-com.brum.beds.ac.uk/2071-1050/13/3/1565/s1, Figure S1: Ravenna PSC (Piano Strutturale Comunale) annex B.3.1 “Carta dei rischi di origine naturale” (Risks Maps of Natural Origin): (
a) B.3.1.a “Carta dei rischi di origine naturale: subsidenza” (Risks Maps of Natural Origin: subsidence); (
b) “Carta dei rischi di origine naturale: erosione” (Risks Maps of Natural Origin: erosion). Source:
Ravenna Urban Planning.Author Contributions
Conceptualization, C.M.; methodology, C.M., M.M., G.P. and G.S.; software, M.M.; validation, M.M., G.P. and G.S.; formal analysis, C.M., M.M., G.P. and G.S; investigation, C.M. and M.M.; resources, M.M., G.P. and G.S.; data curation, M.M., G.P. and G.S.; writing—original draft preparation, C.M., M.M., G.P. and G.S.; writing—review and editing, C.M., M.M. and G.P.; supervision, C.M.; project administration, C.M.; funding acquisition, C.M. All authors have read and agreed to the published version of the manuscript.
Funding
The APC was funded by the PDTA Department of Sapienza—University of Rome, research 2020 “Strategie di rigenerazione urbana per territori climate proof. Strumenti e metodi per la valutazione della vulnerabilità e per l’individuazione di tattiche di resilienza degli ambiti urbani costieri soggetti a sea level rise”, under the scientific coordination of Prof. Carmela Mariano. The ENEA contribution was supported by the SOCLIMPACT project of European Union’s Horizon 2020 research and innovation programme under grant agreement number 776661. The full name of the project is “DownScaling CLImate ImPACTs and decarbonisation pathways in EU islands, and enhancing socioeconomic and non-market evaluation of Climate Change for Europe, for 2050 and Beyond”.
Institutional Review Board Statement
Not applicable.
Informed Consent Statement
Informed consent was obtained from all subjects involved in the study.
Data Availability Statement
Acknowledgments
This contribution returns the results of a first phase of experimentation conducted by the PDTA Department of Sapienza—University of Rome, in collaboration with the Climate Modeling and Impact Laboratory of ENEA—Casaccia Research Center, as part of the University research “Strategie di rigenerazione urbana per territori climate proof. Strumenti e metodi per la valutazione della vulnerabilità e per l’individuazione di tattiche di resilienza degli ambiti urbani costieri soggetti a sea level rise”, under the scientific coordination of Carmela Mariano. The paper is the results of a shared reflection by the authors. However,
Section 1 is to be attributed to Carmela Mariano;
Section 2.1 and
Section 2.2 are to be attributed to Giovanna Pisacane and Gianmaria Sannino;
Section 2.3 is to be attributed to Carmela Mariano and Marsia Marino;
Section 2.4 is to be attributed to Marsia Marino;
Section 3 is to be attributed to Carmela Mariano and Marsia Marino and
Section 4 is to be attributed to Carmela Mariano, Giovanna Pisacane e Gianmaria Sannino.
Conflicts of Interest
The authors declare no conflict of interest.
References
- Beck, U. La società del rischio. In Verso una Seconda Modernità; Carocci: Rome, Italy, 2013; ISBN 9788843068142. [Google Scholar]
- Graham, S. (Ed.) Disrupted Cities. When Infrastructure Fails; Routledge: New York, NY, USA, 2009; ISBN 13978-0415991797. [Google Scholar]
- Musco, F.; Magni, F. UHI nel contesto ampio del CC: Pianificazione, città e clima. In Pianificazione Urbanistica e Clima Urbano; Musco, F., Fregolent, L., Eds.; Manuale per la riduzione dei fenomeni di isola di calore urbano; Il Poligrafo casa Editrice: Padova, Italy, 2014; ISBN 978-88-7115-867-9. [Google Scholar]
- Magni, F. Climate proof planning. In L’adattamento in Italia tra Sperimentazioni e Innovazioni; Franco Angeli Editore: Rome, Italy, 2019; ISBN 8891789577. [Google Scholar]
- United Nation. The 2030 Agenda for Sustainable Development. Available online: https://sdgs.un.org/2030agenda (accessed on 3 June 2020).
- IPCC. Summary for Policymakers. In Climate Change 2013: The Physical Science Basis; Contribution of Working Group II to the Fifth Assessment Report of the Intergovernmental Panel on Climate Change; Cambridge University Press: Cambridge, UK; New York, NY, USA, 2014; Available online: https://www.ipcc.ch/site/assets/uploads/2018/02/WG1AR5_all_final.pdf (accessed on 3 June 2020).
- UNISDR. Annual Report 2012. Available online: https://www.undrr.org/publication/unisdr-annual-report-2012 (accessed on 5 June 2020).
- UNFCCC. United Nations Framework Convention on Climate Change. Available online: https://unfccc.int/resource/docs/convkp/conveng.pdf (accessed on 5 June 2020).
- Ricci, L. Governare la Città Contemporanea. Riforme e strumenti per la rigenerazione urbana. In Un Futuro Affidabile per la Città; Talia, M., Ed.; Apertura al cambiamento e rischio accettabile nel governo del territorio; Planum Publisher: Roma-Milano, Italy, 2017; ISBN 9788899237097. [Google Scholar]
- Musco, F. Cambiamenti Climatici, Politiche di Adattamento e Mitigazione: Una Prospettiva Urbana. Arch. Studi Urbani E Reg. 2008, 93, 5–38. [Google Scholar]
- Secchi, B. La nuova questione urbana: Ambiente, mobilità e disuguaglianze sociali. Crios 2011, 1, 89–99. [Google Scholar] [CrossRef]
- Ricci, L. Progettare per insegnare a progettare. In Urbanistica Dossier n. 7: Sperimentare il Progetto. Insegnamento e Ricerca Scientifica Nelle Scuole di Architettura; Ricci, L., Ed.; INU Edizioni: Rome, Italy, 2014; ISBN 978-88-7603-107-6. [Google Scholar]
- Musco, F.; Zanchini, E. Le Città Cambiano il Clima; Corila: Venice, Italy, 2013; ISBN 9788889405253. [Google Scholar]
- Mariano, C.; Marino, M. Water Landscapes: From risk management to an urban regeneration strategy. Upl. J. Urban Plan. Landsc. Environ. Des. 2018, 3, 55–74. [Google Scholar] [CrossRef]
- Mariano, C.; Marino, M. Gli effetti del climate-change come opportunità di rigenerazione ecologica dei territori costieri. Urbanistica Informazioni, special Issue Inu study day Interruptions, Intersections, Sharing and Overlappings. New Perspect. Territ. 2018, 278, 24–27. [Google Scholar]
- Međugorac, I.; Pasarić, M.; Güttler, I. Will the wind associated with the Adriatic storm surges change in future climate? Theor. Appl. Clim. 2021, 143, 1–18. [Google Scholar] [CrossRef]
- Lionello, P.; Conte, D.; Marzo, L.; Scarascia, L. The contrasting effect of increasing mean sea level and decreasing storminess on the maximum water level during storms along the coast of the Mediterranean Sea in the mid 21st century. Glob. Planet. Chang. 2017, 151, 80–91. [Google Scholar] [CrossRef]
- Perini, L.; Calabrese, L.; Salerno, G.; Ciavola, P.; Armaroli, C. Evaluation of coastal vulnerability to flooding: Comparison of two different methodologies adopted by the Emilia-Romagna region (Italy). Nat. Hazards Earth Syst. Sci. 2016, 16, 181–194. [Google Scholar] [CrossRef] [Green Version]
- Rizzi, J.; Torresan, S.; Zabeo, A.; Semenzin, E.; Critto, A.; Tosoni, A.; Tomasin, A.; Marcomini, A. Assessing storm surge risk under future sea-level rise scenarios: A case study in the North Adriatic coast. J. Coast. Conserv. 2017, 21, 453–471. [Google Scholar] [CrossRef]
- Maslin, M.; Austin, P. Climate models at their limit? Nature 2012, 486, 183–184. [Google Scholar] [CrossRef]
- Aerts, J.C.J.H.; Botzen, W.J.; Clarke, K.C.; Cutter, S.L.; Hall, J.W.; Merz, B.; Michel-Kerjan, E.; Mysiak, J.; Surminski, S.; Kunreuther, H. Integrating human behaviour dynamics into flood disaster risk assessment. Nat. Clim. Chang. 2018, 8, 193–199. [Google Scholar] [CrossRef] [Green Version]
- Antonioli, F.; Anzidei, M.; Amorosi, A.; Presti, V.L.; Mastronuzzi, G.; Deiana, G.; De Falco, G.; Fontana, A.; Fontolan, G.; Lisco, S.; et al. Sea-level rise and potential drowning of the Italian coastal plains. Flooding risk scenarios for 2100. Quat. Sci. Rev. 2017, 158, 29–43. [Google Scholar] [CrossRef] [Green Version]
- Mariano, C.; Marino, M. Defense, adaptation and relocation. Three strategies for urban planning of coastal areas at risk of flooding, TeMA. J. Land Use Mobil. Environ. 2019, 704–713. [Google Scholar] [CrossRef]
- Kopp, R.E.; Gilmore, E.A.; Little, C.M.; Lorenzo Trueba, J.; Ramenzoni, V.C.; Sweet, W.V. Usable Science for Managing the Risks of Sea-Level Rise. Earth’s Future 2019, 7, 1235–1269. [Google Scholar] [CrossRef] [PubMed] [Green Version]
- Cash, D.W.; Clark, W.C.; Alcock, F.; Dickson, N.M.; Eckley, N.; Guston, D.H.; Mitchell, R.B. Knowledge systems for sustainable development. Proc. Natl. Acad. Sci. USA 2003, 100, 8086–8091. [Google Scholar] [CrossRef] [PubMed] [Green Version]
- Sarkki, S.; Tinch, R.; Niemela, J.; Heink, U.; Waylen, K.; Timaeus, J.; van den Hove, S. Adding ‘iterativity’ to the credibility, relevance, legitimacy: A novel scheme to highlight dynamic aspects of science-policy interfaces. Environ. Sci. Policy 2015, 54, 505–512. [Google Scholar] [CrossRef]
- Athanasiou, P.; van Dongeren, A.; Giardino, A.; Vousdoukas, M.; Gaytan-Aguilar, S.; Ranasinghe, R. Global distribution of nearshore slopes with implications for coastal retreat. Earth Syst. Sci. Data 2019, 11, 1515–1529. [Google Scholar] [CrossRef] [Green Version]
- Hinkel, J.; Klein, R.J.T. Integrating knowledge to assess coastal vulnerability to sea-level rise: The development of the DIVA tool. Glob. Environ. Chang. Hum. Policy Dimens. 2009, 19, 384–395. [Google Scholar] [CrossRef]
- Anderson, T.R.; Fletcher, C.H.; Barbee, M.M.; Romine, B.M.; Lemmo, S.; Delevaux, J.M.S. Modeling multiple sea level rise stresses reveals up to twice the land at risk compared to strictly passive flooding methods. Sci. Rep. 2018, 8, 14484. [Google Scholar] [CrossRef] [Green Version]
- Wolff, C.; Vafeidis, A.T.; Lincke, D.; Marasmi, C.; Hinkel, J. Effects of Scale and Input Data on Assessing the Future Impacts of Coastal Flooding: An Application of DIVA for the Emilia-Romagna Coast. Front. Mar. Sci. 2016, 3. [Google Scholar] [CrossRef] [Green Version]
- Thiéblemont, R.; Le Cozannet, G.; Toimil, A.; Meyssignac, B.; Losada, I.J. Likely and High-End Impacts of Regional Sea-Level Rise on the Shoreline Change of European Sandy Coasts Under a High Greenhouse Gas Emissions Scenario. Water 2019, 11, 2607. [Google Scholar] [CrossRef] [Green Version]
- Vousdoukas, M.I.; Mentaschi, L.; Voukouvalas, E.; Verlaan, M.; Feyen, L. Extreme sea levels on the rise along Europe’s coasts. Earth’s Future 2017, 5. [Google Scholar] [CrossRef]
- Masselink, G.B.; Castelle, T.; Scott, G.; Dodet, S.; Suanez, D.J.; Floc’h, F. Extreme wave activity during 2013/2014 winter and morphological impacts along the Atlantic coast of Europe, Geophys. Res. Lett. 2016, 43, 2135–2143. [Google Scholar] [CrossRef]
- Viavattene, C.; Jiménez, J.A.; Ferreira, O.; Priest, S.; Owen, D.; McCall, R. Selecting coastal hotspots to storm impacts at the regional scale: A Coastal Risk Assessment Framework. Coast. Eng. 2018, 134, 33–47. [Google Scholar] [CrossRef]
- Torresan, S.; Furlan, E.; Critto, A.; Michetti, M.; Marcomini, A. Egypt’s Coastal Vulnerability to Sea-Level Rise and Storm Surge: Present and Future Conditions. Integr. Environ. Assess. Manag. 2020, 16, 761–772. [Google Scholar] [CrossRef] [PubMed]
- Wolff, C.; Vafeidis, A.; Muis, S.; Lincke, D.; Satta, A.; Lionello, P.; Jimenez, J.A.; Conte, D.; Hinkel, J. Mediterranean coastal database (MCD). figshare. Collection 2018. [Google Scholar] [CrossRef]
- Qu, K.; Yao, W.; Tang, H.S.; Agrawal, A.; Shields, G.; Chien, S.I.; Gurung, S.; Imam, Y.; Chiodi, I. Extreme storm surges and waves and vulnerability of coastal bridges in New York City metropolitan region: An assessment based on Hurricane Sandy. Nat. Hazards 2021. [Google Scholar] [CrossRef]
- Apollonio, C.; Bruno, M.F.; Iemmolo, G.; Molfetta, M.G.; Pellicani, R. Flood Risk Evaluation in Ungauged Coastal Areas: The Case Study of Ippocampo (Southern Italy). Water 2020, 12, 1466. [Google Scholar] [CrossRef]
- Kommune, V. Vejle’s Resilient Strategy 2013. Available online: https://www.vejle.dk/borger/mit-liv/ (accessed on 25 September 2020).
- Rotterdam. Climate. Initiative. Rotterdam Climate Change Adaptation Programme. Connecting Water with Opportunities. 2013. Available online: http://www.deltacityofthefuture.nl/cities/rotterdam/climate-change-adaptation (accessed on 23 September 2020).
- The City of New York. One NYC 2050. Building a Strong and Fair City. 2019. Available online: https://onenyc.cityofnewyork.us/about/ (accessed on 25 September 2020).
- Dittrich, R.; Wreford, A.; Moran, D. A survey of decision-making approaches for climate change adaptation: Are robust methods the way forward? Ecol. Econ. 2016, 122, 79–89. [Google Scholar] [CrossRef]
- Lempert, R.J. A new decision sciences for complex systems. Proc. Natl. Acad. Sci. USA 2002, 99, 7309–7313. [Google Scholar] [CrossRef] [Green Version]
- Lempert, R.J. Embedding (some) benefit-cost concepts into decision support processes with deep uncertainty. J. Benefit Cost Anal. 2014, 5, 487–514. [Google Scholar] [CrossRef]
- Gorddard, R.; Colloff, M.J.; Wise, R.M.; Ware, D.; Dunlop, M. Values, rules and knowledge: Adaptation as change in the decision context. Environ. Sci. Policy 2016, 57, 60–69. [Google Scholar] [CrossRef] [Green Version]
- Haasnoot, M.; Brown, S.; Scussolini, P.; Jimenez, J.; Vafeidis, A.T.; Nicholls, R. Generic adaptation pathways for coastal archetypes under uncertain sea-level rise. Environ. Res. Commun. 2019. [Google Scholar] [CrossRef]
- Haasnoot, M.; Kwakkel, J.H.; Walker, W.E.; ter Maat, J. Dynamic adaptive policy pathways: A method for crafting robust decisions for a deeply uncertain world. Glob. Environ. Chang. 2013, 23, 485–498. [Google Scholar] [CrossRef] [Green Version]
- Wise, R.M.; Fazey, I.; Stafford Smith, M.; Park, S.E.; Eakin, H.C.; Archer Van Garderen, E.R.M.; Campbell, B. Reconceptualising adaptation to climate change as part of pathways of change and response. Glob. Environ. Chang. 2014, 28, 325–336. [Google Scholar] [CrossRef] [Green Version]
- Lempert, R.J.; Groves, D.G.; Popper, S.W.; Bankes, S.C. A general, analytic method for generating robust strategies and narrative scenarios. Manag. Sci. 2006, 52, 514–528. [Google Scholar] [CrossRef]
- Lempert, R.J.; Collins, M.T. Managing the risk of uncertain threshold responses: Comparison of robust, optimum, and precautionary approaches. Risk Anal. 2007, 27, 1009–1026. [Google Scholar] [CrossRef]
- Dessai, S.; Bhave, A.; Birch, C.; Conway, D.; Garcia-Carreras, L.; Gosling, J.P.; Stainforth, D. Building narratives to characterize uncertainty in regional climate change through expert elicitation. Environ. Res. Lett. 2018, 13, 74005. [Google Scholar] [CrossRef]
- Ramm, T.D.; Watson, C.S.; White, C.J. Strategic adaptation pathway planning to manage sea-level rise and changing coastal flood risk. Environ. Sci. Policy 2018, 87, 92–101. [Google Scholar] [CrossRef] [Green Version]
- Talia, M. (Ed.) Le Nuove Comunità Urbane e il Valore Strategico Della Conoscenza Atti Della Conferenza Internazionale Urbanpromo XVII Edizione Progetti per il Paese; Planum Publisher: Rome-Milan, Italy, 2020; ISBN 9788899237264. [Google Scholar]
- Turner, R.K. Integrating natural and socio-economic science in coastal management. J. Mar. Syst. 2000, 25, 447–460. [Google Scholar] [CrossRef]
- Tran, K.C. Public perception of development issues: Public awareness can contribute to sus-tainable development of a small island. Ocean Coast. Manag. 2006, 49, 367–383. [Google Scholar] [CrossRef]
- Obraczka, M.; Beyeler, M.; Magrini, A.; Legey, L.F. Analysis of Coastal Environmental Management Practices in Subregions of California and Brazil. J. Coast. Res. 2017, 33, 1315–1332. [Google Scholar] [CrossRef] [Green Version]
- Città Metropolitana di Genova. Genova Piano Strategico Metropolitano. 2017. Available online: https://pianostrategico.cittametropolitana.genova.it/ (accessed on 10 September 2020).
- Città Metropolitana di Venezia. Piano Strategico Metropolitano. Triennio 2019–2020–2021. Available online: https://forumpsm.cittametropolitana.ve.it/sites/default/files/allegati/PSM%20con%20cop%20con%20data.pdf (accessed on 10 September 2020).
- Città Metropolitana di Milano. Piano Strategico Metropolitano Milanese. 2019. Available online: https://www.cittametropolitana.mi.it/Piano_Strategico_2019_2021/ (accessed on 10 September 2020).
- Veneto ADAPT. Central Veneto Cities netWorking for ADAPTation to Climate Change in a Multi-Level Regional Perspective. Available online: https://www.venetoadapt.it/ (accessed on 4 September 2020).
- Musco, F.; Maragno, D.; Magni, F.; Innocenti, A.; Negretto, V. Padova Resiliente. Linee Guida per la Costruzione del Piano di Adattamento al Cambiamento Climatico; Corila: Venica, Italy, 2016; ISBN 978-88-89405-31-4. [Google Scholar]
- Musco, F.; Dall’Olmo, C.F.; Negretto, V.; Lucertini, G.; Maragno, D.; Ruzzante, F. Mantova Resiliente. Verso il Piano di Adattamento Climatico–Linee Guida; Corila: Venice, Italy, 2018. [Google Scholar]
- Directive 2000/60/EC of the European Parliament and of the Council of 23 October 2000 Establishing a Framework for Community Action in the Field of Water (Directive 2000/60/CE) and Directive 2007/60/EC of the European Parliament and of the Council of 23 October 2007 on the Assessment and Management of Flood Risks (Directive 2007/60/CE). Available online: https://ec.europa.eu/environment/legal/law/7/library_documents.htm (accessed on 20 June 2020).
- Mariano, C.M. Inondazioni costiere nel mediterraneo. Strategie di adattamento per città resilienti. Agathon 2019, 104–113. [Google Scholar] [CrossRef]
- Maragno, D.; Dalla Fontana, M.; Musco, F. Mapping Heat Stress Vulnerability and Risk Assessment at the Neighborhood Scale to Drive Urban Adaptation Planning. Sustainability 2020, 12, 1056. [Google Scholar] [CrossRef] [Green Version]
- UNDRR-United Nations Office for Disaster Risk Reduction. Living with Risk: A Global Review of Disaster Reduction Initiatives. 2004. Available online: https://www.undrr.org/publication/living-risk-global-review-disaster-reduction-initiatives (accessed on 10 October 2020).
- Lane, S.; Klauser, F.; Kearnes, M.B. Critical Risk Research: Practices, Politics and Ethics; John Wiley & Sons: Hoboken, NJ, USA, 2012; 248p, ISBN 9780470974872. Online ISBN: 9781119962748. [Google Scholar] [CrossRef]
- Bankoff, G. Time is of the Essence: Disasters, Vulnerability and History. Int. J. Mass Emergencies Disasters 2004, 22, 23–42. [Google Scholar]
- Alexander, D. Models of Social Vulnerability to Disasters. Rccs Annu. Rev. (Online) 2012, 4. [Google Scholar] [CrossRef] [Green Version]
- Renn, O. Concepts of risk: An interdisciplinary review part 1: Disciplinary risk concepts. Gaia -Ecol. Perspect. Sci. Soc. 2008, 17, 50–66. [Google Scholar] [CrossRef]
- IPCC; Adger, W.N.; Agrawala, S.; Mirza, M.M.Q.; Conde, C.; O’Brien, K.; Pulhin, J.; Pulwarty, R.; Smit, B.; Takahashi, K. Assessment of Adaptation Practices, Options, Constraints and Capacity. Climate Change 2007: Impacts, Adaptation and Vulnerability; Contribution of Working Group II to the Fourth Assessment Report of the Intergovernmental Panel on Climate Change; Cambridge University Press: Cambridge, UK, 2007. [Google Scholar]
- Fritzsche, K.; Schneiderbauer, S.; Bubeck, P. The Vulnerability Sourcebook: Concept and Guidelines for Standardised Vulnerability Assessments. 2014. Available online: https://www.adaptationcommunity.net/?wpfb_dl=203 (accessed on 10 October 2020).
- Jordà, G.; Gomis, D. On the interpretation of the steric and mass components of sea level variability: The case of the Mediterranean basin. J. Geophys. Res. Ocean. 2013, 118, 953–963. [Google Scholar] [CrossRef] [Green Version]
- Tsimplis, M.N.; Álvarez-Fanjul, E.; Gomis, D.; Fenoglio-Marc, L.; Pérez, B. Mediterranean Sea level trends: Atmospheric pressure and wind contribution. Geophys. Res. Lett. 2005, 32. [Google Scholar] [CrossRef]
- Marcos, M.; Calafat, F.M.; Llovel, W.; Gomis, D.; Meyssignac, B. Regional distribution of steric and mass contributions to sea level changes. Glob. Planet. Chang. 2011, 76, 206–218. [Google Scholar] [CrossRef] [Green Version]
- Marcos, M.; Jordà, G.; Gomis, D.; Pérez, B. Changes in storm surges in southern Eu- rope from a regional model under climate change scenarios. Glob. Planet. Chang. 2011, 77, 116–128. [Google Scholar] [CrossRef]
- Marcos, M.; Jordà, G.; Gomis, D.; Holgate, S.; Tsimplis, M.; Barnier, B. Report on the Workshop Unresolved Issues in Mediterranean Sea Level Research, Palma de Mallorca, 30 May–1 June 2011. Available online: http://imedea.uib-csic.es/proyecto/sealevel/Finalreport-archivos-/FINAL-REPORT-v2.pdf (accessed on 10 October 2020).
- Tsimplis, M.; Marcos, M.; Somot, S.; Barnier, B. Sea level forcing in the Mediterra- nean Sea between 1960 and 2000. Glob. Planet. Chang. 2008, 63, 325–332. [Google Scholar] [CrossRef]
- Jordà, G.; Gomis, D. Reliability of the steric and mass components of Mediterra- nean Sea level as estimated from hydrographic gridded products. Geophys. Res. Lett. 2013, 40, 3655–3660. [Google Scholar]
- Rahmstorf, S. A semi-empirical approach to projecting future sea-level rise. Science 2007, 315, 368–370. [Google Scholar] [CrossRef] [PubMed] [Green Version]
- Sannino, A.; Carillo, L. Pratt, Hydraulic criticality of the exchange flow through the strait of Gibraltar. J. Phys. Oceanogr. 2009, 39, 2779–2799. [Google Scholar] [CrossRef] [Green Version]
- Sannino, G.; Carillo, A.; Pisacane, G.; Naranjo, C. On the relevance of tidal forcing in modelling the Mediterranean ther-mohaline circulation. Prog. Oceanogr. 2015, 134, 304–329. [Google Scholar] [CrossRef]
- Strandberg, G.; Bärring, L.; Hansson, U.; Jansson, C.; Jones, C. CORDEX Scenarios for Europe from the Rossby Centre Regional Climate Model RCA4; SMHI: Norrköping, Sweden, 2014. [Google Scholar]
- Collins, W.J.; Bellouin, N.; Gedney, N.; Halloran, P.; Hinton, T.; Hughes, J.; Jones, C.D. Development and evaluation of an Earth-System model–HadGEM2. Geosci. Model Dev. 2011, 4, 1051–1075. [Google Scholar] [CrossRef] [Green Version]
- Giorgi, F.; Jones, C.; Asrar, G.R. Addressing climate information needs at the regional level: The CORDEX framework. WMO Bull. 2009, 58, 175–183. [Google Scholar]
- Istat. Available online: http://dati.istat.it/Index.aspx?QueryId=18560 (accessed on 30 September 2020).
- Comune di Ravenna. Documento Strategico “Il Piano Delle Azioni Consapevoli e Integrate” 2020. Available online: http://webcache.googleusercontent.com/search?q=cache:9t-iaz3aQxUJ:www.comune.ra.it/content/download/500348/5847293/file/2020_01_13_PUGra_Consult_Prelim_Presentazione_Gasparrini.pdf+&cd=1&hl=en&ct=clnk&gl=rs (accessed on 2 February 2021).
- Ministero dell’Ambiente e Della Tutela del Territorio e del Mare. Linee Guida Nazionali per la Difesa Della Costa dai Fenomeni di Erosione e Dagli Effetti dei Cambiamenti Climatici. 2018. Available online: https://www.minambiente.it/sites/default/files/archivio_immagini/Silvia%20Velo/tnec-llgg_nazionali_difesa_della_costa_dallerosione_9nov2016.pdf (accessed on 1 October 2020).
- Ravenna e Dintorni. Come un Maremoto: Quarant’anni fa L’alluvione che Fece Andare Sott’acqua la Costa. Available online: https://www.ravennaedintorni.it/cronaca/2019/12/22/un-maremoto-quarantanni-lalluvione-fece-andare-sottacqua-la-costa/ (accessed on 7 November 2020).
- Tarquini, S.; Isola, I.; Favalli, M.; Battistini, A. TINITALY, a Digital Elevation Model of Italy with a 10 m-Cell Size; Version 1.0; [Data set]; Istituto Nazionale di Geofisica e Vulcanologia: Rome, Pisa, 2007. [Google Scholar]
- Sezioni di Censimento Litoranee. Available online: https://www.istat.it/it/archivio/137341 (accessed on 30 September 2020).
- Geoportale Regione Emilia-Romagna. Available online: https://geoportale.regione.emilia-romagna.it/archivio-cartografico (accessed on 7 November 2020).
- OpenData Ravenna. Available online: http://opendata.comune.ra.it/ (accessed on 7 November 2020).
- Comune di Ravenna-RUP. Servizio di Consultazione Mappe Interattive. Available online: http://rup.comune.ra.it/Mappe-Interattive (accessed on 7 November 2020).
- Comune di Ravenna-RUP. Piano Strutturale Comunale. Available online: http://rup.comune.ra.it/PSC/Elaborati/ELABORATI-PRESCRITTIVI/PSC-3-Spazi-e-sistemi (accessed on 10 November 2020).
Figure 1.
Streets of Marina di Ravenna on 22 December 1979 after the flood. Source: The image was kindly granted by the editorial staff of the RavennaeDintorni.it newspaper.
Figure 1.
Streets of Marina di Ravenna on 22 December 1979 after the flood. Source: The image was kindly granted by the editorial staff of the RavennaeDintorni.it newspaper.
Figure 2.
Extract of “Elaborato 3—Spazi e Sistemi del PSC—Piano Strutturale Comunale”, (Chart 3—Spaces and Systems—Municipal Structural Plan) relating to the area of Marina di Ravenna.
Figure 2.
Extract of “Elaborato 3—Spazi e Sistemi del PSC—Piano Strutturale Comunale”, (Chart 3—Spaces and Systems—Municipal Structural Plan) relating to the area of Marina di Ravenna.
Figure 3.
Flood Risk Map for the target area Marina di Ravenna—Time horizon: 2030 (a); 2050 (b); 2100 (c).
Figure 3.
Flood Risk Map for the target area Marina di Ravenna—Time horizon: 2030 (a); 2050 (b); 2100 (c).
Figure 4.
Flood Risk Map for the target area Lido Adriano—Time horizon: 2030 (a); 2050 (b); 2100 (c).
Figure 4.
Flood Risk Map for the target area Lido Adriano—Time horizon: 2030 (a); 2050 (b); 2100 (c).
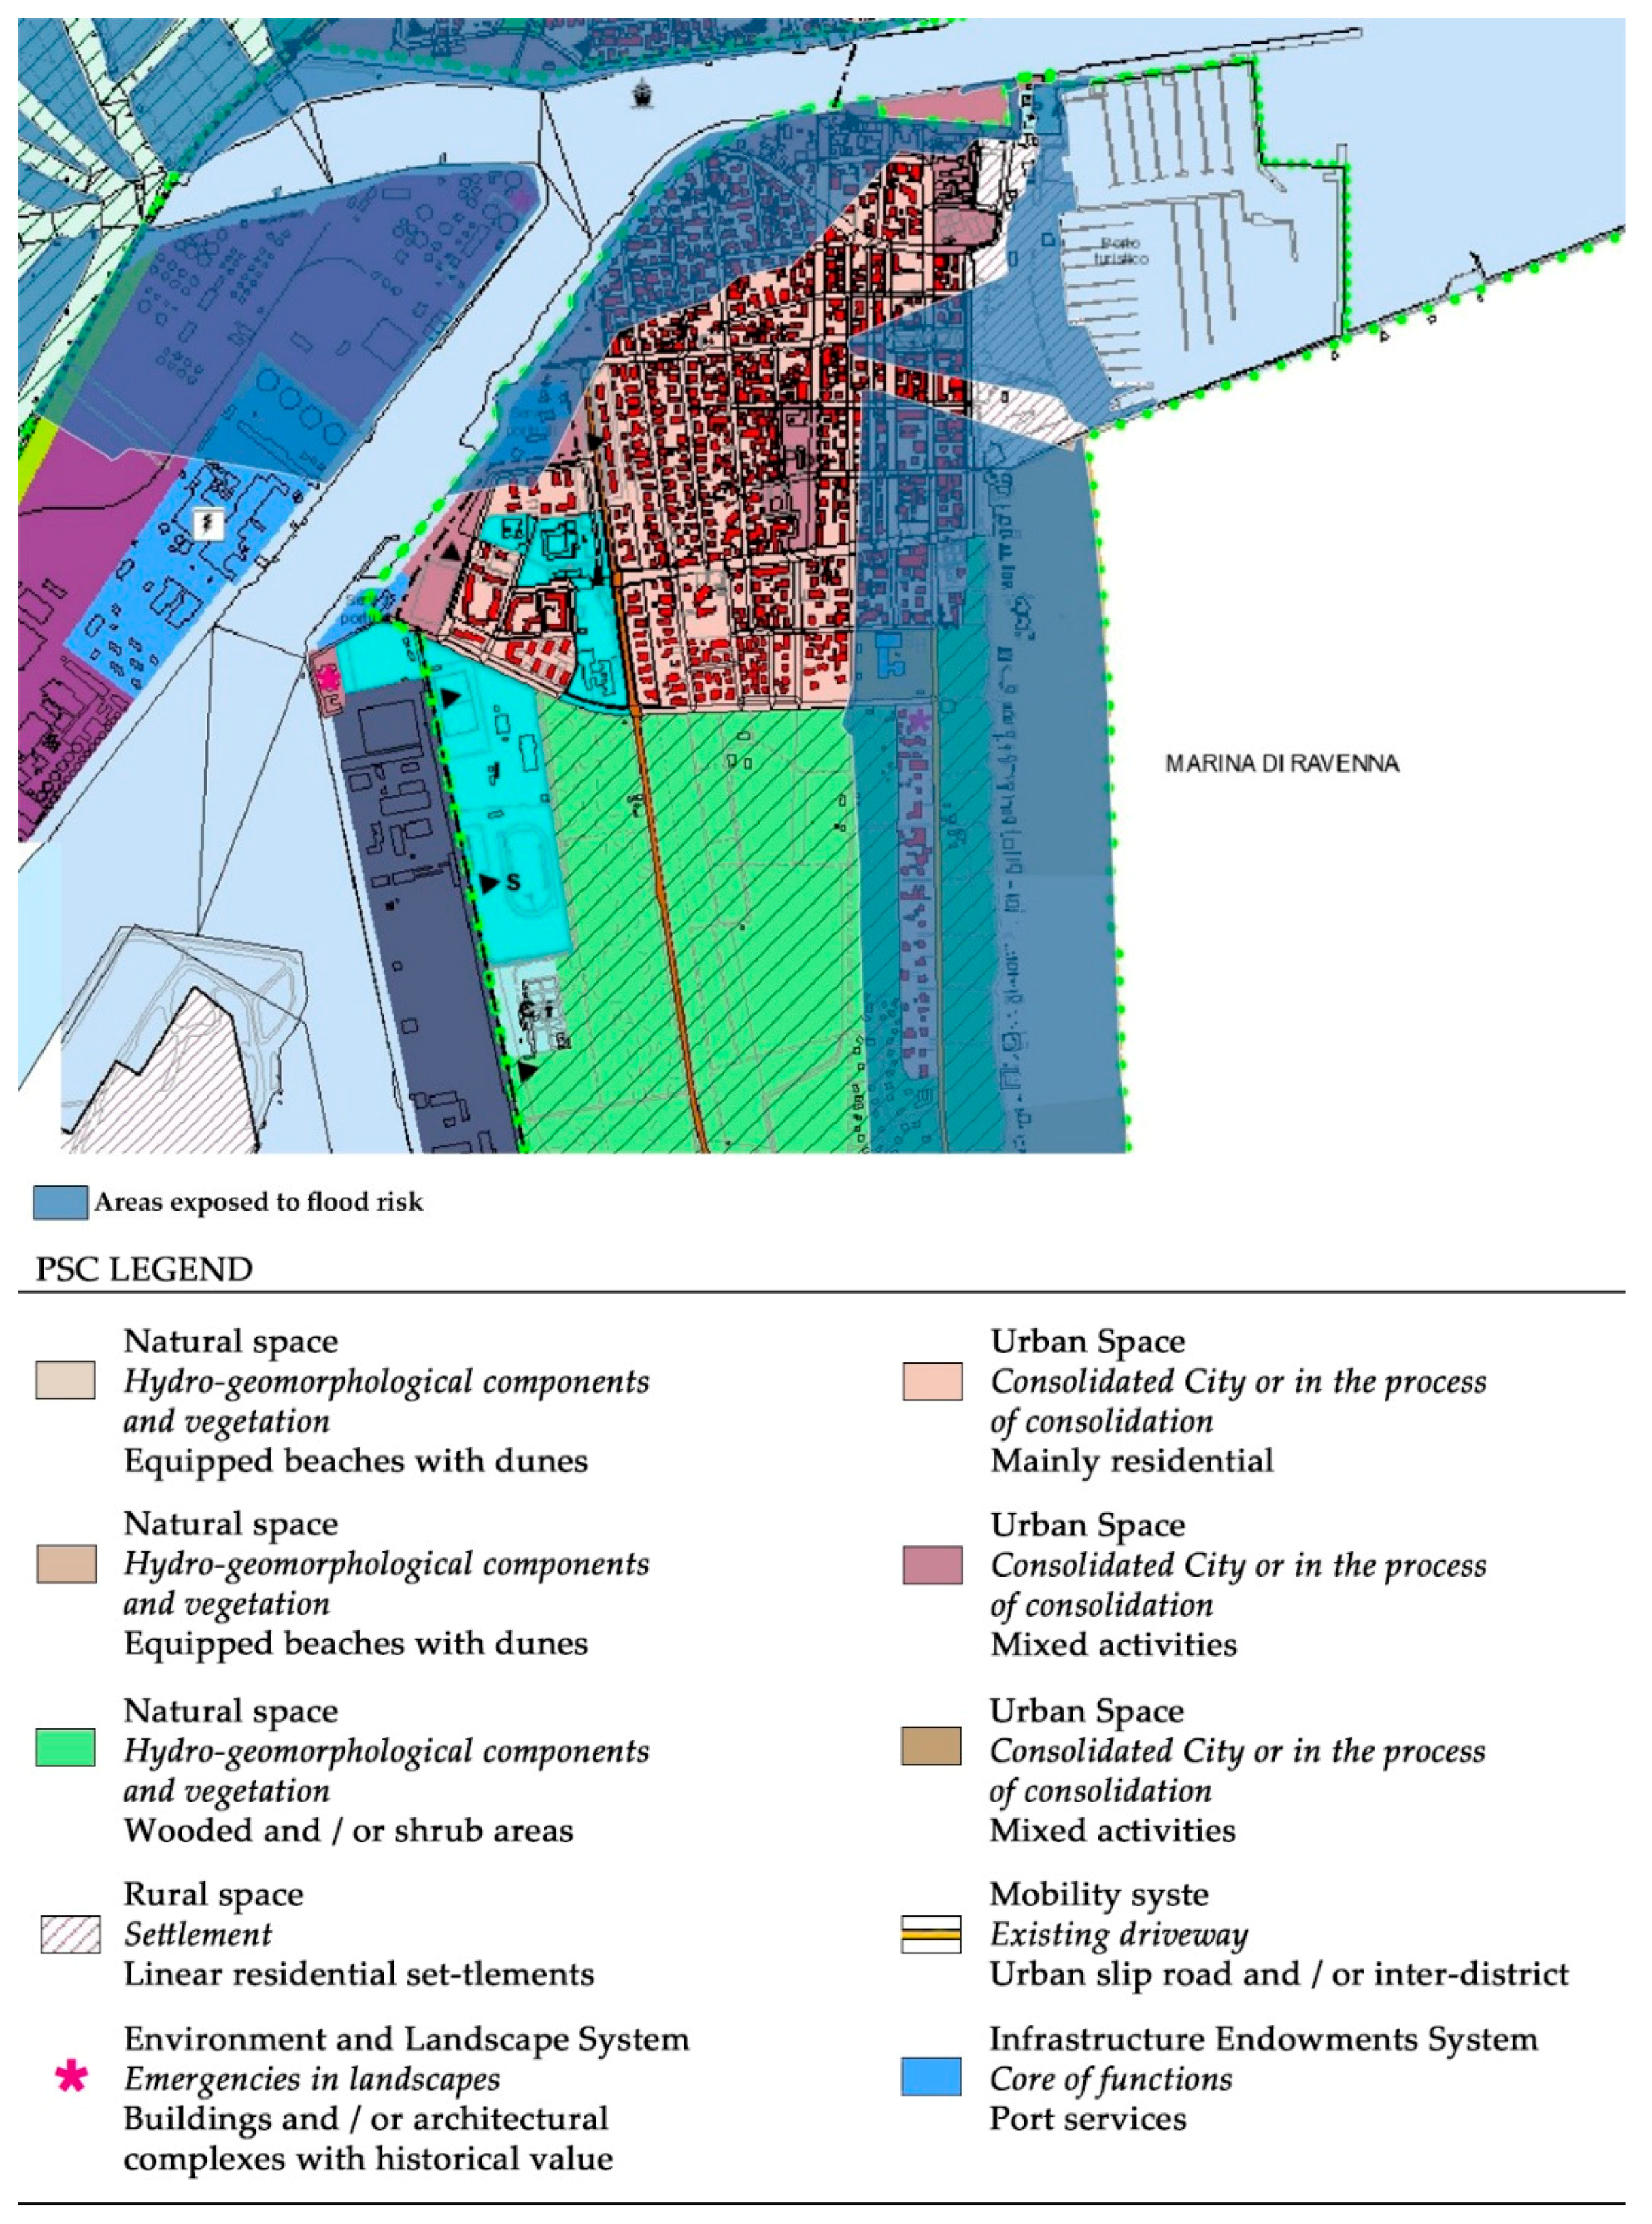
Figure 5.
Relation between areas exposed to SLR risk by 2030 and prescriptions from the Local Plan. Target area: Marina di Ravenna.
Figure 5.
Relation between areas exposed to SLR risk by 2030 and prescriptions from the Local Plan. Target area: Marina di Ravenna.
Figure 6.
Relation between areas exposed to SLR risk by 2050 and prescriptions from the Local Plan. Target area: Marina di Ravenna.
Figure 6.
Relation between areas exposed to SLR risk by 2050 and prescriptions from the Local Plan. Target area: Marina di Ravenna.
Figure 7.
Relation between areas exposed to SLR risk by 2100 and prescriptions from the Local Plan. Target area: Marina di Ravenna.
Figure 7.
Relation between areas exposed to SLR risk by 2100 and prescriptions from the Local Plan. Target area: Marina di Ravenna.
Table 1.
SLR (sea level rise) projections, for RCP 8.5, first Antarctic scenario, Municipality of Ravenna. Source: Climate and impact modeling laboratory, ENEA Casaccia Research Center.
Table 1.
SLR (sea level rise) projections, for RCP 8.5, first Antarctic scenario, Municipality of Ravenna. Source: Climate and impact modeling laboratory, ENEA Casaccia Research Center.
| Reference Year | Sea Level Rise Projections (Expressed in cm) |
|---|
| 2030 | 2 |
| 2050 | 17 |
| 2100 | 68 |
Table 2.
Ravenna OpenData.
Table 2.
Ravenna OpenData.
| Data Name | Source | File Format | Date of Update |
|---|
| Riverbed | Ravenna OpenData | .shp | 4 February 2020 |
| Urbanized areas | Ravenna OpenData | .shp | 9 July 2019 |
| Environmental uncovered areas | Ravenna OpenData | .shp | absent |
Table 3.
Progressive impairment of urban components.
Table 3.
Progressive impairment of urban components.
| Target Area | Ravenna OpenData | Total Area (mq) | Areas Exposed to Potential Risk of Flooding by 2030 (mq) with a SLR of 2 cm | Areas Exposed to Potential Risk of Flooding by 2050 (mq) with a SLR of 17 cm | Areas Exposed to Potential Risk of Flooding by 2100 (mq) with a SLR of 68 cm |
|---|
| Marina di Ravenna | Urbanized areas | 1,170,482 | 42,636
(4% of total area) | 89,291
(8% of total area) | 296,931
(25% of total area) |
| Marina di Ravenna | Environ-mental uncovered areas | 1,003,378 | 42,268
(4% of total area) | 268,697
(27% of total area) | 433,509
(43% of total area) |
Table 4.
Urban planning instrument forecasts, in relation to the physical consistency of the areas at risk of flooding by 2030.
Table 4.
Urban planning instrument forecasts, in relation to the physical consistency of the areas at risk of flooding by 2030.
| Target Area | Nomenclature in Legend (PSC Elaborato 3—Spazi e Sistemi) | Total Area (mq) | Area Exposed to Potential Risk of Flooding by 2030 (mq) with a SLR of 2 cm |
|---|
| Marina di Ravenna | Natural space
Hydrogeomorphological components and vegetation
Equipped beaches with dunes | 146,924 | 13,508
(9% of total area) |
| Marina di Ravenna | Natural space
Hydrogeomorphological components and vegetation
Equipped beaches without dunes | 243,712 | 32,568
(13% of total area) |
| Marina di Ravenna | Rural space
Settlement
Linear residential settlements | 122,024 | 35,077
(29% of total area) |
Table 5.
Urban planning instrument forecasts, in relation to the physical consistency of the areas at risk of flooding by 2050.
Table 5.
Urban planning instrument forecasts, in relation to the physical consistency of the areas at risk of flooding by 2050.
| Target Area | Nomenclature in Legend
(PSC Elaborato 3—Spazi e Sistemi) | Total Area (mq) | Area Exposed to Potential Risk of Flooding by 2050 (mq) with a SLR of 17 cm |
|---|
| Marina di Ravenna | Natural space
Hydrogeomorphological components and vegetation
Equipped beaches with dunes | 146,924 | 78,649
(53% of total area) |
| Marina di Ravenna | Natural space
Hydrogeomorphological components and vegetation
Equipped beaches without dunes | 243,712 | 141,511
(58% of total area) |
| Marina di Ravenna | Rural space
Settlement
Linear residential settlements | 122,024 | 48,344
(40% of total area) |
| Marina di Ravenna | Urban Space
Consolidated city or in the process of consolidation
Mainly residential | 751,420 | 3777
(0.5% of total area) |
| Marina di Ravenna | Urban Space
Consolidated city or in the process of consolidation
Mixed activities | 125,029 | 21,688
(17% of total area) |
Table 6.
Urban planning instrument forecasts, in relation to the physical consistency of the areas at risk of flooding by 2100.
Table 6.
Urban planning instrument forecasts, in relation to the physical consistency of the areas at risk of flooding by 2100.
| Target Area | Nomenclature in Legend
(PSC Elaborato 3—Spazi e Sistemi) | Total Area (mq) | Area Exposed to Potential Risk of Flooding by 2100 (mq) with a SLR of 68 cm |
|---|
| Marina di Ravenna | Natural space
Hydrogeomorphological components and vegetation
Equipped beaches with dunes | 146,924 | 146,924
(100% of total area) |
| Marina di Ravenna | Natural space
Hydrogeomorphological components and vegetation
Equipped beaches without dunes | 243,712 | 243,712
(100% of total area) |
| Marina di Ravenna | Natural space
Hydrogeomorphological components and vegetation
Wooded and/or shrub areas | 610,158 | 40,289
(7% of total area) |
| Marina di Ravenna | Rural space
Settlement
Linear residential settlements | 122,024 | 98,531
(81% of total area) |
| Marina di Ravenna | Environment and landscape system
Emergencies in landscapes
Buildings and/or architectural complexes with historical value | Pointelement | 100% |
| Marina di Ravenna | Urban space
Consolidated city or in the process of consolidation
Mainly residential | 751,420 | 279,198
(37% of total area) |
| Marina di Ravenna | Urban space
Consolidated city or in the process of consolidation
Mixed activities | 125,029 | 64,784
(52% of total area) |
| Marina di Ravenna | Urban space
Consolidated city or in the process of consolidation
Mainly for tourist activity | 16,727 | 16,727
(100% of total area) |
| Marina di Ravenna | Mobility system
Existing driveway
Urban slip road and/or inter-district | 20,546 | 20,546
(100% of total area) |
| Marina di Ravenna | Infrastructure endowments system
Core of functions
Port services | 21,629 | 21,629
(100% of total area) |
Table 7.
Summary of data referring to the territorial systems exposed to the risk of flooding. Target area: Marina di Ravenna (2030, 2050, 2100).
Table 7.
Summary of data referring to the territorial systems exposed to the risk of flooding. Target area: Marina di Ravenna (2030, 2050, 2100).
| System | Total Area (mq) | Area Exposed to Potential risk of Flooding by 2030 (mq) with a SLR of 2 cm | % of Total Area | Area Exposed to Potential Risk of Flooding by 2050 (mq) with a SLR of 17 cm | % of Total Area | Area Exposed to Potential Risk of Flooding by 2100 (mq) with a SLR of 68 cm | % of Total Area |
|---|
| Environment and Landscape System | 1,122,818 | 81,153 | 7 | 268,504 | 24 | 529,455 | 47 |
Settlement and
Urban Morphology System | 893,176 | 0 | 0 | 25,465 | 3 | 343,982 | 35 |
Infrastructure
Endowment and Public Services
System | 42,175 | 0 | 0 | 0 | 0 | 42,175 | 10,000 |
| Publisher’s Note: MDPI stays neutral with regard to jurisdictional claims in published maps and institutional affiliations. |
© 2021 by the authors. Licensee MDPI, Basel, Switzerland. This article is an open access article distributed under the terms and conditions of the Creative Commons Attribution (CC BY) license (http://creativecommons.org/licenses/by/4.0/).


