1. Introduction
The phenomenon of climate change has become one of the greatest threats at the global level. Recycling may be one of the keys to combat climate change. The World Recycling Summit held in Barcelona in 2018 provided plenty of data on the benefits of recycling each type of material [
1]. The concept of recycling is considered particularly important, as it is an act that everyone can do to a greater or lesser extent. In this way, small gestures help to protect the environment and avoid increasing the rate of degradation of the planet. Similarly, through recycling we can give a second life to many products, avoiding the use of our finite resources and avoiding producing millions of tons of CO
2 (one of the most harmful gases to the environment).
It is possible to recycle plastic containers, tetra bricks, cans, paper and cardboard packaging, glass, and all organic waste that we generate.
According to data from the European Parliament, only a third of the plastic produced is recycled. Every year, the production and incineration of plastic emits about 400 million tons of CO
2 to the atmosphere, which could be reduced with better recycling. The low proportion of recycling in the European Union leads to large losses for countries’ economies and environments. It is estimated that 95% of the value of plastic packaging material is lost to the economy after a very short first use [
2].
According to the “Ecoembes” report of 2018, in Spain 7 out of 10 containers are recycled but only 37% of organic matter and 8% of metal, tetra bricks, or cardboard packaging are [
3]. European Union regulations for the year 2020 establish that all Member States must be able to separate waste into four different groups: paper, plastic, glass, and organic [
4]. In the process of recycling, the necessary step of separating materials into their different containers is a repetitive task and therefore it is subject to automatization, provided there was a systematic avenue to identify each different material. This would be a great step forward in the path towards facilitating the recycling process, and it is the basis of our work.
In our study, we demonstrate that, with the advances produced in deep learning techniques and, specifically, the use of convolutional neural networks, it is possible to identify and classify images with a high reliability and accuracy in order to automate recycling. Using images as their inputs, these neural networks are able to locate those features that allow us to distinguish between one material and another. All networks are formed by neurons with parameters with their corresponding weights and biases. Each of them is constantly modified so that the system can feed back and learn continuously. In the same way the human eye looks at specific details to distinguish between different images—(for example, in order to distinguish a face we focus on features like the nose, eyes, mouth, ears, eyebrows, etc.), convolutional networks utilize different layers to identify more and more abstract aspects of the image. The first layers are common to all images, and in the deepest levels we look for the features that are more characteristic of the particular image case. In order to do so, a set of images of the materials to be recycled (available in any home since the process starts in the domestic environment) must be first compiled, grouping a set of 6000 images of the four types of material previously mentioned (paper, plastic, glass, and organic material). To validate the expected results, the total set of images will be divided, using 25% for the development of the test itself and 75% for the training of the system. Once trained and sufficiently verified, this neural network could be extended to the classification of materials not only in homes, but also in other spaces where, according to statistics, the recycling rates are even poorer.
Different authors have already researched and contributed to different types of models in this regard. Ref. [
5] sought to detect and classify materials using a dataset called TrashNet and the MobileNet V2 and Inception V2 networks, achieving a 97% accuracy. Ref. [
6], using the dataset TrashNet and the networks VGG16, Alexnet, and GoogleNet achieved a 97.86% accuracy in the classification of paper, cardboard, plastic, glass, metal, and other materials. It is interesting to note that these previous studies arrived at practically equal success values using the same dataset, (TrashNet) but two different approaches. Ref. [
7], however, using also TrashNet as the starting dataset and the ResNet18 network, reached an 87.8% accuracy. In this study, the classification of materials involved glass, metal, paper, and plastic. Ref. [
8] conducted another study on the classification of materials including paper, cardboard, plastic, metal, and glass. In this article, without using deep learning techniques for sorting in pre-trained networks, the result achieved in the best case was not a 90% accuracy. The novelty of our study resides in that it is not based on an existing dataset such as TrashNet but one developed from images of real garbage generated in many different homes and with images taken by different groups of people. To accomplish this, the data augmentation technique was used to apply different basic transformations to these images. Currently, there are several studies in which the main objective is to locate garbage for its subsequent recycling [
9]. Using an R-CNN network model, these studies show that it is possible to locate where within an image is the garbage located—this step will be very important for future research that can link autonomous vehicles capable of locating and collecting the garbage. This location of the garbage can become the next step of the present study since it will allow locating, classifying, and finally recycling the garbage with its corresponding group. By means of a R-CNN network, adding a layer of CNN classification, it would be possible for example to carry out the classification and recycling of the elements that can be found in any tray of a fast food restaurant: a plastic bottle, glass, coffee cup, food leftovers, food wrapping paper, etc. In addition, we should be able to identify those elements that are directly usable (such as metal cutlery, plates, glasses, etc.) from those that we must separate to recycle. For all this it is necessary to carry out a set of steps which are very simple for the mind but difficult to implement automatically without a specific set of techniques and classification processes.
In the later study ([
5]) the elements are already in a photograph. In the later study, the R-CNN network was successful in detecting the garbage in the image. Our model, however, goes one step further and is also able to detect what type of material the garbage is made of (e.g., organic matter, plastic, etc.).
A different approach is applied by [
10] where the model of geometric transformations use a single methodological framework for several tasks and a fast non-iterative study with a predefined number of computational steps, providing repeatability of training results and the possibility of obtaining satisfactory solutions for large and small training samples. Additionally, [
11,
12] propose two methods for solving the problem of reducing and increasing the image resolution: using neural structures of the geometric transformations model and on the basis of the matrix operator of the weight coefficients of synaptic connections. Ref. [
13] proposes a method for predicting atmospheric air pollution based on neural networks or also the case of [
14] using a similar method for fruit detection and classification.
The objective and hypothesis of our study is: To generate a system that is capable of identifying and classifying 100% reusable elements in a particular set of garbage that are subject to be recycled. In order to have a real impact in the recycling quota, the system needs to be simple, easy to use, and available to the public. For this, through a previous classification of the images, we would be able to automatically recycle different types of materials. This could lead to great savings, as some countries such as Spain, Italy, the United Kingdom, Ireland, and South Africa have introduced taxes on single-use plastics [
15].
In the conclusions section, three different scenarios will be defined with different levels of reliability depending on the number of materials to be compared:
Comparison using two materials. In this case, we obtain values with a success rate of more than 97%.
Comparison using three materials. In this case, we obtain values with a success rate between 88% and 92%.
Comparison using four materials. In this case, we obtain values with a success rate between 78% and 85%.
The article is structured as follows: Introduction, where the importance of recycling is addressed and how different methods based on deep learning can help in the task of recycling, separating each material and depositing it in its correct container. A section on materials and methods in which, firstly, it is explained how to collect images for training and validation; and secondly, the choice of the type of neural network to be applied and the steps to be taken (convolution, max pooling, flattering and full connection), data augmentation and finally transfer learning. The results show the reliability of the system by classifying one, two, three, and four types of residues from different applied models (VGG16, VGG19, and ResNet15V2). Finally, the discussion of results and conclusions are presented, showing the ability to classify the elements by means of the convolutional network proposed.
2. Materials and Methods
For the first training and validation networks, deep learning would be a good solution to address the problem of material classification. To do this, it is necessary to collect a set of images estimated at a minimum of 1000 for each type of material. Of these images, the network was trained using 900 images of each type of material, leaving the rest (100 images per material) to validate the results of the model. It is necessary to make this previous separation since a large group of images is required with which the network will learn to identify the characteristics of an image for its later classification among paper, glass, plastic, or organic material.
Once the neural network has learned, it is necessary to validate the model. This validation will be done using the images that the network has not seen in the training. For this study, we use a dataset consisting of 3600 image, 90% for training and the remaining 400 to be able to carry out this validation) the validation of the model will have to be carried out with data that have not been used in this training [
9].
Regarding the collection of images, “home” images have been taken directly in order to obtain a more realistic set and, on the other hand, photos have been collected from the Internet in order to complete the set of images needed to build the Dataset. Several types of cell phones have been used to take the pictures, all of them very common models:
Samsung Galaxy
Samsung A1
Samsung A2
Samsung J3
IPhone 6
IPhone 7
IPhone 11
OPPO A91
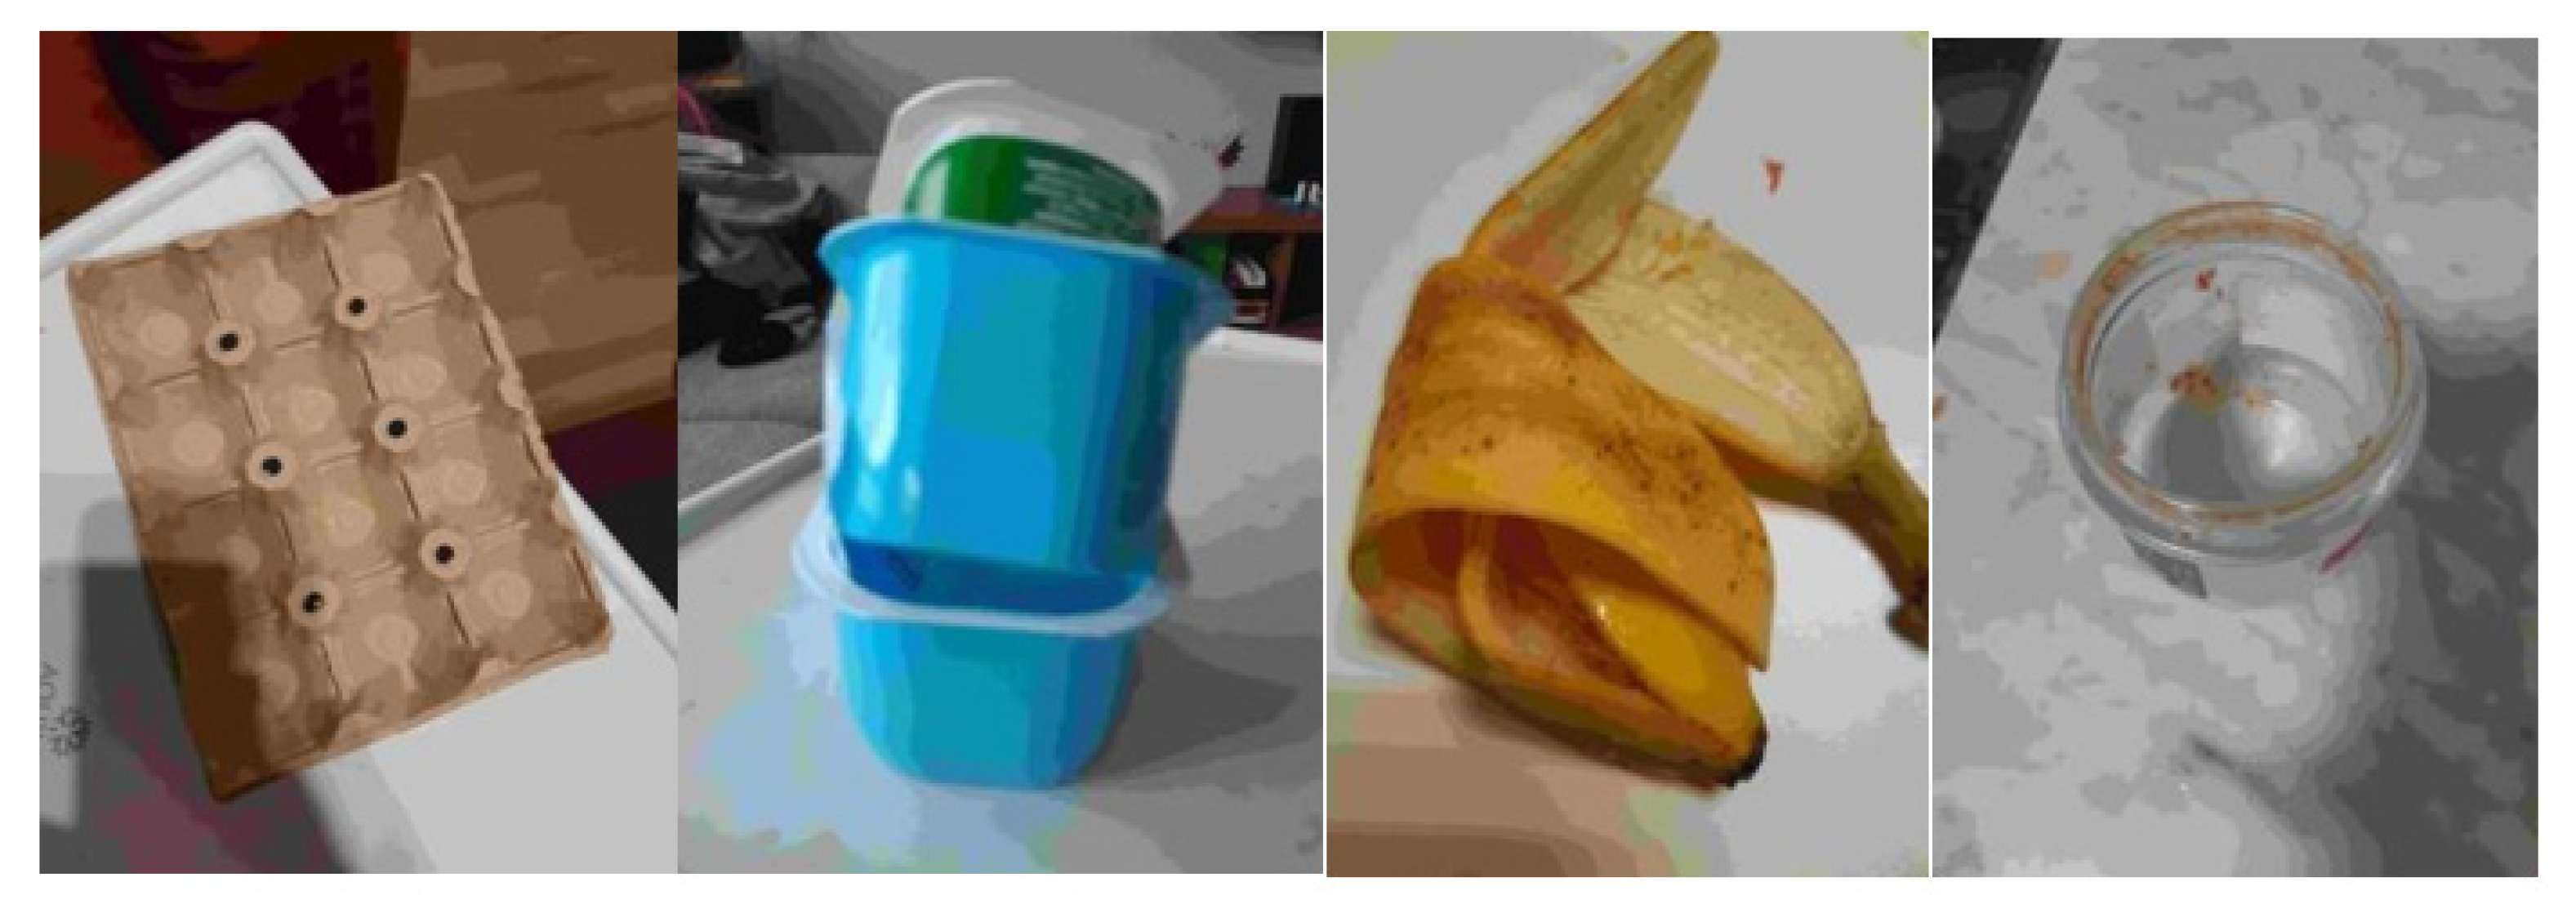
Since the study aims to assist the recycling process in the household environment, we built our dataset with photos of different pieces of garbage generally available in any household, e.g., food scraps, containers, bottles, cans, cardboard boxes, letters, books, magazines, etc. These are made of the four specific materials that need to be distinguished, i.e., organic material, plastic, glass, and paper. To complete the dataset, garbage images were added from “Google Images” and “Wikipedia” and different Kagle Datasets were used to expand the Dataset.
Finally, a computer program was used to resize/adjust all images to the same resolution. In a later phase of the work it will be necessary to increase the number of images to be treated, reaching 1500 images (see
Figure 1) of each type for training purposes [
16,
17,
18].
Figure 2 shows the flow diagram of the methodology applied in the study.
2.1. Choice of the Type of Neuronal Network to Be Applied and Development of a CNN-Type Network
All neural networks consist of neurons with specific input parameters, each of these having its corresponding weights and biases that will be constantly modified to learn and give an output and a concrete result. These networks have the characteristic that their inputs are images. Therefore, the aim of our study will be to locate those elements that allow distinguishing one image from another. To do so, the first layers of the network must be able to look for basic ideas such as identifying lines, borders, contours, textures, or shadows that help deeper layers in locating and identifying particular features of each image. In this way, the set of aspects learned in each level allows to go deeper in the next one and eventually makes the system able to classify the different images into categories. Since there is a lot of redundant information in the set of images to be treated, it is necessary to perform a series of steps in order to operate a CNN (convolutional neuronal network): convolution, max pooling, flattening, full connection, softmax (in the final step in the case of having several possible outputs).
2.1.1. Convolution
As a first step, it is necessary to look for those characteristics that identify the image. For an image to be read by a computer, it is necessary to create its mathematical representation. To do this, for each of the images that are passed to the network, an array must be created with the values of the pixels in the image. To find the characteristics that define that image, it is necessary to multiply the array by a set of feature detectors. As a result, you will get the feature map according to the different feature detectors that we have applied to our image [
9,
17,
18].
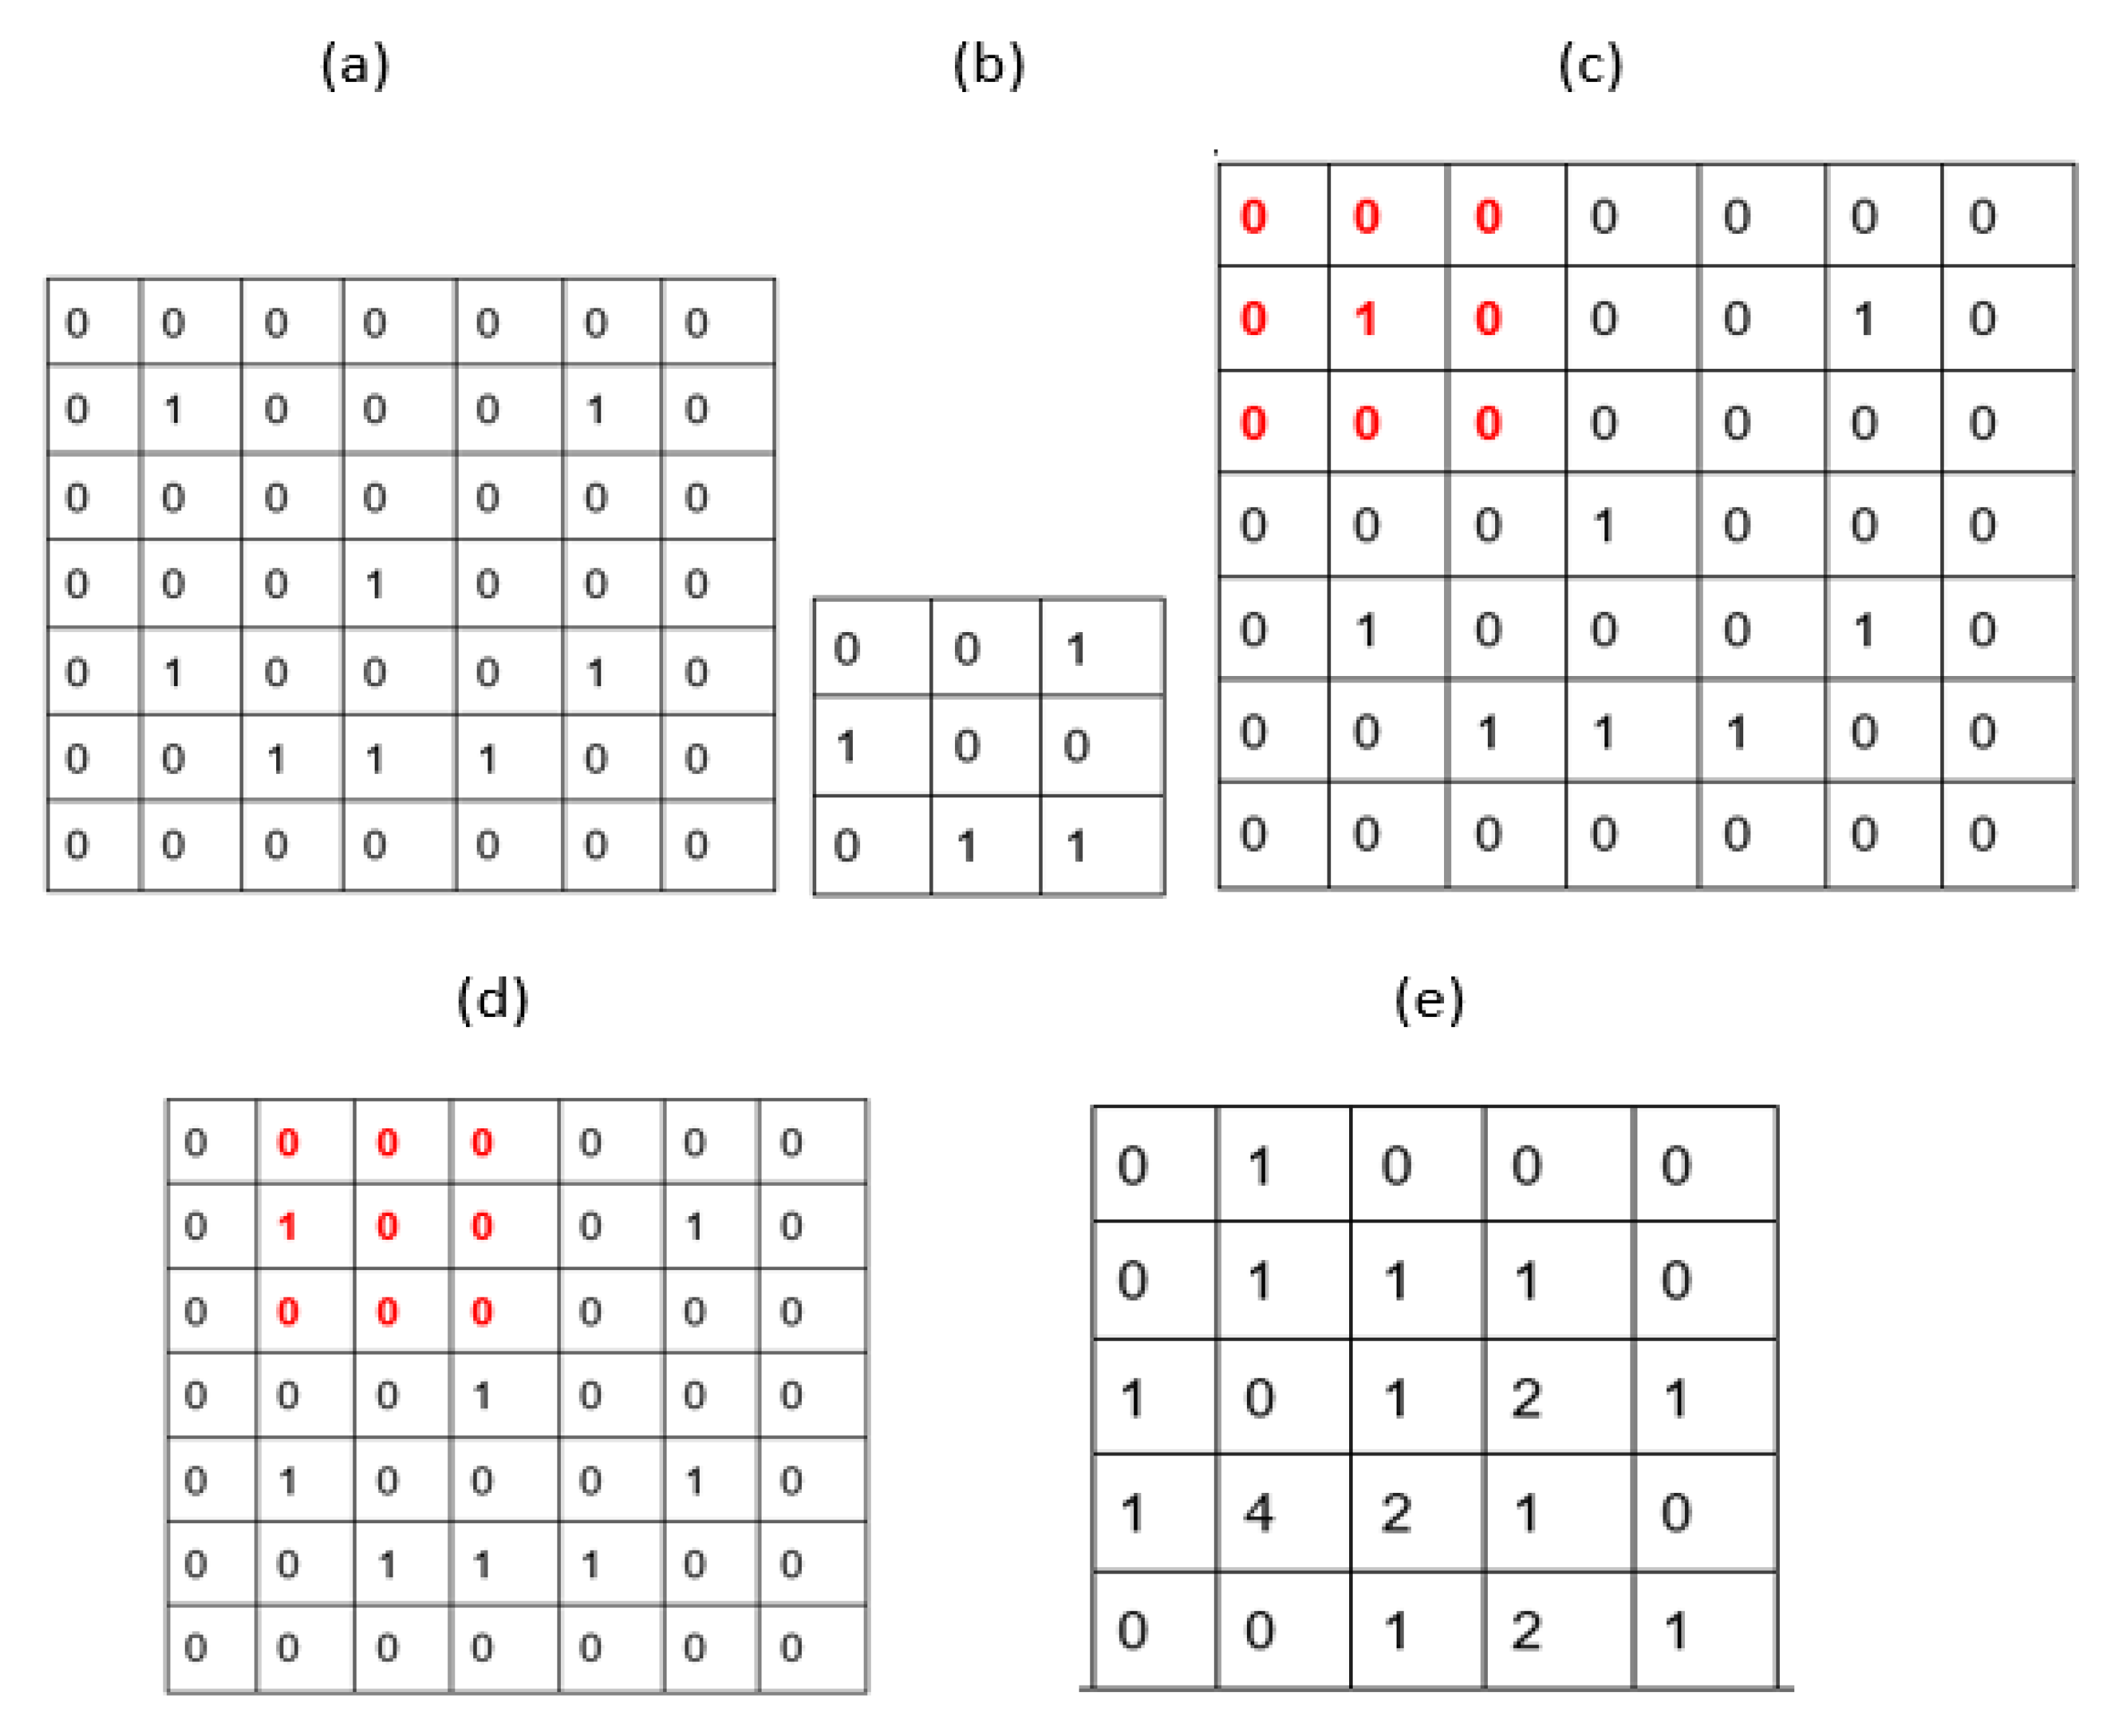
After the convolution layer, the RELU function must be applied to all feature layers. A RELU function is one where only the positive values of X are allowed, being considered 0 for the rest of cases. Thus, if we have a 7 × 7 image, we must multiply a 3 × 3 detector and the result will be a 5 × 5 features map. The image then is rescaled to contain values between 0 and 1.
The image to treat 7 × 7 scaled between 0 and 1, is shown in
Figure A1a of the
Appendix A. The 3 × 3 Trait detector is shown in
Figure A1b in the
Appendix A. Suppose the following trait detector we want to apply to the network. With the two previous figures, the matrix of the image to be treated should be multiplied by the trait detector, advancing one box each time. We multiply the trait detector to the matrix; this operation is shown in
Figure A1c of the
Appendix A. Advance one position and multiply again by the trait detector. This operation is repeated so that we can go through all the arrays, as shown in
Figure A1d of the
Appendix A. Finally, a 5 × 5 matrix is obtained as a result, see
Figure A1e of the
Appendix A [
19].
2.1.2. Max Pooling
In this process it is necessary to further reduce the size of each of the images by focusing only on those aspects that really provide information. In order to highlight the characteristics, found in each image, the maximum value of the pixels must be searched each time. The window on which to apply max pooling will be 2 × 2. In this case, it is only necessary to perform the operation once on each pixel.
As mentioned before, the result of this operation is that only the most important information of the image remains, as shown in
Figure A2e in
Appendix A. This operation must be performed on all the feature maps previously found.
2.1.3. Flattering
Once this point is reached, it is necessary to convert all the max pooling values (see
Figure A3a in the
Appendix A) to a single vector that is composed of the input values to the densely connected network (Full connection). As can be seen after this process (see
Figure A3b in the
Appendix A), the information in each of the images has been converted into a large set of input parameters for a neural network that allow classifying the image.
2.1.4. Full Connection
Finally, it is possible to create the structure of a densely connected neural network that allows a concrete response. Thus, the entrance to the network is the vector built after the flattering operation. Since it is a densely connected network, all outputs are connected to the subsequent inputs.
Once the five previous steps have been developed, it is necessary to define the basic model of the CNN to be used. The code is shown below. We use the “Keras” framework where we implement the necessary steps to build the network in each of the points mentioned above.
For the Convolution process we use the following parameters:
Filters, which will define the number of results we want.
Kernel size, which will define the size of the feature matrix.
Input shape, which corresponds to the size of the input image, only needs to indicate the size of the image in the first CONV2 of our network.
Activation, which will be the activation function to be applied at the end of each convolution.
The first step would be to develop one’s own convolution:
Theorem 1. Application of the convolution. classifier.add (Conv2D(filters = 32,kernel_size = (3,3),input_shape = (64,64,3), activation = “relu”).
This development of the convolution layer is presented in studies by authors such as [
10]. For the max pooling process, we will use the pool size parameter to define the size of the window for making the reduction. Each time you call max pooling it is important to note that the image size is reduced by half. Therefore, you should watch the number of times you make this call so that you do not run out of image size in which case an error occurs.
Theorem 2. Execution of Maxpooling. classifier.add(MaxPooling2D(pool_size = (2,2)).
For the development of the maxpooling layer, the already mentioned work carried out in [
16] has also been considered. Normally, more than one layer of the type Conv2D + MaxPooling2D, 2 or 3 convolution layers are used to have many image characteristics. As we have indicated above, when calling Conv2D, it would not be necessary to indicate the size of the image, since it is a data already known by the network itself. These first two steps can be repeated several times, being a technique widely used by authors such as [
17] or [
18].
Theorem 3. Addition of second convolution with its Maxpooling. classifier.add(Conv2D(filters = 32,kernel_size = (3,3), activation = “relu”)) classifier.add(MaxPooling2D(pool_size = (2,2))).
To perform the Flattening process, a call to the Keras function must be made, which is developed in the fourth theorem.
Theorem 4. Flattening of characteristics in a vector. classifier.add(Flatten()).
In order to develop the layer of flattering, we have considered the aforementioned work by [
16], as well as works on deep learning applicable to computer vision from [
19]. Regarding the practical application of this technology referred to specific processes of automatic waste recycling, the contributions of [
20] have been used.
Further referenced are the works of [
21] on classification of images with deep convolutional neural networks, or the most recent of [
22] on classification of waste. To develop the full connection process, based on the previous points, it would be necessary to develop a densely populated network with 64 input parameters. Once this network is developed, the last layer would correspond to the output being searched, in the case of the search results with a single output.
The first thing would be to be able to reduce the number of parameters in the various layers, a matter that is covered by the theorem number five.
Theorem 5. Reduction in the number of characteristics in successive deep layers. classifier.add(Dense(units = 1024, activation = “relu”))
classifier.add(Dense(units = 256, activation = “relu”))
classifier.add(Dense(units = 64, activation = “relu”))
classifier.add(Dense(units = 1, activation = “sigmoid”)).
The recurrent methodology of reducing the number of parameters before developing the densely populated network to evaluate the result is a technique widely used in academia when operating with convolution networks [
17,
18,
19,
20,
21,
22]. In the case that more than two materials are presented, the following code should be developed, which contains the sixth theorem.
Theorem 6. Code applicable in case of two materials.
classifier.add(Dense(256, activation = ‘relu’))
classifier.add(Dropout(0.1))
classifier.add(Dense(128, activation = ‘relu’))
classifier.add(Dropout(0.1))
classifier.add(Dense(units = 4, activation = “softmax”)).
For a better generalization, in this part we have added regularization techniques for classification in the densely connected network using the Dropout before performing the final softmax. Based on the contributions of [
23] in the previous regularization, the aim is that the subsequent network does not fall into overfitting. Once this point is reached, the final compilation of the model is developed.
Theorem 7. Final compilation of the model
from keras import optimizers
classifier.compile(loss = ‘categorical_crossentropy’,
#optimizer = ‘adam’,
optimizer = optimizers.RMSprop(lr = 2e−4), #’rmsprop’,
metrics = [“accuracy”]).
In order to be able to compile, the loss function must be defined so that the model can be trained. For this, we considered two optimizers, namely, the Adam [
24], and RMSprop ones, used in the study of [
25]. We compared them checking which one reported a better result to our network and finally opted to use the Adam optimizers which proved to yield better values when training the network.
2.2. Data Augmentation
Once the CNN network is developed, it becomes necessary to use the data augmentation technique to avoid overfitting. Since a small set of images is available, it is very possible that an overfitting will occur when training the model. In fact, the model used in this work is so well adjusted to the training data that in the subsequent validation phase it will not be able to find the correct result.
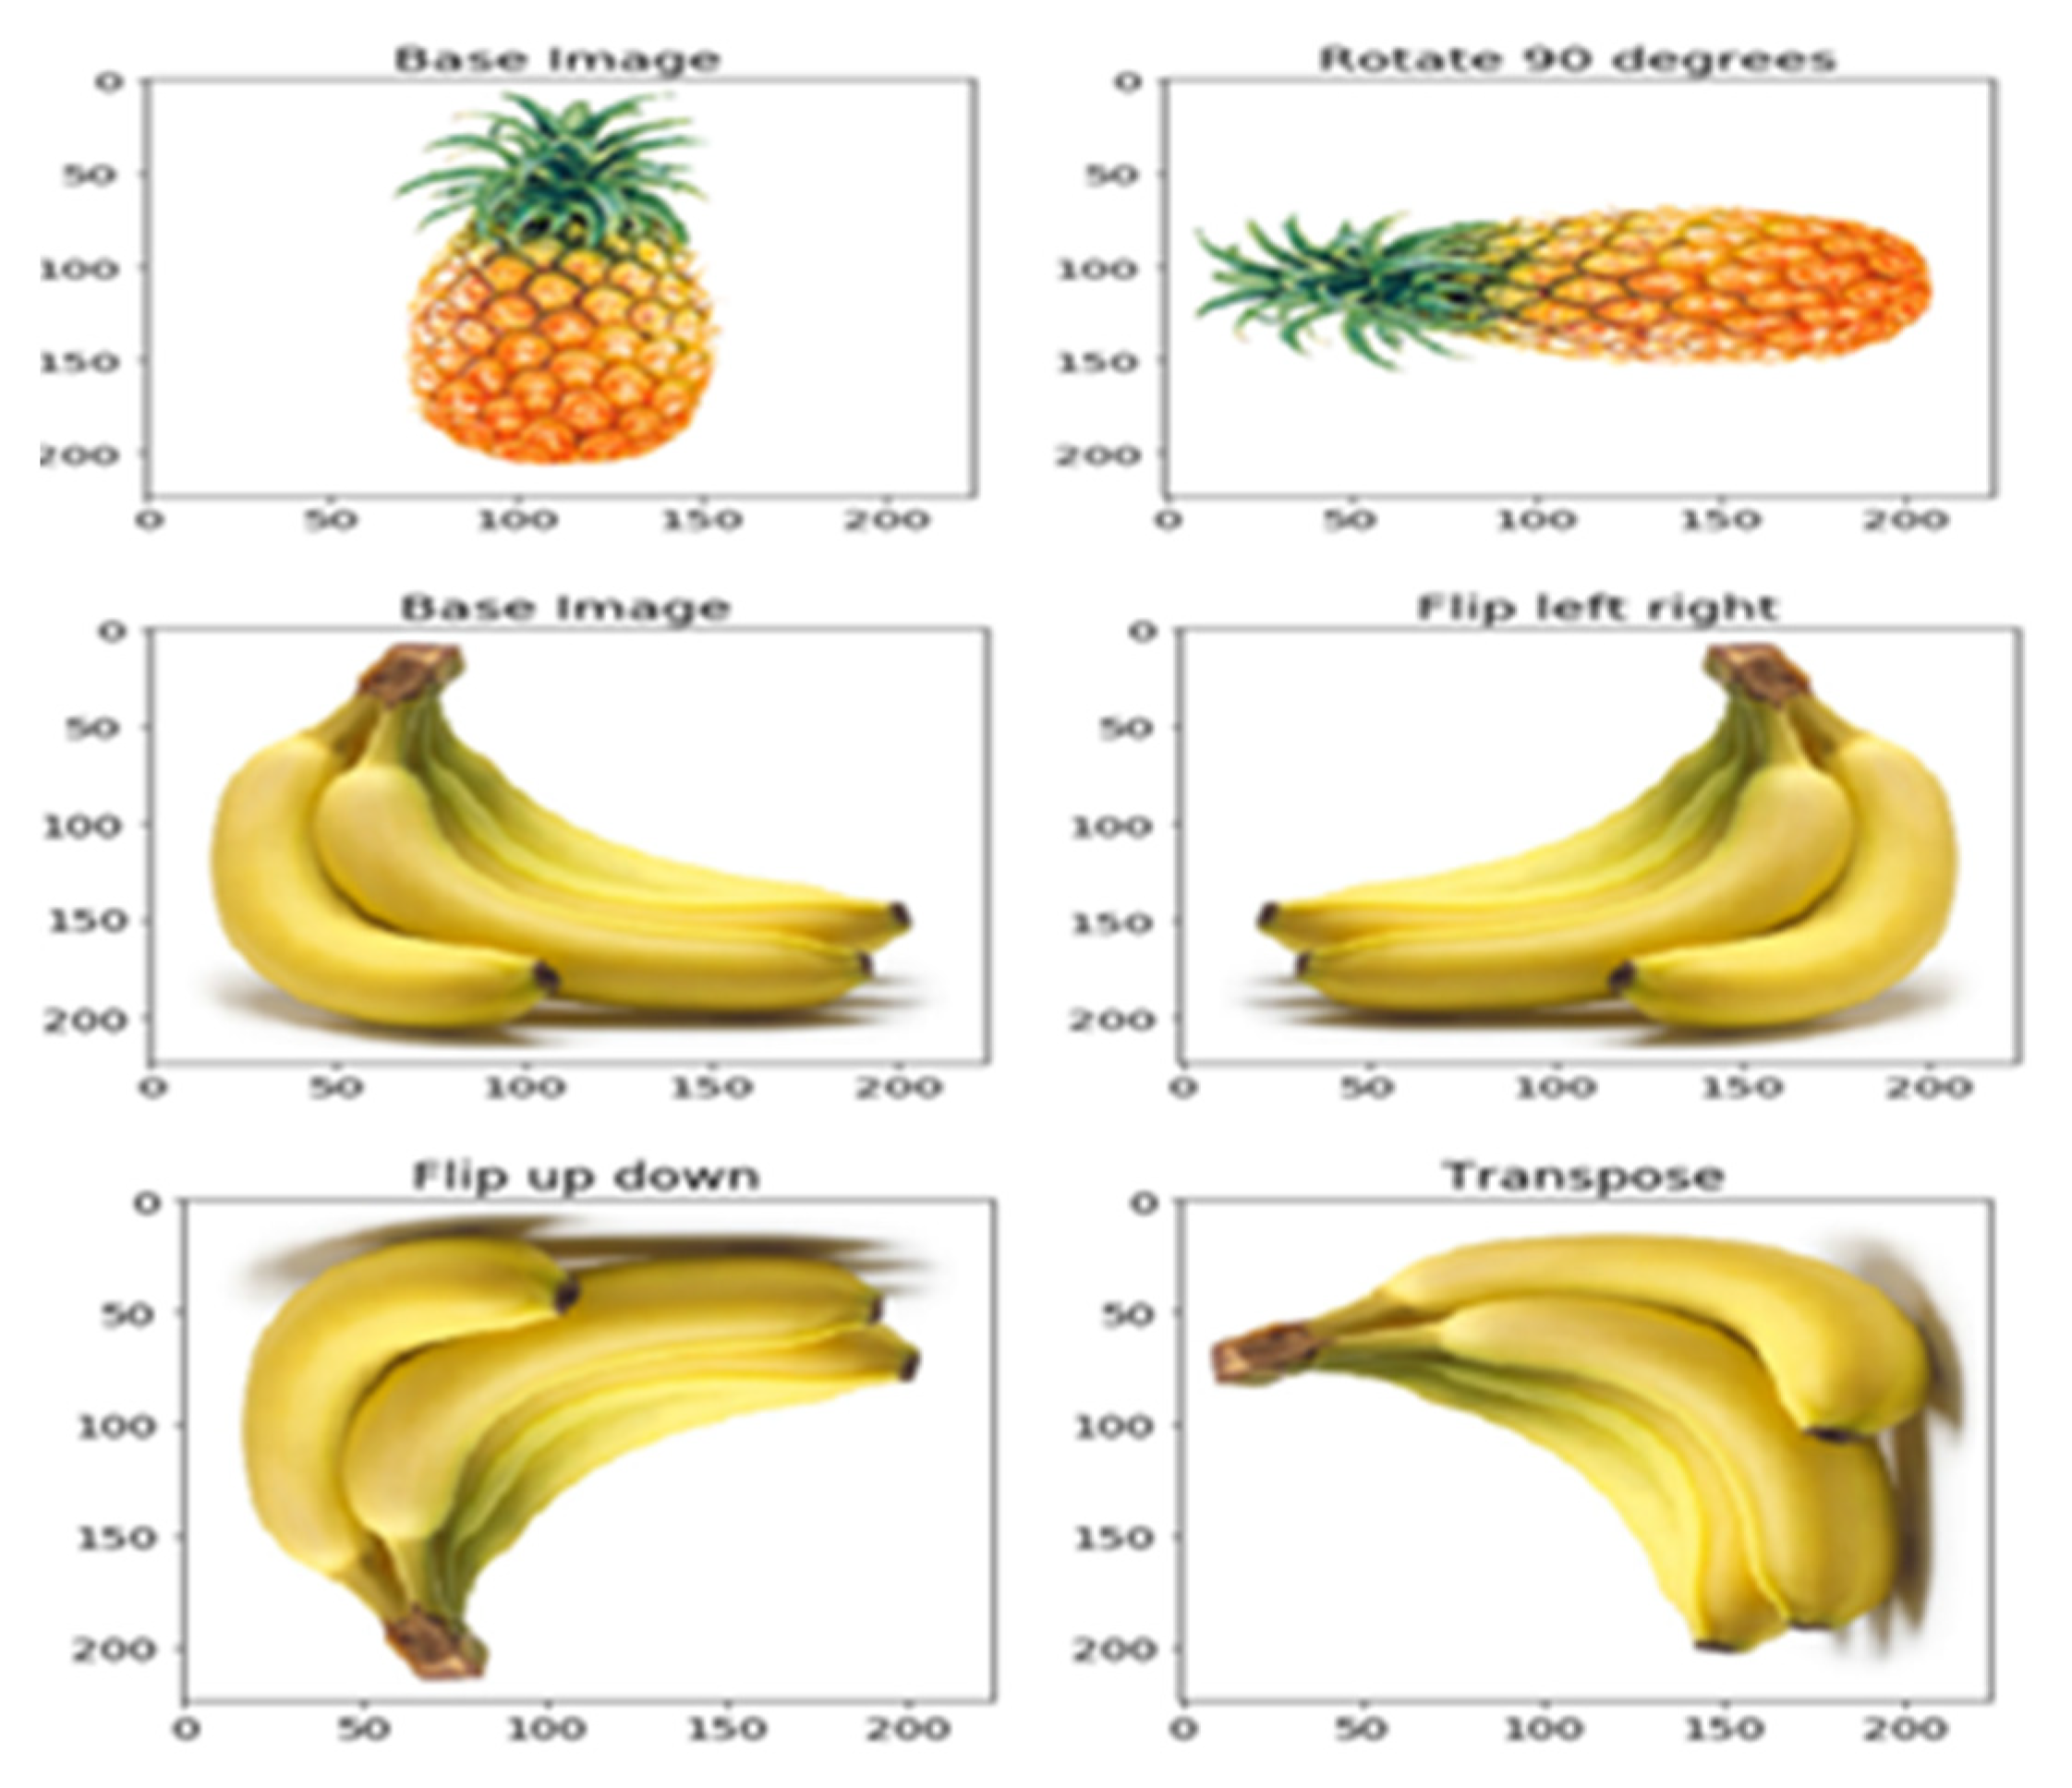
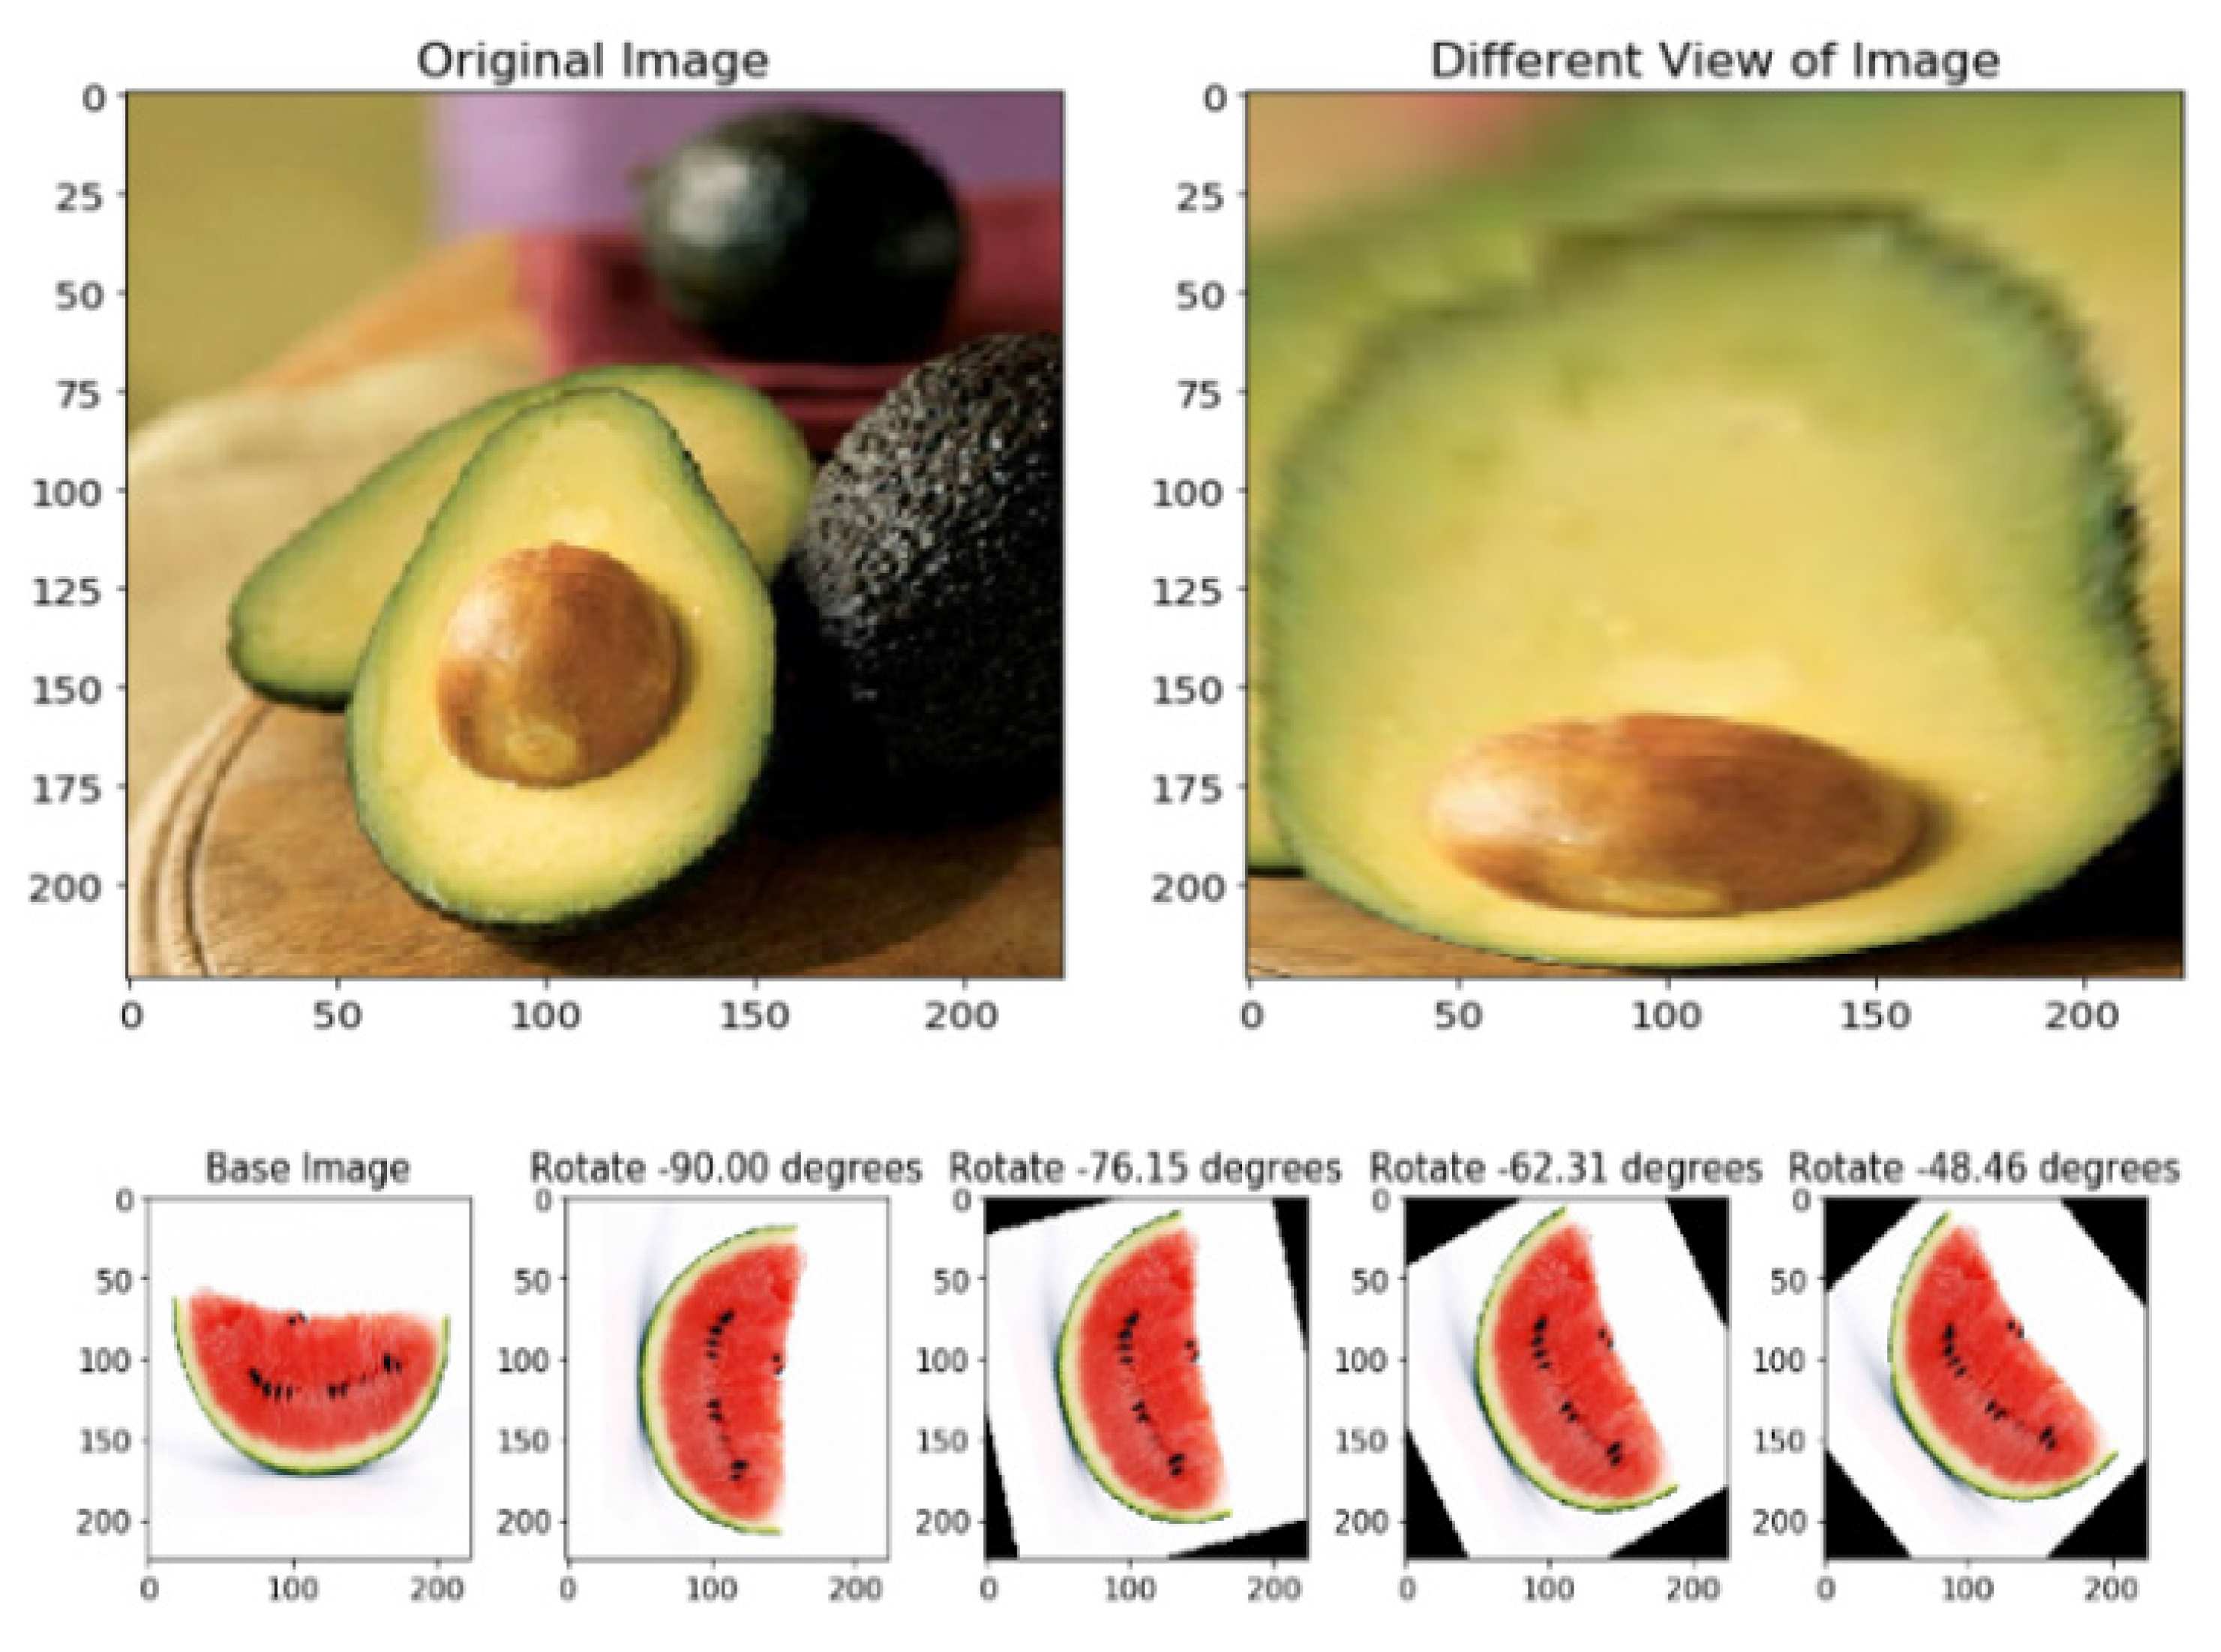
Therefore, by means of data augmentation, we randomly apply a series of simple transformations to the original image that allows us to generate new images, as we can see in
Figure 3 and
Figure 4. This way the model sees different versions of the same original image in each of the epoch used for its training. This step is necessary because the set of images must contain those transformations that may appear in real images. Otherwise, we would be worsening the model’s training with images impossible to find.
Figure 3 show a set of example modifications to base images we have used in this study. By doing this at each step, the model is able to detect the similarities between the transformed and base images and to learn to classify them as the same object.
2.3. Transfer Learning
In order to improve the result of the network, having only a few thousand images, it is necessary to use the technique of transfer learning. This technique allows us to use a network already pre-trained with millions of images to use their parameters as an entry point to add to our small data set. As explained above, in any convolutional network’s first layers the aim is to detect general features present in most images and then, the consequent layers, move on to locate more specific features corresponding to hose object we want to detect. By using pre-trained networks, we considerably reduce the training time of our model while maintaining all the knowledge acquired on those first layers. We then add our set of household images taken so that the network’s deeper layers can move on to detect those specific aspects relevant to our case study where the aim is to classify images within four groups of materials [
9].
The two ways of using a pre-trained network are:
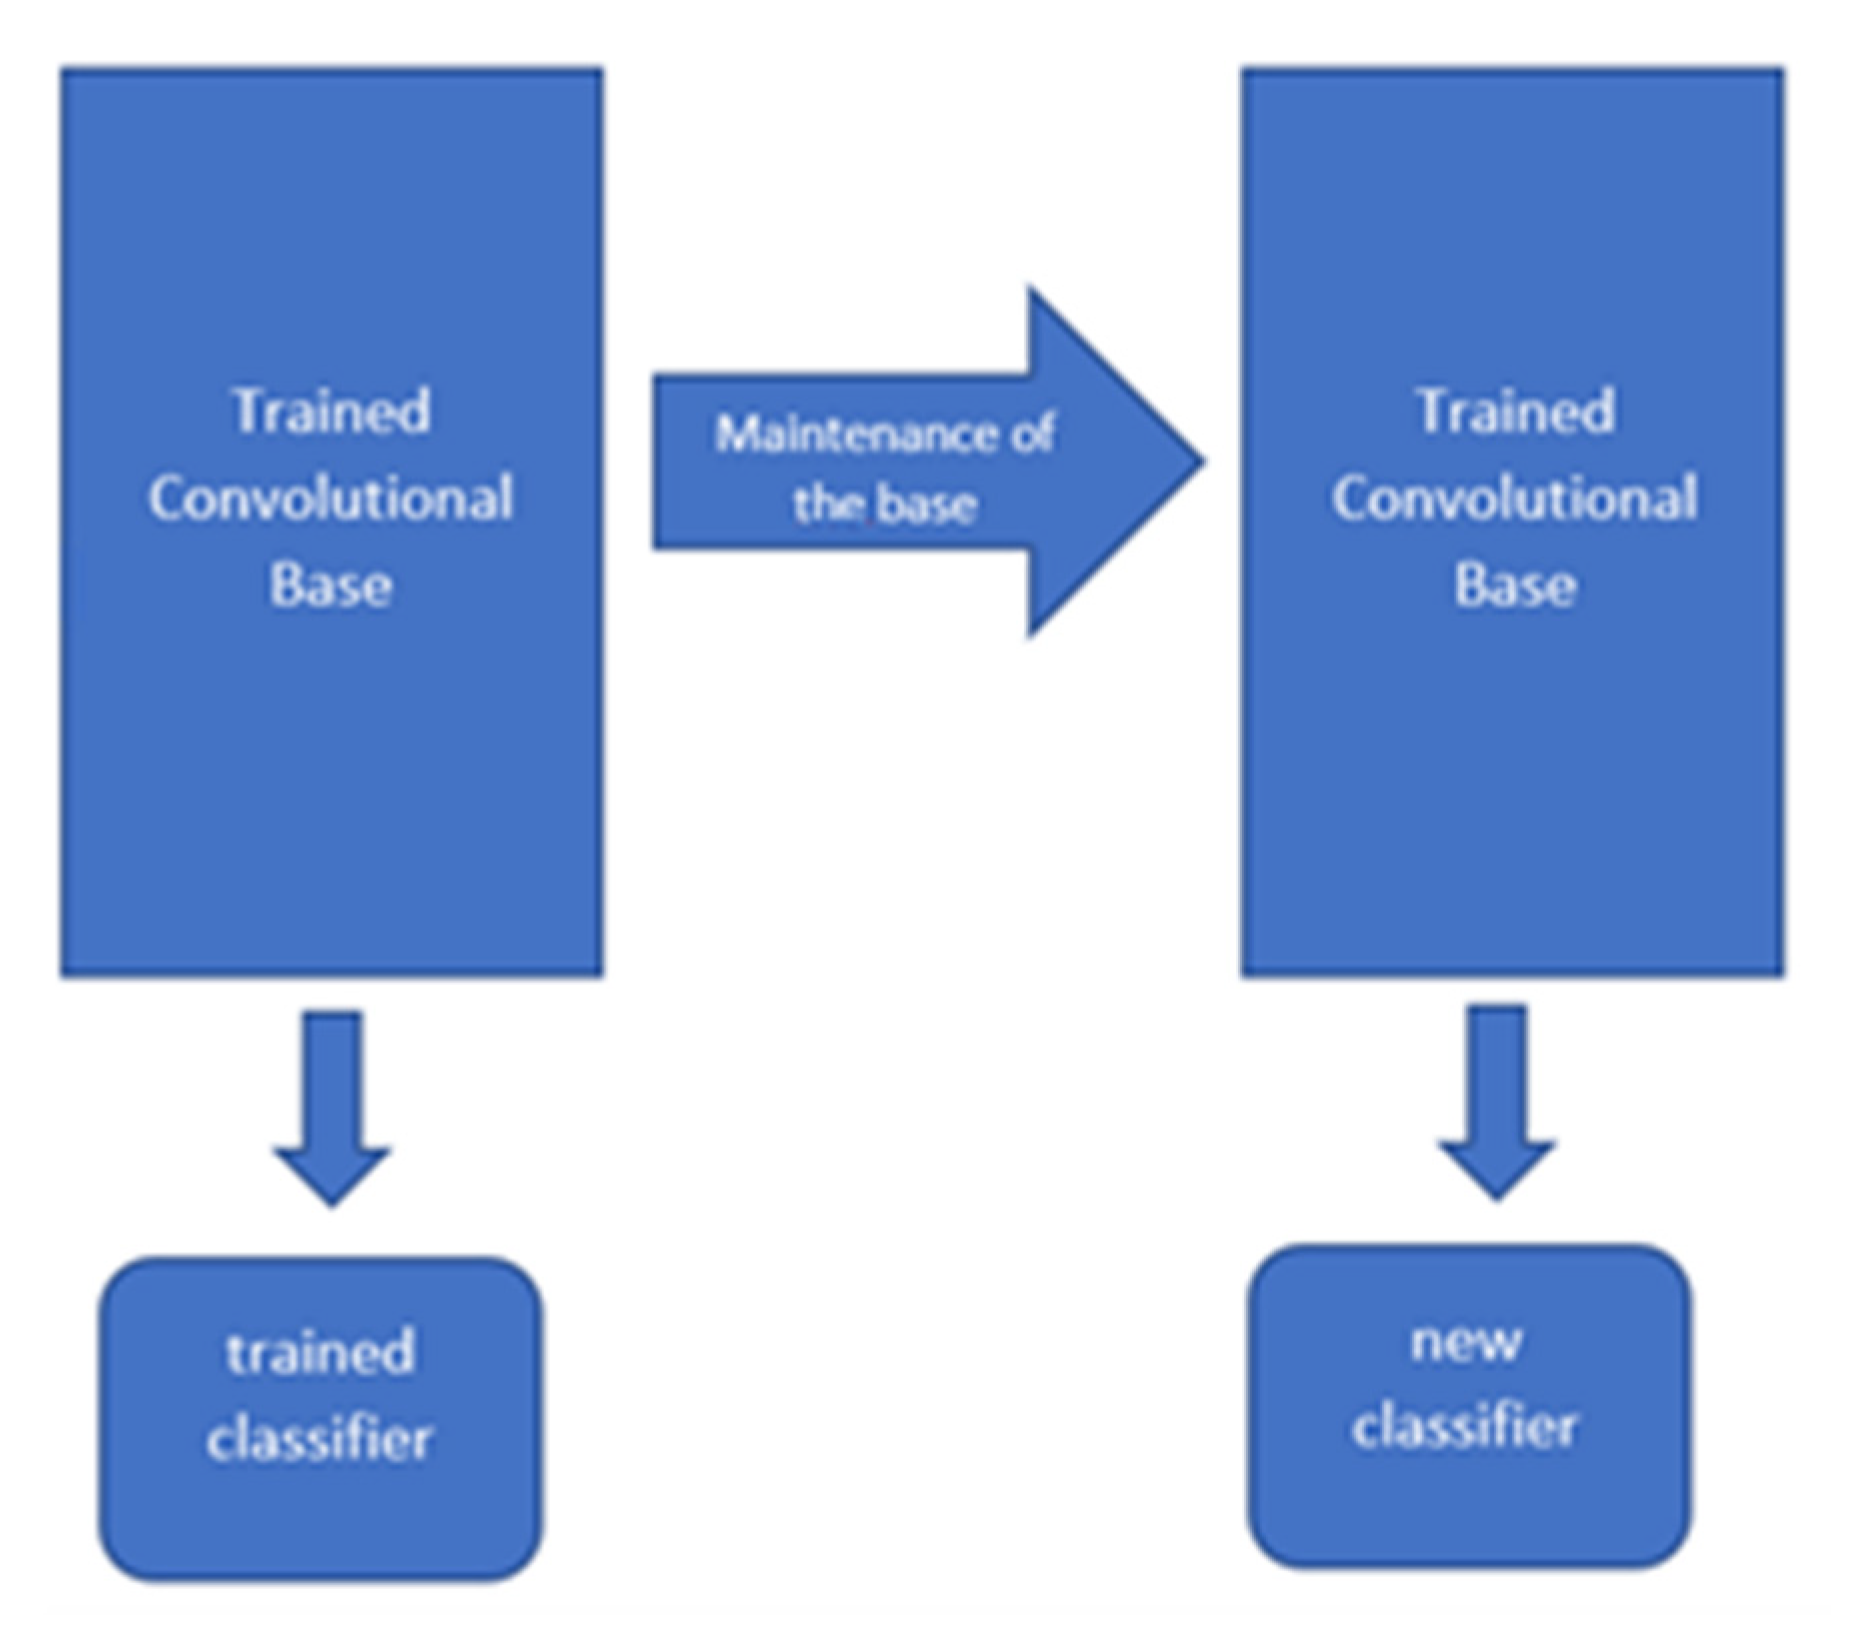
Feature Extraction: It consists of using the parameters already trained by the network itself to use the features in a new classification model trained from scratch. To achieve this, we must extract the convolutional base from the pre-trained one and add our own images to get a new classifier. A convolutional network can be divided into two different parts, the first would be the convolutional base itself and the second part would be the classifier itself. We could say that the pre-trained convolutional base would be left frozen so that the previously learned characteristics would not be modified as we can see in
Figure 5.
In the first step it would be necessary to load the data from the pre-entry network, indicating that the knowledge acquired in ImageNet will be used (ImageNet is a collection of more than 14,000,000 images grouped in different classes). In fact, the VGG16 network itself that has been used was entered with this data [
9].
As in other works such as [
26], the model will be trained not only with one, but with several types of networks: VGG-16, VGG-19 and ResNet15V2 in our case.
Theorem 8. Pre-trained network loading
from keras.applications import VGG16
conv_base = VGG16(weights = ‘imagenet’,
include_top = False,
input_shape = (150,150,3)).
In order to keep the learned data for the second part of the convolution, we must indicate in the code that we do not want to lose it, as shown in the ninth theorem.
Theorem 9. No loss of learned values.
conv_base.trainable = False.
In the next step, this somewhat trained network will add all our images to further specifying its learning. The advantage of this method is that it is no longer necessary to perform the convolution layers or maxpooling, so the training is much faster using all the features that the original VGG16 network has learned, thus optimizing the training process. We follow the steps of the technique described in Chollet [
9].
- 2.
Fine Tuning: In the final step, the last layers of the convolutional model are then trained to identify the characteristics of the images using our dataset, which trains both these last layers and the classifier. Since the first layers of the convolution are learning more general characteristics, we would not be interested in modifying them. However, this modification process would be done with the last layers of the convolution where we identify those features that are much more generic to our particular images, extracting much more abstract values. For this technique we must watch the learning rate used because, in the case of using a high value, it can alter the previous weights that came from the pre-trained network and lose important information to represent these features already pre-trained.
3. Results
Using deep learning techniques, specifically with convolutional networks, we were able to separate materials corresponding to the groups of plastic, glass, organic, and paper. As a review of all the methodology used, from the dataset created, different test scenarios were considered depending on the classification between different elements. As we already mentioned, data augmentation techniques have been also used to be able to enlarge the set of images and obtain better results. We then use the transfer learning technique. To improve the result and to be able to compare them, the pre-trained networks VGG16, VGG19, and ResNet15V2 have been used. The models VGG16 and VGG19 have been considered as they are the most used with this technique by different authors. This is collected in Simonyan & Zisserman [
27]. Finally, the ResNet15V2 has been used as one of the last models implemented and that allows us to compare results. Or Guo et al. [
28] by linking deep learning techniques in image recognition.
In order to evaluate these results, it is necessary to rely first on the accuracy that the network returns when training with both the training values, and the images used in the test phase. It should be noted that these images have not been used for the training of the network and are therefore new images. In addition, in each case the result for the confusion matrix is shown, which shows, for each case, the successes and failures obtained when verifying the test results. To do this, once we have the model trained, we use the group of test images to predict the correct value. In a confusion matrix we identify the following cases:
TP—True Positives: These are the number of true positives, that is, of correct predictions.
FN—False Negatives: They are the number of false negatives, i.e., the prediction is negative when the value should really be positive.
FP—False Positives: These are the number of false positives, that is, the prediction is positive when the value should really be negative.
TN—True Negatives: They are the number of true negatives, that is, of correct predictions for the class.
To calculate the confusion matrix, we will use “
Predict_generator”, a Keras function that evaluates the obtained results. This function will need to have input regarding what data is it to use to verify the model, and also the number of cases it needs to verify.
Figure 6 shows the results we obtain when applying the “
Predict_generator” function to our model and testing data. This matrix shows the successes and failures in the evaluation. The results are presented for the four groups of materials analysed with the first, second, third and fourth rows referring to detections of paper, plastic, organic material, and glass, respectively. In addition, for each specific case the classification report is shown, indicating the percentage of success for each of the classes and the number of tests carried out, which is also shown in
Figure 6.
Below, we present the results achieved in each of the scenarios:
We obtain 97% with VGG19 in the training and 98% in the test.
Compared with works such as [
29] or those published by [
30] where similar techniques have been used, the model trained in this study with VGG-19 obtains almost perfect values both in training and in testing, when distinguishing materials between plastic and organic.
- 2.
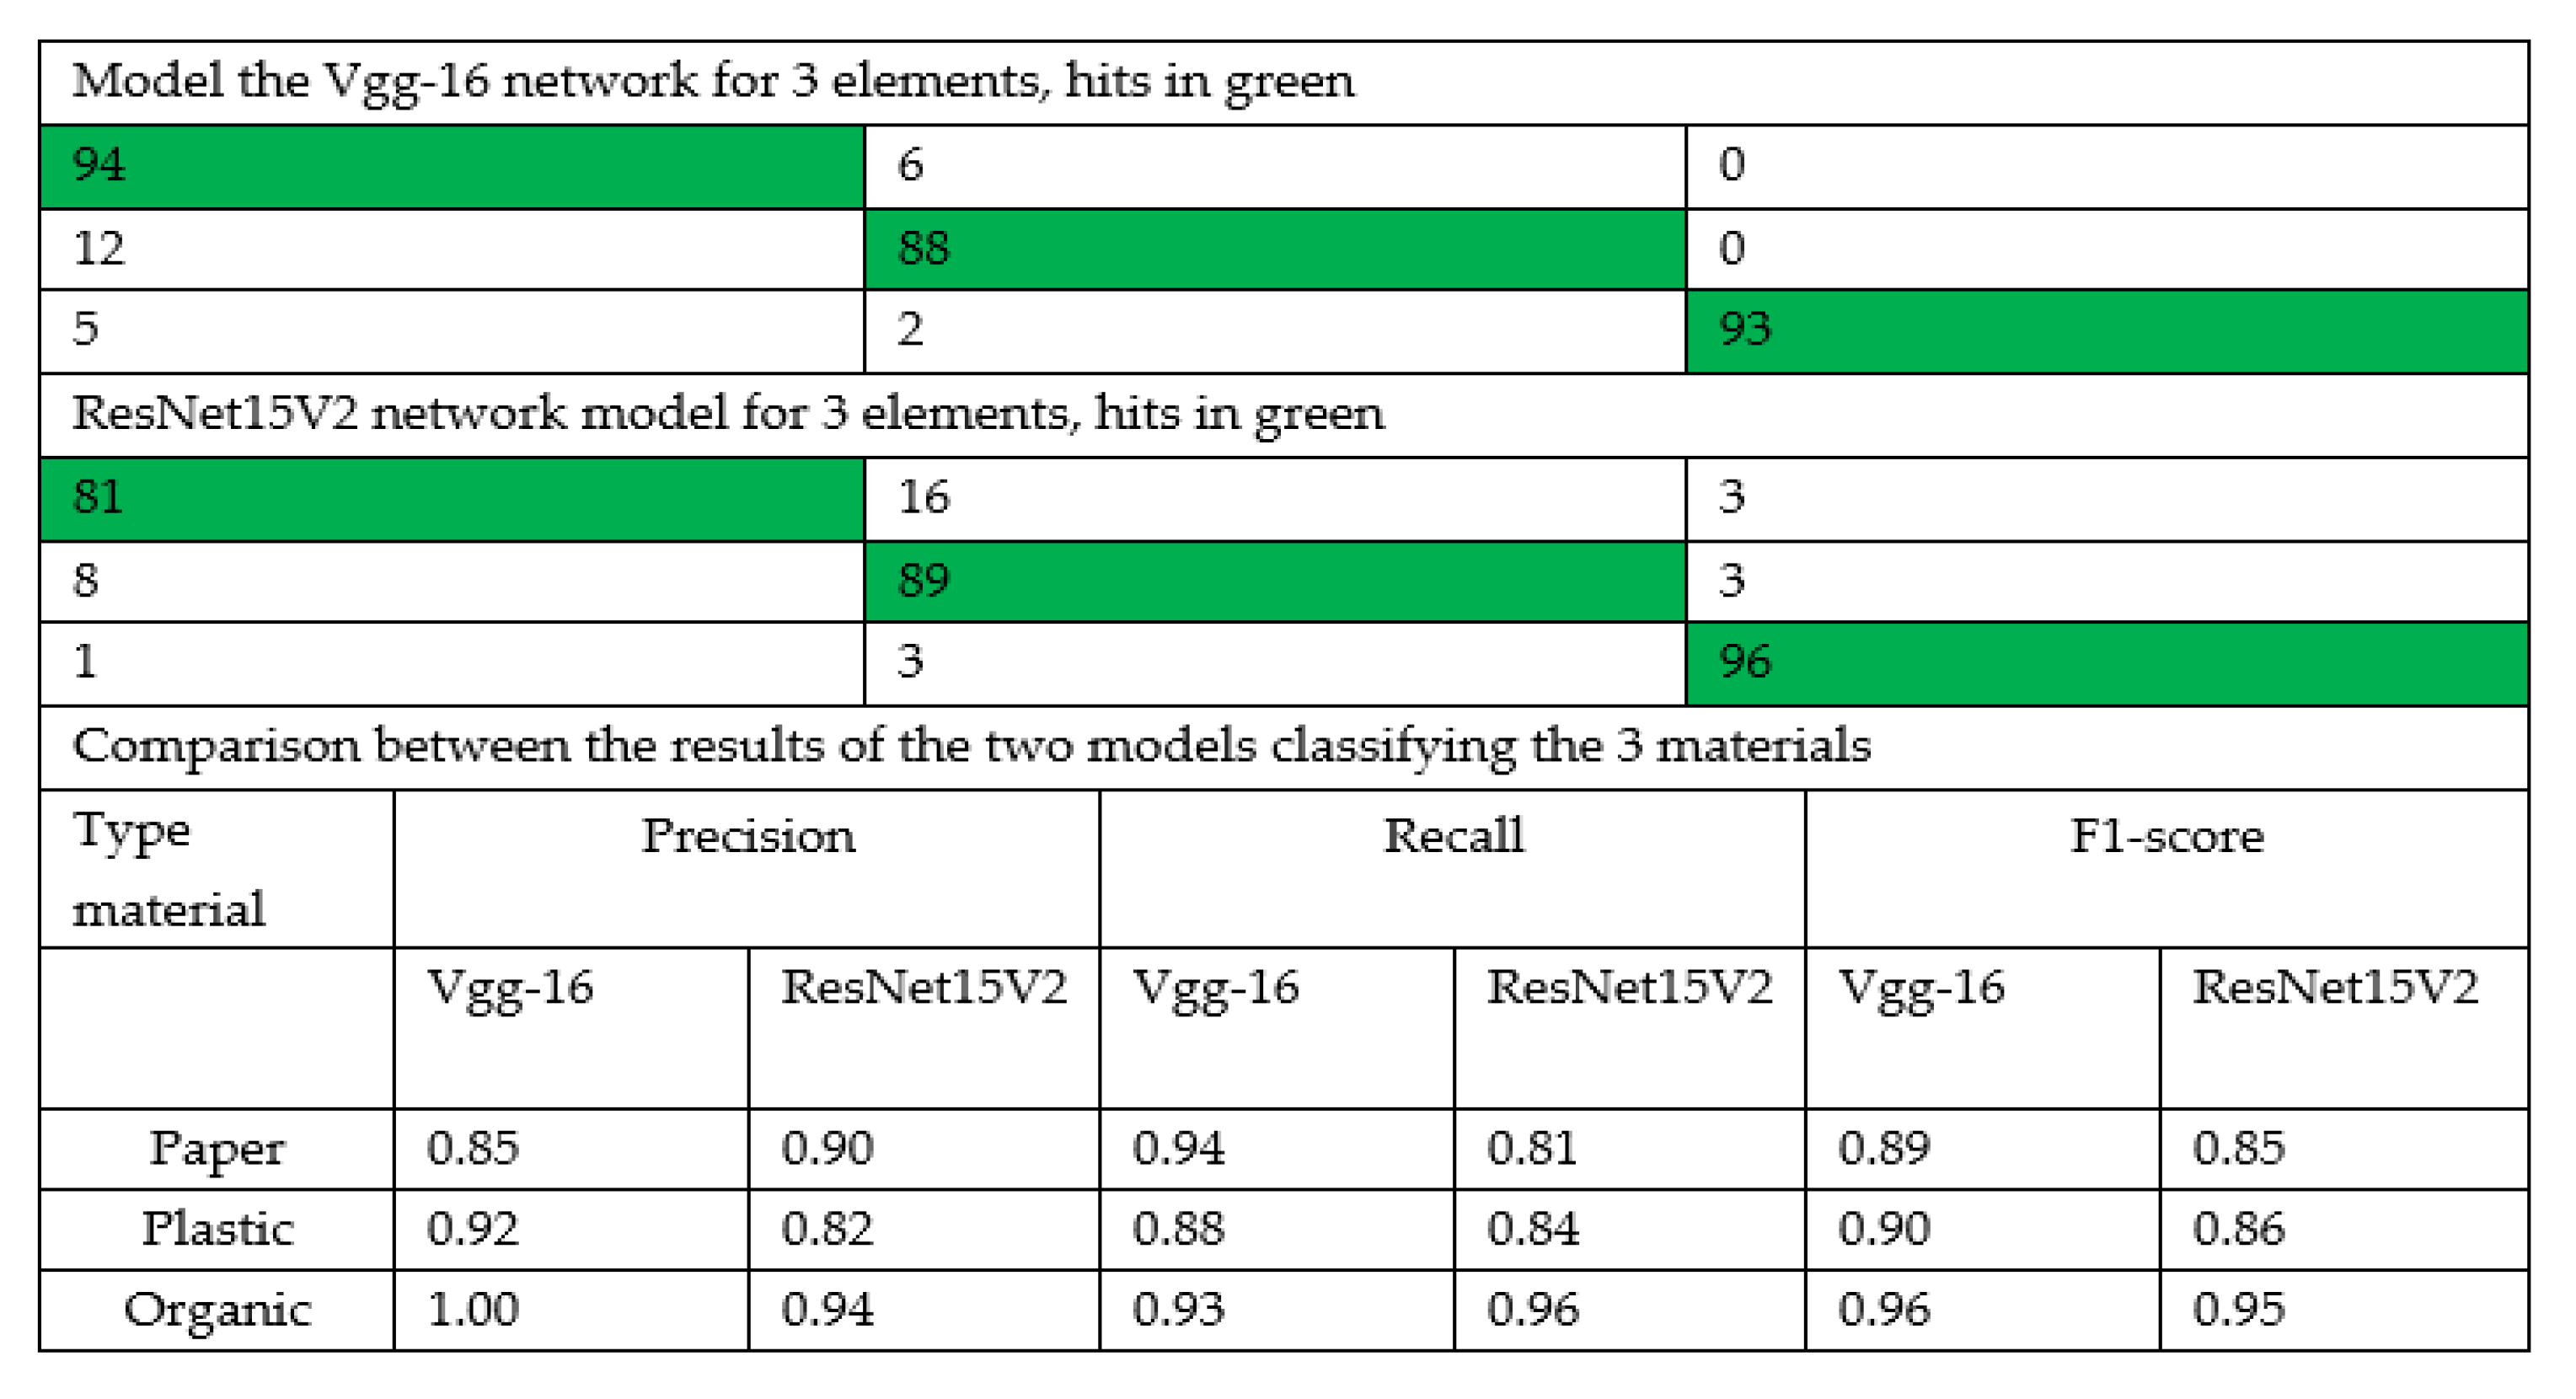
Classification with three types: Paper, plastic, and organic.
The analysis in this case shows that when applying VGG-16 we obtain results with a reliability of 92% in the test (88% in the training), while, when using Resnet15V2, we obtain results with a reliability of 88% in the test (88% reliability also in the training). As the number of possible materials increases, it becomes clear that the reliability achieved with the image set is lost when comparing in pairs. We can then compare the models used from the data reached after evaluating the image test group. As we can see in
Figure 7, Vgg-16 model is the one that offers the best classification results (in organic matter practically 100% of the materials are identified). The results of ResNet15V2 are shown in
Figure 7.
- 3.
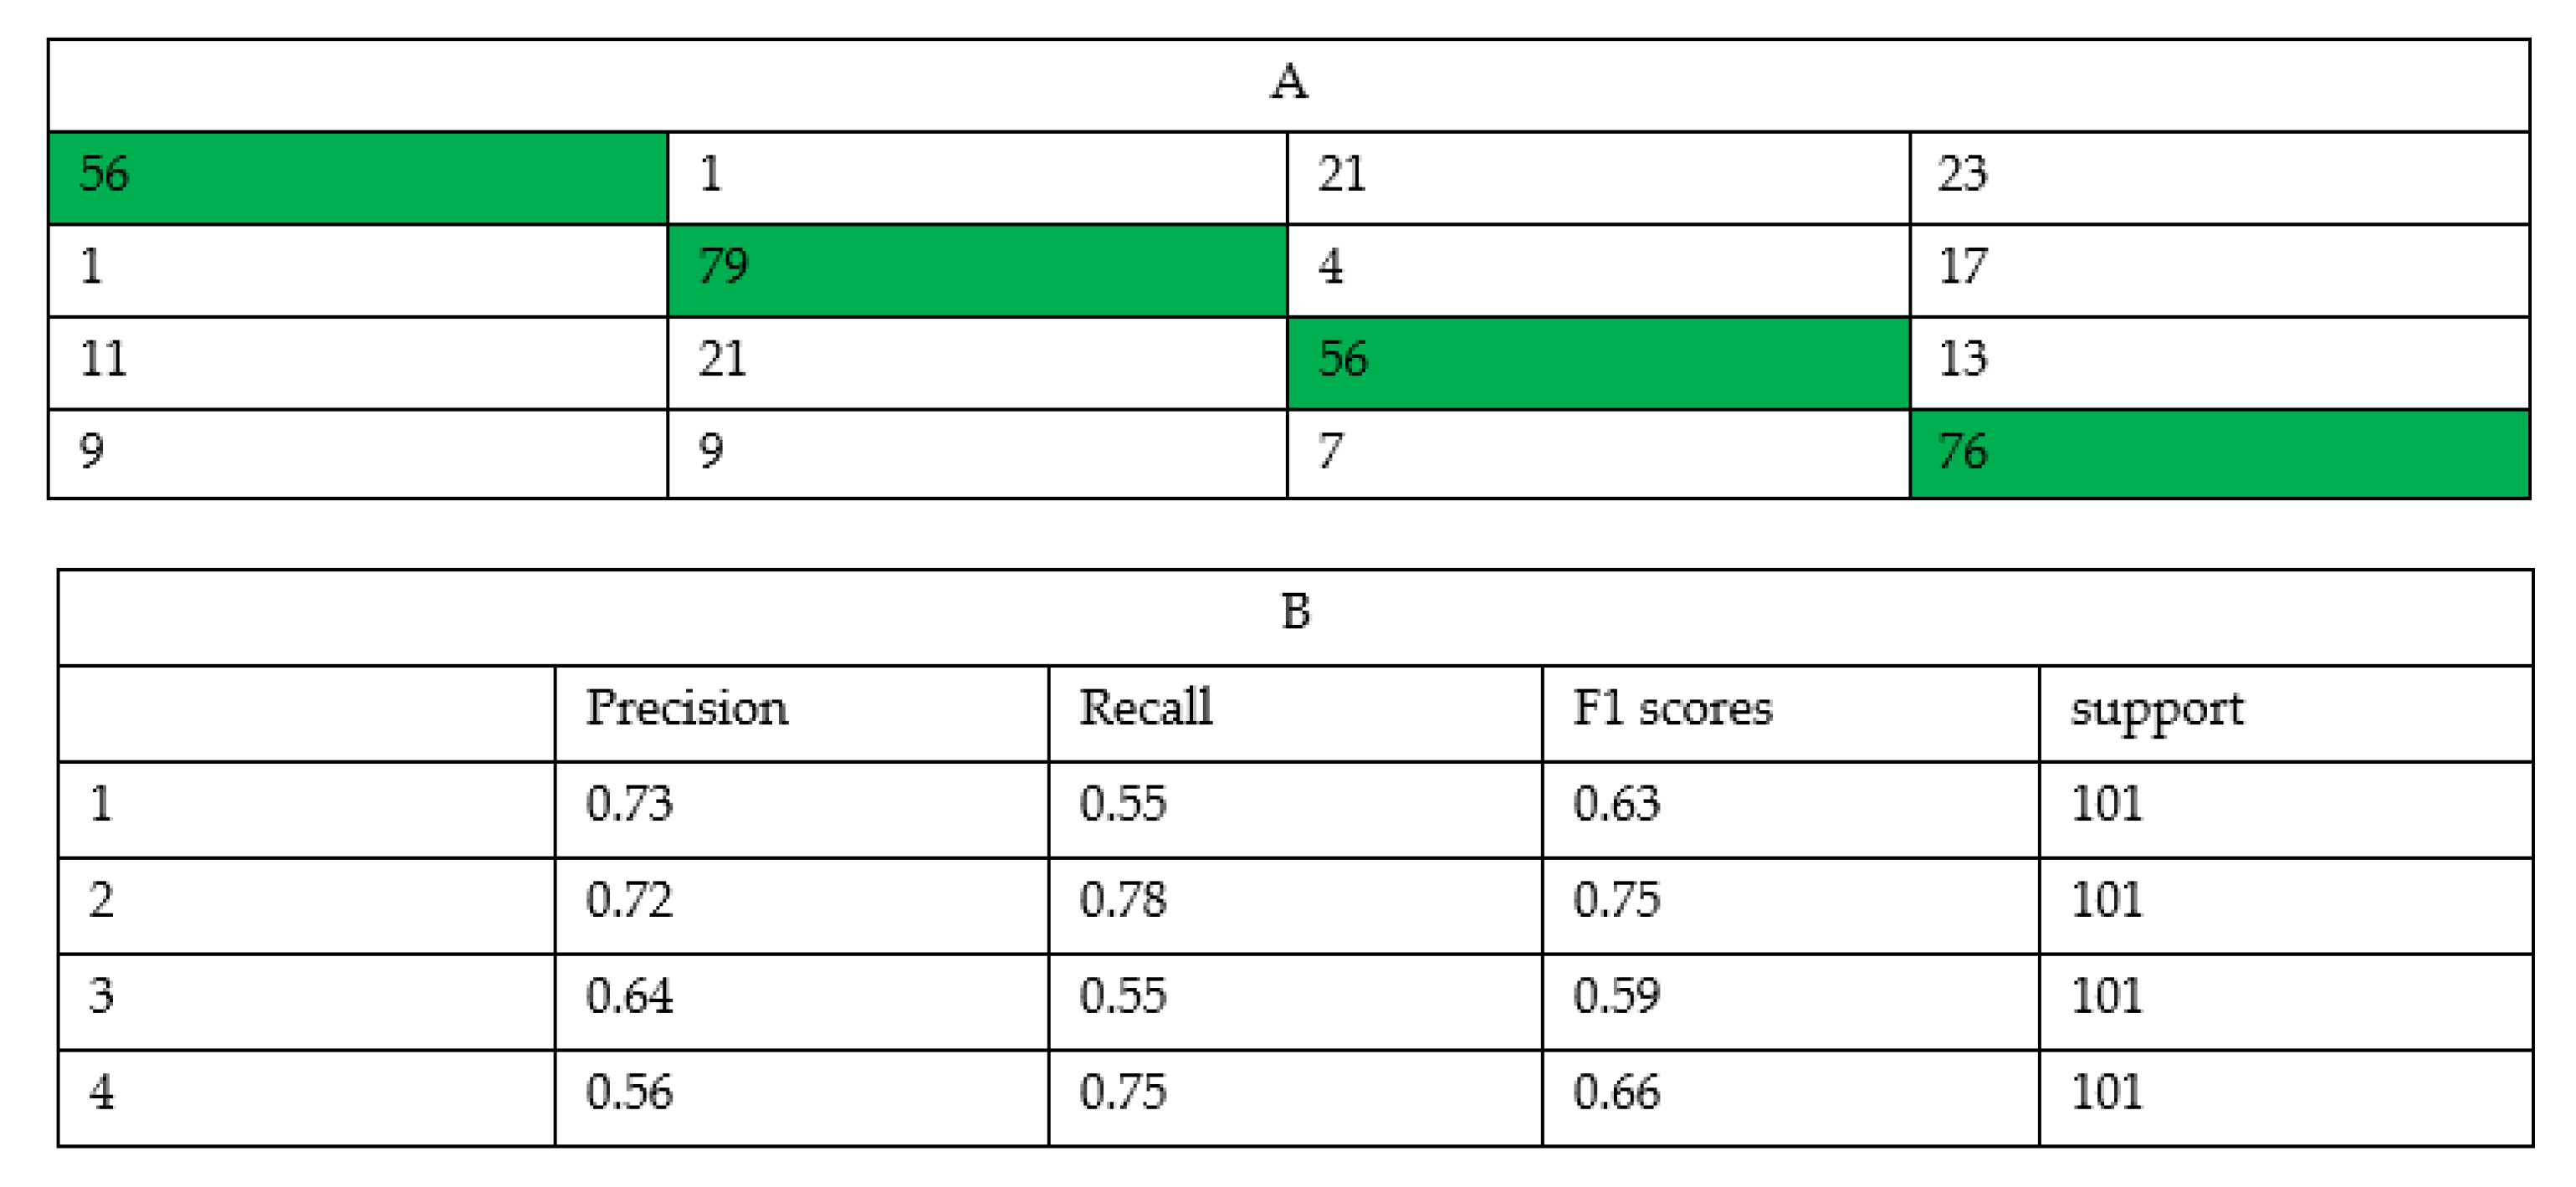
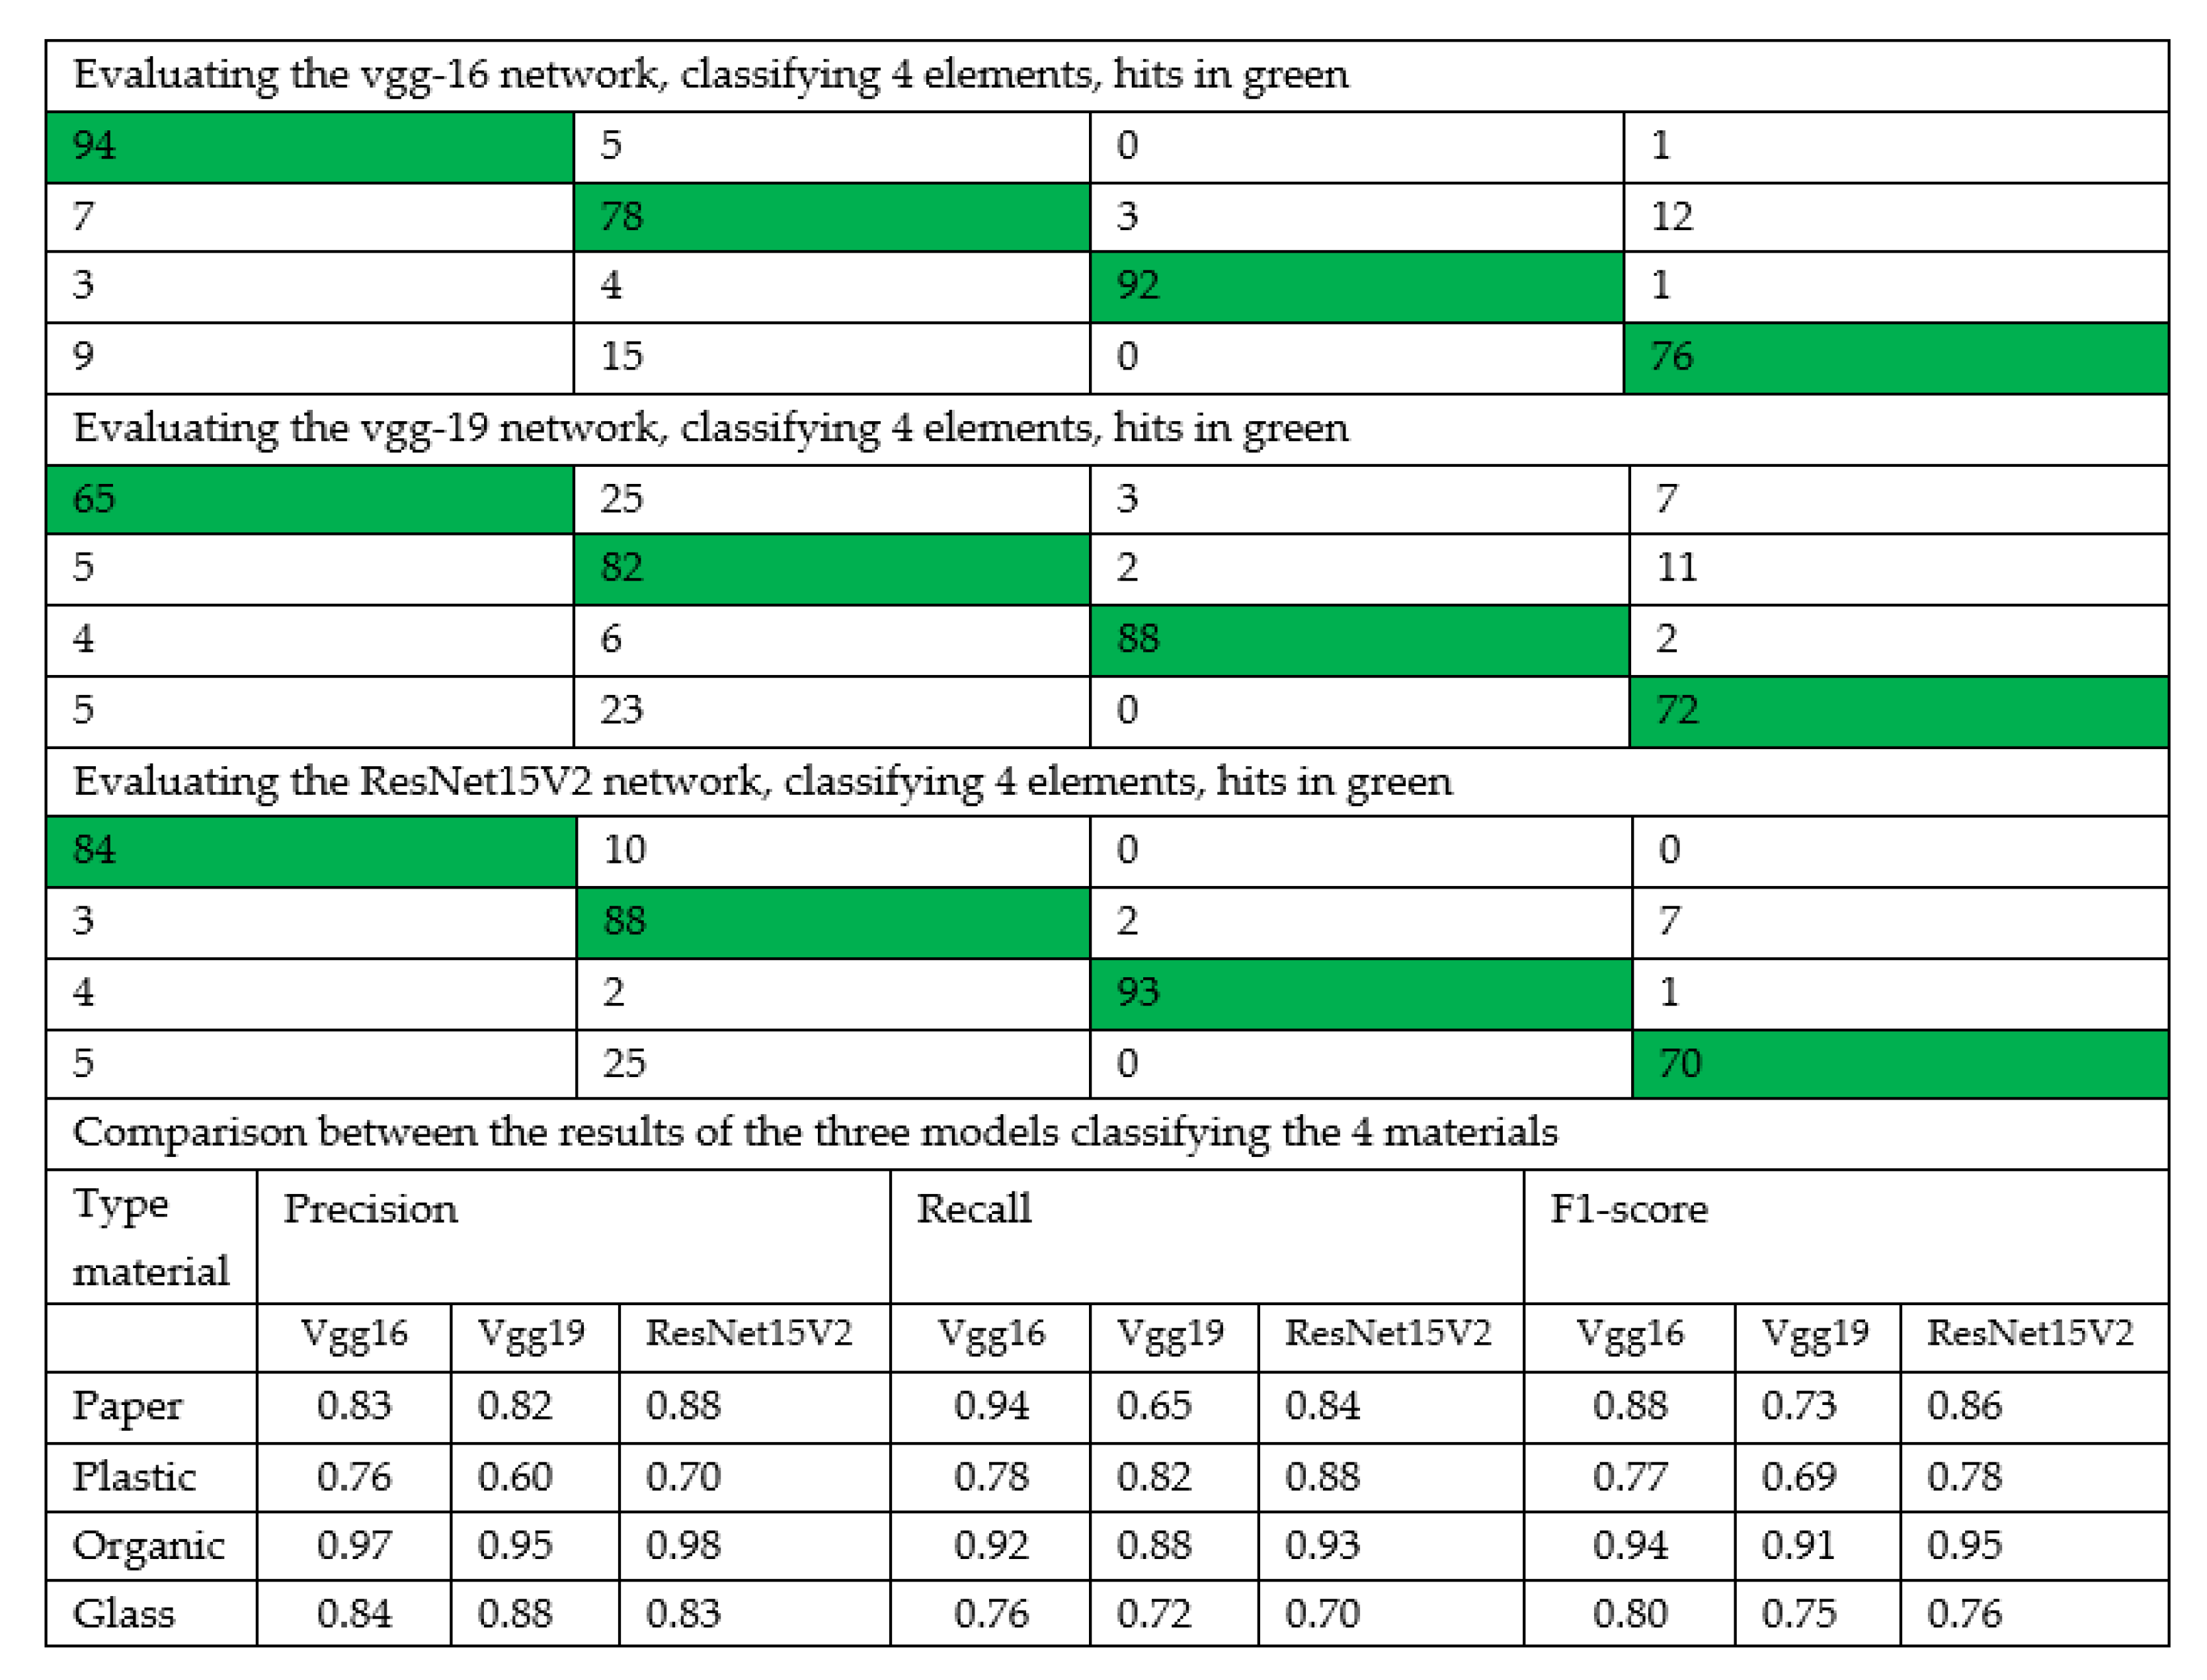
Classification four types of materials: paper, plastic, organic, and glass.
The results in this case show again that, increasing the number of different materials reduces the reliability of the model, although the ranges close to 85% reliability are still much better results than the current classification values. Using VGG16 we obtain a reliability of 85% in the test (84% in the training); Using VGG19 we obtain a reliability of 77% in the test (78% in the training); and finally using Resnet15V2 we obtain a reliability of 84% in the test (and also 84% in the training). In our matrix results 97% of the organic matter is correctly classified. The result for the paper (84%) is also very good. The main problem of the model is the classification between plastic and glass. There are plastic bottles that are very similar to glass bottles and the model has problems recognizing them.
Evaluating the results of the Confusion Matrix of the different models, the model implemented using Vgg-16 network is the one that offers the best results overall. As in all previous cases, it should be noted that 97% of organic matter is correctly identified consistently across all the cases tested. This is shown in
Figure 8.
In the Confusion Matrix shown here for the three models, we can see that the values in the identification of glass must be improved since in many cases it is mistaken for plastic and vice versa. Mainly this problem occurs with plastic bottles.
As a general result, training our model using VGG-16 and evaluating the test values, we obtain in all cases a minimum of 85% reliability. This value is much higher than the rates currently reported in previous studies for the classification of materials. On top of this, it should be noted that in the current system, which lacks automation, it is estimated that approximately 20% of the material has been classified incorrectly, so the margin of improvement is, in fact, considerable. Similarly, the following aspects can be highlighted by comparing the results with the previous studies mentioned:
The set of images used are “home-made” images obtained with common cameras widely available to the public.
In our study, we considered paper and cardboard within the same group. In plastic we also grouped the metal packages.
We add organic waste to the categories of material considered, which is an essential improvement.
The training phase of the different models has been consistently fast, with none of them exceeding 100 epochs.
Specifically, the trained model can correctly identify between plastic and organic material with a reliability of 97% of the training cases and 98% of reliability for the test cases. The VGG-19 network has been used as it is one of the most used to classify images. In the case of considering three materials, the use the VGG-16 network provides a reliability of 85% for the correct detection of paper, 92% when identifying plastic, and 100% when detecting organic material. Using the ResNet15V2 network, the obtain reliabilities of 90% in the case of detecting paper, 82% for plastic detection, and 94% for organic material.
When considering four materials, the results we obtained are as follows:
Using the VGG-16 network, we obtain reliabilities of 83% for the detection of paper, 76% for plastic, 97% when detecting the organic material, and finally 84% when detecting glass.
Using the VGG-19 network, we obtain reliabilities of 82%, 60%, 95%, and 78% when classifying paper, plastic, organic material, and glass, respectively.
Finally, using the ResNet15V2 network, the reliabilities obtained are 88%, 70%, 98%, and 83% for the correct classification of paper, plastic, organic material, and glass, respectively.
4. Discussion
As we have shown in the study, by means of convolutional networks we can identify and classify the images so that the classification of the materials among glass, paper, plastic, and organic matter can be done automatically [
31]. The next step would be to ensure that each identified element is classified where it belongs.
There are many published works that highlight the benefits of recycling organic matter. In particular, Ref. [
32] shows the possibilities of this second life once the organic material has been recycled. Other studies focus on the benefits of this reuse of organic matter for cultivation systems [
33]. Additionally, important are the scientific works that relate this reuse with the generation of energy from biomass [
34]. Specifically, in the work of [
35], the authors relate it to biogas production, and also consider it as a global alternative energy source [
36]. From this, our work would serve to enhance the benefits of generating natural fertilizer and not using chemical fertilizers. This perspective has already been considered in different academic publications [
37], and in works by authors such as [
38]. Ref. [
39] have also followed the same line in their studies on soil chemical properties.
The results obtained for the classification of glass are also important since, as stated by [
40], after recycling, the new material maintains 100% of its qualities. By facilitating the recycling of paper and cardboard, among other improvements, we could positively impact the reduction in the felling of trees attached to the generation of these materials. This point has already been addressed in the work of [
41]. The results of our study present percentages of validity similar to those reported in other studies such as [
42] on convolutional neural networks for Tomato Ripeness Detection in Agricultural Sorting Systems where they achieve 96% accuracy, or also [
43] where they achieve an accuracy rate for detection and classification of 99.31%.
Steps to be followed from this study should advance towards a model of large-scale automation in the process of separating materials that would significantly increase the amount and suitability of recycled material. Currently there are already academic studies focusing on the development of robots that can make such classification [
44], or those that applying deep learning techniques in the automation of the process [
45], and even applied to agricultural policy, undoubtedly affecting sustainability [
46]. As indicated by [
47] “gain environmental, energy, and economic benefits” or [
48] “the important role of consumers in circular economy business models through the examination of consumers’ acceptance of recycled goods”, this system allows automatic and individual recycling; and as shown by the study of [
49] this recycling can even help convert waste into energy. A circular economy based on the self-recycling of elements that today are wasted and thrown directly into the garbage can be very positive if combined with other measures in favor of the environment such as incentives for low polluting vehicles [
50], new and more sustainable ways of transportation [
51], which will undoubtedly result in a better welfare state [
52].
As a summary and conclusion of the proposed model, we could prioritize the next steps to be taken:
Give accessibility to the model to develop it so that from the camera of any technological device is possible to classify and recycle correctly. We can use
https://teachablemachine.withgoogle.com/ to generate the model developed in this study.
We have created a website where we can validate the model created
https://www.reciclamaterial.online/ where when one person activates the camera, the model classifies the materials that are shown. This model would be valid as an informative tool or for schools.
From the data obtained, we need to improve the model so that it is possible to identify/distinguish/classify the four different types of materials in one single image taken by the user.
Create a much larger set of images to be able to train our model in order to achieve a higher level of accuracy.
Automatically detect and further classifying the objects in the image into materials that should be treated before final recycling, or those that are directly reusable.
Finally, as we have already explained, robotize the process of physical classification.
5. Conclusions
The results presented in this study show that there is significant room for improvement when it comes to correctly distinguishing between plastic and glass, since glass objects are easily confused with plastic ones. However, we have also found that with a small set of images (~1000) and thanks to the application of the transfer learning method we can make this classification with values close to 90% reliability. These results have a level of success much higher than those currently achieved by people, more if possible, considering that the current system has about 20% of elements that have been recycled incorrectly.
With an automatic system we could considerably increase the reliability of the recycling process, as well as the total percentage of material recycled. As mentioned in the introduction, currently the recycling percentage of packaging (in Spain we refer and in the year 2018) is around 78.8%. Of this percentage, 85% is collected from municipalities but only 15% comes from environments such as events, offices, or airports. It is precisely in this small percentage of 15% where this work can make a significant difference. Using our model with 4 classifiers, we could go from that 15%, to a minimum of 85% of correct classification reliability.
As stated in the European guidelines included in the Spanish Strategy for R + D + I in artificial intelligence under the point Natural Resources, Energy, and Environment, all the classification criteria and the results developed in this work fall within the objectives to be met by the European Commission’s Agenda 2030.
A future circular economy must start from the premise that it is necessary to be able to detect and classify the materials in the same image, so that later, with the help of a robot, each material can be separated and deposited in its proper container. Additionally, advances in any technique that make it possible to differentiate between those materials that can be cleaned for reuse and those that can no longer be reused, will have a very positive impact on recycling and the circular economy, providing the chance of a second life to many items that are nowadays discarded. Intelligent waste systems that allow us to automatically separate materials in an appropriate way, differentiating between non-reusable and reusable material, have a great future ahead of them.


 ,
, 


