
Social Sustainability of Compact Neighbourhoods Evidence from London and Berlin

School of the Built Environment, Headington Campus, Oxford Brookes University, Oxford OX3 0BP, UK
*
Author to whom correspondence should be addressed.
Sustainability 2021, 13(4), 2340; https://0-doi-org.brum.beds.ac.uk/10.3390/su13042340
Submission received: 10 February 2021
/
Revised: 17 February 2021
/
Accepted: 18 February 2021
/
Published: 22 February 2021
(This article belongs to the Collection Social Sustainability and New Urban Residential Spaces)
Abstract
:This article revisits social sustainability of compact urban neighbourhoods based on first-hand evidence from four case studies in London and Berlin. It suggests a working definition for socially sustainable neighbourhoods, develops a tripartite integrative evaluation framework for measuring social sustainability of urban neighbourhoods, and applies it to four case studies in London and Berlin. Findings of this research are in line with some dominant arguments made in favour of social sustainability of compact urban form, but challenges some others. Research findings suggest that compact urban form is not an urban orthodoxy, but has multiple and contrasting social meanings and perceptions in different contexts and places.
1. Introduction
Debating the most appropriate urban form for cities and communities has been a long-standing scholastic question. In recent times, a major strand of this discussion became dominant, which emphasises the benefits of compact environments in providing better conditions for their inhabitants [1,2,3,4,5,6,7,8,9,10,11,12,13]. This approach gained significance from the late 1980s, as the sustainable development discourse became a mainstream urban policy. Following the tripartite formulation of sustainable development as the meeting point of economy, ecology, and equity (society), achieving greater sustainability of urban form which brings together the three domains has been an important quest for academics, practitioners, and policy-makers. While a large number of research studies have provided evidence regarding contribution of compact urban form to urban sustainability [3,14,15,16,17,18,19], others have disputed the compact urban form orthodoxy [20,21,22,23,24,25,26,27]. Nevertheless, considering the appeal of the compact urban form orthodoxy for providing seeming policy solutions, policy makers and local authorities across the world integrated densification schemes into their planning and development policies [15,28,29,30].
Social implications of urban form in general, and social benefits of compact urban form in particular, have been investigated within social sustainability discourse [31,32]. Although different definitions of social sustainability are available, it has revolved around some key concepts such as cultural diversity [33,34], sustainable future [35,36,37], quality of life [38], fair distribution of urban goods [15,39], individual and collective well-being [40], equity and democracy [41,42,43,44], and spatial equalities [45]. To understand what type of urban form promotes socially sustainable cities and communities, scholars have investigated the correlation between urban form typologies and social sustainability indicators [15,33,36,37,39,40,41,43,44,46,47,48,49,50,51,52,53]. This body of research suggests that higher densities make urban facilities more accessible [16,47,54,55], encourage people to frequently meet each other [56], enhance sense of community [57], create a more diverse, inclusive, and liveable environment [58], and offer a higher quality of life for the citizens [59], and thus enhance social sustainability of communities.
Despite these scientific endeavours, it has been widely argued that more scientific investigations and empirical evidence from across the globe are needed, to gain a fine-tuned understanding from the relationship between compact urban form and social sustainability on the one hand [1,60,61,62], and further develop debates on social sustainability and its significance for the built environment, on the other [35,47,63,64,65,66,67].
This article aims at revisiting social sustainability of compact neighbourhoods based on first-hand evidence from four neighbourhoods in London and Berlin. To achieve this goal, it first suggests a working definition for socially sustainable neighbourhoods and develops a tripartite integrative evaluation framework for measuring social sustainability of urban neighbourhoods. This framework is applied to four urban neighbourhoods in London and Berlin. Findings of this research are in line with some dominant arguments made in favour of social sustainability of compact urban form, but challenges some others. At the ends, research and policy implications of the findings are discussed.
2. Methodology: The Triad of Social Sustainability; An Integrative Evaluation Framework
Scholars have studied social sustainability of the built environment [40,41,52,68,69,70,71,72,73]. These studies provide us with four valuable insights in order to develop an integrated framework for measuring social sustainability of urban neighbourhoods. Firstly, social sustainability is multi-scalar; it can be measured and operationalised for multiple scales from the local to the regional and beyond [31]. This suggests that measuring social sustainability should take into consideration relevance of suggested criteria to the given geographical territory. Secondly, social sustainably frameworks include a set of indicators that are measured using different qualitative or quantitative methodologies [47,52]. Thirdly, although we find a plethora of definitions and conceptualisations from social sustainability, it has revolved around some key concepts such as equity, democracy and social engagement, social inclusion and social mix, social interaction, sense of place, safety and security, and quality of the built environment and dwelling [74]. Fourthly, social sustainability has been attributed to both physical and non-physical environmental aspects, covering a wide range of social qualities such as human interaction [34], sense of community [36], social interaction [47,53], and physical qualities such as access to urban services [36], urban infrastructure [40], and internal and external housing conditions [75]. This indicates that an integrated framework should measure both physical and non-physical dimensions of the built environment.
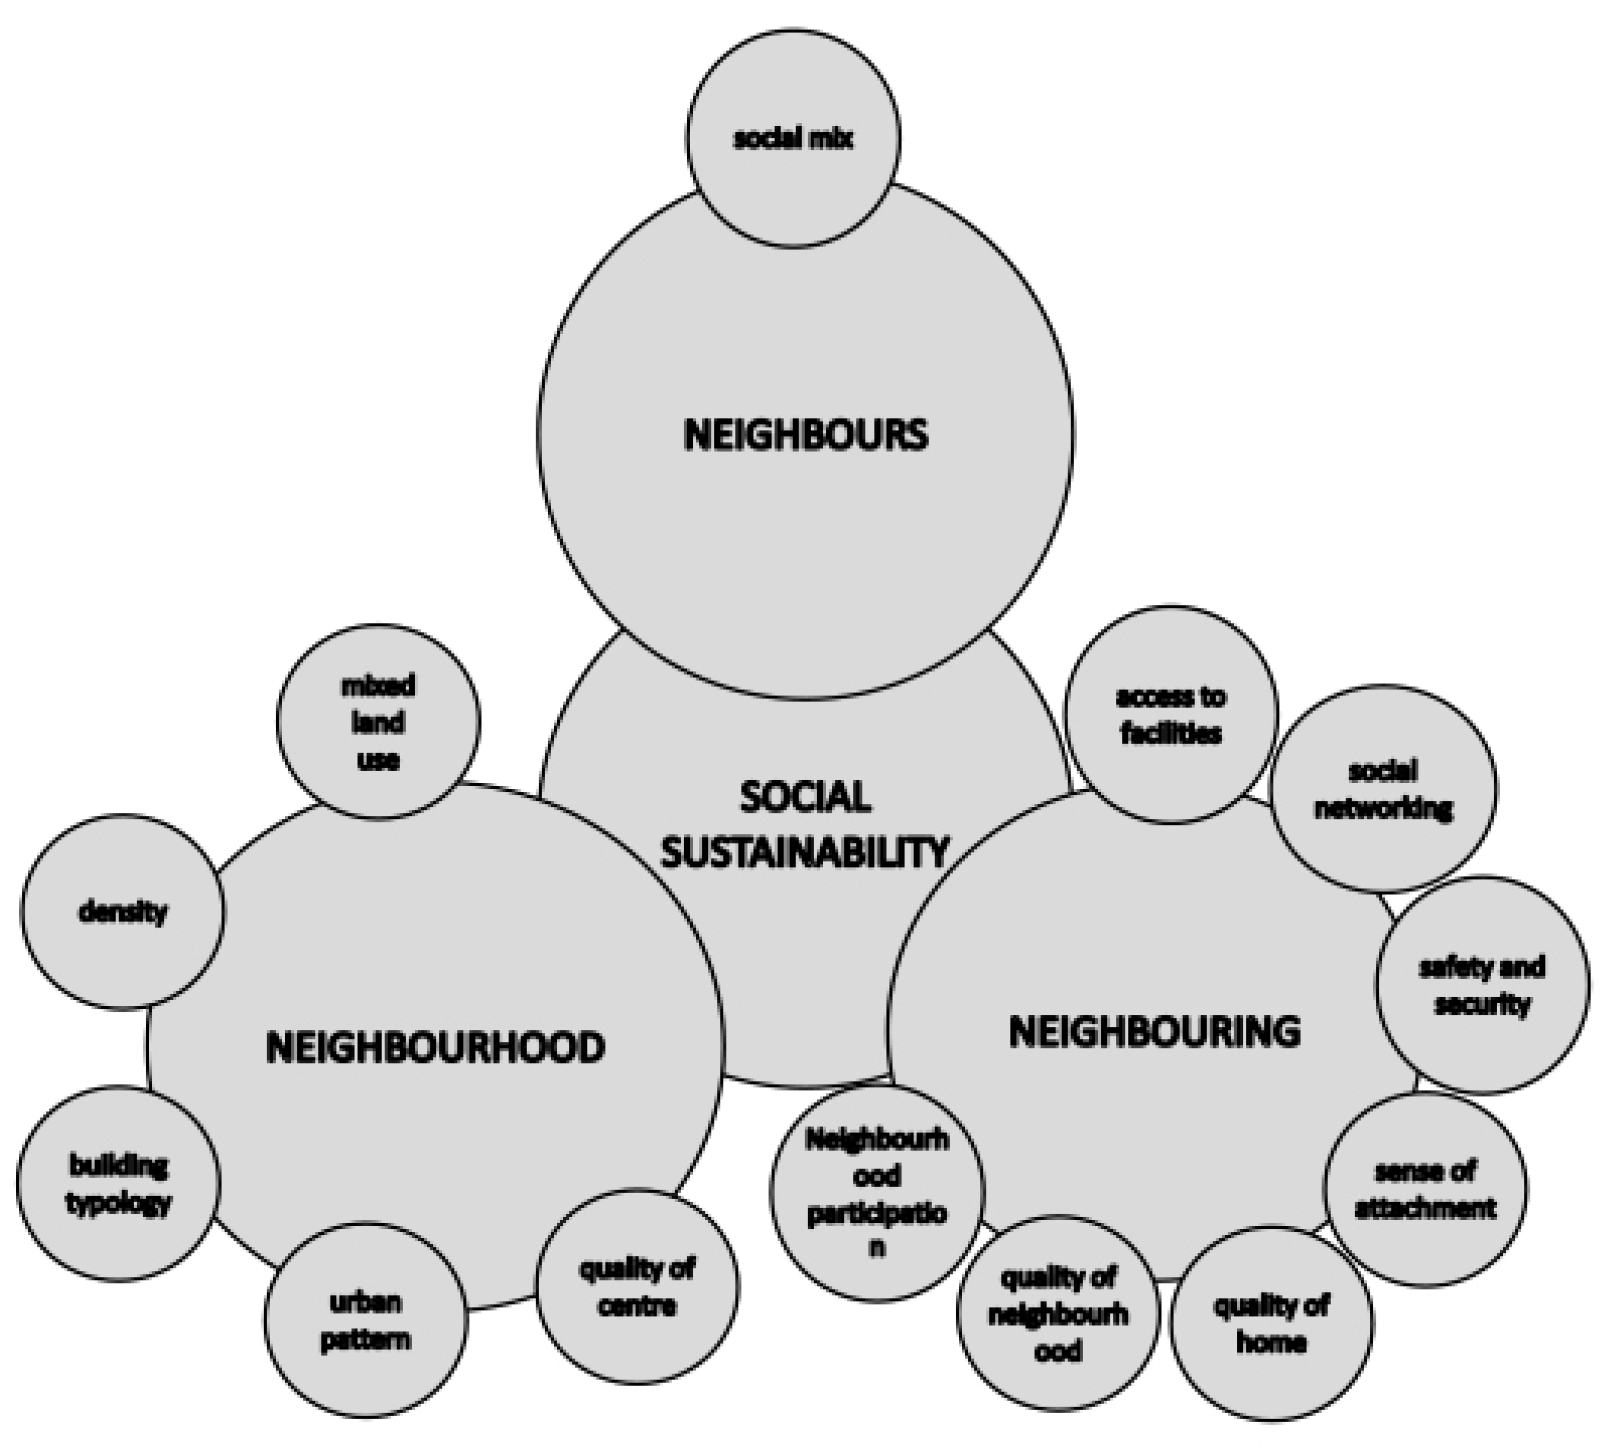
Building on the existing efforts in evaluating social sustainability, we suggest a working definition for social sustainably of urban neighbourhoods and develop it into an integrated framework that brings quantitative and qualitative qualities into a single structure that enables a more comprehensive understanding from the dynamics of social sustainability. For the purpose of this research, socially sustainable neighbourhoods are defined as localities where substantial social qualities are exercised and practiced within the neighbourhood space by the inhabitants at an acceptable and satisfactory standard. In this sense, social qualities as basic characteristics of a community are substantial for a socially sustainable neighbourhood and cover a range of subjects such as social ties and interaction, communal involvement, community cohesion, security and safety, etc. This definition suggests a tripartite structure, what has been called “triad of social sustainability” [76,77], consisting of the space within which social sustainability is practiced and evaluated (neighbourhood), the practice of social qualities by the inhabitants (neighbouring), and the people who exercise these practices (neighbours). Thus, social sustainability of neighbourhood is the interaction between the three pillars of ‘neighbourhood’, ‘neighbouring’, and ‘neighbours’.
To operationalize this definition, we need to identify relevant indicators for each pillar of the suggested triad (Figure 1). As the ‘neighbourhood’ pillar addresses physical qualities of the neighbourhood space and thus is a matter of urban form, drawing on a thematic analysis of a large number of studies on urban form (42 in total) and a detailed analysis of the studies conducted at the neighbourhood scale previous research has identified five indicators of density, mixed land use, urban pattern and street network, building typology, and quality of centre for measuring the ‘neighbourhood’ pillar of social sustainability [76].
Density measures concentration of physical structures (e.g., building density) or individuals (e.g., population density) within a specific territorial area [78]. Mixed land use is defined as the mixture, proximity, and diversity of different functions in a specific area [79,80]. Urban pattern studies spatial arrangement and configuration of different urban elements such as streets, urban blocks, and buildings and describes connectivity, integration, and permeability of space [81,82]. Building typology is about diversity of buildings based on their common formal characteristics, including type (e.g., detached, semi-detached, terraced, etc.), height (e.g., low-rise, high-rise), age (e.g., pre-war, post-war, etc.), function (e.g., residential, office, educational, etc.), and style (e.g., Victorian) [83]. Quality of the centre investigates spatial qualities of the neighbourhood’s focal point and covers a wide range of issues such as land use, spatial configuration, environmental qualities, and infrastructure.
The ‘neighbouring’ pillar deals with non-physical qualities of neighbourhood with social implications [84,85]. Drawing on an analysis of 33 studies which investigate different modes of neighbouring, and considering the objective and scale of our research, seven indicators were suggested for measuring ‘neighbouring’ pillar of social sustainability: access to facilities, social networking and interaction, safety and security, sense of attachment, participation, neighbourhood quality perception, and home quality perception.
Access to facilities investigates equal availability and accessibility of key amenities needed at the neighbourhood level [86,87,88]. Social interaction and networking addresses the verbal or non-verbal interrelationships between individuals [89,90]. Feeling of safety and security measures how inhabitants perceive level of safety at the public spaces, and covers a range of issues such as traffic safety for children and elderly and feeling safe against different crimes [91,92,93,94,95]. Sense of attachment and belonging examines to what extent members of a community feel connected to the place and its spatial qualities and environmental characteristics on the one hand, and are connected to the community members based on shared values, common interests, and human ties, on the other [96,97]. Participation investigates the level of engagement of residents in dealing with neighbourhood problems and neighbourhood-related initiatives and NGOs (Non-Governmental Organizations) [98,99]. Neighbourhood quality studies the degree of satisfaction of the residents with their immediate environment, including physical qualities such as maintenance and cleanliness as well as subjective qualities such as safety and security [100,101,102,103]. Finally, home quality indicates the degree of congruence between the actual and the desirable home conditions, and studies inhabitants’ satisfaction with interior space of home such as room size and bedroom number as well as immediate exterior such as privacy, noise, and green space [104,105].
The third pillar of ‘neighbours’ studies population profile of the neighbourhood inhabitants under one major indicator of ‘social mix’ and shows the state of neighbourhood diversity according to socioeconomic status [106]. It includes in-depth information about neighbourhood inhabitants with regard to age/gender distribution, ethnicity mix, length of residency, household size, household type, house ownership, household income, employment status, accommodation type and characteristics, and education status.
To operationalise the social sustainability triad, the tripartite structure was developed into a 3-stage practical evaluation framework including data collection, data processing, and analysis. Data regarding the ‘neighbourhood’ pillar (five identified indicators) were collected from available sources such as national census, local surveys, GIS maps, and Ordnance Survey Maps. This was complemented by intensive fieldwork and on-site observation, in order to update information about physical characteristics such as land use, height of buildings, empty plots, green space, etc. Collected data were processed by ArcMap Software which enabled us to run different enquiries and produce informative illustrations and maps with valuable information regarding density, land use, and building typology.
Data collection for the ‘neighbouring’ pillar required referring directly to the neighbourhood inhabitants for which we conducted a household survey across the case study neighbourhoods. A questionnaire was designed in which each indicator was developed into a set of questions in order to gain an in-depth knowledge regarding different aspects of each indicator. After piloting the questionnaire and finalising it, a household survey was conducted in case study neighbourhoods. Distribution took place based on a spatially stratified non-representative systematic random sampling using drop and collect method as it results in a higher response rate [107,108]. A second collection round was arranged in case respondents could not complete the questionnaire in the first collection round. In total 1304 questionnaires were distributed, 488 returned. This provided us with sufficient critical mass for undertaking relevant statistical analyses for our purpose [109]. We used SPSS software for data processing, and ran descriptive analysis, correlation analysis, and crosstabular analysis, to study the value and status of each indicator and the relationship between them. Results were scored between 0 and 200 so that each indicator received a score between 0 (lowest) and 200 (highest) showing the value of the indicators.
Data for the ‘neighbour’ pillar were collected through available data such as census data and local surveys. This was complemented by the data extracted from the questionnaires regarding the household status, length of residency, place of birth of household members, household type, and ownership, etc. The final stage was conducting a cross-pillar analysis through which any possible correlation and association between different indicators were identified and explained. This analysis integrates collected data and draws a holistic and broad picture from social sustainability of neighbourhoods.
3. Case Study Neighbourhoods: Selection and General Profile
Four neighbourhoods in 2 cities of London and Berlin served as case study areas. In both cities, densification and compact city policies have been an integral part of the urban development agenda. Socio-spatial diversity of existing urban neighbourhoods in these cities offers a large number of potential case study areas for research. Moreover, they are leading world cities, and results of the research can provide valuable insight to the question of compact urban form and social sustainability. To select four compact neighbourhoods in London and Berlin, we applied a two-stage procedure. First, we defined a set of selection criteria to identify a number of potential case study neighbourhoods. These criteria should reflect normative characteristics of a compact neighbourhood. A content analysis of 36 sources of different type which investigated the idea of compact urban form pinpointed six key indicators for compact urban form: higher density, social mix, mixed land use, accessibility, connectivity, and heterogeneous building typology. In terms of location, we decided to concentrate on neighbourhoods located at the intermediate urban areas, between city centre and suburb, with primarily residential character. This is in line with the socio-spatial structure of case study cities, as central areas in London and Berlin are mainly influenced by commercial and touristic activities and lack neighbourhood character, and suburban areas in principle do not possess typical characteristics of a compact neighbourhood in terms of density, urban pattern, and building typology. Thus, the main criteria for selection of case study neighbourhoods included: relatively high population density (taking into account density profile of the given city); socially diverse population in terms of ethnicity, race, religion, immigration status, and income class; a mixed land use pattern within a compact and densely built-up urban layout with majority of mid-rise buildings of different typologies; and a high local and global (city-wide) connectivity through street networks and transportation systems.
Available data such as census data, density maps, social diversity maps, and deprivation maps were used and overlapped to identify potential urban areas. In London 10 areas of Green Park, Hallow Road, Casenove, Green Street West, Green Street East, Kilburn, Finsbury Park, Dalston, Bethnal Green, and The Lane (Peckham), and in Berlin 9 areas of Klausenerplatz, Moabit West, Moabit Ost, Brunnenviertel, Helmholtzerplatz, Samariterkiez, Boxhagenerplatz, Oranienstrasse, and Wrangelkiez were shortlisted. After on-site observations and further investigations against the defined criteria, two neighbourhoods of Kilburn and Bethnal Green in London and Klausenerplatz and Samariterkiez in Berlin were identified as appropriate case studies.
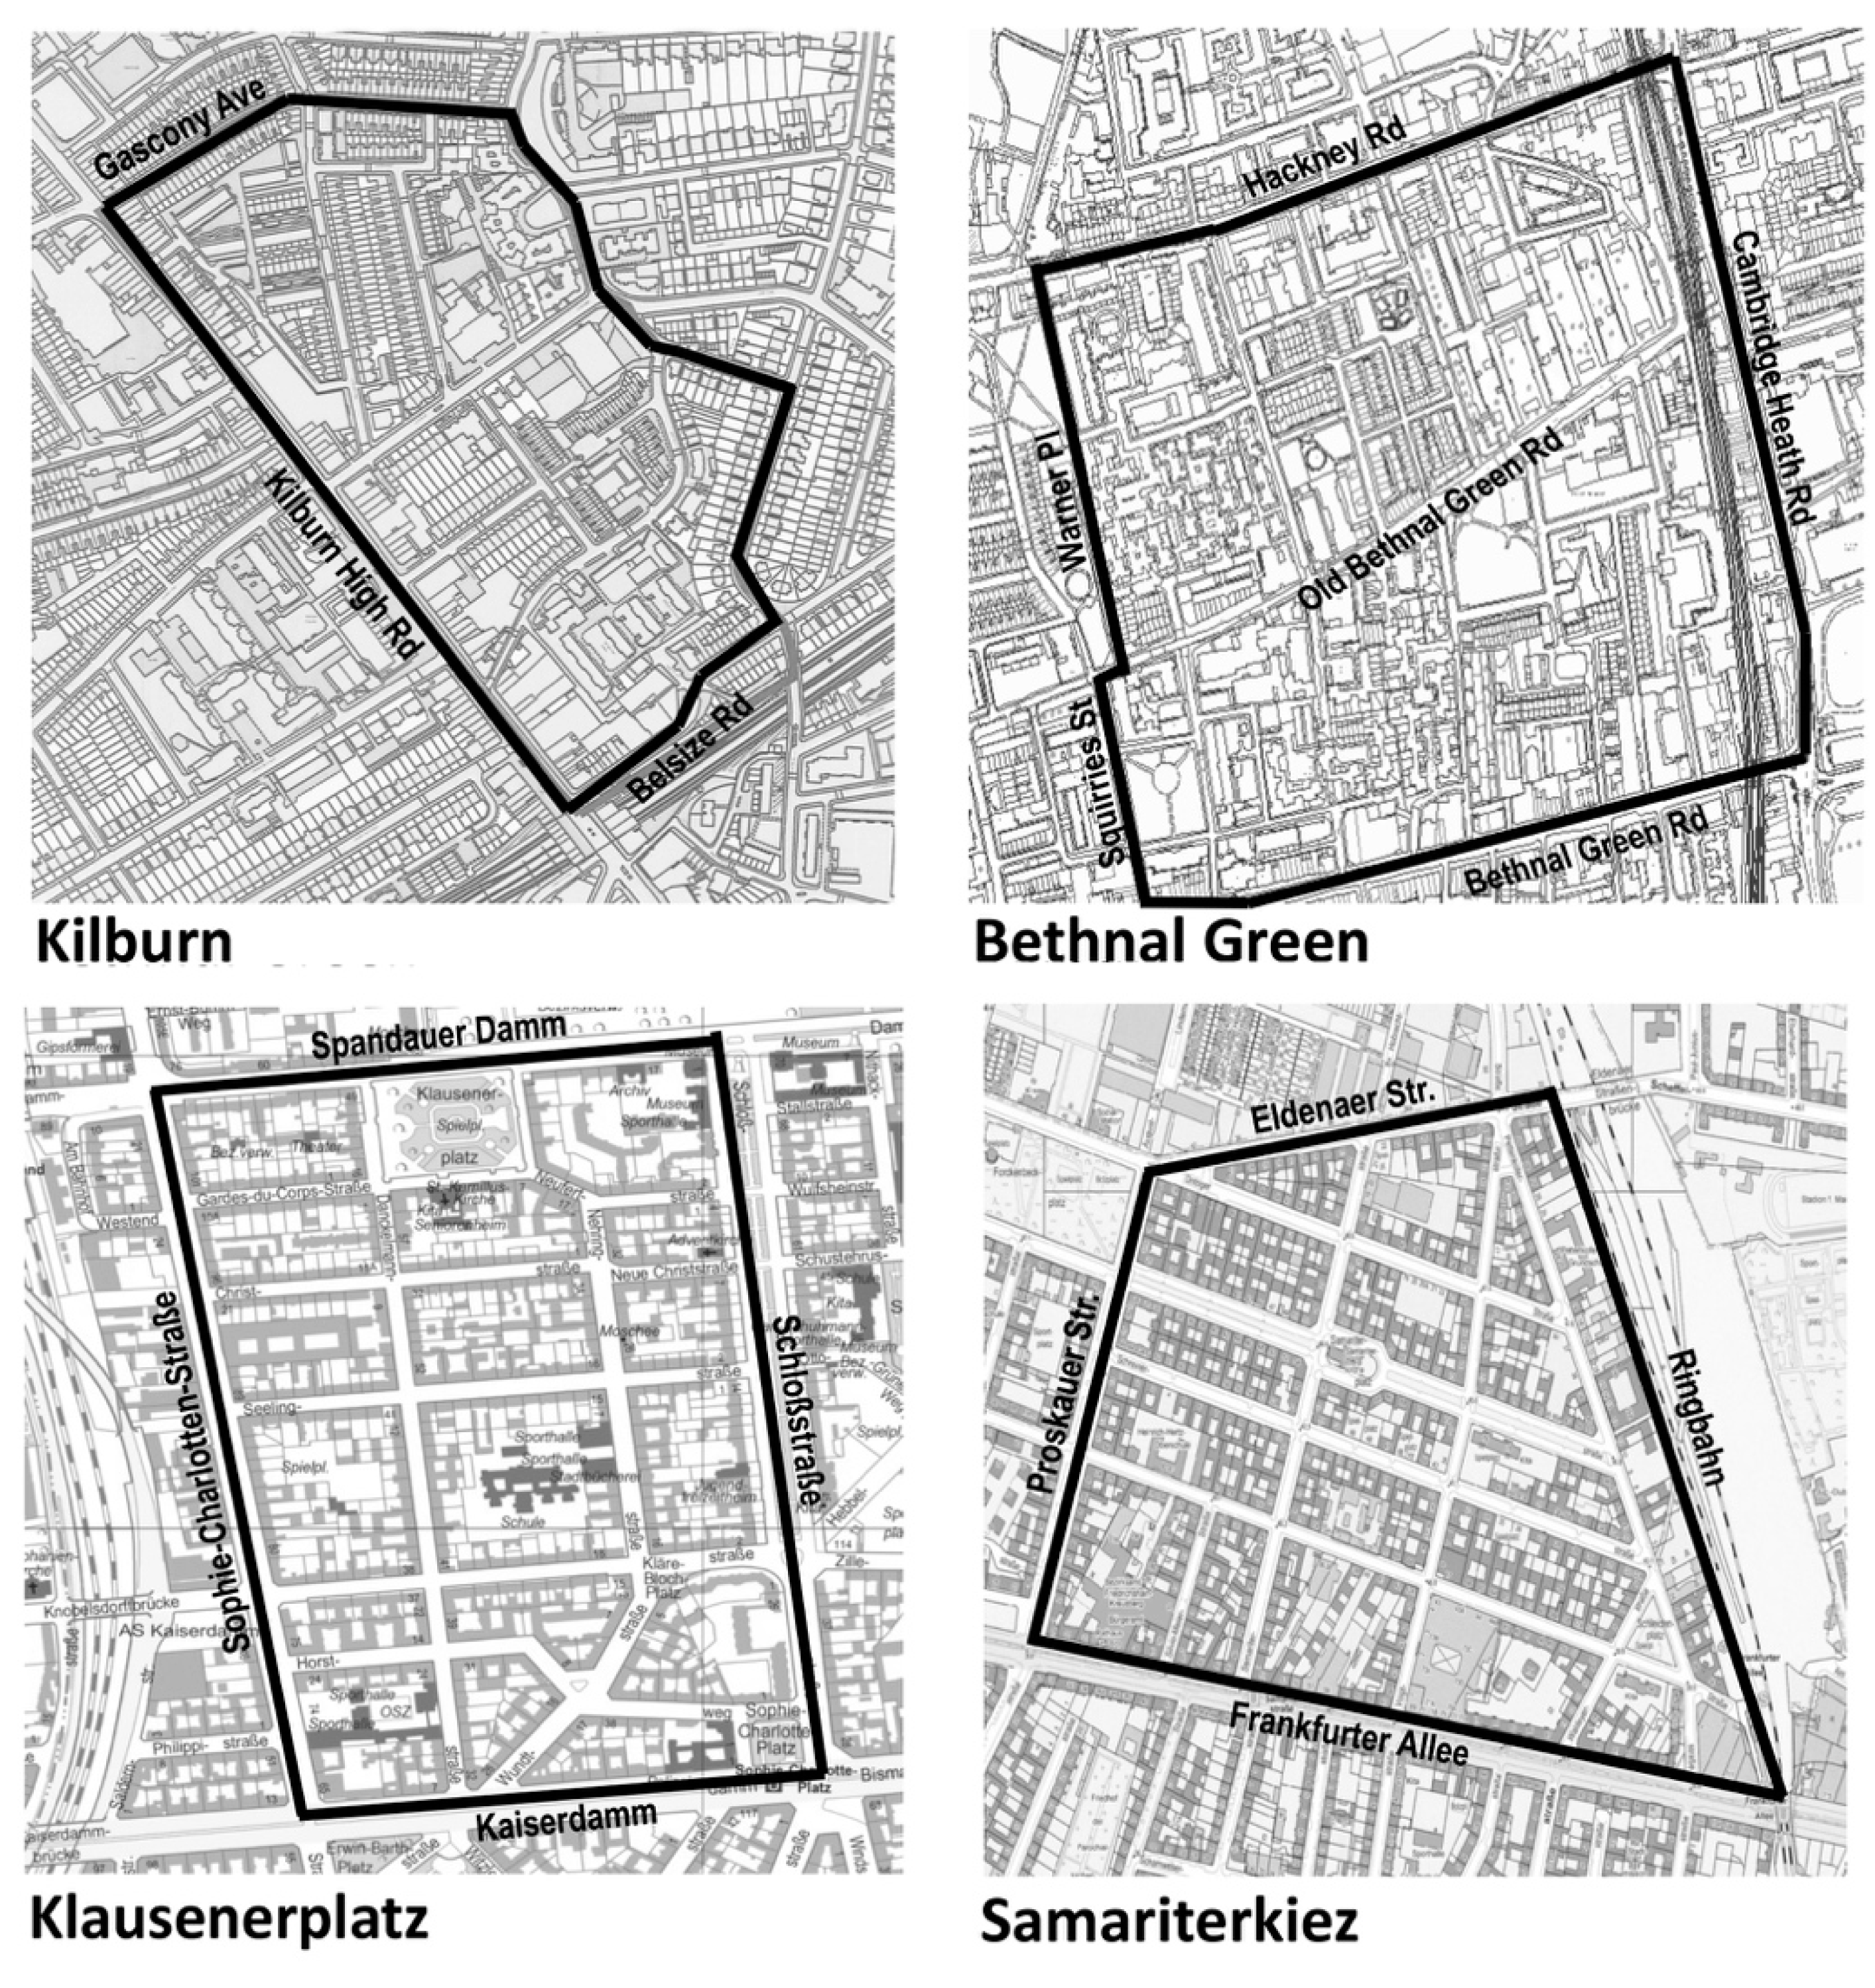
Defining neighbourhood boundaries has been widely debated [110,111,112,113,114,115]; scholars have proposed methodologies for delineating neighbourhood space for empirical research [116,117,118,119,120,121,122,123,124,125]. Informed by these studies, a mixed method was employed for defining neighbourhood boundaries in selected urban areas. First, a tentative border line was drawn taking into account historical evolution, recent urban transformation, and spatial characteristics of the area such as man-made infrastructure (e.g., railways in Kilburn, Samariterkiez, and Klausenerplatz), major traffic arteries (e.g., Kilburn High Road and Frankfurter Allee) and morphologic change of urban pattern and building typology (e.g., Samariterkiez). This was followed by a number of interviews with the neighbourhood inhabitants (on average 15 each) inquiring their mental map regarding the neighbourhood boundaries. In all the cases, overall, clear-cut physical borders corresponded with inhabitants’ perception from neighbourhood boundaries.
The case study area in Kilburn (size: 17 ha; population: 3411) is located in the London Borough of Camden, Kilburn Ward, and is bounded by the Kilburn High Road, the railway line, Priory Road, West End Lane, and Gascony Avenue (see Figure 2). Further, 37 per cent of the population is Christian, followed by Muslims (13.8 per cent), Jewish (3.2 per cent), and Hindu (1.4 per cent). The area has a population density of 200.6 pph (people per hectare) which is higher than the average in Kilburn Ward (175.6 pph). Our field observation shows that 21 per cent of the plots are mixed use, mainly concentrated along the Kilburn High Road, and a small pocket in Belsize Road. There is no major public green space within the study area. There is only one public playground located in Kingsgate Place, two others are located within the school premises. The study area is laid out over a connected network of Victorian streets, linked with some post-war estate developments. It is well-connected to the city through the Kilburn High Road; public transportation is available within walking distance including over-ground, under-ground, and bus services. Different building typologies are observable, from Victorian terrace buildings to the post-war developments of the Kilburn Vale Estate and Kingsgate Estate. The majority of the buildings (83 per cent) are flats.
The case study area in Bethnal Green (size: 35.7 ha; population: 6815) is located in the London Borough of Tower Hamlet, Bethnal Green North Ward. It is bounded by the busy Bethnal Green Road, Hackney Road, Cambridge Heath Road, and Warner Place and Squirries Street (see Figure 2). About half of the inhabitants (48.9 per cent) are from different white background, around 33 per cent of them are Bangladeshi. Further, 34.3 per cent of the inhabitants are considered as Muslims, 24.7 per cent as Christians. The area has a population density of 190.8 pph which is higher than the average in Bethnal Green North Ward (166.3 pph). Within the neighbourhood, as our field observation suggests, 17 per cent of the plots are mixed use, which are concentrated along the Bethnal Green Road, Cambridge Heath Road, Hackney Road, as well as Winkley Street. This area accommodates a number of residential estates built in different period after the Second World War. The study area is rich in terms of public green space, parks, and community gardens. At the heart of the area is the Middleton Green Park (app. 8700 m2), with play-ground and sport facilities for children and teenagers. The area is well-connected to the city through surrounding thoroughfares; public transportation is available within walking distance including over-ground, under-ground, and bus services. Different building typologies are observable, from Victorian terrace buildings to the post-war developments and high-rise buildings.
The case study area of Samariterkiez (size: 49.5 ha; population: 13,853) is located in East Berlin, the borough of Friedrichshain-Kreuzberg, Friedrichshain district. This area is bordered by Frankfurter Allee, Proskauer Street, Eldenauer Street, and Ringbahn (Circle Overground Railway) (see Figure 2). According to the 2012 census, around 10–20 per cent of the residents were foreigners (residents without German nationality), which was within the Berlin average (13.5 per cent). Additionally, 20.64 per cent of residents have immigration background, which is lower than the Berlin average (27.4 per cent). Population density is 279.8 pph. About 73 per cent of plots are mixed use. This neighbourhood benefits from 6 play grounds, and the green space of Schleiden Platz at the eastern corner. The study area has a gridiron-like urban pattern, with buildings occupying the peripheries of urban blocks leaving courtyards at the interior space. Public transportation is available within walking distance including over-ground (S-Bahn), under-ground (U-Bahn), tram, and bus services. Almost all the residential units are flats, located in mainly 5–6 storey buildings.
Bordered by Schloßstraße to the east, Spandauer Damm to the north, Sophie-Charlotten-Straße to the west, and Kaiserdamm to the south, Klausenerplatz (size: 55.2 ha; population: 13,668) is located in the western part of Berlin, and is part of the Borough of Charlottenburg-Wilmersdorf, district of Charlottenburg (see Figure 2). In 2012, 20–30 per cent of the residents were foreigners, which was higher than the Berlin average (13.5 per cent). About 45.63 per cent of inhabitants had immigration background, higher than Berlin average (27.4 per cent). The population density is 247.6 pph. Further, 60 per cent of plots are mixed use, scattered quite evenly across the neighbourhood. The study area follows a gridiron-like pattern, with mainly 5–6 storey buildings divided into flats. It enjoys different types of public transportation available within walking distance, including U-Bahn in the south, S-Bahn in the west, and bus services. Most of the inner areas are called ‘Verkehrsberuhigter Bereich’ (Traffic Calming Area), which makes streets safe for cycling, and pedestrian friendly.
4. Results and Discussion
To conduct what was called cross-pillar analysis, the ‘neighbouring’ pillar will be analysed backed up with information gained from the other two pillars of ‘neighbours’ and ‘neighbourhood.’ As noted earlier, indicators of ‘neighbouring’ pillar were scored between 0 and 200 to obtain a comparable overview. Table 1 shows the value and ranking of neighbouring indicators in case study neighbourhoods. As the table illustrates, in all the case studies, ‘access to facilities’ has the highest value between the neighbouring indicators. The second highest value goes to ‘safety and security’, then to ‘sense of attachment’. In all the cases, ‘neighbourhood participation’ and ‘interaction and networking’ have the lowest value. This means that, overall, in our case study neighbourhoods, access to facilities has the highest standard, followed by safety and security. Sense of attachment, quality of home, and quality of neighbourhood are in an acceptable standard (scoring over 100). The most problematic aspect of neighbouring is ‘neighbourhood participation’, and ‘interaction and networking’. Before analysing and interpreting these findings and investigating the rationale behind these values, data extracted from the household survey reveals an interesting dimension of the case study neighbourhoods.
Table 2 shows the general trend with regard to the way residents of neighbourhoods weight different indicators. As part of the household survey (questionnaire), all the participants were asked to weight the significance of seven indicators of ‘neighbouring’ from 1 (highest) to 5 (lowest). The aim was to understand which indicators are the most important from the point of view of the inhabitants. As Table 2 shows, ‘quality of home’ has the highest significance for the inhabitants, followed by ‘safety and security’, ‘access to facilities’, and ‘quality of neighbourhood.’ Interestingly, ‘neighbourhood participation’ has the least importance, followed by ‘interaction and networking’. Comparing results from Table 1 with Table 2, one could argue that there is a significant positive correlation between the way inhabitants weight the indicators, and the way they live. In other words, inhabitants believe that ‘neighbourhood participation’ and ‘interaction and networking’ are the least important indicators, and they do so in their private and social lives.
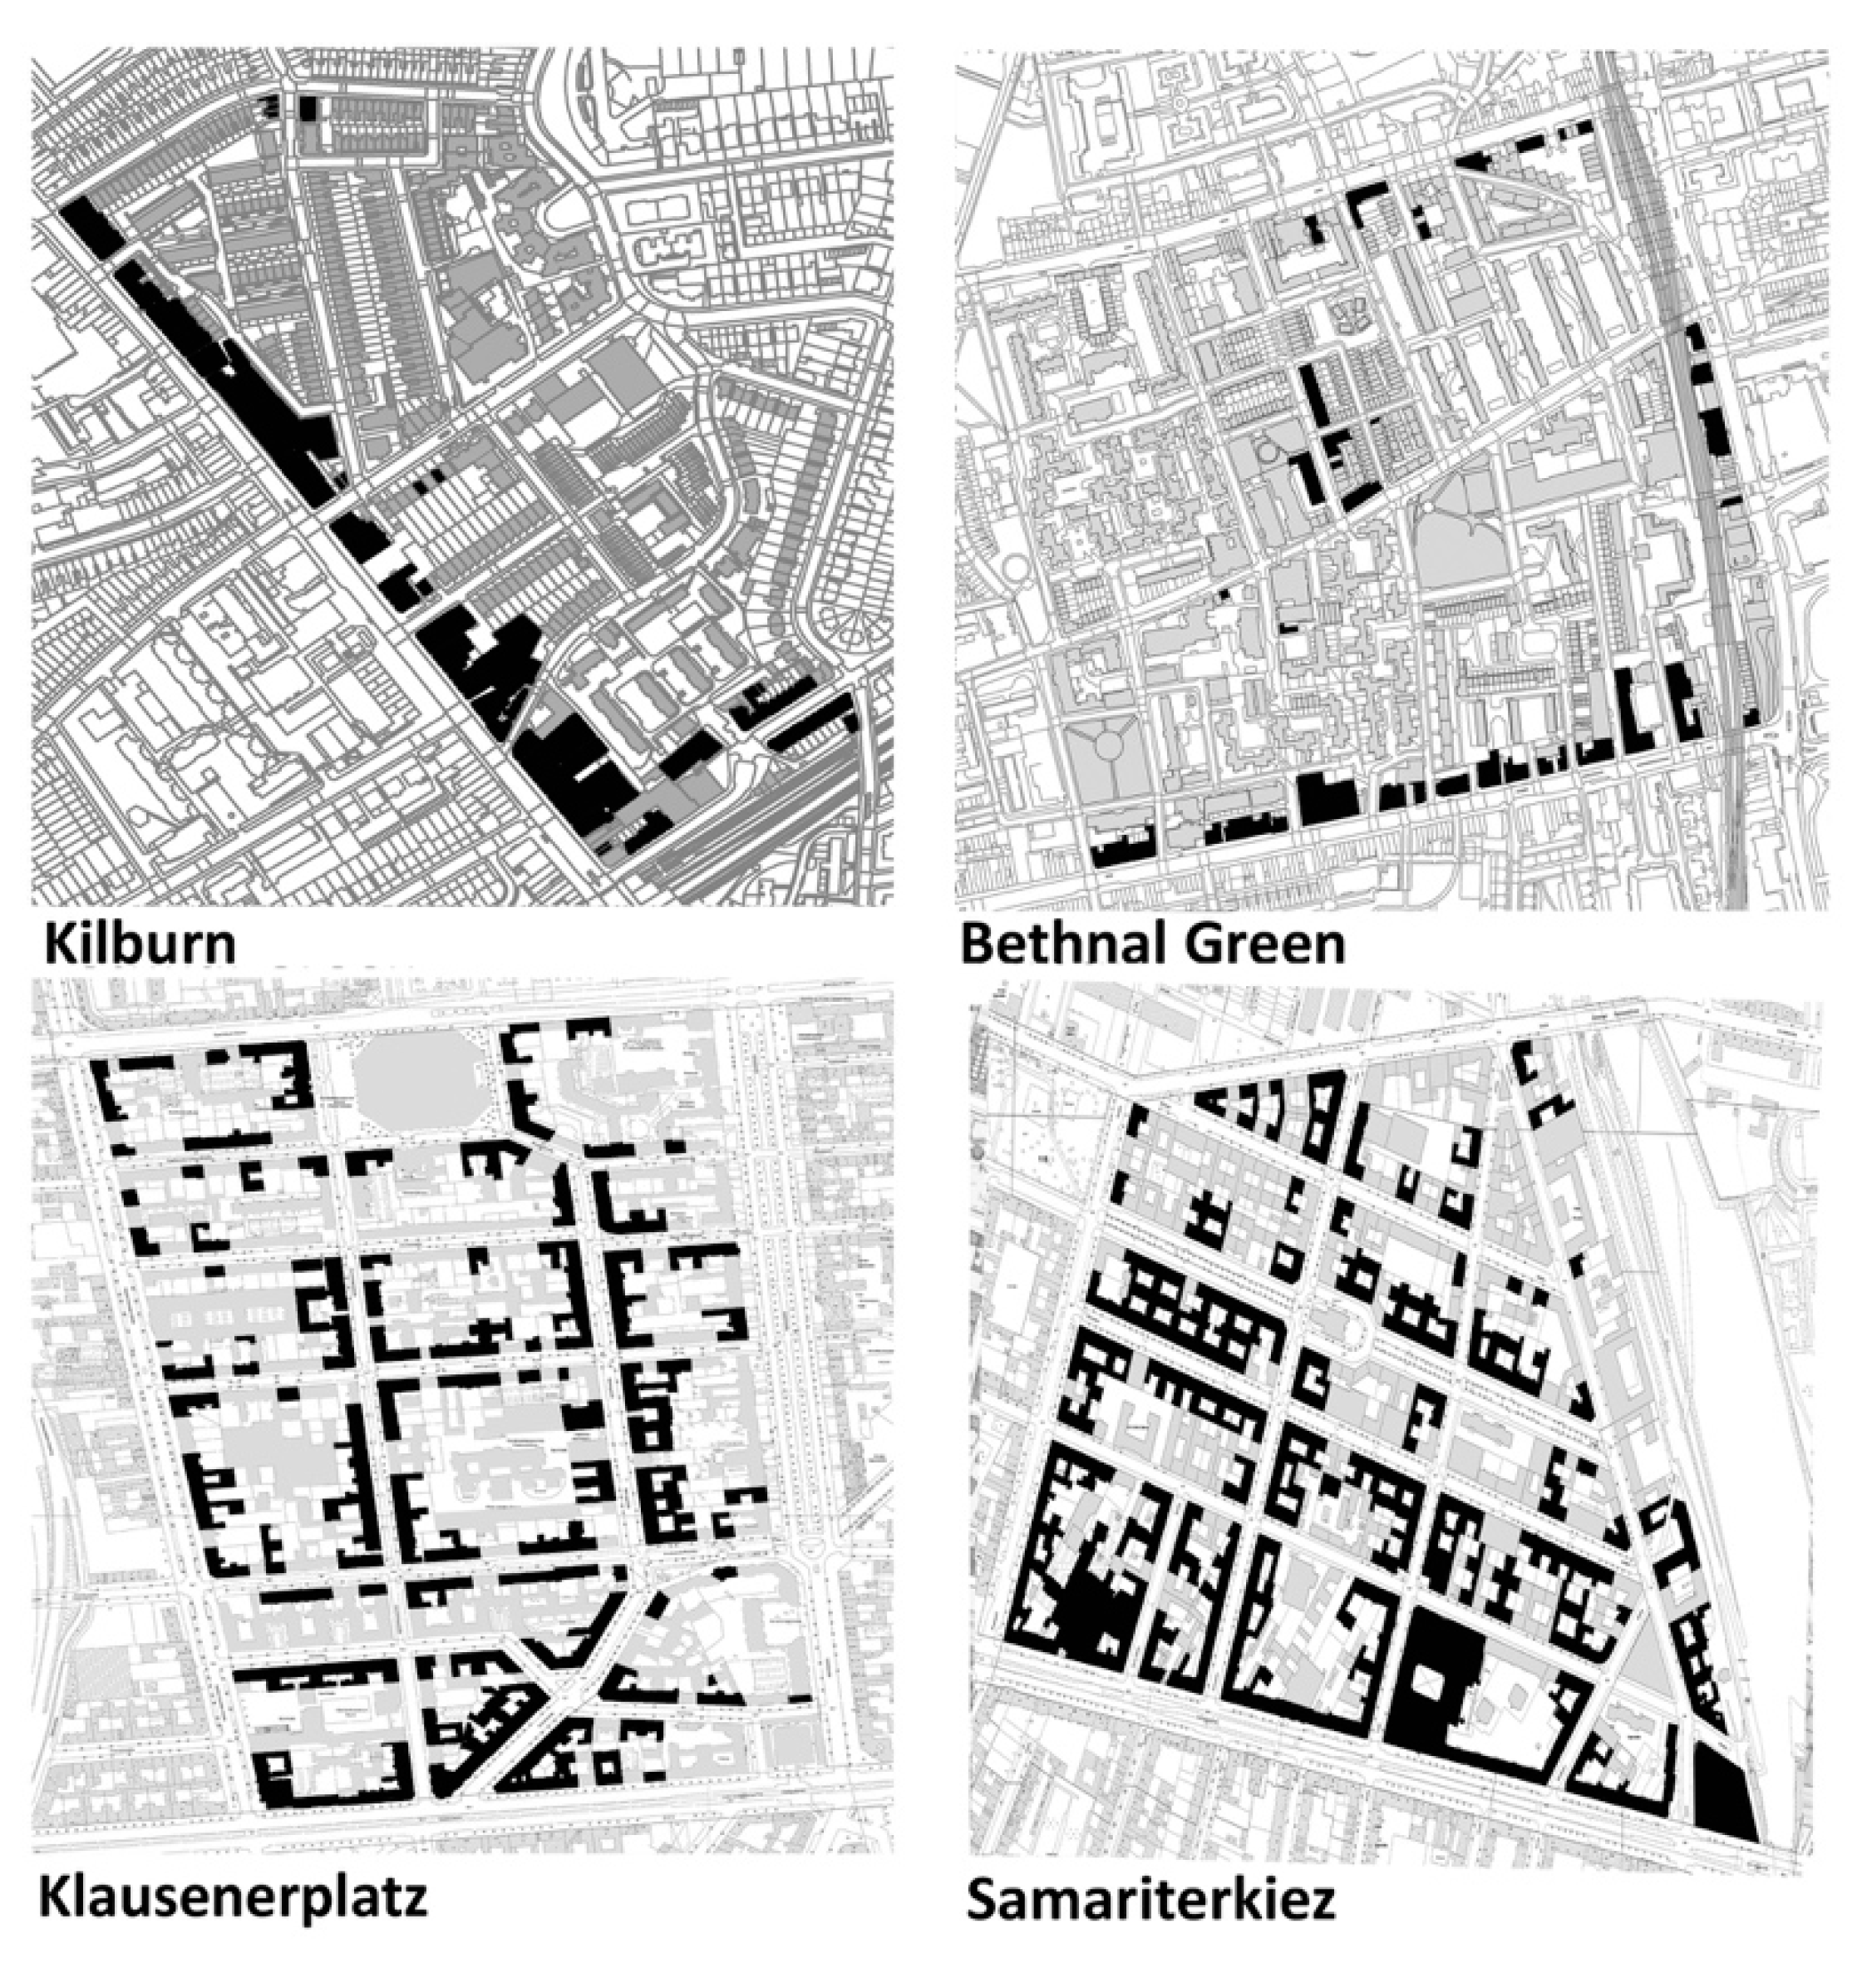
As Table 1 demonstrates, ‘access to facilities’ has the highest value between the indicators. The collected data from household survey (Table 3) show that all the neighbourhoods benefit from high accessibility of urban services: these are mainly available within walking distance and inhabitants prefer to walk to reach these amenities. Our analysis of ‘land use’ and ‘urban connectivity’ from the ‘neighbourhood’ pillar also explains and confirms high access to facilities. As Figure 3 shows, overall London neighbourhoods are less mixed use than Berlin ones (percentage of mixed land use plots: Kilburn: 21; Bethnal Green: 17; Klausenerplatz: 60; Samariterkiez: 73). This suggests that non-residential land use which accommodates different types of urban services is more evenly distributed across the neighbourhood space in Berlin cases than London ones. However, concentration pattern of mixed land use plots makes urban services also available for London cases. As Figure 3 depicts, high concentration of mixed land use alongside the Kilburn High Road and Bethnal Green Road, which serve as a local hub and accommodate a large number of urban amenities used on daily basis, makes urban services available within walking distance for all the inhabitants. In Berlin cases, the majority of buildings are 4–6 storey buildings built next to each other on the periphery of the urban blocks. This spatial configuration allows accommodating commercial and office spaces on the ground floors of the buildings, or transforming them to such land uses over the time. In fact, most of the non-residential land uses are located on the ground floor of the buildings and serve as cafes, restaurants, small shops, offices, and other urban services.
Table 3 depicts a remarkable difference between Berlin and London neighbourhoods in terms of access to facilities: while cycling is a relatively common transportation mode in Berlin cases, in London it is the least used. Data collected from the household survey show that Berlin cases have 2 times higher bicycle ownership than UK cases. The percentage of households with at least one bicycle is 89 (Klausenerplatz), 82 (Samariterkiez), 37 (Kilburn), and 33 (Bethnal Green). Considering street layout in the Berlin cases with designated cycling paths across the neighbourhood and intensive traffic-calming measurements, inhabitants in Berlin neighbourhoods are more motivated to use cycling as a convenient mode of transportation for daily activities. As the literature suggests, cycling paths and traffic-calming measurements play a significant role in encouraging people to cycle [126,127,128].
Overall (see Table 1), Berlin cases are perceived relatively safer than London cases by the inhabitants. Feeling of safety reflects different aspects such as daytime safety, dark-time safety, safety of parks, safety of children on the street regarding traffic, and safety of sidewalks. This is partly because of different street layouts observable in these neighbourhoods. Gridiron urban layout of Berlin cases permits generous sidewalks, and enhances urban visibility. Higher mixed land use rate also implies active presence of people in most parts of the neighbourhood which enhances feeling of safety [129,130]. Traffic-calming measurements, as noted, make streets safer for children and the elderly. Our survey also shows that in most of the participant households (Kilburn: 78.7 %; Bethnal Green 83.2%; Klausenerplatz: 80.3; Samariterkiez: 76.2), family members have not been victim of any crime during the previous 3 years. In Kilburn, Klausenerplatz, and Samariterkiez, theft is by far the most common type of crime, but in Bethnal Green, mugging and assault are two main problems. The high rates of safety perception by the inhabitants in our cases challenge a dominant proposition in compact neighbourhood debates which relate higher density to higher crime rate and lack of security [52,131,132].
As Table 1 shows, inhabitants in Berlin cases are more attached to their neighbourhoods than London cases. All the measures related to ‘sense of attachment’, including being proud of neighbourhood, feeling at home in neighbourhood, perceiving the neighbourhood as the right place to live, and missing neighbourhood when away, are higher in Berlin than London neighbourhoods. This implies that Berlin neighbourhoods offer a higher level of sense of community. Studies show that strong social networks, social ties, and low residential turnover can play significant roles in neighbourhood attachment [133,134,135]. The feeling of attachment to neighbourhood has direct correlation with the willingness of the inhabitants to stay in the neighbourhood. More people living in Berlin neighbourhoods did not have any plans to move out of the neighbourhood (Kilburn: 63.3; Bethnal Green: 69.8; Klausenerplatz: 88.8; Samariterkiez: 70.3). A moderate satisfaction with different aspects of neighbourhood such as neighbours, lightening, and maintenance has been expressed by the inhabitants as reasons for staying, though they have concerns about cleanliness and traffic congestion.
Literature suggests that high density environments and overcrowding may negatively affect home satisfaction [52,136,137]. In our case studies, people on average benefit from a relatively acceptable level of home quality (see Table 1). As Table 4 illustrates, a high percentage of the participant inhabitants are satisfied or very satisfied with their homes, the number of inhabitants who are dissatisfied or very dissatisfied is very low. Despite overall satisfaction with the feeling of privacy, and size and number of rooms, inhabitants have concerns regarding noise and lack of sufficient parking space. The household survey shows that the mean household-size and bedroom number figures are close (Kilburn: 2.52 and 2.31; Bethnal Green: 3.67 and 2.97; Klausenerplatz: 2.20 and 1.82; and Samariterkiez: 2.28 and 1.59, respectively), and this could explain overall satisfaction with the living space. As the car ownership rate (percentage of households with a 4-wheel vehicle) is higher than the off-street parking bays and garage ownership rate (Kilburn: 45 and 25; Bethnal Green 47 and 31; Klausenerplatz: 51.7 and 2.2; Samariterkiez: 37 and 8, respectively), inhabitants complain about the insufficient parking space. In the Berlin cases, in most places, there is no dedicated off-street parking policy; people use it on first-come-first-serve basis. Due to overall home satisfaction, a high percentage of participant inhabitants have no plan to change their home (Kilburn: 78.0; Bethnal Green: 70.3; Klausenerplatz: 84.0; Samariterkiez: 91.0). Having sufficient space at home, good quality of home, and being satisfied with the neighbourhood have been the main reasons not to change the home. The average residency length (in years) in the current flat (Kilburn: 11.08, Bethnal Green: 13.4, Klausenerplatz: 13.89, Samariterkiez: 8.84) and in the neighbourhood (Kilburn: 17.17, Bethnal Green: 19.11, Klausenerplatz 16.69, Samariterkiez: 11.33) extracted from the household survey are indications for the home satisfaction.
‘Quality of neighbourhood’ has the fifth place in terms of ‘neighbouring’ indicators. As Table 5 clearly shows, most of the respondents are either satisfied or very satisfied with their neighbourhoods; almost no one is very dissatisfied. This satisfaction is about different dimensions of the neighbourhood such as neighbours, lighting of the streets, maintenance of public spaces, neighbourhood reputation, and green space. Areas of dissatisfaction are traffic congestion, cleanliness, and noise.
An interesting point to elaborate on is the way people perceive building and population density of their neighbourhoods. As Table 6 demonstrates, all the case study neighbourhoods have relatively high population density in their urban settings. Scholars have noted that density is a relative concept: what is considered as high density in one context could be medium in another one [138,139,140]. This is why, although density figures are higher in Berlin neighbourhoods than London ones, they all belong to high-density categories in their particular urban contexts. Difference in population density figures reflects differences in urban form and building typologies between London and Berlin. Our fieldwork shows that in Kilburn 49 per cent of buildings are 3-storey, 30 per cent 4-storey. In Bethnal Green 34 per cent of buildings are 3-storey, 18 per cent 4-storey. These figures rise considerably in the Berlin cases so that 5–6 storey buildings are dominant (about 80 per cent). Building typology also plays a significant role in population and building density. While 83 per cent and 88 per cent of accommodations are flats in Kilburn and Bethnal Green, in Klausenerplatz and Samariterkiez, 100 per cent of accommodations are flats. In other words, in the London cases, we find a number of accommodations as terrace houses or detached/semi-detached houses that cover larger spaces and accommodate less people. In Berlin, however, almost all the plots are constructed in the form of typical U-shape or L-shape 5–6 storey buildings with a Vorderhaus (front building) and Hinterhaus (rear building), laid over a gridiron like street network (See Figure 3).
The household survey also confirms that residents perceive their urban environment as high-density. We asked participants how they perceive their neighbourhoods in terms of population and building density (to help participants understand relativity of density, the five-level Likert scale question was visualised). In the London cases, the dominant perception is that the neighbourhood is high-density in terms of both building density and pollution. However, in the Berlin cases, the majority of participants perceive their neighbourhood as high-density in terms of building density, but medium-density in terms of population density.
Data extracted from national statistics and household survey regarding ‘neighbours’ pillar shows that overall case study neighbourhoods are diverse in terms of ethnicity, social profile, and religion. In Kilburn, participant households are from different ethnicity backgrounds: 47.4 per cent white British, 19.3 per cent mixed white and black Caribbean, 10.5 per cent white Irish. Only 54 per cent of the participants have been born in the UK. We also observe a mix of religion (37 per cent Christian, 13.8 per cent Muslim, 3.2 per cent Jewish, and 1.4 per cent Hindu). Most of the flats are rented (71.7 per cent), 41.7 per cent from public sector.
Bethnal Green study area also presents itself as a socially, ethnically, and religiously mixed community. Further, 63 per cent of the participants in the household survey have been born in the UK. They are from different ethnic backgrounds; 36.7 per cent Bangladeshi, 29.6 per cent white British, 16.3 per cent mixed white and black Caribbean. Higher household size (3.67 compared to the London of 2.47) reflects the propensity of minorities in having larger families. There is also a mix of tenures, but a high percentage of the rented accommodations (47.4 per cent) are from the public sector. This is because of the large-scale estate developments that exist across the neighbourhood.
In Klausenerplatz, around 72 percent of the people living in the participant households hold German nationality with different ethnic backgrounds, 85 per cent of them have been born in Germany. House ownership is only 7 per cent. Accommodations are all flats, rented either from the private sector (55 per cent) or public sector (32 per cent). Although Samariterkiez, as part of the East Berlin, has experienced a remarkable social change because of recent immigration of non-Germans and foreigners, it is still slightly less diverse than Klausenerplatz. About 80 per cent of the participants hold German nationality, 84 per cent of them have been born in Germany. Due to recent developments in the area, home ownership is 13.9 per cent. The majority of tenants (70.1 per cent) have rented from private sector, 12.5 per cent from public sector. All four case study neighbourhoods, following Galster’s [141] formula could be considered as mixed neighbourhoods as no single group makes up more than 75 per cent of the population.
Despite social diversity in the neighbourhoods, as explained above, ‘interaction and networking’ is the second lowest ‘neighbouring’ indicator (see Table 1). Some aspects of this indicator have been summarised in Table 7. Berlin neighbourhoods have slightly better position in terms of number of friends in the neighbourhood and social exchange. But overall social interaction and exchange with neighbours is quite low. The lowest ‘neighbouring’ indicator is neighbourhood participation (Table 8). We can read from this table that people overall are reluctant to get involved in neighbourhood-related activities, no matter through community-based organisations or local authorities. Data from site observation (neighbourhood pillar) show that there are a number of community-based organisations such as Kingsgate Community Centre and Kilburn Youth Centre in Kilburn, Minerva Community Centre and Zander Court Clubroom in Bethnal Green, and Kiezbündnis Klausenerplatz and Nachbarshaftszentrum DIVAN in Klausenerplatz, that are locally active and accommodate services to the community. Although many of the inhabitants are aware that community-based activities do exist, they do not get involved.
5. Conclusions: Promises and Pitfalls of Compact Neighbourhoods
Our analysis of the four neighbourhoods supports one of the dominant assumptions with regard to the social consequences of living in compact neighbourhoods, but challenges many others. It is consistent with the argument that compact urban form increases accessibility of urban facilities and services, and people are encouraged to use non-motorised means such as walking or cycling to reach them [47,54,55,142]. As depicted in Table 3, the majority of participants (86.6% Kilburn, 85.7% Bethnal Green, 80.6% Klausenerplatz, and 85.9% Samariterkiez) walk or cycle to use basic urban services. Dense street networks, condensed urban pattern, and mixed land use, which are consequences of compact urban form, play a significant role in accommodating urban services and making them accessible.
Our study challenges the dominant proposition in compact neighbourhood debates that relates higher density to higher crime rate and lack of security [52,131,132]. As demonstrated above, participants enjoy a high level of feeling of safety in the neighbourhood space and a large number of participant households (Kilburn 78.7 %; Bethnal Green 83.2%; Klausenerplatz: 80.3; Samariterkiez: 76.2) have not been victim of any crime during the previous three years.
Our study also challenges the argument that compact environments negatively impact home and neighbourhood satisfaction [52,136,137]. In contrast, residents of case study neighbourhoods benefit from a relatively acceptable level of home and neighbourhood quality (see Table 4 and Table 5). Most of the participant residents (84% in Kilburn, 76.6% in Bethnal Green, 87.6% in Klausenerplatz, and 82% in Samariterkiez) are satisfied or very satisfied with their quality of home. This indicates that despite some challenges residents face, such as lack of sufficient parking and noise, quality of homes (size, privacy, number of rooms) meet expectations of the families. Participants also show a rather high level of satisfaction (68.3% in Kilburn, 67.4% in Bethnal Green, 91.6% in Klausenerplatz, and 74.7% in Samariterkiez) with the quality of neighbourhood. This indicates that environmental qualities such as street lighting, public space maintenance, neighbourhood reputation, and green space, meet expectations of the inhabitants. As a result of satisfaction with home and neighbourhood, most of the participants (Kilburn: 78.0; Bethnal Green: 70.3; Klausenerplatz: 84.0; Samariterkiez: 91.0) would prefer to stay at their neighbourhoods and have no plan to move out.
However, ‘interaction and networking’ and ‘neighbourhood participation’ are very low, and this is one of the challenges of the case study neighbourhoods. As noted, selected neighbourhoods are socially diverse, but do not enjoy a high level of social interaction and networking. This reflects a rather global trend. Scholars have repeatedly pointed out to different social dilemmas societies face after industrialisation and modernisation period. It has been argued that the inevitable flux of modernisation, globalisation, and communication technology have isolated urbanites and jeopardised social interaction and social ties [143,144,145,146]. Social diversity may also lead to the phenomenon of ‘parallel lives’; inhabitants delimit their interaction and social networks to the people of the same ethnicity, race, religion, social class, etc. [147,148,149], and thus create a society of separated community groups. Finally, despite the fact that participants know of a good number of community-based organizations, and neighbourhoods space has accommodated these public facilities, neighbourhood participation is the lowest among social sustainability indicators. Studies show that low level of public engagement is a world-wide challenge which is rooted in different factors such as lack of trust, social inequality, absence of motivation, non-democratic decision making tradition, poorly designed participatory processes, etc. [150,151,152,153].
Overall, our study shows that compact neighbourhoods have their promises and pitfalls. The most explicit promise of compact urban form is higher accessibility of urban services and their availability though walking. Research results, however, challenge the dominant propositions pertinent to the compact urban form debate: our case study neighbourhoods enjoy a high level of safety, home satisfaction, and neighbourhood satisfaction, but have a low level of social interaction and networking. This indicates that compact urban form is not an urban orthodoxy, but has multiple social meanings and perceptions in different contexts and places. This calls for revisiting compact urban form orthodoxy based on place characteristics: social qualities are place-specific, related to the characteristics of the place including social, cultural, and economic specifications of the inhabitants. In this sense, social benefits of densification should be carefully studied and investigated for a given case, before being implemented. Further, this is the task of densification plans to examine appropriateness of densification policies and their social benefits in advance.
We would like to end this article with some methodological notes. The tripartite structure suggested, we would argue, offers a more holistic understanding of social sustainability and links physical and non-physical aspects to gain an in-depth understanding of different indicators. However, it falls short in exploring the rationale behind some of the results achieved from the cross-pillar analysis. We believe adding a new stage to the fieldwork that utilises more qualitative or ethnographic methods, such as focus group discussions or in-depth interviews, would provide us with more qualitative insight into the findings and explain the rationale behind them. This could be addressed in the future research.
Author Contributions
Conceptualization, M.R.S.; R.K.; methodology, M.R.S.; R.K.; software, M.R.S.; validation, M.R.S.; R.K.; formal analysis, M.R.S.; investigation, M.R.S.; resources, M.R.S.; data curation, M.R.S.; writing—original draft preparation, M.R.S.; writing—review and editing, R.K.; visualization, M.R.S.; All authors have read and agreed to the published version of the manuscript.
Funding
Funding for the research in this article was provided by the Marie Curie Intra-European Fellowships Actions (Research Executive Agency, grant no. 624794).
Institutional Review Board Statement
The study received required ethics approval from Oxford Brookes University Research Ethics Committee (UREC Registration No: E13014, 21 May 2014).
Informed Consent Statement
Informed consent was obtained from all subjects involved in the study.
Data Availability Statement
Not Applicable.
Conflicts of Interest
The authors declare no conflict of interest.
References
- Bibri, S.E.; Krogstie, J.; Kärrholm, M. Compact City Planning and Development: Emerging Practices and Strategies for Achieving the Goals of Sustainability. Dev. Built Environ. 2020, 4, 100021. [Google Scholar] [CrossRef]
- Mouratidis, K. Is Compact City Livable? The Impact of Compact versus Sprawled Neighbourhoods on Neighbourhood Satisfaction. Urban Stud. 2018, 55, 2408–2430. [Google Scholar] [CrossRef]
- Bay, J.H.P.; Lehmann, S. (Eds.) Growing Compact: Urban Form, Density and Sustainability; Routledge: Abingdon, UK; New York, NY, USA, 2017; ISBN 978-1-317-19085-1. [Google Scholar]
- Bunker, R. How Is the Compact City Faring in Australia? Plan. Pract. Res. 2014, 29, 449–460. [Google Scholar] [CrossRef]
- Echenique, M.H.; Hargreaves, A.J.; Mitchell, G.; Namdeo, A. Growing Cities Sustainably: Does Urban Form Really Matter? J. Am. Plan. Assoc. 2012, 78, 121–137. [Google Scholar] [CrossRef]
- Arifwidodo, S.D. Exploring the Effect of Compact Development Policy to Urban Quality of Life in Bandung, Indonesia. City Cult. Soc. 2012, 3, 303–311. [Google Scholar] [CrossRef]
- Dave, S. High Urban Densities in Developing Countries: A Sustainable Solution? Built Environ. 2010, 36, 9–27. [Google Scholar] [CrossRef]
- Lindsay, M.; Williams, K.; Dair, C. Is There Room for Privacy in the Compact City? Built Environ. 2010, 36, 28–46. [Google Scholar] [CrossRef]
- Duany, A.; Plater-Zyberk, E.; Speck, J. Suburban Nation: The Rise of Sprawl and the Decline of the American Dream, 10th ed.; North Point Press: New York, NY, USA, 2010; ISBN 978-0-86547-750-6. [Google Scholar]
- Jenks, M. The Acceptibility of Urban Intensification. In Achieving Sustainable Urban Form; Williams, K., Burton, E., Jenks, M., Eds.; Routledge: London, UK; New York, NY, USA, 2000; pp. 242–250. ISBN 978-0-419-24450-9. [Google Scholar]
- Frey, H. Designing the City: Towards a More Sustainable Urban Form; Taylor & Francis: London, UK; New York, NY, USA, 1999; ISBN 978-0-419-22110-4. [Google Scholar]
- Thomas, L.; Cousins, W. A New Compact City Form: Concepts in Practice. In The Compact City: A Sustainable Urban Form? Jenks, M., Burton, E., Williams, K., Eds.; E & FN Spon: London, UK; New York, NY, USA, 1996; pp. 328–338. [Google Scholar]
- Elkin, T.; McLaren, D.; Hillman, M. Reviving the City: Towards Sustainable Urban Development; Continuum International Publishing: London, UK, 1991; ISBN 978-0-905966-83-0. [Google Scholar]
- Makido, Y.; Dhakal, S.; Yamagata, Y. Relationship between Urban Form and CO2 Emissions: Evidence from Fifty Japanese Cities. Urban Clim. 2012, 2, 55–67. [Google Scholar] [CrossRef] [Green Version]
- Jenks, M.; Jones, C. Dimensions of the Sustainable City; Springer: Heidelberg, Germany, 2010. [Google Scholar]
- Burton, E. The Compact City: Just or Just Compact? A Preliminary Analysis. Urban Stud. 2000, 37, 1969–2006. [Google Scholar] [CrossRef]
- Breheny, M. Centrists, Decentrists and Compromisers: Views on the Future of Urban Form. In The Compact City: A Sustainable Urban Form? Jenks, M., Burton, E., Williams, K., Eds.; E & FN Spon: London, UK; New York, NY, USA, 1996; pp. 13–35. [Google Scholar]
- Burton, E.; Williams, K. Mike Jenks The Compact City and Urban Sustainability. In The Compact City: A Sustainable Urban Form? Jenks, M., Butron, E., Williams, K., Eds.; E & FN Spon: London, UK; New York, NY, USA, 1996; pp. 231–247. [Google Scholar]
- Jenks, M.; Burton, E.; Williams, K. (Eds.) The Compact City: A Sustainable Urban Form? Routledge: London, UK; New York, NY, USA, 1996; ISBN 978-0-419-21300-0. [Google Scholar]
- Perez, F. “The Miracle of Density”: The Socio-Material Epistemics of Urban Densification. Int. J. Urban Reg. Res. 2020, 44, 617–635. [Google Scholar] [CrossRef]
- Shirazi, M.R. Compact Urban Form: Neighbouring and Social Activity. Sustainability 2020, 12, 1987. [Google Scholar] [CrossRef] [Green Version]
- Chhetri, P.; Han, J.H.; Chandra, S.; Corcoran, J. Mapping Urban Residential Density Patterns: Compact City Model in Melbourne, Australia. City Cult. Soc. 2013, 4, 77–85. [Google Scholar] [CrossRef]
- Neuman, M. The Compact City Fallacy. J. Plan. Educ. Res. 2005, 25, 11–26. [Google Scholar] [CrossRef]
- Schwanen, T.; Dijst, M.; Dieleman, F.M. Policies for Urban Form and Their Impact on Travel: The Netherlands Experience. Urban Stud. 2004, 41, 579–603. [Google Scholar] [CrossRef] [Green Version]
- Bouwman, M.E.; de Roo, G.; Miller, D. Changing mobility patterns in a compact city: Environmental impacts. In Compact Cities and Sustainable Urban Development: A Critical Assessment of Policies and Plans from an International Perspective; Ashgate: Aldershot, UK, 2000. [Google Scholar]
- Stead, D.; Williams, J.; Titheridge, H. Land Use, Transport and People: Identifying the Connections. In Achieving Sustainable Urban Form; Williams, K., Burton, E., Jenks, M., Eds.; Routledge: London, UK; New York, NY, USA, 2000; pp. 242–250. ISBN 978-0-419-24450-9. [Google Scholar]
- Thomas, L.; Cousins, W. The Compact City: A Successful, Desirable and Achievable Urban Form? In The Compact City, A Sustainable Urban Form? Jenks, M., Butron, E., Williams, K., Eds.; E & FN Spon: London, UK, 1996; pp. 53–65. [Google Scholar]
- Dembski, S.; Hartmann, T.; Hengstermann, A.; Dunning, R. Enhancing Understanding of Strategies of Land Policy for Urban Densification. Town Plan. Rev. 2020, 91, 209–216. [Google Scholar] [CrossRef]
- Naess, P.; Saglie, I.-L.; Richardson, T. Urban Sustainability: Is Densification Sufficient? Eur. Plan. Stud. 2020, 28, 146–165. [Google Scholar] [CrossRef]
- Westerink, J.; Haase, D.; Bauer, A.; Ravetz, J.; Jarrige, F.; Aalbers, C.B.E.M. Dealing with Sustainability Trade-Offs of the Compact City in Peri-Urban Planning Across European City Regions. Eur. Plan. Stud. 2013, 21, 473–497. [Google Scholar] [CrossRef]
- Shirazi, M.R.; Keivani, R. Critical Reflections on the Theory and Practice of Social Sustainability in the Built Environment—A Meta-Analysis. Local Environ. 2017, 22, 1526–1545. [Google Scholar] [CrossRef] [Green Version]
- Shirazi, M.R.; Keivani, R. Social sustainability discourse: A critical revisit. In Urban Social Sustainability: Theory, Policy and Practice; Shirazi, M.R., Keivani, R., Eds.; Routledge: London, UK; New York, NY, USA, 2019; pp. 1–26. [Google Scholar]
- Polese, M.; Stren, R. (Eds.) The Social Sustainability of Cities: Diversity and the Management of Change; University of Toronto Press: Toronto, ON, Canada, 2000; ISBN 978-0-8020-8320-3. [Google Scholar]
- Yiftachel, O.; Hedgcock, D. Urban Social Sustainability: The Planning of an Australian City. Cities 1993, 10, 139–157. [Google Scholar] [CrossRef]
- Dillard, J.; Dujon, V.; King, M.C. (Eds.) Understanding the Social Dimension of Sustainability; Routledge: New York, NY, USA, 2009; ISBN 978-0-415-96465-4. [Google Scholar]
- McKenzie, S. Social Sustainability: Towards Some Definitions; Hawke Research Institute Working Paper Series 27; Hawke Research Institute: Magill, Australia, 2004. [Google Scholar]
- Koning, J. Social Sustainability in a Globalizing World: Context, theory and methodology explored. In More on MOST: Proceedings of an Expert Meeting; van Rinsum, H., de Ruijter, A., Kazancigil, Y.K., Alagh, N., Genov, N., Koning, J., Siebers, H., Eds.; Unesco Centre: Amsterdam, The Netherlands, 2002; pp. 63–89. [Google Scholar]
- City of Vancouver Social Development; Director of Social Planning: Vancouver, BC, Canada, 2005.
- Harris, J.M.; Goodwin, N.R. Volume Introduction. In A Survey of Sustainable Development: Social and Economic Dimensions; Harris, J.M., Wise, T., Gallagher, K., Goodwin, N.R., Eds.; Island Press: Washington, DC, USA, 2001; pp. xxvii–xxxvi. ISBN 978-1-55963-863-0. [Google Scholar]
- Bacon, N.; Cochrane, D.; Woodcraft, S. Creating Strong Communities. How to Measure the Social Sustainability of New Housing Developments; The Berkeley Group: London, UK, 2012. [Google Scholar]
- Opp, S.M. The Forgotten Pillar: A Definition for the Measurement of Social Sustainability in American Cities. Local Environ. 2016, 22, 286–305. [Google Scholar] [CrossRef]
- Larsen, G.L. An Inquiry Into the Theoretical Basis of Sustainability; The Propositions. In Understanding the Social Dimension of Sustainability; Dillard, J., Dujon, V., King, M.C., Eds.; Routledge: New York, NY, USA, 2009; pp. 45–82. ISBN 978-0-415-96465-4. [Google Scholar]
- Sachs, I. Social Sustainability and Whole Development: Exploring the Dimensions of Sustainable Development. In Sustainability and the Social Sciences; Becker, E., Jahn, T., Eds.; Zed Books: London, UK; New York, NY, USA, 1999; pp. 25–36. [Google Scholar]
- Magis, K.; Shinn, C. Emergent Principles of Social Sustainability. In Understanding the Social Dimension of Sustainability; Dillard, J., Dujon, V., King, M.C., Eds.; Routledge: New York, NY, USA, 2009; pp. 15–44. ISBN 978-0-415-96465-4. [Google Scholar]
- Colantonio, A. Social sustainability: A review and critique of traditional versus emerging themes and assessment methods. In Proceedings of the Second International Conference on Whole Life Urban Sustainability and its Assessment; Malcolm, H., Price, A., Bebbington, J., Rohinton, E., Eds.; Loubhborough University: Loubhborough, UK, 2009; pp. 865–885. [Google Scholar]
- Larimian, T.; Sadeghi, A. Measuring Urban Social Sustainability: Scale Development and Validation. Environ. Plan. B Urban Anal. City Sci. 2019, 2399808319882950. [Google Scholar] [CrossRef] [Green Version]
- Dempsey, N.; Bramley, G.; Power, S.; Brown, C. The Social Dimension of Sustainable Development: Defining Urban Social Sustainability. Sustain. Dev. 2011, 19, 289–300. [Google Scholar] [CrossRef]
- Dempsey, N.; Brown, C.; Bramley, G. The Key to Sustainable Urban Development in UK Cities? The Influence of Density on Social Sustainability. Prog. Plan. 2012, 77, 89–141. [Google Scholar] [CrossRef]
- Karuppannan, S.; Sivam, A. Social Sustainability and Neighbourhood Design: An Investigation of Residents’ Satisfaction in Delhi. Local Environ. 2011, 16, 849–870. [Google Scholar] [CrossRef]
- Cuthill, M. Strengthening the “social” in Sustainable Development: Developing a Conceptual Framework for Social Sustainability in a Rapid Urban Growth Region in Australia. Sustain. Dev. 2010, 18, 362–373. [Google Scholar] [CrossRef]
- Manzi, T.; Lucas, K.; Jones, T.L.; Allen, J. (Eds.) Social Sustainability in Urban Areas: Communities, Connectivity and the Urban Fabric, 1st ed.; Routledge: London, UK; Washington, DC, USA, 2010; ISBN 978-1-84407-674-1. [Google Scholar]
- Bramley, G.; Dempsey, N.; Power, S.; Brown, C.; Watkins, D. Social Sustainability and Urban Form: Evidence from Five British Cities. Environ. Plan. A 2009, 41, 2125–2142. [Google Scholar] [CrossRef]
- Bramley, G.; Power, S. Urban Form and Social Sustainability: The Role of Density and Housing Type. Environ. Plan. B Plan. Des. 2009, 36, 30–48. [Google Scholar] [CrossRef]
- Lang, R. Social sustainability and collaborative housing: Lessons from an international comparative study. In Urban Social Sustainability: Theory, Policy and Practice; Shirazi, M.R., Keivani, R., Eds.; Routledge: London, UK; New York, NY, USA, 2019; pp. 193–215. [Google Scholar]
- Williams, K.; Burton, E.; Jenks, M. Achieving the Compact city through Intensification: An Acceptable Option? In The Compact City: A Sustainable Urban Form? Jenks, M., Butron, E., Williams, K., Eds.; E & FN Spon: London, UK; New York, NY, USA, 1996; pp. 83–96. [Google Scholar]
- Pahl-Weber, E. Production of Urban Densities-Quo Vadis Density? In Time, Space, Places; Henckel, D., Pahl-Weber, E., Herkommer, B., Eds.; Peter Lang: Framkfurt am Main, Germany, 2007; pp. 81–97. [Google Scholar]
- Nasar, J.L.; Julian, D.A. The Psychological Sense of Community in the Neighborhood. J. Am. Plan. Assoc. 1995, 61, 178–184. [Google Scholar] [CrossRef]
- Aquino, F.; Gainza, X. Understanding Density in an Uneven City, Santiago de Chile: Implications for Social and Environmental Sustainability. Sustainability 2014, 6, 5876–5897. [Google Scholar] [CrossRef] [Green Version]
- Bardhan, R.; Kurisu, K.; Hanaki, K. Does Compact Urban Forms Relate to Good Quality of Life in High Density Cities of India? Case of Kolkata. Cities 2015, 48, 55–65. [Google Scholar] [CrossRef]
- Jenks, M. From the Compact City to the Defragmented City, Another route towards a sustainable urban form? In Eco-Urbanity; Radovic, D., Ed.; Routledge: London, UK; New York, NY, USA, 2009; pp. 63–73. [Google Scholar]
- Burgess, R. The Compact City Debate: A Global Perspecive. In Compact Cities, Sustainable Urban Forms for Developing Countries; Jenks, M., Burgess, R., Eds.; Spon Press: London, UK; New York, NY, USA, 2000; pp. 9–24. [Google Scholar]
- Welbank, M. The Search for a Sustainable Urban Form. In The Compact City: A Sustainable Urban Form? Jenks, M., Burton, E., Williams, K., Eds.; E & FN Spon: London, UK; New York, NY, USA, 1996; pp. 74–82. [Google Scholar]
- Kjaeras, K. Towards a Relational Conception of the Compact City. Urban Stud. 2020, 0042098020907281. [Google Scholar] [CrossRef] [Green Version]
- Weingaertner, C.; Moberg, Å. Exploring Social Sustainability: Learning from Perspectives on Urban Development and Companies and Products. Sustain. Dev. 2014, 22, 122–133. [Google Scholar] [CrossRef] [Green Version]
- Boström, M. A Missing Pillar? Challenges in Theorizing and Practicing Social Sustainability: Introduction to the Special Issue. Sustain. Sci. Pract. Policy 2012, 8, 3–14. [Google Scholar] [CrossRef] [Green Version]
- Vallance, S.; Perkins, H.C.; Dixon, J.E. What Is Social Sustainability? A Clarification of Concepts. Geoforum 2011, 42, 342–348. [Google Scholar] [CrossRef]
- Littig, B.; Griessler, E. Social Sustainability: A Catchword between Political Pragmatism and Social Theory. Int. J. Sustain. Dev. 2005, 8, 65–79. [Google Scholar] [CrossRef] [Green Version]
- Hamiduddin, I.; Adelfio, M. Social sustainability and newneighbourhoods: Case studies from Spain and Germany. In Urban Social Sustainability: Theory, Policy and Practice; Shirazi, M.R., Keivani, R., Eds.; Routledge: London, UK; New York, NY, USA, 2019; pp. 171–192. [Google Scholar]
- Landorf, C. Social sustainability and newneighbourhoods: Case studies from Spain and Germany. In Urban Social Sustainability: Theory, Policy and Practice; Shirazi, M.R., Keivani, R., Eds.; Routledge: London, UK; New York, NY, USA, 2019; pp. 78–98. [Google Scholar]
- Lang, W.; Chen, T.; Chan, E.H.W.; Yung, E.H.K.; Lee, T.C.F. Understanding Livable Dense Urban Form for Shaping the Landscape of Community Facilities in Hong Kong Using Fine-Scale Measurements. Cities 2019, 84, 34–45. [Google Scholar] [CrossRef]
- Colantonio, A.; Dixon, T. Urban Regeneration and Social Sustainability: Best Practice from European Cities; Wiley-Blackwell: Chichester, UK; Hoboken, NJ, USA, 2011; ISBN 978-1-4051-9419-8. [Google Scholar]
- Chan, E.; Lee, G.K.L. Critical Factors for Improving Social Sustainability of Urban Renewal Projects. Soc. Indic. Res. 2007, 85, 243–256. [Google Scholar] [CrossRef]
- Chiu, R.L.H. Social sustainability, sustainable development and housing development. In Housing and Social Change, East-West Perspectives; Forrest, R., Lee, J., Eds.; Routledge: London, UK; New York, NY, USA, 2003; pp. 221–239. [Google Scholar]
- Urban Social Sustainability: Theory, Policy and Practice; Shirazi, M.R.; Keivani, R. (Eds.) Routledge: London, UK; New York, NY, USA, 2019; ISBN 978-1-138-06938-1. [Google Scholar]
- Chiu, R.L.H. Socio-cultural Sustainability of Housing: A Conceptual Exploration. Hous. Theory Soc. 2004, 21, 65–76. [Google Scholar] [CrossRef]
- Shirazi, M.R.; Keivani, R. The Triad of Social Sustainability: Defining and Measuring Social Sustainability of Urban Neighbourhoods. Urban Res. Pract. 2019, 12, 448–471. [Google Scholar] [CrossRef]
- Shirazi, M.R.; Keivani, R.; Brownill, S.; Watson, G.B. Promoting Social Sustainability of Urban Neighbourhoods: The Case of Bethnal Green, London. Int. J. Urban Reg. Res. 2020. [Google Scholar] [CrossRef]
- Grosvenor, M.; O Neill, P. The Density Debate in Urban Research: An Alternative Approach to Representing Urban Structure and Form: The Density Debate in Urban Research. Geogr. Res. 2014, 52, 442–458. [Google Scholar] [CrossRef]
- Foord, J. Mixed-Use Trade-Offs: How to Live and Work in a “Compact City” Neighbourhood. Built Environ. 2010, 36, 28–46. [Google Scholar] [CrossRef]
- Rodenburg, C.A.; Nijkamp, P. Multifunctional Land Use in the City: A Typological Overview. Built Environ. 2004, 30, 274–288. [Google Scholar] [CrossRef]
- Hillier, B. A Theory of the City as Object: Or, How Spatial Laws Mediate the Social Construction of Urban Space. Urban Des. Int. 2002, 7, 153–179. [Google Scholar] [CrossRef] [Green Version]
- Hillier, B. Space is the Machine: A Configurational Theory of Architecture; Cambridge University Press: Cambridge, UK, 1996. [Google Scholar]
- Scheer, B.C. The Evolution of Urban Form: Typology for Planners and Architects; APA Planners Press: Washington, DC, USA, 2010; ISBN 978-1-932364-87-3. [Google Scholar]
- Skjaeveland, O.; Gärling, T.; Maeland, J.G. A Multidimensional Measure of Neighboring. Am. J. Community Psychol. 1996, 24, 413–435. [Google Scholar] [CrossRef]
- Greider, T.; Krannich, R.S. Neighboring Patterns, Social Support, and Rapid Growth: A Comparison Analysis from Three Western Communities. Sociol. Perspect. 1985, 28, 51–70. [Google Scholar] [CrossRef]
- Barton, H.; Grant, M.; Guise, R. Shaping Neighbourhoods for Local Health and Global Sustainability; Routledge: London, UK; New York, NY, USA, 2010. [Google Scholar]
- Talen, E. Neighborhoods as Service Providers: A Methodology for Evaluating Pedestrian Access. Environ. Plan. B Plan. Des. 2003, 30, 181–200. [Google Scholar] [CrossRef]
- Barton, H. Do Neighbourhoods Matter? In Sustainable Communities, The Potential for Eco-Neighbourhoods; Barton, H., Ed.; Earthscan: London, UK, 2000; pp. 49–65. [Google Scholar]
- Argyle, M. Social Interaction; Transaction Publishers: Piscataway, NJ, USA, 2007. [Google Scholar]
- Kavanaugh, A.L.; Reese, D.D.; Carroll, J.M.; Rosson, M.B. Weak Ties in Networked Communities. Inf. Soc. 2005, 21, 119–131. [Google Scholar] [CrossRef]
- Brounen, D.; Cox, R.; Neuteboom, P. Safe and Satisfied? External Effects of Homeownership in Rotterdam. Urban Stud. 2012, 49, 2669–2691. [Google Scholar] [CrossRef]
- Foster, S.; Giles-Corti, B.; Knuiman, M. Neighbourhood Design and Fear of Crime: A Social-Ecological Examination of the Correlates of Residents’ Fear in New Suburban Housing Developments. Health Place 2010, 16, 1156–1165. [Google Scholar] [CrossRef]
- Carver, A.; Timperio, A.; Crawford, D. Playing It Safe: The Influence of Neighbourhood Safety on Children’s Physical activity—A Review. Health Place 2008, 14, 217–227. [Google Scholar] [CrossRef]
- Raco, M. Securing Sustainable Communities Citizenship, Safety and Sustainability in the New Urban Planning. Eur. Urban Reg. Stud. 2007, 14, 305–320. [Google Scholar] [CrossRef]
- Bennett, G.G.; McNeill, L.H.; Wolin, K.Y.; Duncan, D.T.; Puleo, E.; Emmons, K.M. Safe To Walk? Neighborhood Safety and Physical Activity Among Public Housing Residents. PLoS Med. 2007, 4, e306. [Google Scholar] [CrossRef] [PubMed] [Green Version]
- Comstock, N.; Miriam Dickinson, L.; Marshall, J.A.; Soobader, M.-J.; Turbin, M.S.; Buchenau, M.; Litt, J.S. Neighborhood Attachment and Its Correlates: Exploring Neighborhood Conditions, Collective Efficacy, and Gardening. J. Environ. Psychol. 2010, 30, 435–442. [Google Scholar] [CrossRef]
- Rogers, G.O.; Sukolratanametee, S. Neighborhood Design and Sense of Community: Comparing Suburban Neighborhoods in Houston Texas. Landsc. Urban Plan. 2009, 92, 325–334. [Google Scholar] [CrossRef]
- Teernstra, A.B.; Pinkster, F.M. Participation in Neighbourhood Regeneration: Achievements of Residents in a Dutch Disadvantaged Neighbourhood. Urban Res. Pract. 2016, 9, 56–79. [Google Scholar] [CrossRef]
- Michels, A.; De Graaf, L. Examining Citizen Participation: Local Participatory Policy Making and Democracy. Local Gov. Stud. 2010, 36, 477–491. [Google Scholar] [CrossRef]
- Lee, S.M.; Conway, T.L.; Frank, L.D.; Saelens, B.E.; Cain, K.L.; Sallis, J.F. The Relation of Perceived and Objective Environment Attributes to Neighborhood Satisfaction. Environ. Behav. 2016, 49, 136–160. [Google Scholar] [CrossRef]
- Lovejoy, K.; Handy, S.; Mokhtarian, P. Neighborhood Satisfaction in Suburban versus Traditional Environments: An Evaluation of Contributing Characteristics in Eight California Neighborhoods. Landsc. Urban Plan. 2010, 97, 37–48. [Google Scholar] [CrossRef]
- Oktay, D.; Rüstemli, A.; Marans, R.W. Neighborhood Satisfaction, Sense of Community, and Attachment: Initial Findings from Famagusta Quality of Urban Life Study. AIZ ITU J. Fac. Archit. 2009, 6, 6–20. [Google Scholar]
- Walton, D.; Murray, S.J.; Thomas, J.A. Relationships Between Population Density and the Perceived Quality of Neighbourhood. Soc. Indic. Res. 2008, 89, 405–420. [Google Scholar] [CrossRef]
- Byun, G.; Ha, M. The Factors Influencing Residential Satisfaction by Public Rental Housing Type. J. Asian Archit. Build. Eng. 2016, 15, 535–542. [Google Scholar] [CrossRef]
- Barreira, A.P.; Agapito, D.; Panagopoulos, T.; Guimarães, M.H. Exploring Residential Satisfaction in Shrinking Cities: A Decision-Tree Approach. Urban Res. Pract. 2016, 1–22. [Google Scholar] [CrossRef]
- Galster, G.C.; Friedrichs, J. The Dialectic of Neighborhood Social Mix: Editors’ Introduction to the Special Issue. Hous. Stud. 2015, 30, 175–191. [Google Scholar] [CrossRef]
- Allred, S.B.; Ross-Davis, A. The Drop-off and Pick-up Method: An Approach to Reduce Nonresponse Bias in Natural Resource Surveys. Small-Scale For. 2011, 10, 305–318. [Google Scholar] [CrossRef]
- Clark, W.A.; Finley, J.C. Contracting Meter Readers in a Drop-Off/Pick-Up Survey in Blagoevgrad, Bulgaria. Soc. Nat. Resour. 2007, 20, 669–673. [Google Scholar] [CrossRef]
- Somekh, B.; Lewin, C. (Eds.) Research Methods in the Social Sciences; SAGE Publications Ltd: London, UK; Thousand Oaks, CA, USA, 2005; ISBN 978-0-7619-4401-0. [Google Scholar]
- Park, Y.; Rogers, G.O. Neighborhood Planning Theory, Guidelines, and Research Can Area, Population, and Boundary Guide Conceptual Framing? J. Plan. Lit. 2015, 30, 18–36. [Google Scholar] [CrossRef]
- Coulton, C. Defining Neighborhoods for Research and Policy. Cityscape 2012, 14, 231–236. [Google Scholar]
- Foster, K.A.; Hipp, J.A. Defining Neighborhood Boundaries for Social Measurement: Advancing. Soc. Work Res. 2011, 35, 25. [Google Scholar] [CrossRef]
- Pebley, A.R.; Sastry, N. Our Place: Perceived Neighborhood Size and Names in Los Angeles; California Center for Population Research: Los Angeles, CA, USA, 2009; pp. 1–39. [Google Scholar]
- Guest, A.M.; Lee, B.A. How Urbanites Define Their Neighborhoods. Popul. Environ. 1984, 7, 32–56. [Google Scholar] [CrossRef]
- Lee, T. Urban Neighbourhood as a Socio-Spatial Schema. Hum. Relat. 1968, 21, 241–267. [Google Scholar] [CrossRef]
- Coulton, C.J.; Jennings, M.Z.; Chan, T. How Big is My Neighborhood? Individual and Contextual Effects on Perceptions of Neighborhood Scale. Am. J. Community Psychol. 2013, 51, 140–150. [Google Scholar] [CrossRef]
- Coulton, C.; Chan, T.; Mikelbank, K. Finding Place in Community Change Initiatives: Using GIS to Uncover Resident Perceptions of Their Neighborhoods. J. Community Pract. 2011, 19, 10–28. [Google Scholar] [CrossRef]
- Campbell, E.; Henly, J.R.; Elliott, D.S.; Irwin, K. Subjective Constructions of Neighborhood Boundaries: Lessons from a Qualitative Study of Four Neighborhoods. J. Urban Aff. 2009, 31, 461–490. [Google Scholar] [CrossRef]
- Lohmann, A.; McMurran, G. Resident-Defined Neighborhood Mapping: Using GIS to Analyze Phenomenological Neighborhoods. J. Prev. Interv. Community 2009, 37, 66–81. [Google Scholar] [CrossRef]
- Minnery, J.; Knight, J.; Byrne, J.; Spencer, J. Bounding Neighbourhoods: How Do Residents Do It? Plan. Pract. Res. 2009, 24, 471–493. [Google Scholar] [CrossRef]
- Jenks, M.; Dempsey, N. Defining the Neighbourhood: Challenges for Empirical Research. Town Plan. Rev. 2007, 78, 153–177. [Google Scholar] [CrossRef]
- Clapp, J.M.; Wang, Y. Defining Neighborhood Boundaries: Are Census Tracts Obsolete? J. Urban Econ. 2006, 59, 259–284. [Google Scholar] [CrossRef]
- Coulton, C.J.; Korbin, J.; Chan, T.; Su, M. Mapping Residents’ Perceptions of Neighborhood Boundaries: A Methodological Note. Am. J. Community Psychol. 2001, 29, 371–383. [Google Scholar] [CrossRef] [PubMed]
- Talen, E. Constructing Neighborhoods from the Bottom up: The Case for Resident-Generated GIS. Environ. Plan. B Plan. Des. 1999, 26, 533–554. [Google Scholar] [CrossRef]
- Haney, W.G.; Knowles, E.S. Perception of Neighborhoods by City and Suburban Residents. Hum. Ecol. 1978, 6, 201–214. [Google Scholar] [CrossRef]
- Pasha, M.; Rifaat, S.; Tay, R.; de Barros, A. Urban Design and Planning Influences on the Share of Trips Taken by Cycling. J. Urban Des. 2016, 21, 471–480. [Google Scholar] [CrossRef]
- Wheeler, S.M. Planning for Sustainability: Creating Livable, Equitable and Ecological Communities; Routledge: London, UK; New York, NY, USA, 2013; ISBN 978-0-415-80989-4. [Google Scholar]
- Wegman, F.; Zhang, F.; Dijkstra, A. How to Make More Cycling Good for Road Safety? Accid. Anal. Prev. 2012, 44, 19–29. [Google Scholar] [CrossRef] [PubMed]
- Wood, L.; Frank, L.D.; Giles-Corti, B. Sense of Community and Its Relationship with Walking and Neighborhood Design. Soc. Sci. Med. 2010, 70, 1381–1390. [Google Scholar] [CrossRef] [PubMed]
- Calthorpe, P.; Fulton, W. The Regional City, 4th ed.; Island Press: Washington, DC, USA, 2000; ISBN 978-1-55963-784-8. [Google Scholar]
- Browning, C.R.; Byron, R.A.; Calder, C.A.; Krivo, L.J.; Kwan, M.-P.; Lee, J.-Y.; Peterson, R.D. Commercial Density, Residential Concentration, and Crime: Land Use Patterns and Violence in Neighborhood Context. J. Res. Crime Delinq. 2010, 47, 329–357. [Google Scholar] [CrossRef]
- Harries, K. Property Crimes and Violence in United States: An Analysis of the Influence of Population Density. Int. J. Crim. Justice Sci. 2004, 1, 24–34. [Google Scholar]
- Lewicka, M. Place Attachment: How Far Have We Come in the Last 40 Years? J. Environ. Psychol. 2011, 31, 207–230. [Google Scholar] [CrossRef]
- Livingston, M.; Bailey, N.; Kearns, A. Neighbourhood Attachment in Deprived Areas: Evidence from the North of England. J. Hous. Built Environ. 2010, 25, 409–427. [Google Scholar] [CrossRef]
- Dekker, K. Social Capital, Neighbourhood Attachment and Participation in Distressed Urban Areas. A Case Study in The Hague and Utrecht, the Netherlands. Hous. Stud. 2007, 22, 355–379. [Google Scholar] [CrossRef] [Green Version]
- Hur, M.; Morrow-Jones, H. Factors That Influence Residents’ Satisfaction With Neighborhoods. Environ. Behav. 2008, 40, 619–635. [Google Scholar] [CrossRef]
- Kearney, A.R. Residential Development Patterns and Neighborhood Satisfaction: Impacts of Density and Nearby Nature. Environ. Behav. 2006, 38, 112–139. [Google Scholar] [CrossRef]
- Shirazi, M.; Falahat, S. Compact Urban Form, Question or Solution? Examining the Compact City in the Middle Eastern Context: Challenges and Opportunities. Int. J. Urban Sustain. Dev. 2012, 4, 246–259. [Google Scholar] [CrossRef]
- Cheng, V. Understanding Density and High Density. In Designing High-density Cities for Social and Environmental Sustainability; Ng, E., Ed.; Earthscan: London, UK, 2009; pp. 3–17. ISBN 978-1-84977-444-4. [Google Scholar]
- Jenks, M.; Dempsey, N. (Eds.) The Language and Meaning of Density. In Future Forms and Design For Sustainable Cities; Routledge: Amsterdam, The Netherlands; Boston, MA, USA, 2005; pp. 287–309. ISBN 978-0-7506-6309-0. [Google Scholar]
- Galster, G. A Stock/Flow Model Of Defining Racially Integrated Neighborhoods. J. Urban Aff. 1998, 20, 43–51. [Google Scholar] [CrossRef]
- Burton, E. The Potential of the Compact City for Promoting Social Equity. In Achieving Sustainable Urban Form; Williams, K., Burton, E., Jenks, M., Eds.; Routledge: London, UK; New York, NY, USA, 2000; pp. 19–29. ISBN 978-0-419-24450-9. [Google Scholar]
- Blokland, T. Urban Bonds; Wiley: Hoboken, NJ, USA, 2003; ISBN 978-0-7456-2802-8. [Google Scholar]
- Putnam, R.D. Bowling Alone: The Collapse and Revival of American Community; Simon & Schuster: New York, NY, USA; London, UK, 2000; ISBN 978-0-7432-0304-3. [Google Scholar]
- Guest, A.M.; Wierzbicki, S.K. Social Ties at the Neighborhood Level Two Decades of GSS Evidence. Urban Aff. Rev. 1999, 35, 92–111. [Google Scholar] [CrossRef]
- Henning, C.; Lieberg, M. Strong Ties or Weak Ties? Neighbourhood Networks in a New Perspective. Scand. Hous. Plan. Res. 1996, 13, 3–26. [Google Scholar] [CrossRef]
- Samad, Y. Community Cohesion without Parallel Lives in Bradford. Patterns Prejud. 2013, 47, 269–287. [Google Scholar] [CrossRef] [Green Version]
- Camina, M.M.; Wood, M.J. Parallel Lives: Towards a Greater Understanding of What Mixed Communities Can Offer. Urban Stud. 2009, 46, 459–480. [Google Scholar] [CrossRef]
- Robinson, D. Living Parallel Lives? Housing, Residential Segregation and Community Cohesion in England. In Neighbourhood Renewal & Housing Markets; Beider, H., Ed.; Blackwell Publishing Ltd.: Oxford, UK, 2007; pp. 163–185. ISBN 978-0-470-75787-1. [Google Scholar]
- Fung, A. Putting the Public Back into Governance: The Challenges of Citizen Participation and Its Future. Public Admin. Rev. 2015, 75, 513–522. [Google Scholar] [CrossRef]
- Sorensen, A.; Sagaris, L. From Participation to the Right to the City: Democratic Place Management at the Neighbourhood Scale in Comparative Perspective. Plan. Pract. Res. 2010, 25, 297–316. [Google Scholar] [CrossRef]
- Lane, M.B. Public Participation in Planning: An Intellectual History. Aust. Geogr. 2005, 36, 283–299. [Google Scholar] [CrossRef]
- Irvin, R.A.; Stansbury, J. Citizen Participation in Decision Making: Is It Worth the Effort? Public Adm. Rev. 2004, 64, 55–65. [Google Scholar] [CrossRef]
Figure 1.
Triad of social sustainability (authors).

Figure 2.
Case study neighbourhoods (authors).

Figure 3.
Mixed land use plan (authors). Plots in dark colour are mixed use.


Table 1.
Value and ranking of indicators in case study neighbourhoods.
| Neighbourhoods | Rank (Highest = 1) | 1 | 2 | 3 | 4 | 5 | 6 | 7 |
|---|---|---|---|---|---|---|---|---|
| Kilburn | Indicator | Access to facilities | Quality of Home Perception | Safety and Security | Sense of Attachment | Quality of Neighbourhood Perception | Interaction and Networking | Participation in Neighbourhood |
| Value | 182.80 | 138.95 | 135.97 | 121.95 | 113.64 | 99.75 | 61.30 | |
| Bethnal Green | Indicator | Access to facilities | Safety and Security | Sense of Attachment | Quality of Home Perception | Quality of Neighbourhood Perception | Interaction and Networking | Participation in Neighbourhood |
| Value | 178.75 | 132.77 | 128.25 | 126.30 | 105.10 | 98.60 | 69.13 | |
| Klausenerplatz | Indicator | Access to facilities | Safety and Security | Sense of Attachment | Quality of Home Perception | Quality of Neighbourhood Perception | Interaction and Networking | Participation in Neighbourhood |
| Value | 174.89 | 149.09 | 143.53 | 137.22 | 133.84 | 105.16 | 55.08 | |
| Samariterkiez | Indicator | Access to facilities | Safety and Security | Quality of Home Perception | Sense of Attachment | Quality of Neighbourhood Perception | Interaction and Networking | Participation in Neighbourhood |
| Value | 184.19 | 143.78 | 137.87 | 131.81 | 113.32 | 95.11 | 44.69 |
Table 2.
Weighting of indicators by participants in case study neighbourhoods.
| Neighbourhoods | Rank (Highest = 1) | 1 | 2 | 3 | 4 | 5 | 6 | 7 |
|---|---|---|---|---|---|---|---|---|
| Kilburn | Indicator | Quality of Home Perception | Access to facilities | Safety and Security | Quality of Neighbourhood Perception | Sense of Attachment | Interaction and Networking | Participation in Neighbourhood |
| Value | 4.30 | 4.24 | 4.13 | 3.96 | 3.50 | 3.18 | 2.54 | |
| Bethnal Green | Indicator | Quality of Home Perception | Safety and Security | Access to facilities | Quality of Neighbourhood Perception | Sense of Attachment | Interaction and Networking | Participation in Neighbourhood |
| Value | 4.29 | 4.18 | 4.09 | 4.05 | 3.66 | 3.34 | 2.81 | |
| Klausenerplatz | Indicator | Quality of Home Perception | Safety and Security | Quality of Neighbourhood Perception | Access to facilities | Sense of Attachment | Interaction and Networking | Participation in Neighbourhood |
| Value | 4.30 | 4.11 | 4.09 | 3.98 | 3.40 | 3.01 | 2.50 | |
| Samariterkiez | Indicator | Quality of Home Perception | Access to facilities | Safety and Security | Quality of Neighbourhood Perception | Interaction and Networking | Sense of Attachment | Participation in Neighbourhood |
| Value | 4.24 | 4.08 | 3.98 | 3.86 | 3.36 | 3.31 | 2.52 |
Table 3.
Modes of transportation for accessing urban services.
| Neighbourhood | Walking (%) | Biking (%) | Public Transport (%) | Private Car (%) | |
|---|---|---|---|---|---|
| Accessibility of urban services | Kilburn | 84.8 | 1.8 | 8.2 | 4.8 |
| Bethnal Green | 82.6 | 3.1 | 7.8 | 6.3 | |
| Klausenerplatz | 61.0 | 19.6 | 13.1 | 6.1 | |
| Samariterkiez | 63.1 | 22.8 | 10.6 | 3.3 |
Table 4.
Overall home satisfaction.
| Neighbourhood | Very Dissatisfied | Dissatisfied | Neither Dissatisfied Nor Satisfied | Satisfied | Very Satisfied | |
|---|---|---|---|---|---|---|
| Overall home satisfaction (%) | Kilburn | 1.7 | 6.7 | 6.7 | 61.7 | 22.3 |
| Bethnal Green | 2.1 | 7.4 | 13.8 | 59.6 | 17.0 | |
| Klausenerplatz | 1.7 | 2.8 | 7.3 | 52.2 | 35.4 | |
| Samariterkiez | 0 | 4.2 | 13.9 | 56.3 | 25.7 |
Table 5.
Overall neighbourhood satisfaction.
| Neighbourhood | Very Dissatisfied | Dissatisfied | Neither Dissatisfied Nor Satisfied | Satisfied | Very Satisfied | |
|---|---|---|---|---|---|---|
| Overall neighbourhood satisfaction (%) | Kilburn | 0.0 | 10.0 | 21.7 | 58.3 | 10.0 |
| Bethnal Green | 0.0 | 12.6 | 20.0 | 55.8 | 11.6 | |
| Klausenerplatz | 0.6 | 1.1 | 6.2 | 62.9 | 28.7 | |
| Samariterkiez | 0.7 | 6.2 | 18.5 | 61.0 | 13.7 |
Table 6.
Population density in case study neighbourhoods.
| Neighbourhood | Kilburn | Bethnal Green | Klausenerplatz | Samariterkiez |
|---|---|---|---|---|
| Population density (number of residents per hectare) | 200.6 | 190.8 | 247.6 | 279.8 |
| Net residential density (number of residents per hectare of residential land use) | 296.6 | 385.24 | 433.0 | 471.2 |
Table 7.
Aspects of social interaction and networking.
| Neighbourhood | Kilburn | Bethnal Green | Klausenerplatz | Samariterkiez |
|---|---|---|---|---|
| Number of neighbours known by name | 3.11 | 5.29 | 11.61 | 7.68 |
| Average number of friends in the neighbourhood | 4.42 | 7.34 | 4.31 | 4.24 |
| 1–5 friends in the neighbourhood (%) | 50.9 | 41.2 | 57.1 | 54.1 |
| No friend in the neighbourhood (%) | 24.6 | 21.0 | 21.5 | 21.5 |
| Everyday meeting and chatting with neighbours (%) | 25.9 | 24.5 | 14.6 | 12.7 |
| No visiting neighbours at home or other places (%) | 39.7 | 42.4 | 35.8 | 41.7 |
| Very often help exchange with neighbours (%) | 15.3 | 8.4 | 25.4 | 15.3 |
Table 8.
Neighbourhood participation.
| Neighbourhood | Kilburn | Bethnal Green | Klausenerplatz | Samariterkiez |
|---|---|---|---|---|
| Number of community-based organisation known to participants | 3.32 | 3.10 | 2.00 | 3.12 |
| Participants do not know any community-based organisation (%) | 55.3 | 24.1 | 51.7 | 33.7 |
| Not member of any community-based organisation (%) | 84.7 | 77.1 | 86.3 | 83.8 |
| Never active in religious activities (%) | 60 | 49 | 65.7 | 81 |
| Rating involvement in neighbourhood activities as very low (%) | 40.7 | 38.3 | 31.5 | 38 |
| Rating respond to invitations for involvement in neighbourhood-related issues as very low (%) | 32.2 | 39.6 | 45.5 | 43.7 |
Publisher’s Note: MDPI stays neutral with regard to jurisdictional claims in published maps and institutional affiliations. |
© 2021 by the authors. Licensee MDPI, Basel, Switzerland. This article is an open access article distributed under the terms and conditions of the Creative Commons Attribution (CC BY) license (http://creativecommons.org/licenses/by/4.0/).
Share and Cite
MDPI and ACS Style
Shirazi, M.R.; Keivani, R. Social Sustainability of Compact Neighbourhoods Evidence from London and Berlin. Sustainability 2021, 13, 2340. https://0-doi-org.brum.beds.ac.uk/10.3390/su13042340
AMA Style
Shirazi MR, Keivani R. Social Sustainability of Compact Neighbourhoods Evidence from London and Berlin. Sustainability. 2021; 13(4):2340. https://0-doi-org.brum.beds.ac.uk/10.3390/su13042340
Chicago/Turabian StyleShirazi, M. Reza, and Ramin Keivani. 2021. "Social Sustainability of Compact Neighbourhoods Evidence from London and Berlin" Sustainability 13, no. 4: 2340. https://0-doi-org.brum.beds.ac.uk/10.3390/su13042340
Note that from the first issue of 2016, this journal uses article numbers instead of page numbers. See further details here.